Meta Diagram based Active Social Networks Alignment
Yuxiang Ren, Charu C. Aggarwal, Jiawei Zhang

TL;DR
This paper introduces ActiveIter, a novel model for aligning online social networks by leveraging meta diagrams, active learning, and greedy link selection to address data scarcity, heterogeneity, and one-to-one constraints, demonstrating superior performance.
Contribution
The paper proposes ActiveIter, a new network alignment model that effectively handles heterogeneity, limited training data, and one-to-one constraints in social network alignment.
Findings
ActiveIter outperforms baseline methods in real-world datasets.
Meta diagrams improve feature extraction for heterogeneous networks.
ActiveIter effectively reduces manual labeling effort.
Abstract
Network alignment aims at inferring a set of anchor links matching the shared entities between different information networks, which has become a prerequisite step for effective fusion of multiple information networks. In this paper, we will study the network alignment problem to fuse online social networks specifically. Social network alignment is extremely challenging to address due to several reasons, i.e., lack of training data, network heterogeneity and one-to-one constraint. Existing network alignment works usually require a large number of training data, but such a demand can hardly be met in applications, as manual anchor link labeling is extremely expensive. Significantly different from other homogeneous network alignment works, information in online social networks is usually of heterogeneous categories, the incorporation of which in model building is not an easy task.…
Click any figure to enlarge with its caption.
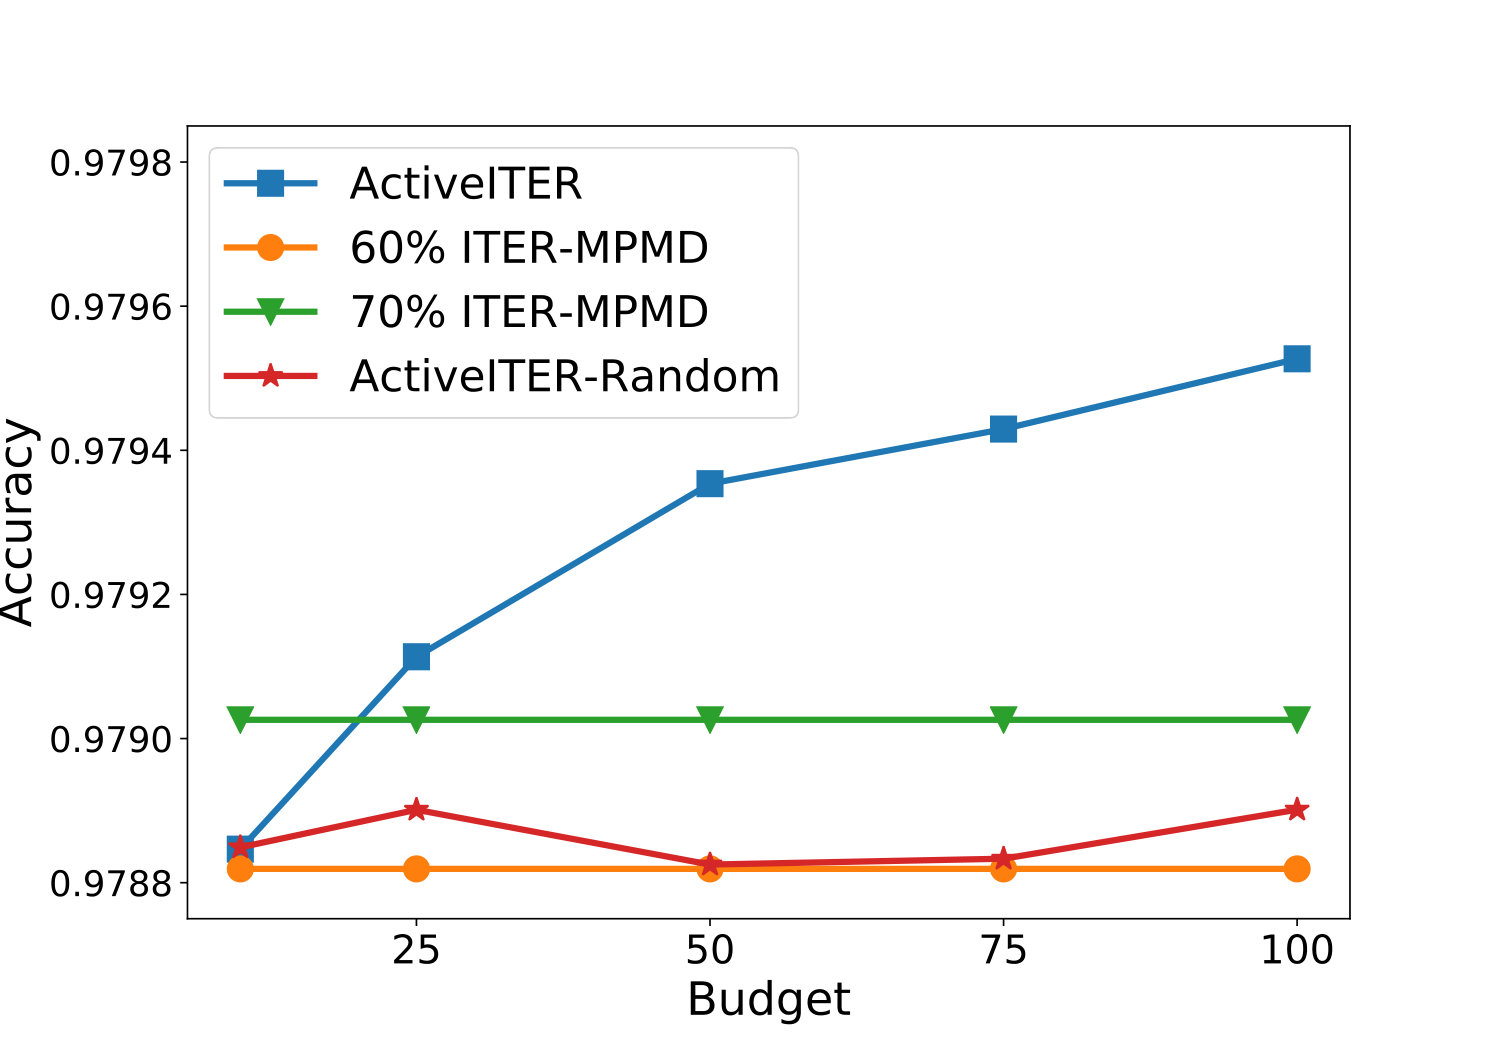 Figure 1
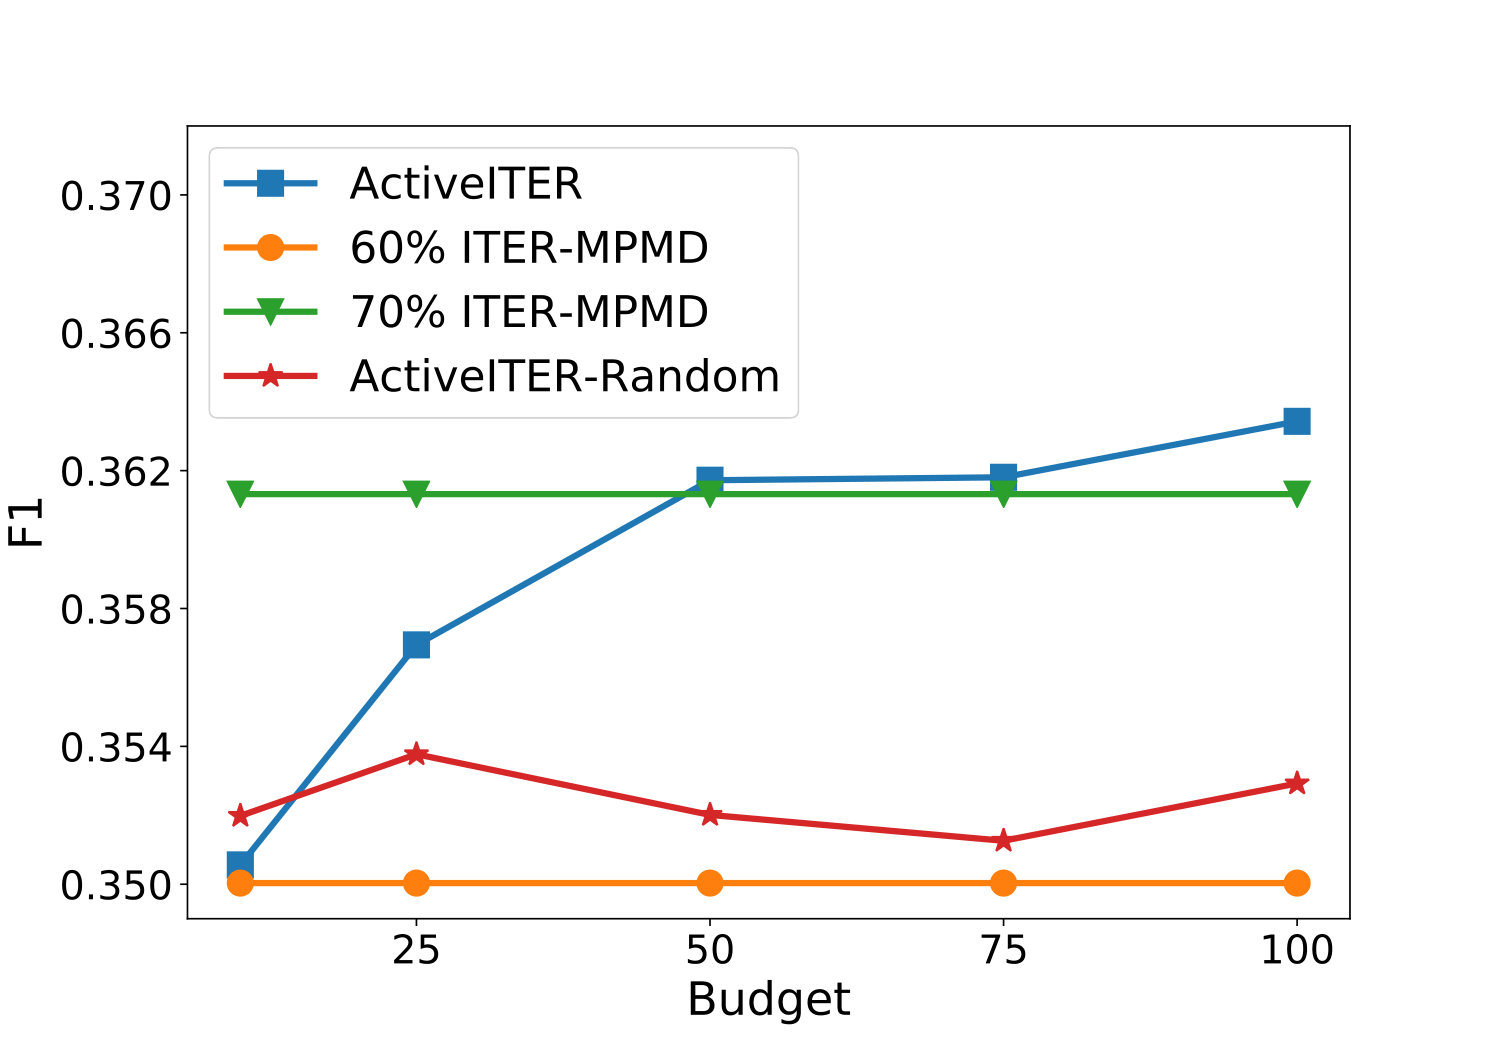 Figure 2
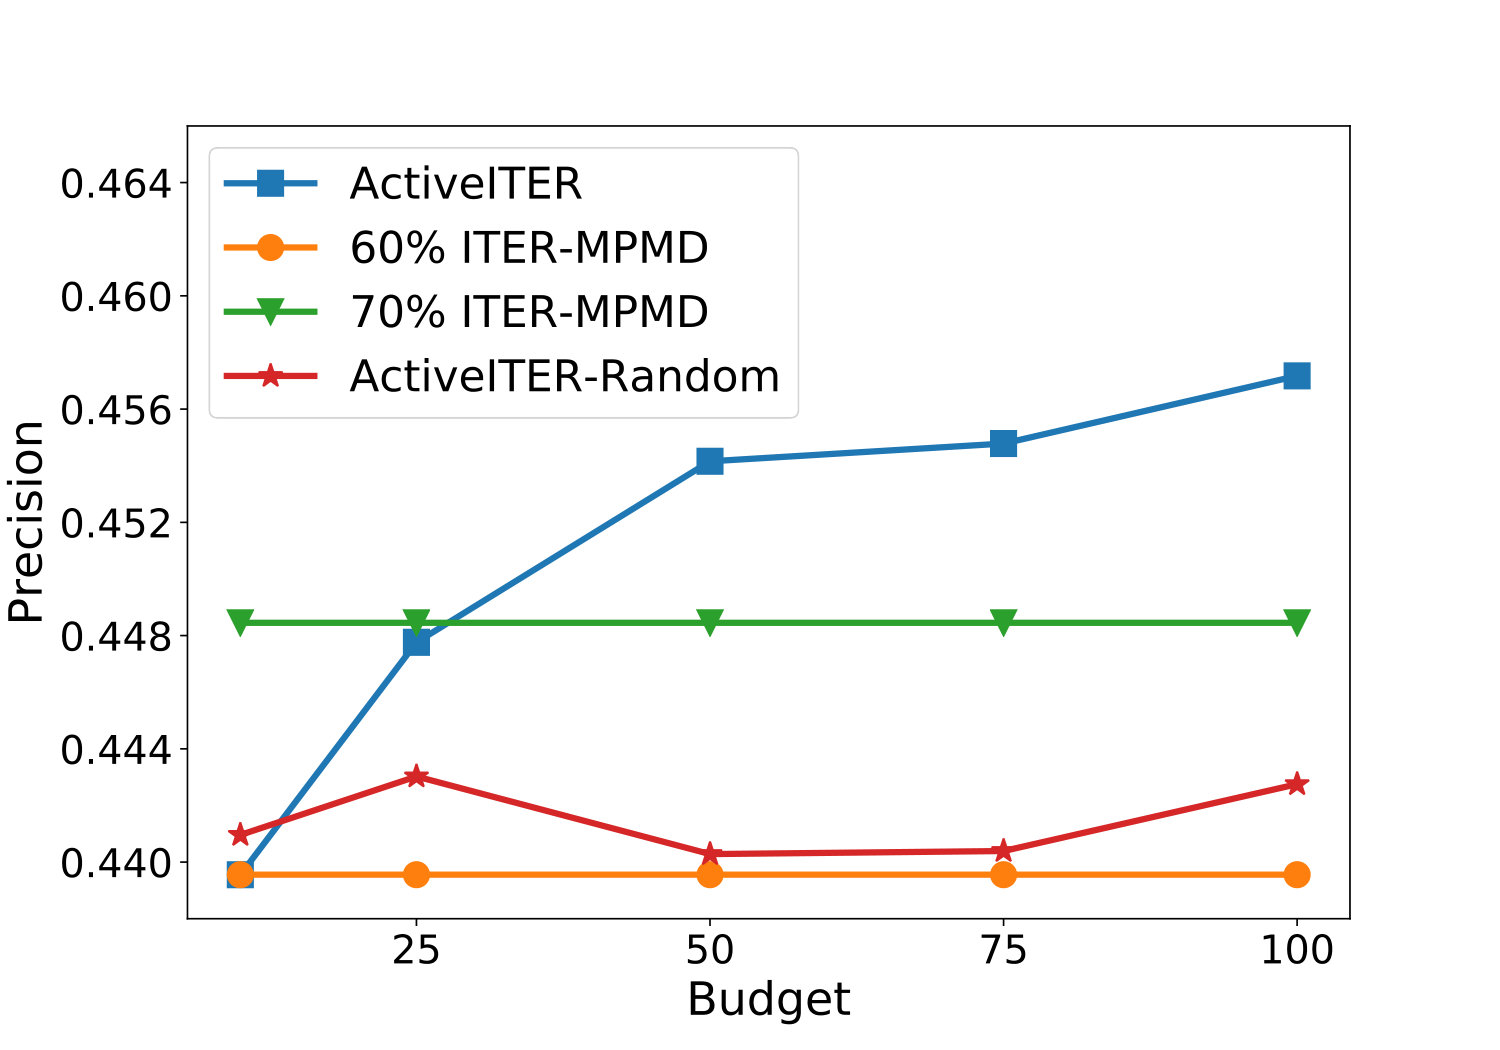 Figure 3
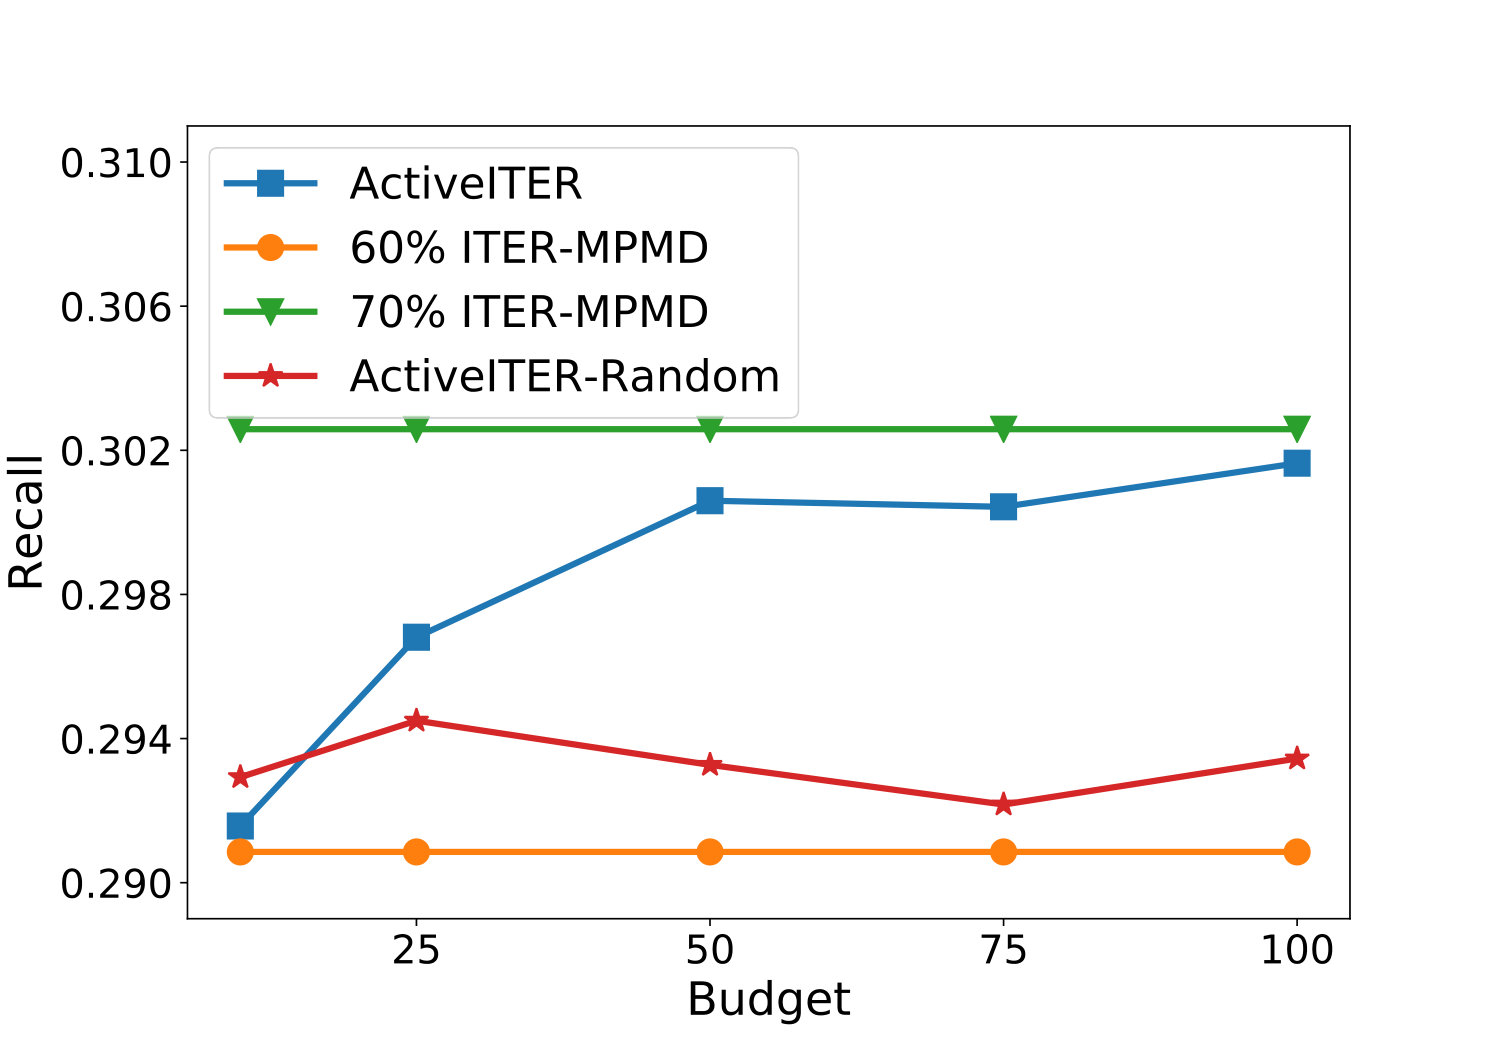 Figure 4
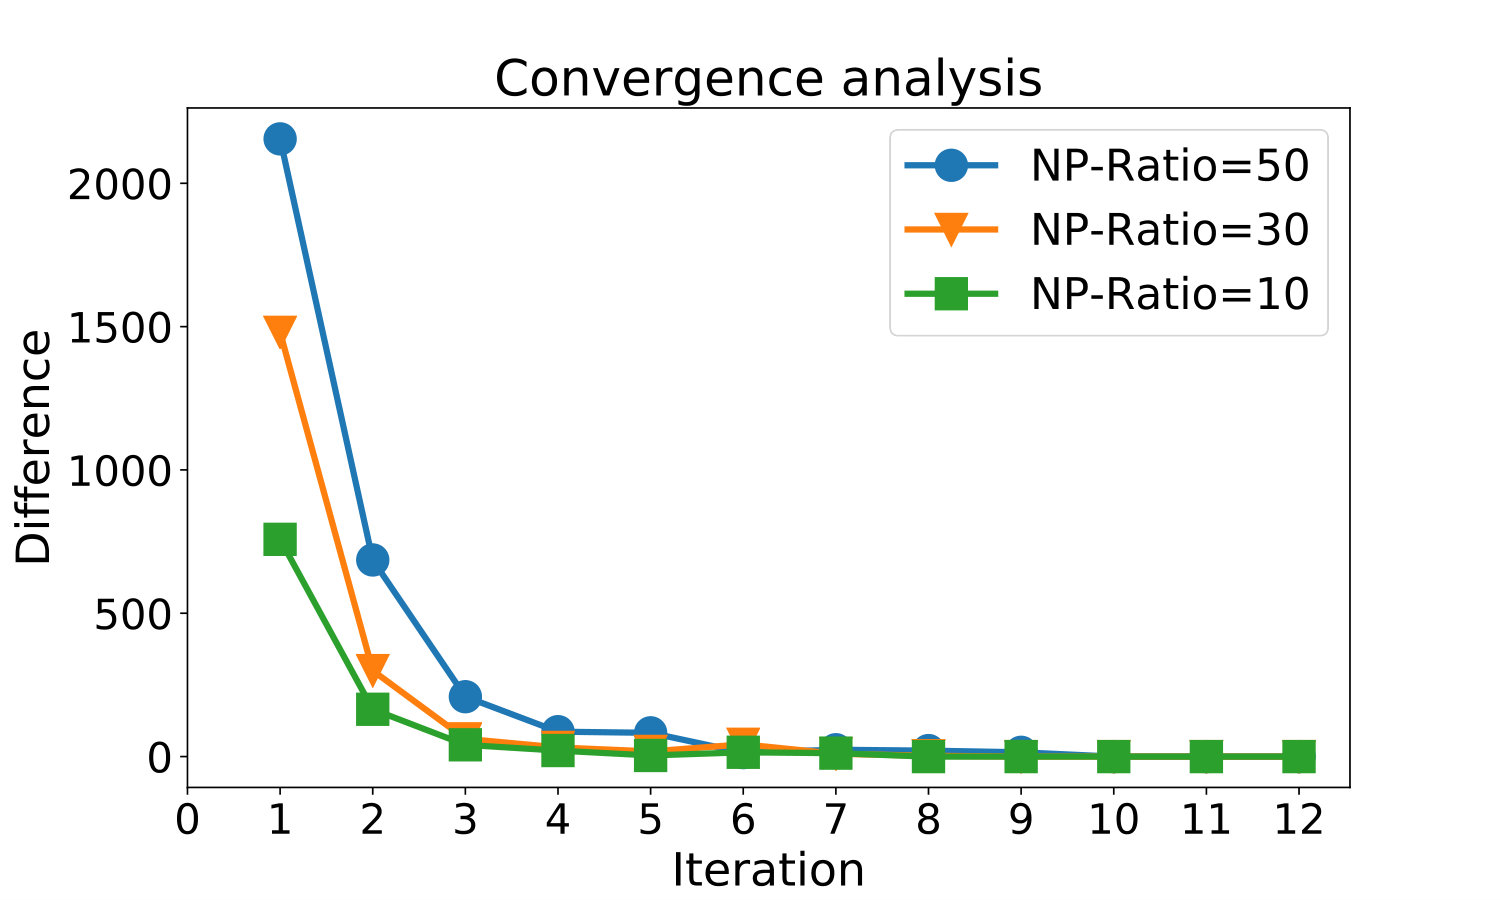 Figure 5
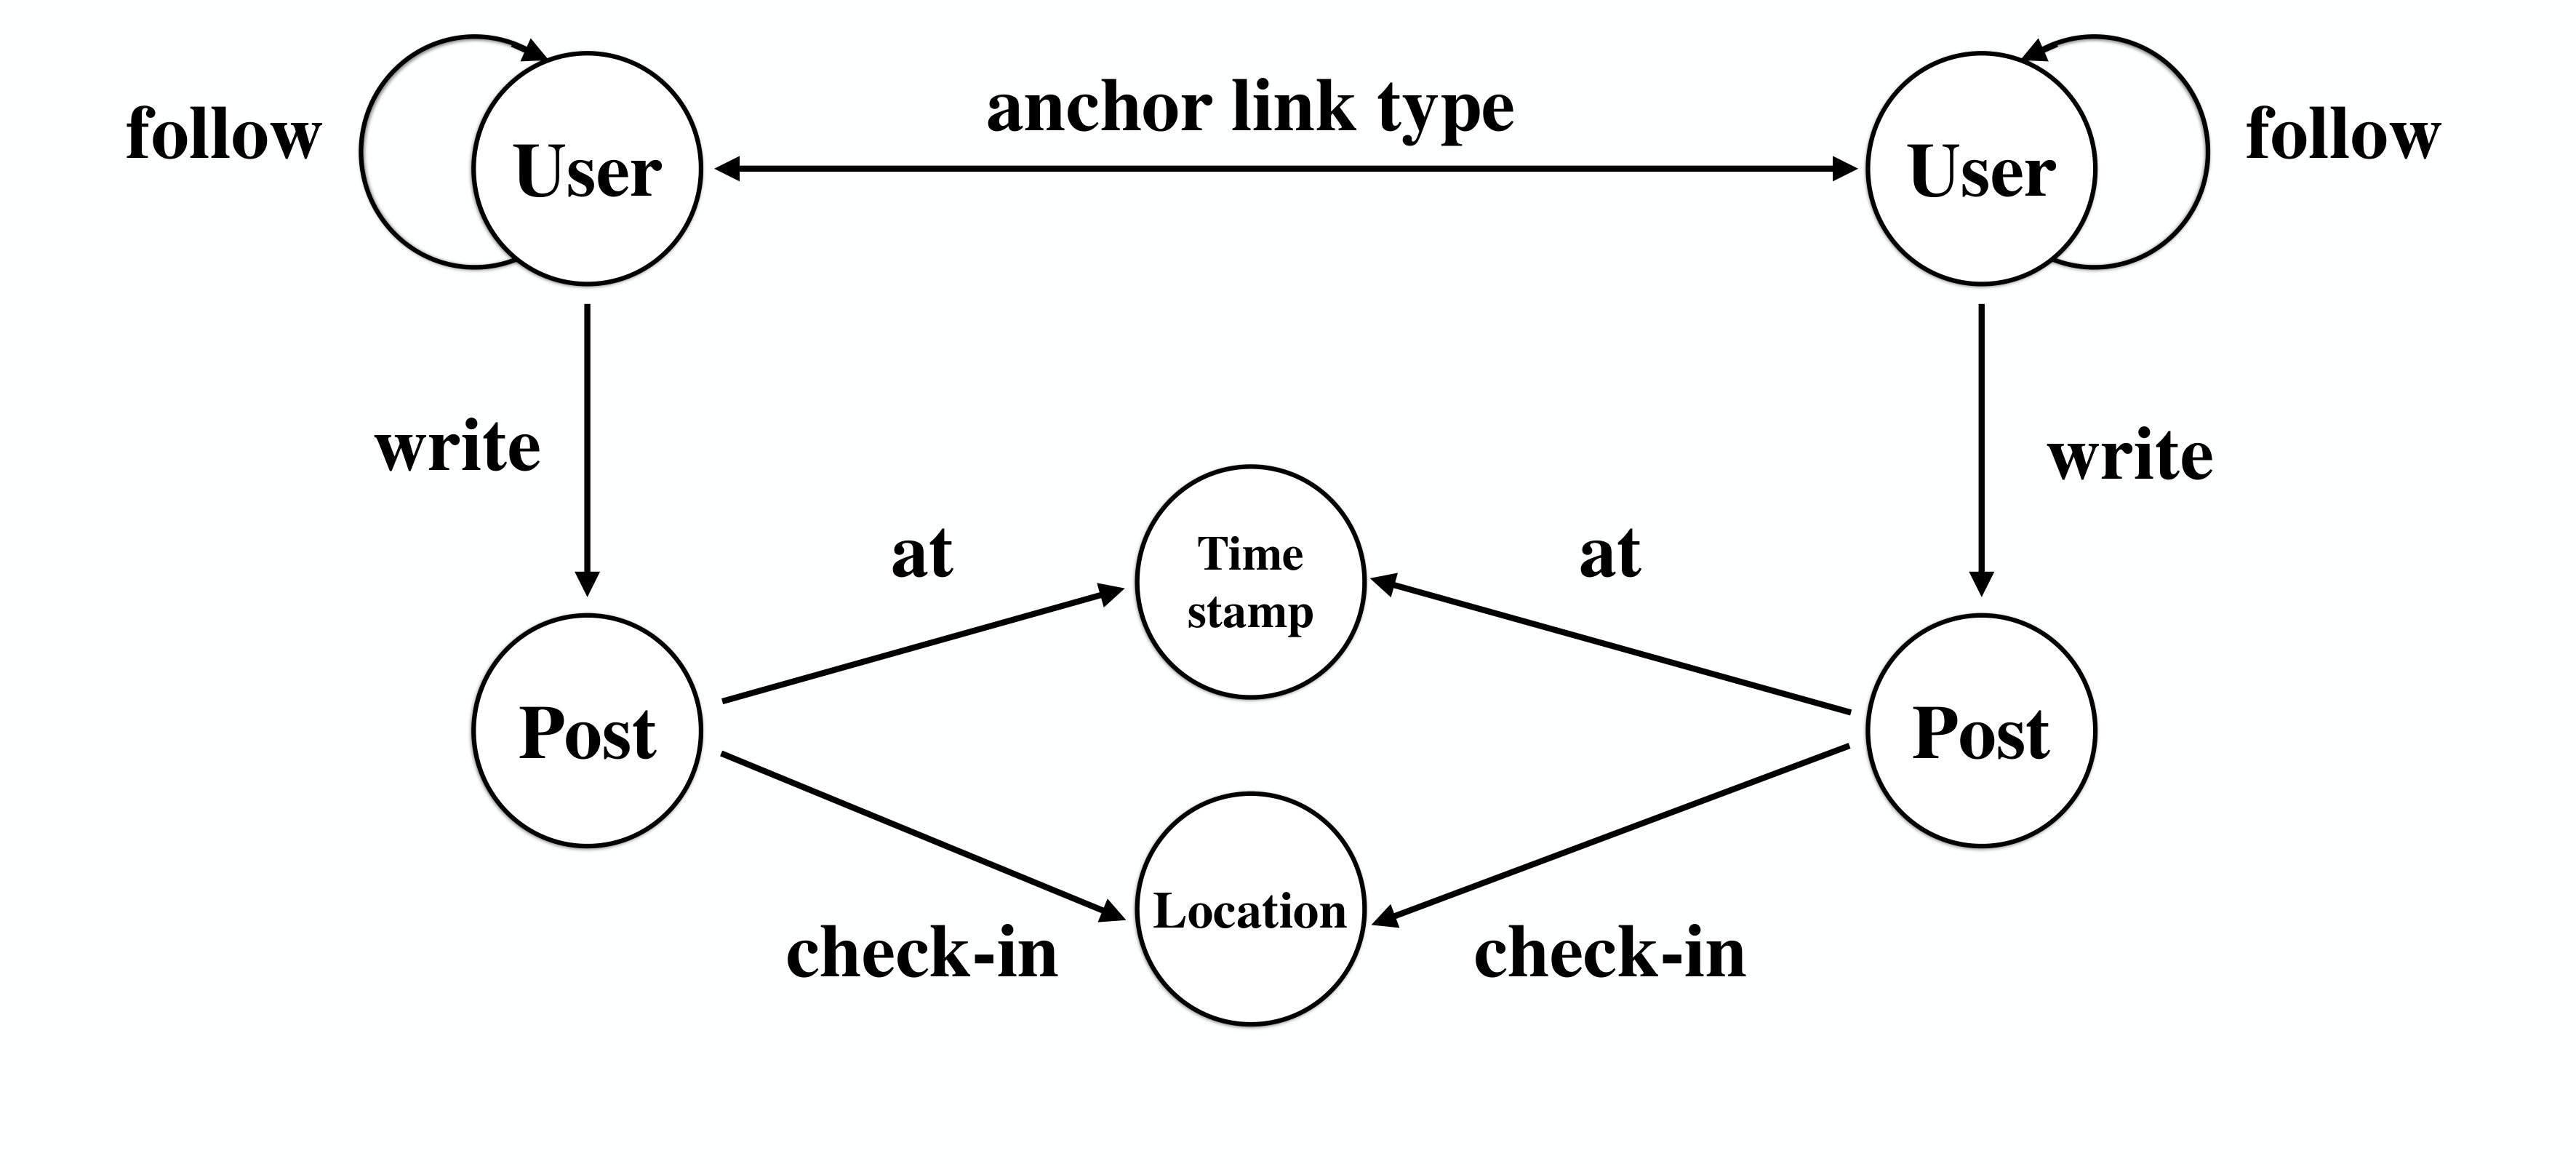 Figure 6
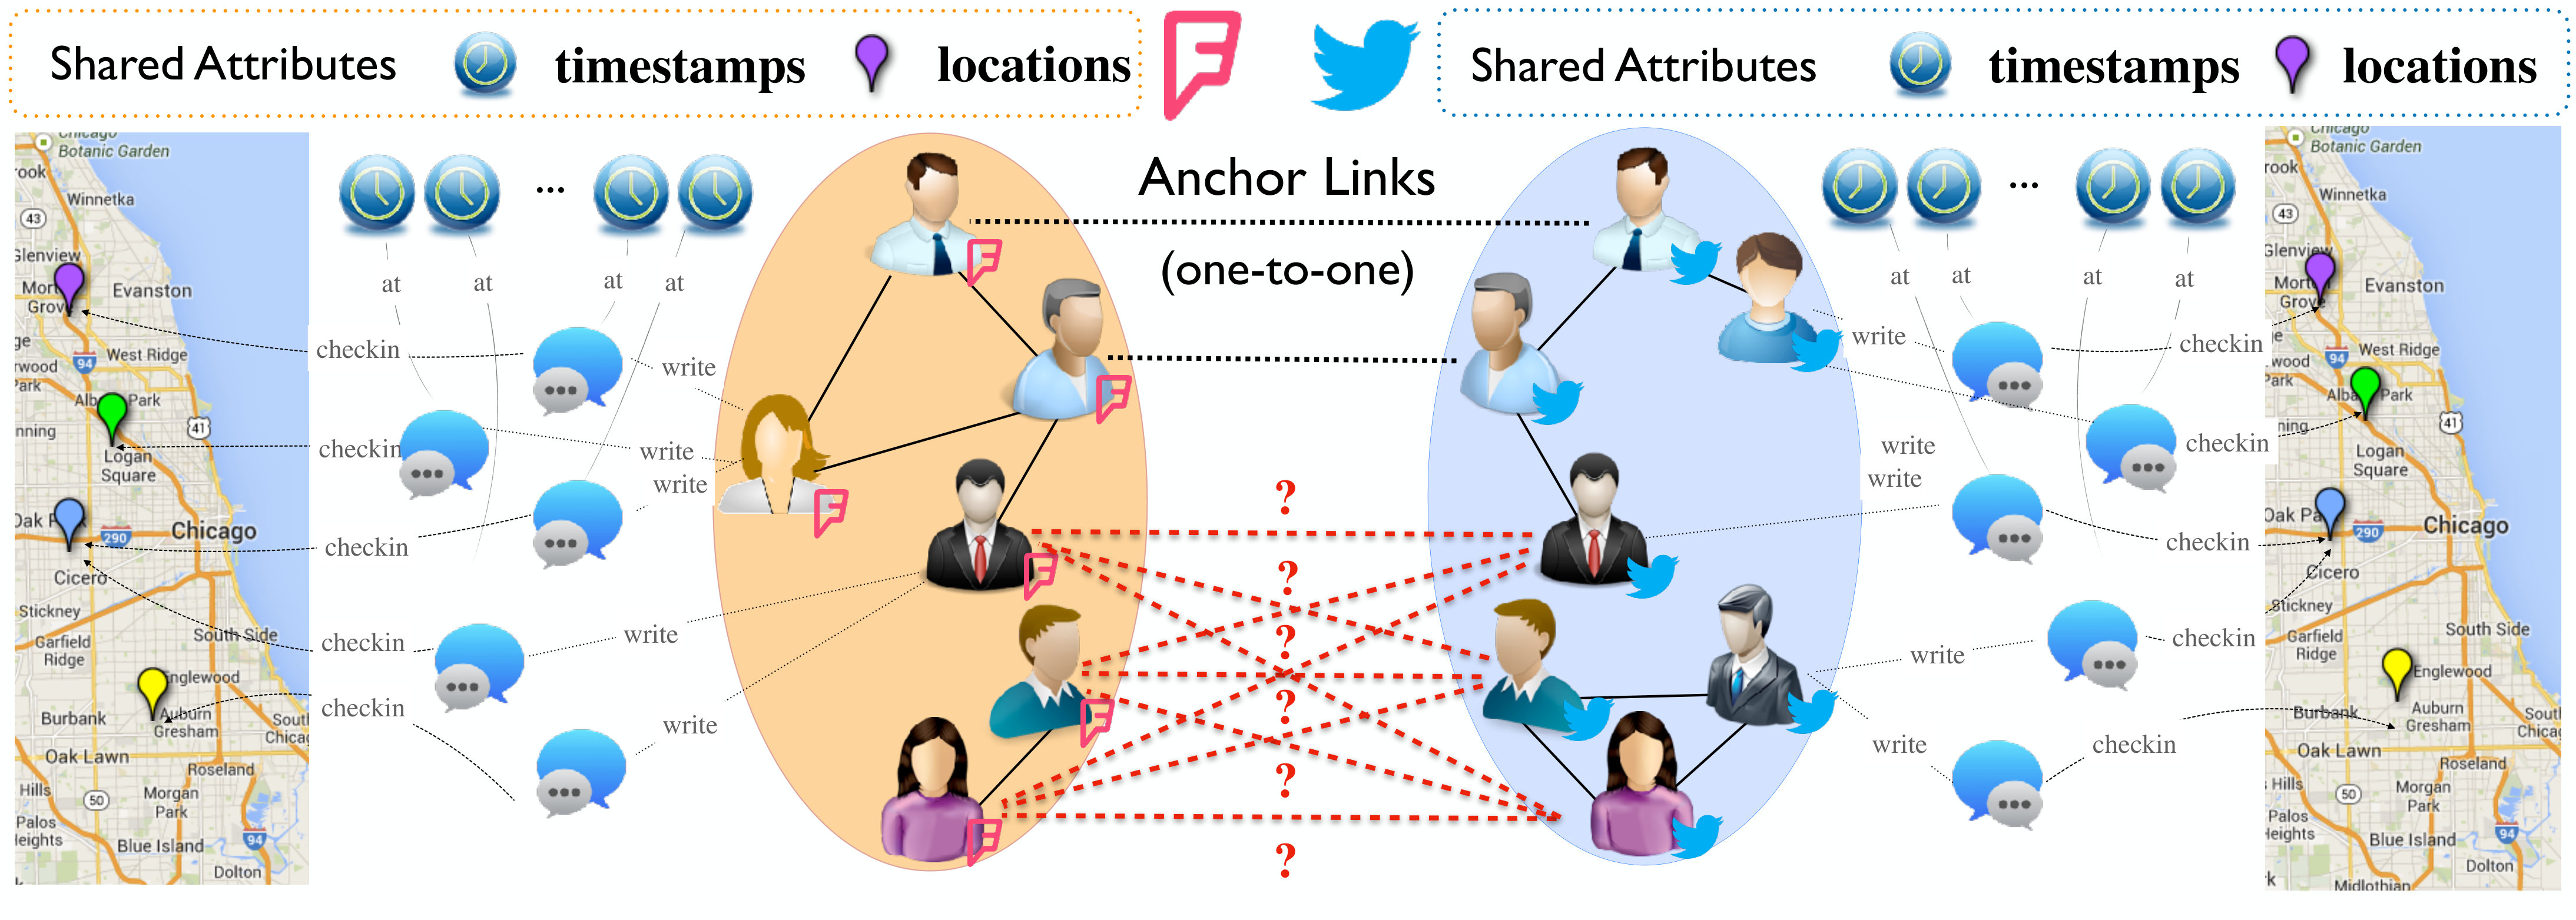 Figure 7
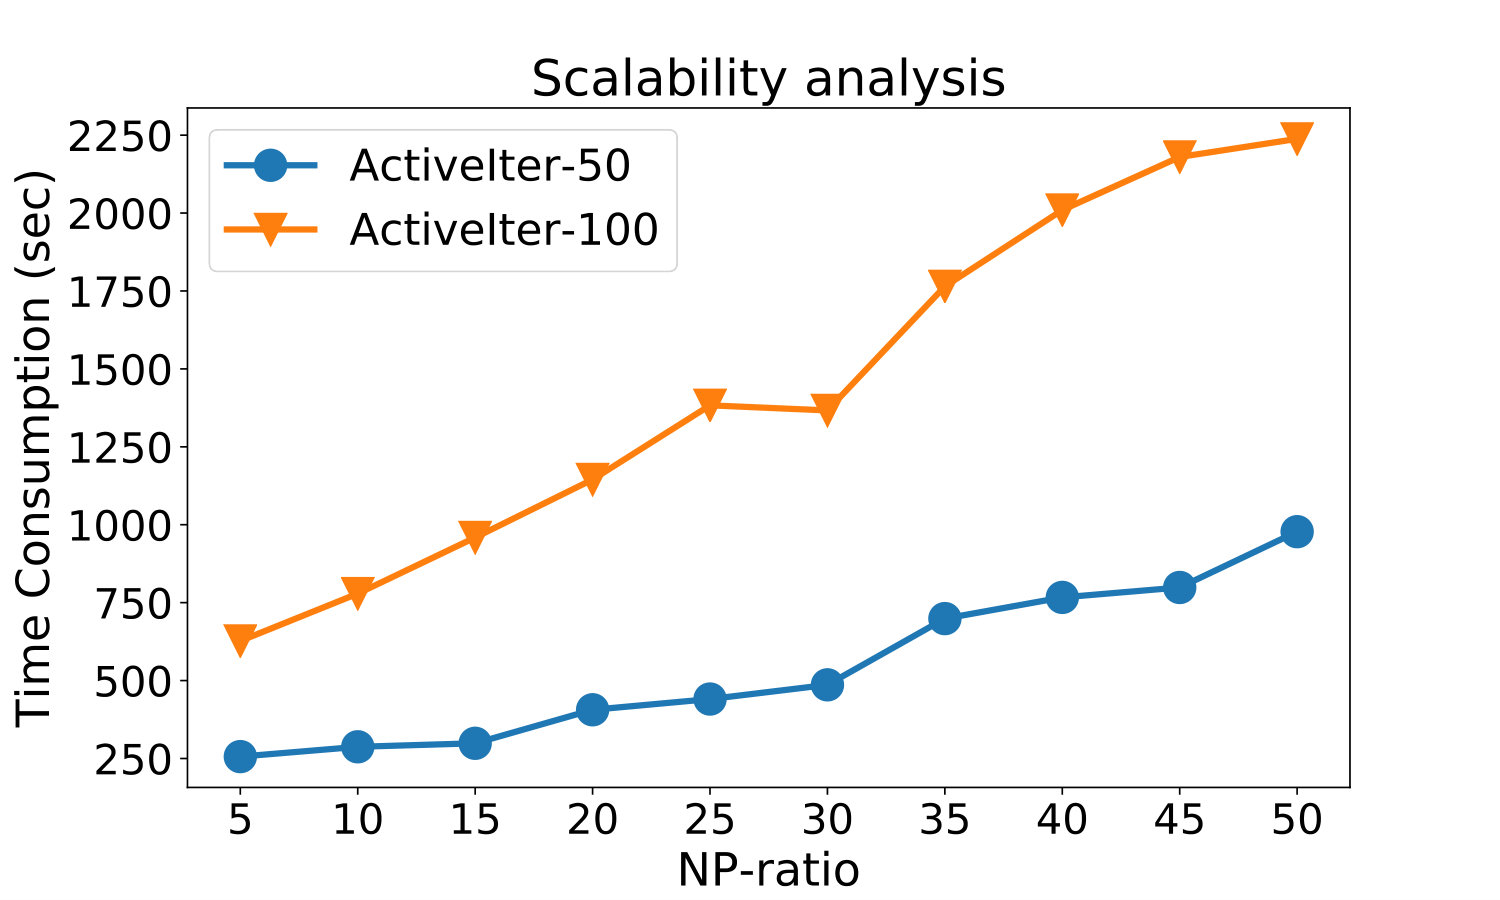 Figure 8
| ID | Notation | Meta Diagram | Semantics |
| U U U U | User User User User | Common Anchored Followee | |
| U U U U | User User User User | Common Anchored Follower | |
| U U U U | User User User User | Common Anchored Followee-Follower | |
| U U U U | User User User User | Common Anchored Follower-Followee | |
| U P T P U | User Post Timestamp Post User | Common Timestamp | |
| U P L P U | User Post Location Post User | Common Checkin | |
| U U U U | Common Aligned Neighbors | ||
| User User | Common Attributes | ||
| Common Aligned Neighbor & Attributes |
| network | |||
| property | Foursquare | ||
| # node | user | 5,223 | 5,392 |
| tweet/tip | 9,490,707 | 48,756 | |
| location | 297,182 | 38,921 | |
| # link | friend/follow | 164,920 | 76,972 |
| write | 9,490,707 | 48,756 | |
| Negative Positive Ratio | |||||||||||
| metrics | methods | 5 | 10 | 15 | 20 | 25 | 30 | 35 | 40 | 45 | 50 |
| F1 | ActiveIter-100 | 0.6310.01 | 0.5750.01 | 0.5240.01 | 0.4840.02 | 0.4550.02 | 0.4360.02 | 0.4130.01 | 0.4020.02 | 0.3840.01 | 0.3630.01 |
| ActiveIter-50 | 0.6250.01 | 0.5710.01 | 0.5140.01 | 0.4820.02 | 0.4540.02 | 0.4290.02 | 0.4040.01 | 0.3920.02 | 0.3740.02 | 0.3610.01 | |
| ActiveIter-Rand-50 | 0.6160.01 | 0.5530.01 | 0.5010.01 | 0.4630.01 | 0.4370.01 | 0.4130.01 | 0.3920.02 | 0.3810.02 | 0.3680.02 | 0.3520.01 | |
| Iter-MPMD | 0.6160.01 | 0.5560.01 | 0.5070.01 | 0.4690.02 | 0.4410.01 | 0.4140.02 | 0.3960.01 | 0.3800.03 | 0.3650.01 | 0.3500.01 | |
| SVM-MPMD | 0.3870.05 | 0.3000.04 | 0.2470.04 | 0.1650.06 | 0.1590.06 | 0.1500.03 | 0.1520.04 | 0.1020.06 | 0.0910.07 | 0.0490.06 | |
| SVM-MP | 0.4760.11 | 0.0930.08 | 0.0550.05 | 0.0040.01 | 0.0020.00 | 0.0000.00 | 0.0000.00 | 0.0000.00 | 0.0000.00 | 0.0000.00 | |
| Precision | ActiveIter-100 | 0.8560.01 | 0.7670.01 | 0.6930.01 | 0.6320.02 | 0.5910.02 | 0.5590.02 | 0.5260.02 | 0.5090.02 | 0.4860.02 | 0.4570.02 |
| ActiveIter-50 | 0.8480.01 | 0.7620.01 | 0.6760.02 | 0.6260.02 | 0.5870.02 | 0.5510.02 | 0.5150.02 | 0.4960.03 | 0.4730.02 | 0.4540.02 | |
| ActiveIter-Rand-50 | 0.8360.01 | 0.7350.01 | 0.6570.01 | 0.6000.02 | 0.5630.02 | 0.5280.02 | 0.4980.03 | 0.4810.02 | 0.4620.02 | 0.4400.02 | |
| Iter-MPMD | 0.8350.01 | 0.7380.01 | 0.6650.01 | 0.6090.02 | 0.5690.02 | 0.5300.02 | 0.5040.02 | 0.48090.02 | 0.4590.02 | 0.4390.02 | |
| SVM-MPMD | 0.7430.06 | 0.7030.04 | 0.6520.06 | 0.5870.20 | 0.5850.09 | 0.5200.05 | 0.5190.06 | 0.4870.25 | 0.3310.27 | 0.3110.31 | |
| SVM-MP | 0.5710.02 | 0.3380.28 | 0.3230.27 | 0.0570.17 | 0.0180.05 | 0.0000.00 | 0.0000.00 | 0.0000.00 | 0.0000.00 | 0.0000.00 | |
| Recall | ActiveIter-100 | 0.4990.01 | 0.4600.01 | 0.4220.01 | 0.3920.01 | 0.3710.01 | 0.3570.01 | 0.3390.01 | 0.3320.01 | 0.3180.01 | 0.3010.01 |
| ActiveIter-50 | 0.4950.01 | 0.4570.01 | 0.4140.01 | 0.3920.01 | 0.3710.01 | 0.3520.02 | 0.3330.01 | 0.3240.01 | 0.3100.01 | 0.3000.01 | |
| ActiveIter-Rand-50 | 0.4880.01 | 0.4430.01 | 0.4040.01 | 0.3760.01 | 0.3570.01 | 0.3400.01 | 0.3230.01 | 0.3150.01 | 0.3050.01 | 0.2930.01 | |
| Iter-MPMD | 0.4880.01 | 0.4460.01 | 0.4100.01 | 0.3810.02 | 0.3600.01 | 0.3400.01 | 0.3270.01 | 0.3140.01 | 0.3020.01 | 0.2900.01 | |
| SVM-MPMD | 0.2710.07 | 0.1940.04 | 0.1550.03 | 0.0970.03 | 0.0940.03 | 0.0860.02 | 0.0880.02 | 0.0590.04 | 0.0530.04 | 0.0270.03 | |
| SVM-MP | 0.4390.14 | 0.0550.05 | 0.0310.03 | 0.0020.00 | 0.0010.01 | 0.0000.00 | 0.0000.00 | 0.0000.00 | 0.0000.00 | 0.0000.00 | |
| Accuracy | ActiveIter-100 | 0.9020.00 | 0.9380.00 | 0.9520.01 | 0.9600.00 | 0.9660.00 | 0.9700.00 | 0.9730.00 | 0.9760.00 | 0.9780.00 | 0.9790.00 |
| ActiveIter-50 | 0.9010.00 | 0.9380.00 | 0.9510.00 | 0.9600.00 | 0.9660.00 | 0.9700.00 | 0.9720.00 | 0.9750.00 | 0.9770.00 | 0.9790.00 | |
| ActiveIter-Rand-50 | 0.8980.00 | 0.9340.00 | 0.9490.00 | 0.9580.00 | 0.9640.00 | 0.9680.00 | 0.9720.00 | 0.9750.00 | 0.9770.00 | 0.9780.00 | |
| Iter-MPMD | 0.8980.00 | 0.9350.00 | 0.9500.00 | 0.9580.00 | 0.9640.00 | 0.9690.00 | 0.9720.00 | 0.9750.00 | 0.9770.00 | 0.9780.00 | |
| SVM-MPMD | 0.8600.00 | 0.9180.00 | 0.9410.00 | 0.9540.00 | 0.9620.00 | 0.9680.00 | 0.9720.00 | 0.9760.00 | 0.9780.00 | 0.9800.00 | |
| SVM-MP | 0.8500.00 | 0.9090.00 | 0.9370.00 | 0.9520.00 | 0.9610.00 | 0.9670.00 | 0.9720.00 | 0.9750.00 | 0.9780.00 | 0.9800.00 | |
| Sample Ratio | |||||||||||
| metrics | methods | 10% | 20% | 30% | 40% | 50% | 60% | 70% | 80% | 90% | 100% |
| F1 | ActiveIter-100 | 0.2350.00 | 0.2650.02 | 0.2910.02 | 0.3090.01 | 0.3330.01 | 0.3630.01 | 0.3690.02 | 0.3970.01 | 0.4040.00 | 0.4220.01 |
| ActiveIter-50 | 0.2300.01 | 0.2470.01 | 0.2890.02 | 0.3000.01 | 0.3230.02 | 0.3610.01 | 0.3620.02 | 0.3960.01 | 0.3990.00 | 0.4100.01 | |
| ActiveIter-Rand-50 | 0.2190.01 | 0.2340.01 | 0.2840.02 | 0.2890.01 | 0.3160.01 | 0.3520.01 | 0.3600.01 | 0.3830.01 | 0.3910.00 | 0.4020.01 | |
| Iter-MPMD | 0.2170.01 | 0.2330.01 | 0.2800.02 | 0.2930.01 | 0.3160.02 | 0.3500.01 | 0.3610.02 | 0.3850.01 | 0.3870.00 | 0.4000.01 | |
| SVM-MPMD | 0.0050.01 | 0.0060.01 | 0.0650.04 | 0.0430.05 | 0.0420.06 | 0.0490.06 | 0.0820.06 | 0.090.06 | 0.0920.07 | 0.1310.06 | |
| SVM-MP | 0.0050.01 | 0.0000.00 | 0.0000.00 | 0.0000.00 | 0.0000.00 | 0.0000.00 | 0.0000.00 | 0.0000.00 | 0.0000.00 | 0.0000.00 | |
| Precision | ActiveIter-100 | 0.3180.01 | 0.3520.02 | 0.3790.02 | 0.3960.01 | 0.4240.02 | 0.4570.02 | 0.4600.03 | 0.4910.01 | 0.4990.01 | 0.5180.02 |
| ActiveIter-50 | 0.3100.01 | 0.3270.02 | 0.3750.02 | 0.3840.015 | 0.4100.02 | 0.450.02 | 0.4500.03 | 0.4890.02 | 0.4920.01 | 0.5030.02 | |
| ActiveIter-Rand-50 | 0.2950.01 | 0.3100.01 | 0.3690.02 | 0.3700.01 | 0.4000.02 | 0.4400.02 | 0.4470.02 | 0.4710.02 | 0.4800.01 | 0.4930.01 | |
| Iter-MPMD | 0.2920.01 | 0.3080.01 | 0.3640.02 | 0.3740.01 | 0.3990.02 | 0.4390.02 | 0.4480.02 | 0.4740.01 | 0.4750.01 | 0.4890.01 | |
| SVM-MPMD | 0.0500.15 | 0.0780.19 | 0.3950.27 | 0.2360.29 | 0.1800.27 | 0.3110.31 | 0.3430.28 | 0.4240.27 | 0.3610.29 | 0.4490.22 | |
| SVM-MP | 0.0440.13 | 0.0000.00 | 0.0000.00 | 0.0000.00 | 0.0000.00 | 0.0000.00 | 0.0000.00 | 0.0000.00 | 0.0000.00 | 0.0000.00 | |
| Recall | ActiveIter-100 | 0.1860.01 | 0.2130.01 | 0.2360.01 | 0.2530.01 | 0.2740.01 | 0.3010.01 | 0.3080.02 | 0.3340.01 | 0.3390.00 | 0.3560.01 |
| ActiveIter-50 | 0.1830.01 | 0.1980.01 | 0.2350.01 | 0.2460.01 | 0.2670.01 | 0.3000.01 | 0.3030.02 | 0.3330.01 | 0.3360.01 | 0.3470.01 | |
| ActiveIter-Rand-50 | 0.1740.01 | 0.1880.01 | 0.2310.01 | 0.2370.01 | 0.2610.01 | 0.2930.01 | 0.3020.01 | 0.3220.01 | 0.3300.00 | 0.3400.01 | |
| Iter-MPMD | 0.1730.01 | 0.1880.01 | 0.2280.01 | 0.2410.01 | 0.2610.01 | 0.2900.01 | 0.3020.01 | 0.3240.01 | 0.3270.00 | 0.3380.00 | |
| SVM-MPMD | 0.0020.01 | 0.0030.01 | 0.0360.02 | 0.0240.03 | 0.0240.03 | 0.0270.03 | 0.0470.03 | 0.0560.03 | 0.0530.04 | 0.0770.04 | |
| SVM-MP | 0.0030.01 | 0.0000.00 | 0.0000.00 | 0.0000.00 | 0.0000.00 | 0.0000.00 | 0.0000.00 | 0.0000.00 | 0.0000.00 | 0.0000.00 | |
| Accuracy | ActiveIter-100 | 0.9760.00 | 0.9770.00 | 0.9770.00 | 0.9780.00 | 0.9780.00 | 0.9790.00 | 0.9790.00 | 0.9800.00 | 0.9800.00 | 0.9810.00 |
| ActiveIter-50 | 0.9760.00 | 0.9760.00 | 0.9770.00 | 0.9770.00 | 0.9780.00 | 0.9790.00 | 0.9790.00 | 0.9800.00 | 0.9800.00 | 0.9800.00 | |
| ActiveIter-Rand-50 | 0.9750.00 | 0.9750.00 | 0.9770.00 | 0.9770.00 | 0.9770.00 | 0.9780.00 | 0.9790.00 | 0.9790.00 | 0.9790.00 | 0.9800.00 | |
| Iter-MPMD | 0.9750.00 | 0.9750.00 | 0.9770.00 | 0.9770.00 | 0.9770.00 | 0.9780.00 | 0.9790.00 | 0.9790.00 | 0.9790.00 | 0.9800.00 | |
| SVM-MPMD | 0.9800.00 | 0.9800.00 | 0.9800.00 | 0.9800.00 | 0.9800.00 | 0.9800.00 | 0.9800.00 | 0.9800.00 | 0.9800.00 | 0.9800.00 | |
| SVM-MP | 0.9800.00 | 0.9800.00 | 0.9800.00 | 0.9800.00 | 0.9800.00 | 0.9800.00 | 0.9800.00 | 0.9800.00 | 0.9800.00 | 0.9800.00 | |
Peer Reviews
No public reviews on file for this paper yet. If you reviewed it on a platform where reviews are public (OpenReview, ICLR, NeurIPS, ICML), you can paste yours below so the community can read it here.
Videos
No videos yet. Explain this paper in a talk, walkthrough, or lecture? Add one.
Meta Diagram based Active Social Networks Alignment
Yuxiang Ren
IFM Lab
*Florida State University
*Tallahassee, USA
Charu C. Aggarwal
IBM Research AI
New York, USA
Jiawei Zhang
IFM Lab
*Florida State University
*Tallahassee, USA
Abstract
Network alignment aims at inferring a set of anchor links matching the shared entities between different information networks, which has become a prerequisite step for effective fusion of multiple information networks. In this paper, we will study the network alignment problem to fuse online social networks specifically. Social network alignment is extremely challenging to address due to several reasons, i.e., lack of training data, network heterogeneity and one-to-one constraint. Existing network alignment works usually require a large number of training instances, but such a demand can hardly be met in applications, as manual anchor link labeling is extremely expensive. Significantly different from other homogeneous network alignment works, information in online social networks is usually of heterogeneous categories, the incorporation of which in model building is not an easy task. Furthermore, the one-to-one cardinality constraint on anchor links renders their inference process intertwistingly correlated. To resolve these three challenges, a novel network alignment model, namely ActiveIter(Active Iterative Alignment), is introduced in this paper. The model ActiveIter defines a set of inter-network meta diagrams for anchor link feature extraction, adopts active learning for effective label query and uses greedy link selection for anchor link cardinality filtering. Extensive experiments were performed on a real-world aligned networks dataset, and the experimental results have demonstrated the effectiveness of ActiveIter compared with other state-of-the-art baseline methods.
Index Terms:
Heterogeneous Network, Network Alignment, Active Learning, Data Mining
I Introduction
Formally, the network alignment problem [26, 4] denotes the task of inferring the set of anchor links [7] between the shared information entities in different networks, where the anchor links are usually assumed to be subject to the one-to-one cardinality constraint [21]. Network alignment has concrete applications in the real world, which can be applied to discover the set of shared users between different online social networks [26, 7], identify the common protein molecules between different protein-protein-interaction (PPI) networks [15, 4, 16], and find the mappings of POIs (points of interest) across different traffic networks [26]. In this paper, we will use online social networks as an example of a real world setting of the network alignment problem and also use this setting to elucidate the proposed model.
Online social networks usually have very complex structures, involving different categories of nodes and links. For instance, in online social networks, like Twitter and Foursquare as shown in Figure 1, users can perform various kinds of social activities, e.g., following other users, writing posts. Viewed in such a perspective, their network structures will contain multiple types of nodes and links, i.e., “User”, “Post” (node types), and “Follow”, “Write” (link types). Users’ personal preference may steer their online social activities, and the network structure can provide insightful information for differentiating users between networks. Furthermore, the nodes in online social networks can be also attached with various types of attributes. For example, the written post nodes can contain words, location check-ins and timestamps (attribute types), which will provide complementary information for inferring users’ language usage, spatial and temporal activity patterns respectively. Based on such an intuition, both the network structure and attribute information should be incorporated in the network alignment model building.
Most of the existing network alignment models are based on supervised learning [7], which aim at building classification/regression models with a large set of pre-labeled anchor links to infer the remaining unlabeled ones (where the existing and non-existing anchor links are labeled as the positive and negative instance respectively). For the network alignment task, pre-labeled anchor links can provide necessary information for understanding the patterns of aligned user pairs in their information distribution, especially compared with the unsupervised alignment models [26, 4]. However, for the real-world online social networks, cross-network anchor link labeling is not an easy task, since it requires tedious user-account pairing and manual user-background checking, which can be very time-consuming and expensive. Therefore, a large training data set as required by existing network alignment models [7] is rarely available in the real world.
Problem Studied: In this paper, we propose to study the heterogeneous network alignment problem based on the active learning setting, which is formally referred to the A**ctive heterogeNeous Network Alignment (Anna) problem. Subject to the pre-specified query budget (i.e., the label query times), Anna allows the models to selectively query for extra labels of the unlabeled anchor links in the learning process. In Figure 1, we shown an example of the Anna problem between the Foursquare and Twitter social networks.
The current research has not studied the heterogeneous network alignment problem based on active learning setting yet. The Anna problem is a novel yet difficult task, and the challenges mainly come from three perspectives, e.g., network heterogeneity, paucity of training data, and one-to-one constraint.
- •
Network Heterogeneity: According to the aforementioned descriptions, both the complex network structure and the diverse attributes have concrete physical meanings and can be useful for the social network alignment task. To incorporate such heterogeneous information in model building, a unified approach is required to handle the network structure and attribute information in a unified analytic.
- •
Paucity of Training Data: To overcome problems caused by paucity of training data, besides the labeled anchor links, active learning also allows models to query for extra labels of unlabeled instances. In this context, active learning application in network alignment still remains unexplored.
- •
One-to-One Cardinality Constraint: Last but not the least, the anchor links to be inferred are not independent in the networked data scenario. The one-to-one cardinality constraint on anchor links will limit the number of anchor links incident to the user nodes [21, 7], which renders the information of positive and negative anchor links to be imbalanced. For each user, if one incident anchor link is identified to be positive, the remaining incident anchor links will all be negative by default. Viewed from such a perspective, positive anchor links contribute far more information compared with the negative ones. Effectively maintaining and utilizing such a constraint on anchor links in the active label query and model building is a challenging problem.
To address these challenges, we will introduce a new network alignment model, namely Active Iterative Alignment (ActiveIter), in this paper. To model the diverse information available in social networks, ActiveIter adopts the attributed heterogeneous social network concept to represent the complex network structure and the diverse attributes on nodes and links. Furthermore, a unified feature extraction method will be introduced in ActiveIter, based on a novel concept namely meta diagram, for anchor links between attributed heterogeneous social networks. ActiveIter accepts coupled user pairs as the input, and outputs the inference results of the anchor links between them utilizing information about both the labeled and unlabeled anchor links. To deal with the paucity of training data, active learning will be adopted in ActiveIter to utilize the unlabeled anchor links in model building by querying for extra anchor link labels based on a designated stratedy within certain pre-specified query budget. Due to the one-to-one constraint, the unlabeled anchor links no longer bears equal information, and querying for labels of potential positive anchor links will be more “informative” compared with negative anchor links. Among the unlabeled links, ActiveIter aims at selecting a set of mis-classified false-negative anchor links as the potential candidates. Using such an approach contributes to not only these queried labels but also other potential extra label corrections of the conflicting negative links. An innovative query strategy is proposed to make sure that ActiveIter can select mis-classified false-negative anchor links more precisely. ActiveIter can outperform other non-active models with less than of extra training instances which has the additional benefits of reducing the time and space complexity.
The remaining parts of this paper will be organized as follows. In Section II, we will introduce the definitions of several important terminologies and the formal problem statement. Detailed information about the proposed model will be provided in Section III, whose effectiveness and efficiency will be tested in Section IV. Related works will be talked about in Section V, and finally in Section VI we will conclude this paper.
II Concept and Problem Definition
In this section, we will define several important concepts used in this paper, and provide the formulation of the Anna problem.
II-A Terminology Definition
Definition 1 (Attributed Heterogeneous Social Networks): The attributed heterogeneous social network studied in this paper can be represented as , where and represent the sets of diverse nodes and complex links in the network. The set of attributes associated with nodes in can be represented as set = ( denotes the -type of attributes).
Meanwhile, for the attributed heterogeneous social networks with shared users, they can be represented as the multiple aligned attributed heterogeneous social networks (or aligned social networks for short).
Definition 2 (Multiple Aligned Social Networks): Given online social networks , , , sharing common users, they can be represented as the multiple aligned social networks , where represents the set of undirected anchor links connecting the common users between networks and .
In Figure 1, we show an example of two aligned social networks, Foursquare and Twitter, which can be represented as . Formally, the Twitter network can be represented as , where denotes the set of nodes in the network including users and posts, and involves the sets of social links among users as well as write links between users and posts. For the posts, a set of attributes can be extracted, which can be represented as denoting the words, location checkins and timestamps attached to the posts in respectively. The Foursquare network has a similar structure as Twitter, which can be represented as . Twitter and Foursquare are aligned together by the user anchor links connecting the shared users, and they also share some common attributes at the same time.
In this paper, we will use these two aligned social networks as an example to illustrate the problem setting and proposed model, but simple extensions of the model can be applied to multiple (more than two) aligned social networks as well.
II-B Problem Definition
Problem Definition: Given a pair of partially aligned social networks , we can represent all the potential anchor links between networks and as set , where and denote the user sets in and respectively. For the known links between networks, we can group them as a labeled set . The remaining anchor links with unknown labels are those to be inferred, and they can be formally denoted as the unlabeled set . In the Anna problem, based on both labeled anchor links in and unlabeled anchor links in , we aim at building a mapping function to infer anchor link labels in subject to the one-to-one constraint, where class labels and [math] denote the existing and non-existing anchor links respectively. Besides these known links, in the Anna problem, we are also allowed to query for the label of links in set with a pre-specified budget , i.e., the number of allowed queries. Besides learning the optimal variables in the mapping function , we also aim at selecting an optimal query set to improve the performance of the learned mapping function as much as possible.
III Proposed Method
In this section, we will introduce the proposed model ActiveIter in detail. At the very beginning, we will introduce the notations used in this paper. After that, the formal definition of Meta Diagram will be provided, based on which a set of meta diagram based features will be extracted. Finally, we will introduce the active network alignment model for anchor link inference.
III-A Notations
In the sequel, we will use lower case letters (e.g., ) to denote scalars, lower case bold letters (e.g., ) to denote column vectors, bold-face upper case letters (e.g., ) to denote matrices, and upper case calligraphic letters (e.g., ) to denote sets. The entry of vector is denoted as . Given a matrix , we denote (and ) as the row (and the column) of , and the entry of matrix can be denoted as or (which are interchangeable). We use (and ) to denote the transpose of matrix (and vector ). For vector , we denote its -norm as , and the -norm of matrix can be represented as . Given two vectors , of the same dimension, we use notation to denote that entries in are no greater than the corresponding entries in .
III-B Meta Diagram based Proximity Features
The attributed heterogeneous social network introduced in Section II provides a unified representation for most of the popular online social networks, like Facebook, Twitter and Foursquare.
III-B1 Network Schema and Inter-Network Meta Path
To effectively categorize the diverse information in the aligned social networks, we introduce the aligned network schema concept as follows.
Definition 3 (Aligned Social Network Schema): Formally, the schema of the given aligned social networks can be represented as . Here, , where and denote the set of node types and attribute types in the network, while represents the set of link types in the network, and denotes the set of association types between nodes and attributes. In a similar way, we can represent the schema of as .
In the above definition, to simplify the representations, (1) the attribute types have no superscript, since lots of attribute types can be shared across networks; and (2) the relation types also have no superscript, and the network they belong to can be easily differentiated according to the superscript of user/post node types connected to them. According to the definition, as shown in Figure 2, we can represent the Twitter network schema as , User*(1), Post(1), Word, Location, Timestamp (or U(1), P(1), W, L, T for short) and follow, write, at, check-in. The Foursquare network schema has exactly the same representation, and it can be denoted as , where U(2), P(2)*, W, L, T and follow, write, at, check-in. Nodes between Twitter and Foursquare can be connected with each other via connections consisting of various types of links. To categorize all these possible connections across networks, we define the concept of inter-network meta path based on the schema as follows:
Definition 4 (Inter-Network Meta Path): Based on an aligned attributed network schema, , path is defined to be an inter-network meta path of length between networks and , where and . In this paper, we are only concerned about inter-network meta paths connecting users across networks, in which .
Based on the aligned network schema shown in Figure 2, several inter-network meta paths can be defined, whose physical meanings and notations are summarized in the top part of Table I.
III-B2 Inter-Network Meta Diagram
For the applications on real-world online social networks, these meta paths extracted in the pervious subsection may suffer from two major disadvantages. Firstly, meta path cannot characterize rich semantics. For instance, given two users and with check-in records “: (Chicago, Aug. 2016), (New York, Jan. 2017), (Los Angeles, May 2017)”, and “: (Los Angeles, Aug. 2016), (Chicago, Jan. 2017), (New York, May 2017)” respectively, based on meta path and , user pair , have a lot in common and are highly likely to be the same user, since they have either checked-in the same locations (for times) or at the same time (for times). However, according to their check-in records, we observe that their activities are totally “dislocated” as they have never been at the same place for the same moments. Secondly, different meta paths denote different types of connections among users, and assembling them in an effective way is another problem. Actually, the meta paths can not only been concatenated but also stacked. Based on such an intuition, to solve these two challenges, we introduce a new concept Inter-Network Meta Diagram, which is a meta subgraph that fuses diverse relationships together for capturing richer semantic information across aligned attributed heterogeneous networks specifically. Inter-network meta diagram is different from the intra-network meta graph [28] and meta structure [5] concepts proposed in the existing works, since it mainly exists across multiple heterogeneous networks. More detailed information about these concepts and their differences will be provided in Section V.
Definition 5 (Inter-Network Meta Diagram): Give a network schema as , an inter-network meta diagram can be formally represented as a directed acyclic subgraph , where and represents the node, attribute and link types involved, while denote the source and sink user node types from network and respectively.
Inter-network meta diagram proposed for the aligned attributed heterogeneous networks involves not only regular node types but also attribute types and it connects user node types across networks, which renders it different from the recent intra-network meta structure [5] or meta graph [28] concepts proposed for single non-attributed networks. Several meta diagram examples have been extracted from the networks as shown at the bottom part of Table I which can be represented as . Here, the meta diagrams and are composed of meta paths based on social relationship and anchor (i.e., and ), as well as attributes (i.e., and ) respectively; is composed of meta paths , and respectively. Besides these listed meta diagram examples shown in Table I, several other meta diagrams are also extracted. Formally, we can use and represent the sets of meta paths composed of the social relationships and the attributes respectively. The complete list of inter-network meta diagrams extracted in this paper are listed as follows:
(): Common Aligned Neighbors.
(): Common Attributes.
(): Common Aligned Neighbor & Attribute.
(): Common Aligned Neighbor & Attributes.
(): Common Aligned Neighbors & Attributes.
Here, , and , and similar for the remaining notations. The operator denotes the stacking of meta paths and via the common node types shared by them. For instance, is an anchor meta diagram composed by stacking two anchor meta paths of social relationships, i.e., . Actually, meta path is also a special type of meta diagram in the shape of path. To unify the terms, we will misuse meta diagram to refer to both meta path and meta diagram in this paper. Formally, all the meta diagrams extracted from the social networks can be represented as .
III-B3 Proximity Feature Extraction with Meta Diagram
Given a pair of users, e.g., and , based on meta diagram , we can represent the set of meta diagram instances connecting and as . Users and can have multiple meta diagram instances going into/out from them. Formally, we can represent all the meta diagram instances going out from user (or going into ), based on meta diagram , as set (or ). The proximity score between and based on meta diagram can be represented as the following meta proximity concept formally.
Definition 6 (Meta Diagram Proximity): Based on meta diagram , the meta diagram proximity between users and in can be represented as
[TABLE]
Meta diagram proximity considers not only the meta diagram instances between and but also penalizes those going out from and into and , respectively, at the same time. Since the meta diagrams span the whole network, both the local and global network structure can be captured by the the meta diagrams. With the above meta proximity definition, we can represent the meta proximity scores among all users in the network based on meta diagram as matrix , where entry . All the meta proximity matrices defined for network can be represented as .
Meanwhile, according to the meta proximity definition, to compute the proximity scores among users, we need to count the number of meta diagram instances connecting users. However, different from the meta path instance counting (which can be done in polynomial time), counting the number of meta diagram instances among users is never an easy task. It involves the graph isomorphism step to match subnetworks with the meta diagram structure and node/link types. To lower down the computational time costs, we propose the minimum meta diagram covering set concept, which will be applied to shrink the search space of nodes in the networks.
Definition 7 (Meta Diagram Covering Set): Give a anchor meta diagram starting and ending with node types and , will contain multiple paths connecting and . Formally, these covered paths connecting and can be represented as the covering set of , i.e., , where denotes a meta path from to . Anchor meta diagram can be decomposed in different ways, and we are only interested in the minimum meta diagram covering set with the smallest size . The the anchor meta diagram covering set recovers the set of meta paths composing the diagrams as introduced before, which can clearly indicate the relationship between meta path and meta diagram.
LEMMA 1: Given a meta diagram , a pair of nodes are connected by instances of meta diagram iff can be connected by instances of all meta paths in its covering set .
PROOF: The lemma can be proved by contradiction. Let’s assume the lemma doesn’t hold, and that cannot connect in the network, given that has an instance connecting . Since is one part of , and we can identify the corresponding parts of from ’s instance, which will create a path connecting with . It contradicts the assumption. Therefore, the Lemma should hold.
Furthermore, based on the above Lemma 1, we can also derive the relationship between the covering sets of meta diagrams.
LEMMA 2: Given two meta diagrams and , where , if a pair of nodes can be connected by instances of meta diagram , there will also be an instance of meta diagram connecting in the network as well.
The above lemma can be proved in a similar way as the proof of Lemma 1, which will not be introduced here due to the limited space. Based on the above lemmas, we propose to apply the meta diagram covering set to help shrink the search space. First of all, we can compute the set of meta path instances connecting users across networks. Formally, given a meta diagram , we can obtain its minimum covering set . For each meta path in , a set of meta path instances connecting the input node pairs can be extracted. By combining these meta path instances together and checking their existence in the network, we will extract instances of . Furthermore, in the case that there exist a prior computation result of meta diagram with covering set , instead of recompute the diagram instances based on meta paths in , we can just combine the meta diagram instances of and the instances of meta paths in to get the meta diagram instance for .
III-C Active Network Alignment Model
In this part, we will introduce the active network alignment model ActiveIter for the anchor link prediction across networks, which involves main components: (1) discriminative function for labeled instances, (2) generative function for unlabeled instance, (3) one-to-one constraint modeling, and (4) active query component.
III-C1 Labeled Data Discriminative Loss Function
For all the potential anchor links in set (involving both the labeled and unlabeled anchor link instances), a set of features will be extracted based on the meta diagrams introduced before. Formally, the feature vector extracted for anchor link can be represented as vector (parameter denotes the feature size). Meanwhile, we can denote the label of link as (), which denotes the existence of anchor link between the networks. For the existing anchor links in set , they will be assigned with label; while the labels of anchor links in are unknown. All the labeled anchor links in set can be represented as a tuple set . Depending on whether the anchor link instances are linearly separable or not, the extracted anchor link feature vectors can be projected to different feature spaces with various kernel functions . For instance, given the feature vector of anchor link , we can represent its projected feature vector as . In this paper, the linear kernel function will be used for simplicity, and we have for all the links .
In the active network alignment model, the discriminative component can effectively differentiate the positive instances from the non-existing ones, which can be denoted as mapping parameterized by . In this paper, we will use a linear model to fit the link instances, and the discriminative model to be learned can be represented as , where . By adding a dummy feature for all the anchor link feature vectors, we can incorporate bias term into the weight vector and the parameter vector can be denoted as for simplicity. Based on the above descriptions, we can represent the introduced discriminative loss function on the labeled set as
[TABLE]
III-C2 Unlabeled Data Generative Loss Function
Meanwhile, to alleviate the insufficiency of labeled data, we also propose to utilize the unlabeled anchor links to encourage the learned model can capture the salient structures of all the anchor link instances. Based on the above discriminative model function , for a unlabeled anchor link , we can represent its inferred “label” as . Considering that the result of may not necessary the exact label values in , in the generative component, we can represent the generated anchor link label as sign\big{(}f(\mathbf{x}_{l};\mathbf{w})\big{)}\in\{+1,0\}. How to determine its value will be introduced later in Section III-D. Based on it, the loss function introduced in the generative component based on the unlabeled anchor links can be denoted as
[TABLE]
III-C3 Query Component and Query Loss Function
Furthermore, besides the labeled links, a subset of the anchor links in will be selected to query for the labels from the oracle, which can be denoted as set formally. The true label of anchor link after query can be represented as . The remaining anchor links in set can be represented as . Based on the loss functions introduced before, depending on whether the labels of links are queried or not, we can further specify the loss function for set as
[TABLE]
Here, we need to add more remarks that notation denotes the queried label of anchor link which will be a known value, while the labels for the remaining anchor link will to be inferred in the model.
III-C4 Cardinality Mathematical Constraint
As introduced before, the anchor links to be inferred between networks are subject to the one-to-one cardinality constraint. Such a constraint will control the maximum number of anchor links incident to the user nodes in each networks. Subject to the cardinality constraints, the prediction task of anchor links between networks are no longer independent. For instance, if anchor link is predicted to be positive, then all the remaining anchor links incident to and in the unlabeled set will be negative by default. Viewed in such a perspective, the cardinality constraint on anchor links should be effectively incorporated in model building, which will be modeled as the mathematical constraints on node degrees in this paper. To represent the user node-anchor link relationships in networks and respectively, we introduce the user node-anchor link incidence matrices in this paper. Entry iff anchor link is connected with user node in , and it is similar for .
According to the analysis provided before, we can represent the labels of links in as vector , where entry represents the label of link . Depending on which group belongs to, its value has different representations as introduced before ; , and is unknown if . Furthermore, based on the anchor link label vector , user node-anchor link incidence matrices and , we can represent the user node degrees in networks and as vectors and respectively.
[TABLE]
Therefore, the one-to-one constraint on anchor links can be denoted as the constraints on node degrees in and as follows:
[TABLE]
III-D Joint Optimization Objective Function
Based on the introduction in the previous subsection, by combining the loss terms introduced by the labeled, queried and remaining unlabeled anchor links together with the cardinality constraint, we can represent the joint optimization objective function as
[TABLE]
Here, we set the weight scalar and with the value , because we assume that each link is equally important for training, if no other external knowledge exists, regardless of whether it belongs to or . In this way, the new loss term of all the links in sets , and can be simplified as
[TABLE]
where matrix denotes the feature matrix of all the links in set .
Here, we can see the objective function involve multiple variables, i.e., variable , label , and the query set , and the objective is not jointly convex with regarding these variables. What’s more, the inference of the label variable and the query set are both combinatorial problems, and obtaining their optimal solution will be NP-hard. In this paper, we design an hierarchical alternative variable updating process for solving the problem instead:
fix , and update and ,
- (1-1)
with fixed , fix , update , 2. (1-2)
with fixed , fix , update , 2. 2.
fix and , and update .
A remark to be added here: we can see that variable is different from the remaining two, which involves the label query process with the oracle subject to the specified budget. To differentiate these two iterations, we call the iterations (1) and (2) as the external iteration, while call (1-1) and (1-2) internal iteration. Next, we will illustrate the detailed alternative learning algorithm as follows.
External Iteration Step (1): Fix , Update , .
Internal Iteration Step (1-1): Fix , , Update .
With , fixed, we can represent the objective function involving variable as
[TABLE]
The objective function is a quadratic convex function, and its optimal solution can be represented as
[TABLE]
where is a constant matrix. Therefore, the weight vector depends only on the variable.
Internal Iteration Step (1-2): Fix , , Update .
With , fixed, together with the constraint, we know that terms , and are all constant. And the objective function will be
[TABLE]
It is an integer programming problem, which has been shown to be NP-hard and no efficiently algorithm exists that lead to the optimal solution. In this paper, we will use the greedy link selection algorithm proposed in [21] based on values , which has been proven to achieve -approximation of the optimal solution. The time complexity of this step is , where .
External Iteration Step (2): Fix , , Update .
Selecting the optimal set at one time involves the search of all the potential link instance combinations from the unlabeled set , whose search space is , and there is no known efficient approach for solving the problem in polynomial time. Therefore, instead of selecting them all at one time, we propose to choose several link instances greedily in each iterations. Due to the one-to-one constraint, the unlabeled anchor links no longer bears equal information, and querying for labels of potential positive anchor links will be more “informative” compared with negative anchor links. Among the unlabeled links, ActiveIter selects a set of mis-classified false-negative anchor links (but with a large positive score) as the potential candidates, benefits introduced by whose label queries includes both their own label corrections and other extra label gains of their conflicting negative links at the same time. Formally, among all the unlabeled links in , we can represent the set of links classified to be positive/negative instances in the previous iteration step as and . Based on these two sets, the group of potentially mis-classified false-negative anchor link candidates as set
[TABLE]
[TABLE]
where statement “/ conflicts with ” denotes / and are incident to the same nodes respectively. Operator represents is close to (whose difference threshold is set as in the experiments). All the links in set will be sorted according to value , and, instead of adding one by one, the top candidates will be added to in this iteration (Here, denotes the query batch size, which is assigned with value in the experiments). Because ActiveIter has to select the top candidates from all potential candidates, where the potential candidates we defined as , the time complexity of External Iteration Step (2) is .
III-E Time Complexity Analysis
Here, we start to analyze the time complexity of ActiveIter from a holistic perspective based on the analysis of each step in section III-D. As we set the query batch size as and the budget as , the whole hierarchical alternative variable updating process has to be executed rounds. The iteration step (1-1) is a matrix multiplication which has he time complexity . The time complexity the iteration step (1-2) is . Besides, the time complexity of the iteration step (2) is .We can find ActiveIter is scalable, with near linear runtime in the data size .
IV Experiments
To demonstrate the effectiveness of ActiveIter and the meta diagram based features, extensive experiments have been done on real-world heterogeneous social networks. In the following part, we will describe the dataset we use in experiments at first. Then we will introduce the experimental settings, including different comparison methods and evaluation metrics used in the experiments. At last, we will show the experimental results together with the convergence analysis and parameter sensitivity analysis.
IV-A Dataset Description
Our dataset used in experiments consists of two heterogeneous networks: Foursquare and Twitter. Both of them are famous online social networks. The key statistical data describing these two networks can be found in Table II. About the method and strategy of crawling this dataset, you can get detailed information in [7, 22].
- •
Twitter: Twitter is a popular online social network that provides a platform for users to share their life with their online friends. Lots of the tweets written by users in Twitter are location-related along with timestamp. Our dataset includes users and tweets. locations appears along with tweets. Besides, the number of follow links between these users is in total.
- •
Foursquare: Foursquare is another famous social network allowing users to interact with friends online through multiple location-related services. Our dataset has users in Foursquare and friendship relationship among them. All these users have checked-in at different locations via tips. There are anchor links between Twitter and Foursquare in the dataset.
IV-B Experimental Settings
IV-B1 Experimental Setup
In the experiments, we are able to acquire the set of anchor links between Foursquare and Twitter. The size of the set is which can be represented as . Based on the problem definition introduced in Section II-B, between the Foursquare and Twitter network, all the remaining non-existing anchor links can be represented as set . A proportion of non-anchor links are sampled randomly from as negative set based on different negative-positive (NP) ratios . NP-ratio in experiments ranges from 5 to 50 with the step length 5. The positive and negative link sets are divided into 10 folds. Among them, 1 fold will be used as the training set and the remaining 9 folds as the test set. In order to simulate the problem setting without enough labeled data, we further sample a small proportion of labeled instances from the 1-fold training set as the final training set. The sampling process is controlled by parameter sample-ratio , which takes values in {10%, 20%, , 100%}. Here, denotes only of the 1-fold training set (i.e., only of the complete labeled data) is sampled in the final training set; while means all the instances in the 1-fold training set (i.e., of the labeled data) are used for training the model. In order to prevent unexpected impacts caused by data partitioning, we take 10 folds in turns to act as train set and the average metrics of 10 experiments are taken as the final results. We run the experiments on a Dell PowerEdge T630 Server with 2 20-core Intel CPUs and 256GB memory. The operating system is Ubuntu 16.04.3, and all codes are implemented in Python.
IV-B2 Comparison Methods
The methods used in experiments are listed as following, we use them to verify 2 aspects of conclusions. One is the effectiveness of meta diagram based feature vector, and the other is the advantage of ActiveIter.
- •
ActiveIter: ActiveIter is the model proposed in this paper which implements the learning process described in Section 3.4. Through a limited budget, we aim at selecting a good query set with the objective to improve the performance of ActiveIter. Two different versions of ActiveIter with budgets 50 and 100 are compared in the experiments.
- •
ActiveIter-Rand: In this method, we select the query set in a random way in this method. The method is used to verify the effectiveness of the query set selection criteria used in ActiveIter.
- •
Iter-MPMD: Iter-MPMD extends the cardinality constrained link prediction model proposed in [21] by incorporating the meta diagrams for feature extraction from aligned heterogeneous networks. ITER-MPMD is based on a PU (positive unlabeled) learning setting, without active query step.
- •
SVM-MP: SVM is a classic supervised learning model. The feature vector used for building the SVM-MP model are extracted merely based on the meta paths.
- •
SVM-MPMD: SVM-MPMD is identical to SVM-MP excepts it is built based on the features extracted with both meta paths and meta diagrams. Results comparison between SVM-MPMD and SVM-MP can verify the effectiveness of the meta diagram based features proposed in this paper. Meanwhile, comparison of SVM-MPMD and Iter-MPMD can also show that PU learning setting adopted in Iter-MPMD is suitable for the network alignment problem.
IV-B3 Evaluation Metrics
We choose to use conventional evaluation metrics to measure the performance of different methods in experiments. The methods we test in experiments, including SVM-MP, SVM-MPMD, Iter-MPMD, ActiveIter-Rand, and ActiveIter, can all output link prediction labels, and we will use F1, Recall, Precision and Accuracy as evaluation metrics. It should be noted that we need to query some labels in ActiveIter-Rand and ActiveIter. In other words, for the active-learning based methods, labels of these queried links are known already. In evaluation, we will remove these queried links from test set to maintain evaluation fairness between different comparison methods.
IV-C Convergence and Scalability Analysis
In building the model ActiveIter, we propose to use the External Iteration Step (1) in the Section 3.4 essentially to learn both the model variable vector and predict the anchor link label vector . In order to to show such an iteration step can convergence, in Figure 3, we show the label vector changes in each iteration. Here, the x axis denotes the iterations, and the y axis denotes the changes of vector in sequential iterations and , i.e., . According to Figure 3, we observe that the label vector of ActiveIter in the external iteration step can converge in less than iterations for different NP-ratios.
Figure 4 shows the near-linear scaling of ActiveIter’s running time in the data size. Here the X axis is the NP-ratio , where the value of can represent the number of total links as we set before. The slopes indicate linear growth which shows the scalability of ActiveIter.
IV-D Experimental Results with Analysis
The experimental results acquired by different comparison methods are shown in Table III and Table IV mainly. In Table III, Sample-ratio is fixed as 60%, and NP-ratio changes within {5, 10, , 50}. The experimental results of these comparison methods are evaluated by the F1, Recall, Precision and Accuracy metrics respectively. Here, ActiveIter-50 denotes ActiveIter with query budget, and ActiveIter-100 has a query budget of value . At first, we focus on the comparison between SVM-MP and SVM-MPMD. We can find SVM-MPMD has a distinct advantage over SVM-MP with . Especially when is over 25, the Recall of SVM-MP goes down to [math], and it denotes SVM-MP becomes ineffective in identifying the positive anchor links. However, SVM-MPMD can still work in such a class imbalance scenario. There is only one exception in the table: when , the recall of SVM-MP is better than SVM-MPMD. We believe it is caused by very limited positive links and then conduct the supplementary experiment which samples the dataset another time and verifies the recall in is just an accident finally. Therefore, we can verify the effectiveness of the feature vector based on meta diagrams by the comparison of this set of experiments. Besides, the comparison between SVM-MPMD and Iter-MPMD demonstrates that Iter-MPMD based on a PU learning setting provides a much better modeling for network alignment. However, we can find that the Accuracy of SVM-MPMD is the highest when is over . Here, we should remind when is high enough, SVM-MPMD can not predict positive links correctly which can be found from its Recall. Therefore, in such a class-imbalance setting, Accuracy cannot work well in evaluating the comparison methods performance any more.
Meanwhile, by comparing Iter-MPMD with ActiveIter-Rand-50, we can discover the metrics obtained by ActiveIter-Rand-50 can even be worse than Iter-MPMD in some cases. In other words, querying labels in a random way will not contribute to the improvement of the prediction result. From the results, we are also able to observe that ActiveIter-50 outperforms ActiveIter-Rand-50 consistently for . In addition, the comparison between ActiveIter-50 and ActiveIter-100 shows the budget value may have an impact on the performance of ActiveIter, whose sensitivity analysis is available in Section IV-E.
In Table IV, we fix as and change the sample-ratio with values in {10%, 20%, , 100%}. From Table IV, we can confirm conclusions verified from Table III are still valid firstly. Furthermore, we can make comparison between ActiveIter-100 with certain and Iter-MPMD with , When , the size of training set will increase by , if increases by . Between these two methods, besides the percentage of training instances shared by both methods, ITER-MPMD uses additional training instances, while ActiveIter-100 merely queries for additional instances. According to the results, in most of the cases, ActiveIter-100 with far less training data can still outperform ITER-MPMD with great advantages. For example, when , ActiveIter-100 has metrics that , , and . We use Iter-MPMD which as a comparison. , , and achieved by Iter-MPMD are , , and respectively. In other words, ActiveIter can get better performance with around cost in labeling links compared with Iter-MPMD.
IV-E Parameter Analysis
The effects of the parameter budget on the performance of ActiveIter will be analyzed in this part. From Figure 5, we can observe that ActiveIter can achieve better prediction results consistently along with querying critical labels continuously, but ActiveIter-Rand can not improve prediction output with random labels. This result shows that when rises, ActiveIter is accompanied by better results in all metrics including F1, Precision. Recall and Accuracy. Meanwhile, this performance improvement is continuous and significant because when the changes within {10, 25, 50, 75, 100}, the improvement of performance does not slow down. After exceeds , three key metrics including F1, Precision and Accuracy have been higher than Iter-MPMD which has more labeled links in the training set. According to the analysis results, with far less (less than 100 additional) training instances, method ActiveIter proposed in this paper based on active learning can achieve comparable and even better results than the non-active method Iter-MPMD with 1,670 extra training instances.
V Related Work
Network alignment problem is an important research problem, which has been studied in various areas, e.g., protein-protein-interaction network alignment in bioinformatics [6, 8, 15], chemical compound matching in chemistry [17], data schemas matching data warehouse [11], ontology alignment web semantics [3], graph matching in combinatorial mathematics [10], and figure matching and merging in computer vision [2, 1]. Network alignment is an important problem for bioinformatics. By studying the cross-species variations of biological networks, network alignment problem can be applied to predict conserved functional modules [13] and infer the functions of proteins [12]. Graemlin [4] conducts pairwise network alignment by maximizing an objective function based on a set of learned parameters. Some works have been done on aligning multiple network in bioinformatics. IsoRank proposed in [16] can align multiple networks greedily based on the pairwise node similarity scores calculated with spectral graph theory. IsoRankN [8] further extends IsoRank by exploiting a spectral clustering scheme.
Similarity measure based on heterogeneous networks has been widely studied. Sun introduces the concept of meta path-based similarity in PathSim [18], where a meta path is a path consisting of a sequence of relations. However, the meta path suffers from two disadvantages. On one hand, meta path cannot describe rich semantics effectively. On the other hand, once numerious meta paths are defined, it’s challenging to assemble them. Some methods to resolve these deficiencies are proposed later. Meta structure [5] applys meta-graph to similarity measure problem, but entities are constrained to be of the same type. Zhao [28] proposes the concept of meta graph and extends the idea to recommendation problems which require that entities belong to different types. However, meta structure and meta graph are proposed for single non-attribute networks. In our inter-network meta diagram definition, not only regular node types but also attribute types are involved, and it can be applied to the similarity measure across networks.
For online social networks, network alignment provides an effective way for information fusion across multiple information sources. In the social network alignment model building, the anchor links are very expensive to label manually, and achieving a large-sized anchor link training set can be extremely challenging. In the case when no training data is available, via inferring the potential anchor user mappings across networks, Zhang et al. have introduced an unsupervised network alignment models for multiple social networks in [26] and an unsupervised network concurrent alignment model via multiple shared information entities simultaneously in [27]. However, pre-labeled anchor links can provide necessary information for understanding the patterns of aligned user pairs in their information distribution, which lead to the better performance than the unsupervised alignment models. Therefore, in [25, 21], Zhang et al. propose to study the network alignment problem based on the PU learning setting.
Active learning is an effective method for network alignment in the face of lacking labeled links which has been previous studied by [19, 9]. The query strategies proposed by Cortés and Serratosa [19] return a probability matrix for different alignment choices which makes the quantification of network alignment straightforward. However, this kind of strategies totally ignore the one-to-one cardinality constraint existing in online social networks. Therefore, we provide an innovative query strategy considering one-to-one cardinality constraint in ActiveIter. Malmi [9] proposes two relative-query strategies TopMatching and GibbsMatching instead of focusing on absolute-query. However, it may not be less challenging for experts to make comparative judgements in online social networks, because the quantity of cantidates corresponding to one node will be huge.
Across the aligned networks, various application problems have been studied. Cross-site heterogeneous link prediction problems are studied by Zhang et al. [23] by transferring links across partially aligned networks. Besides link prediction problems, Jin and Zhang et al. proposes to partition multiple large-scale social networks simultaneously in [24]. The problem of information diffusion across partially aligned networks is studied by Zhan et al. in [20], where the traditional LT diffusion model is extended to the multiple heterogeneous information setting. Shi et al. give a comprehensive survey about the existing works on heterogeneous information networks in [14], which includes a section talking about network information fusion works and related application problems in detail.
VI Conclusion
In this paper, we study the Anna problem and propose an active learning model ActiveIter based on meta diagrams to solve this problem. Meta diagrams can be extracted from the network to constitute heterogeneous features. In our experiments, we verify the effectiveness of meta diagram based feature vectors at first. In the active learning model ActiveIter, we propose an innovative query strategy in the selection process to in order to query for the optimal unlabeled links. Extensive experiments conducted on two real-world networks Foursquare and Twitter demonstrate that ActiveIter has very outstanding performance compared with the state-of-the-art baseline methods. ActiveIter only needs a small-size training set to build up initially and can outperform the other non-active models with much less training instances.
VII Acknowledgements
This work is partially supported by FSU and by NSF through grant IIS-1763365.
The reference list from the paper itself. Each links out to its DOI / PubMed record.
- 1[1] M. Bayati, M. Gerritsen, D. Gleich, A. Saberi, and Y. Wang. Algorithms for large, sparse network alignment problems. In ICDM , 2009.
- 2[2] D. Conte, P. Foggia, C. Sansone, and M. Vento. Thirty years of graph matching in pattern recognition. IJPRAI , 2004.
- 3[3] A. Doan, J. Madhavan, P. Domingos, and A. Halevy. Ontology matching: A machine learning approach. In Handbook on Ontologies . 2004.
- 4[4] J. Flannick, A. Novak, B. Srinivasan, H. Mc Adams, and S. Batzoglou. Graemlin: general and robust alignment of multiple large interaction networks. Genome research , 2006.
- 5[5] Z. Huang, Y. Zheng, R. Cheng, Y. Sun, N. Mamoulis, and X. Li. Meta structure: Computing relevance in large heterogeneous information networks. In KDD , 2016.
- 6[6] M. Kalaev, V. Bafna, and R. Sharan. Fast and accurate alignment of multiple protein networks. In RECOMB . 2008.
- 7[7] X. Kong, J. Zhang, and P. Yu. Inferring anchor links across multiple heterogeneous social networks. In CIKM , 2013.
- 8[8] C. Liao, K. Lu, M. Baym, R. Singh, and B. Berger. Isorankn: spectral methods for global alignment of multiple protein networks. Bioinformatics , 2009.