Multi-faceted machine learning of competing orders in disordered interacting systems
Michael Matty, Yi Zhang, Zlatko Papic, Eun-Ah Kim

TL;DR
This paper introduces a neural network framework to classify and analyze phases in disordered, interacting quantum systems, successfully mapping phase boundaries and identifying complex phases like fractional quantum Hall and charge density wave states.
Contribution
The study presents a novel multi-input neural network approach to detect and distinguish topological and symmetry-broken phases in disordered quantum systems, including a comprehensive phase diagram analysis.
Findings
The neural network accurately identifies phase boundaries consistent with traditional methods.
It reveals the robustness of the fractional quantum Hall state under disorder and interactions.
Maps the emergence of charge density wave micro-emulsions before full disorder.
Abstract
While the non-perturbative interaction effects in the fractional quantum Hall regime can be readily simulated through exact diagonalization, it has been challenging to establish a suitable diagnostic that can label different phases in the presence of competing interactions and disorder. Here we introduce a multi-faceted framework using a simple artificial neural network (ANN) to detect defining features of a fractional quantum Hall state, a charge density wave state and a localized state using the entanglement spectra and charge density as independent input. We consider the competing effects of a perturbing interaction ( pseudopotential ), a disorder potential , and the Coulomb interaction to the system at filling fraction . Our phase diagram benchmarks well against previous estimates of the phase boundary using conventional measures along the $\Delta…
Click any figure to enlarge with its caption.
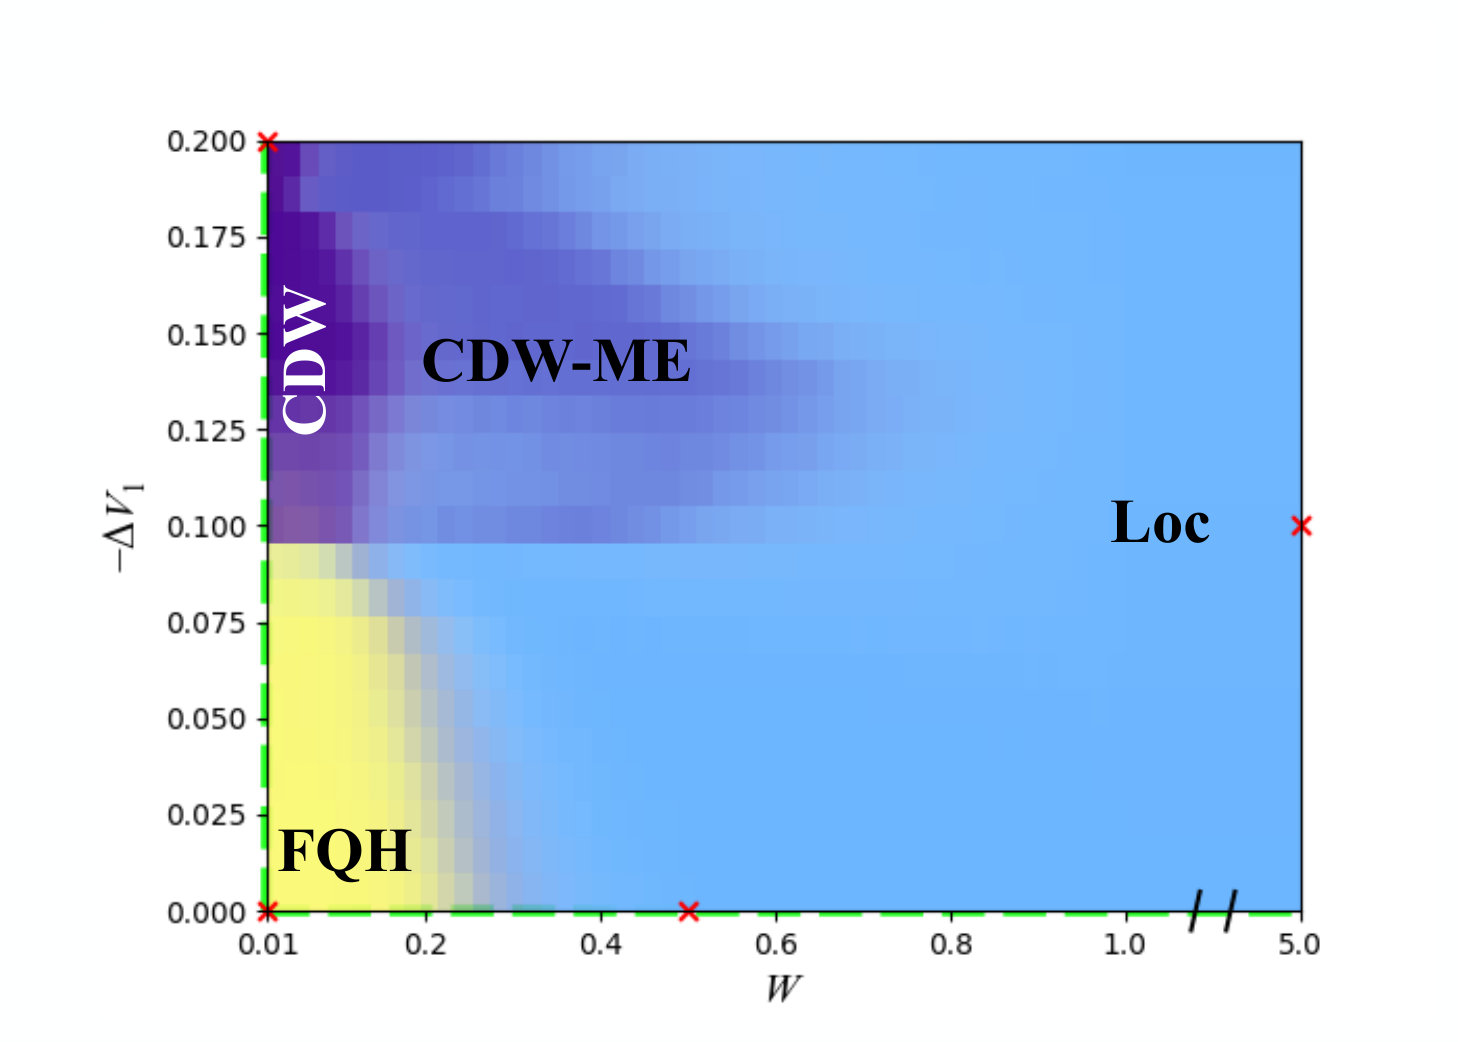 Figure 1
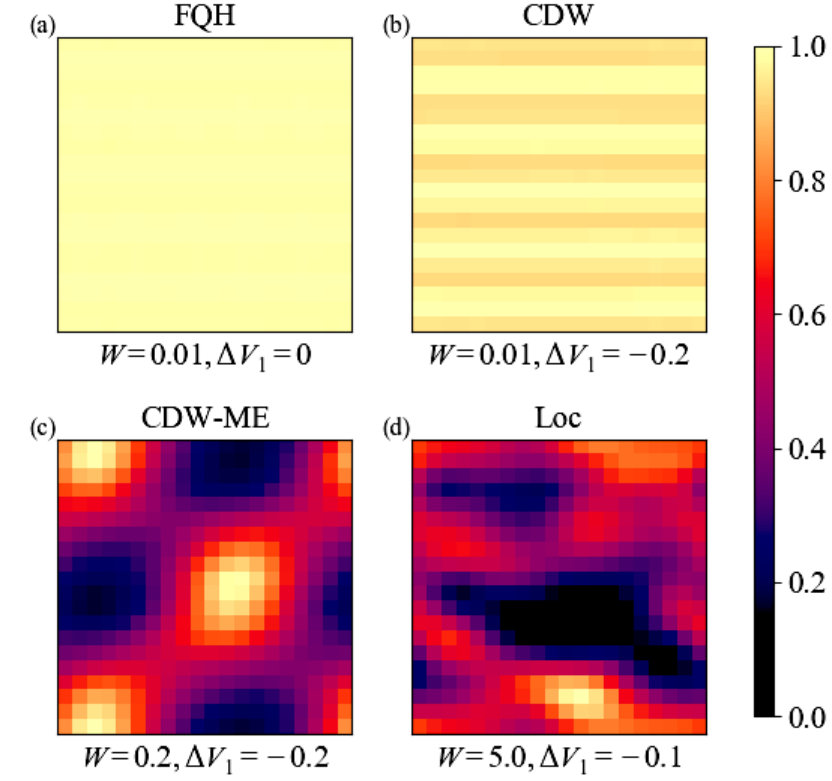 Figure 2
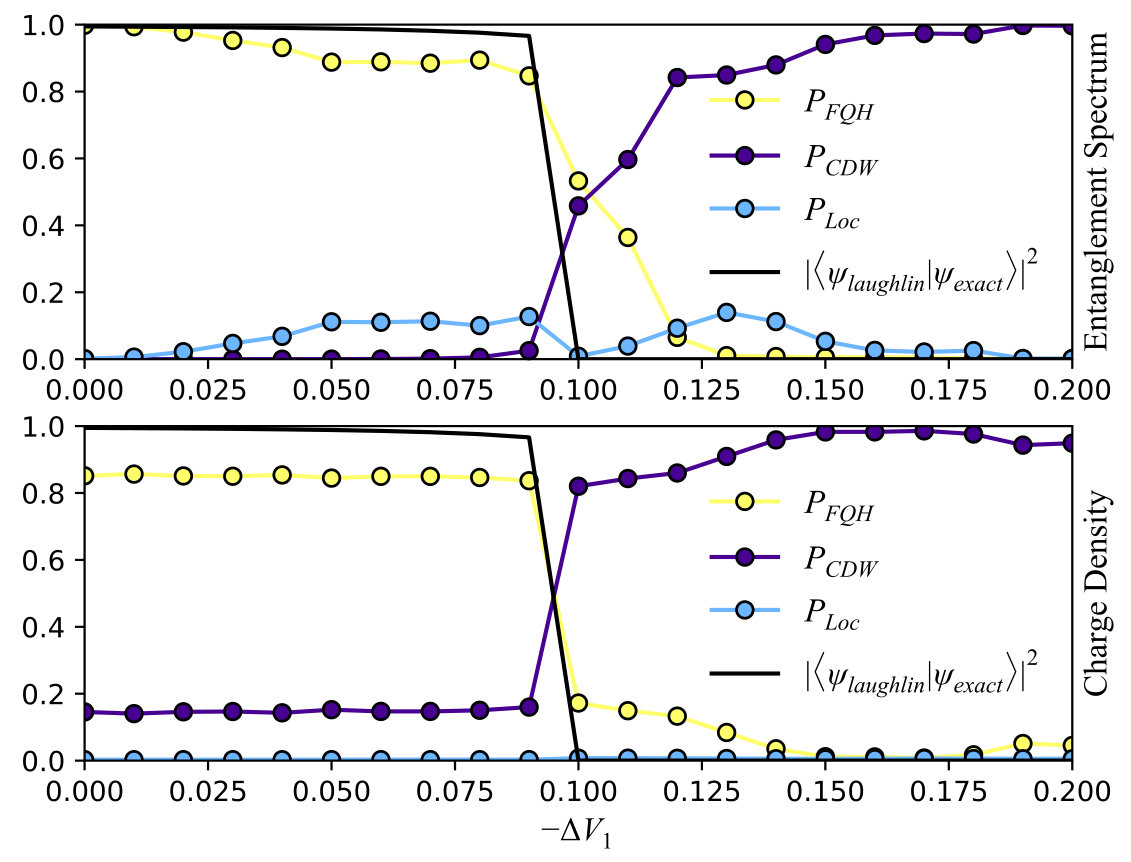 Figure 3
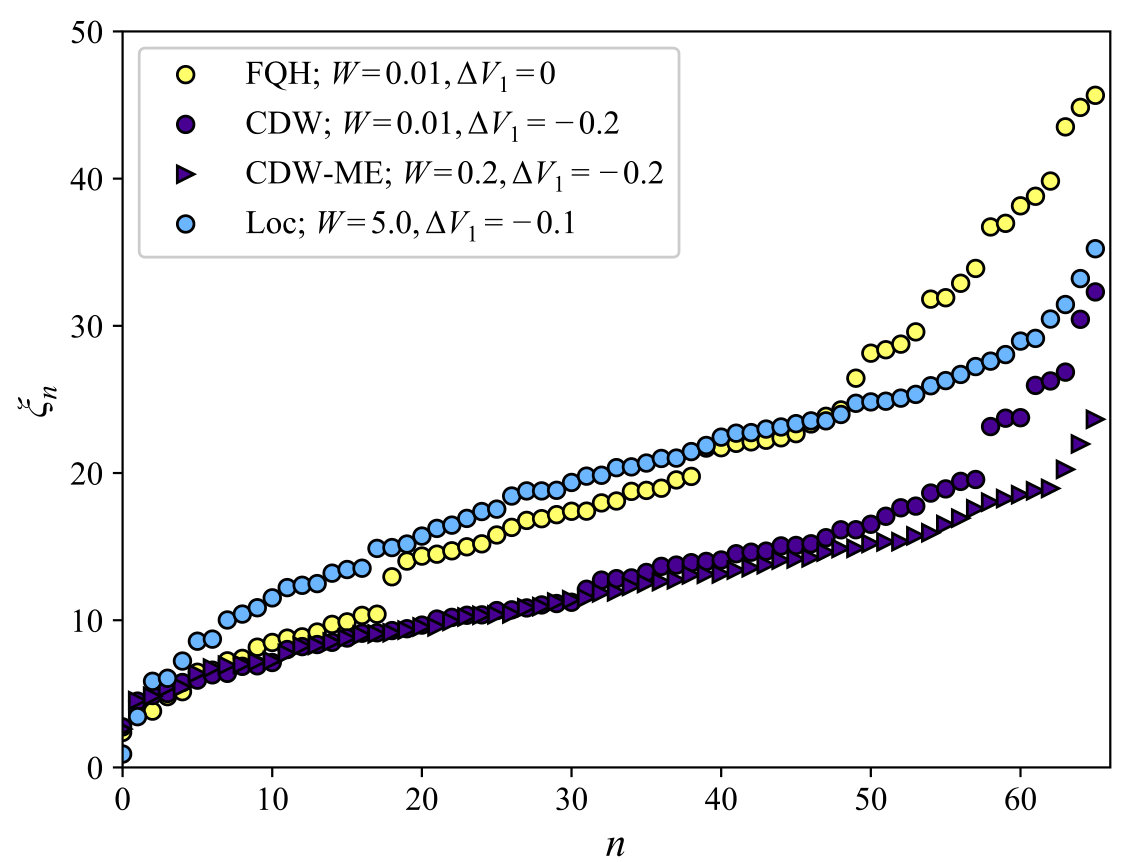 Figure 4
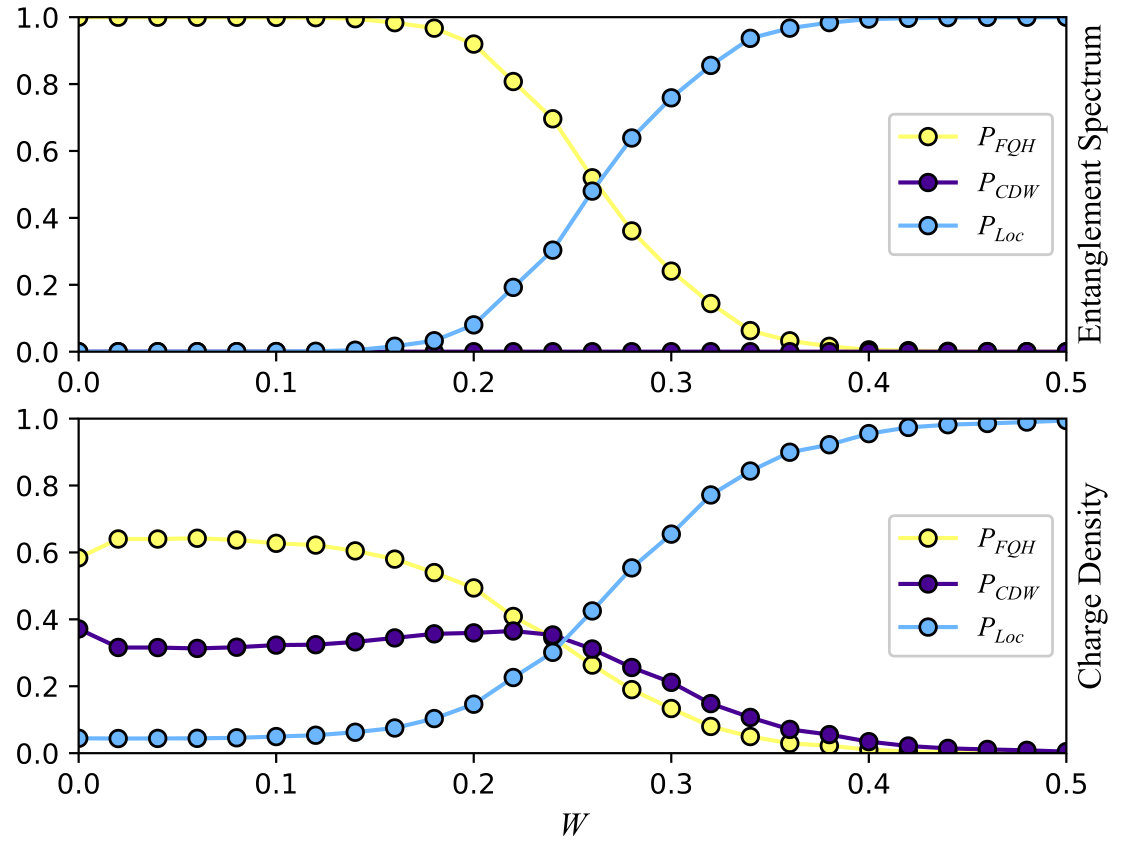 Figure 5
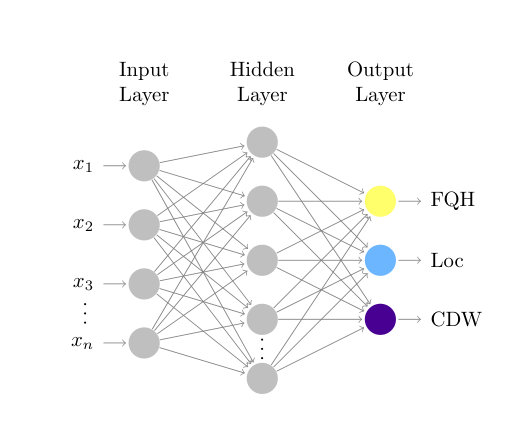 Figure 6
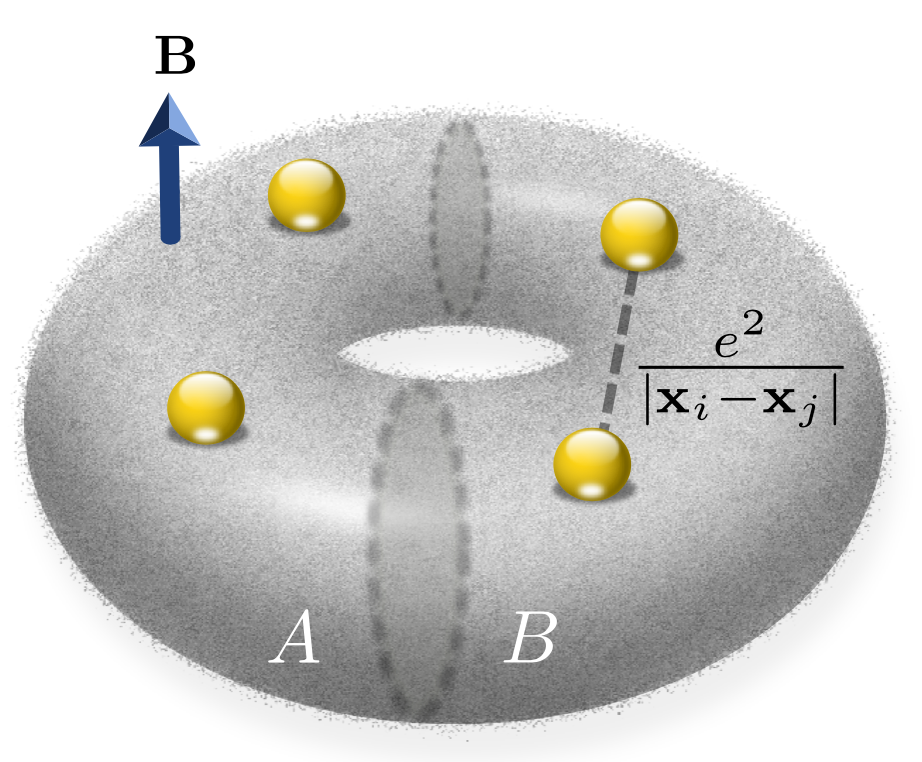 Figure 7
Peer Reviews
No public reviews on file for this paper yet. If you reviewed it on a platform where reviews are public (OpenReview, ICLR, NeurIPS, ICML), you can paste yours below so the community can read it here.
Videos
No videos yet. Explain this paper in a talk, walkthrough, or lecture? Add one.
Multi-faceted machine learning of
competing orders in disordered interacting systems
Michael Matty1
Yi Zhang1
Zlatko Papić2
Eun-Ah Kim1
1Department of Physics, Cornell University, Ithaca, New York 14853, USA
2School of Physics and Astronomy, University of Leeds, Leeds LS2 9JT, UK
Abstract
While the non-perturbative interaction effects in the fractional quantum Hall regime can be readily simulated through exact diagonalization, it has been challenging to establish a suitable diagnostic that can label different phases in the presence of competing interactions and disorder. Here we introduce a multi-faceted framework using a simple artificial neural network (ANN) to detect defining features of a fractional quantum Hall state, a charge density wave state and a localized state using the entanglement spectra and charge density as independent input. We consider the competing effects of a perturbing interaction ( pseudopotential ), a disorder potential , and the Coulomb interaction to the system at filling fraction . Our phase diagram benchmarks well against previous estimates of the phase boundary using conventional measures along the and axes, the only regions where conventional approaches have been explored. Moreover, exploring the entire two-dimensional phase diagram for the first time, we establish the robustness of the fractional quantum Hall state and map out the charge density wave micro-emulsion phase wherein droplets of charge density wave region appear before the charge density wave is completely disordered. Hence we establish that the ANN can access and learn the defining traits of topological as well as broken symmetry phases using multi-faceted inputs of entanglement spectra and charge density.
I Introduction
Using the fact that neural network based machine learning can effectively distill relevant information and compactly represent a complex function, there have been recent efforts to efficiently (i) obtain phase diagrams Broecker et al. (2017a, b); Zhang and Kim (2017); Zhang et al. (2017); Wang (2016); Carleo and Troyer (2017); Carrasquilla and Melko (2017); van Nieuwenburg et al. (2017); Beach et al. (2018); Ch’ng et al. (2017, 2018); Deng et al. (2017a); Liu and van Nieuwenburg (2018); van Nieuwenburg et al. (2018); Ohtsuki and Ohtsuki (2016); Schindler et al. (2017); Wetzel and Scherzer (2017); Wetzel (2017); Yoshioka et al. (2018); Venderley et al. (2018) and (ii) represent wave functions Cai and Liu (2018); Carleo and Troyer (2017); Chen et al. (2018); Deng et al. (2017b, a); Gao and Duan (2017); Huang and Moore (2017); Liu et al. (2017); Nomura et al. (2017); Schmitt and Heyl (2018); Torlai et al. (2018) of many-body quantum systems. Machine learning based phase detection is a particularly promising direction for phases outside the traditional ”knowledge compression scheme” – the local order parameter. Topological phases form a central class of such phases. Though there has been recent progress in using machine learning for topological phases Beach et al. (2018); Deng et al. (2017a); Sun et al. (2018); Yoshioka et al. (2018); Ohtsuki and Ohtsuki (2016); Zhang et al. (2017); Zhang and Kim (2017); Zhang et al. (2018), these early efforts naturally centered around benchmarking the neural network based approaches to the conventional approaches on established problems by suppressing either disorder or interaction.
Here we turn to a strongly interacting two-dimensional electron gas (2DEG) in the fractional quantum Hall regime. 2DEG hosts a rich phase diagram in which topological order in various quantum Hall states competes against various forms of spontaneously broken symmetries. All this can only be observed in clean samples, which abundantly speaks to the key role of disorder. Such competition among interaction driven correlated states and disorder driven localized states is a common theme of all strongly correlated systems. Yet, 2DEG forms the simplest system in which such competition can be studied experimentally, with the magnetic field quenching the kinetic energy. Nevertheless theoretical study is challenging since the traditional diagnostic of the fractional quantum Hall state requires translational symmetry.
Previous works Sheng et al. (2003); Wan et al. (2005); Liu and Bhatt (2017, 2016) on the effect of disorder on the FQH effect focused on establishing a measure that can assess the robustness of the topological order. This was already a challenging task because most measures of topological order are naturally suited to uniform systems with translation invariance. The resulting measures of the total Chern numberSheng et al. (2003); Wan et al. (2005) and the slope of the entanglement entropy as a function of average disorder strengths Liu and Bhatt (2017, 2016) are compelling. Nevertheless, they are computationally costly. More importantly, these measures are mostly geared towards a bi-partite phase diagram consisting of a FQH state and a localized, insulating state (for example, the quantization of the Chern number would not distinguish between different incompressible phases realized at the same filling factor). Here we study the problem including both disorder and a competing interaction from two complementary perspectives: the entanglement spectrum (ES) and the real space charge density (CD).
Motivated by the fruitful use of entanglement spectra in clean systems with topological order Li and Haldane (2008); Thomale et al. (2010); Qi et al. (2012), efforts sought indication of the robustness of the topological state within the entanglement spectrum in the presence of disorder Prodan et al. (2010); Liu and Bhatt (2017, 2016). The ES is a set of eigenvalues of the reduced density matrix, characterizing a subsystem of a quantum system Li and Haldane (2008). Traditionally, the levels in the ES are organized according to a symmetry quantum number (typically, linear or angular momentum), which reveals characteristic structures in translationally invariant systems. However, such an organizing principle is lost with the introduction of disorder, and one must resort to studying the distribution of the entanglement spectrum levels as previously used, e.g., in the studies of many-body localization Geraedts et al. (2016); Serbyn et al. (2016). Alternatively, the real space charge density provides a two-dimensional image of the wave function that can characterize phases through its spatial profile (for example, the charge density is uniform in the FQH liquid state). However, in the presence of interactions it becomes non-trivial to assign phase boundaries simply from images of the charge density. Thus, competing interactions and disorder necessitate an approach that can discover distinguishable structure in multiple facets: the ES and the CD.
In this paper we use supervised machine learning on ES and CD to obtain the phase diagram of three competing phases tuned by interaction and disorder strength: FQH, charge density wave (CDW), and a localized state. This approach is versatile and numerically efficient. It can be generalized to incorporate other phases, system geometries, and disorder models. We start by briefly reviewing the standard theoretical model for the FQH system in the presence of Gaussian white noise disorder in Sec. II. In Sec. III we introduce our method based on ANN. Our results are presented in Sec. IV. We conclude with a summary of our results and open questions in Sec. V.
II Model
We consider a system of electrons on a torus in the presence of a magnetic field, see Fig. 1. The area of the torus is set by the magnetic flux, in units of the magnetic area , where is the magnetic length. We set the aspect ratio of the torus to be unity, corresponding to a square unit cell with periodic boundary conditions. The electron density is held fixed at one electron per three magnetic fluxes, i.e., the filling fraction is .
The system is described by the Hamiltonian
[TABLE]
where represents the Coulomb interaction between the electrons,
[TABLE]
and the ’s denote the positions of the electrons in the 2D plane. We emphasize that all the terms in the Hamiltonian are explicitly projected to the lowest Landau level using standard techniques Fano et al. (1986); Prange and Girvin (1990). Physically, this corresponds to taking the limit of an infinite magnetic field, which is an excellent approximation for most purposes Prange and Girvin (1990). In addition to the Coulomb potential, we consider two physical perturbations:
[TABLE]
where denotes the perturbation by a short-range (contact) interaction between the electrons,
[TABLE]
also known as the Haldane pseudopotential Haldane (1983). The strength of this perturbation is denoted by the overall prefactor . Physically, this perturbation could arise due to effects of finite thickness of the 2D electron gas, excitations to other Landau levels, etc. On the other hand, the quenched disorder potential is denoted by a (one-body) term . We model disorder as Gaussian white noise Wan et al. (2005) randomly distributed with mean value [math] and width in real space, i.e.
[TABLE]
The important feature for our purposes, which is shared with other common disorder models such as finite-range scatterers or correlated impurity potentials, is that the disorder potential breaks magnetic translation invariance, thus we do not have a good quantum number to classify the many-body states.
We anticipate three phases in the parameter space of the above model. First, we expect the Laughlin FQH state Laughlin (1983) in the absence of and Haldane and Rezayi (1985). Second, decreasing the pseudopotential lowers the energy of the finite wave vector magnetoroton excitation Girvin et al. (1986), driving a transition to a topologically trivial CDW state at large enough Haldane and Rezayi (1985). Finally, increasing the characteristic strength of the disorder eventually leads to a localized state Wan et al. (2005). Nevertheless, mapping out the phase diagram in the space of with these competing tendencies requires not only a numerical study but more importantly a new diagnostic.
III Method
We use an artificial neural network (ANN) to diagnose structures in the ES and CD data characteristic of each phase. In particular, we expect that the ANN will learn to distinguish the universal part of the ES characterizing the topological FQH from the topologically trivial phases and the different entanglement entropy of the trivial phases distinguished by spontaneously versus explicitly broken continuous symmetry Metlitski and Grover (2015). From the CD perspective, we expect the network to distinguish zero (FQH), one (CDW), and two (localized state) broken translational symmetries.
To obtain the ES and CD data, we exactly diagonalize the full Hamiltonian in Eq. (1) for each point in the two-dimensional parameter space and each disorder configuration. From the pure many-body ground state of the system , we obtain the bi-partite ES, , by partitioning the system in the orbital space Li and Haldane (2008) , as indicated in Fig. 1. We note that, because of Gaussian localization of single-particle orbitals in a Landau level, the partitioning in orbital space roughly corresponds to an actual partition in real space. Having fixed the choice of the partition, we then perform the standard Schmidt decomposition , where the vectors form an orthonormal basis for the subsystem (and similarly for subsystem ). Note that the von Neumann (entanglement) entropy can be directly computed from via the expression . On the other hand, the charge density is defined as , where is the electron field operator, and we evaluate the density on a mesh of evenly spaced points .
In one case, we use the obtained ES data as input to our ANN as a rank ordered list of numbers . We do not consider reduced density matrix eigenvalues below numerical precision, instead setting the corresponding to zero. In the other case, we use the CD data as input to our ANN as a vectorized two-dimensional image. The architecture of our choice is a fully-connected feed-forward artificial neural network with a single hidden layer containing 50 neurons for processing the ES data, and two hidden layers with 200 and 50 neurons for the CD data, see Fig. 2. Each neuron processes the inputs according to the weight matrix and the bias vector specific to that neuron where the rectified linear activation function is given by . The sum of the neural outputs is normalized via a softmax layer.
Given the theoretical insight, we train the neural network using data from disorder configurations at one or two training points inside each phase, as detailed below. We use cross-entropy as the cost function for stochastic gradient descent. Once the network is trained to accuracy, we fix the weights and biases and let the ANN recognize the phase associated with the rest of the phase space by averaging the neuron outputs from 500 disorder configurations for each phase space point.
IV Results
Our multifaceted approach reveals new insight into the characteristics of topological, symmetry-breaking, and localized phases and their competition. The full phase diagram in shown in Fig. 3. This phase diagram was obtained for the system with electrons, with NN training points indicated by red crosses. Although the lack of symmetry prevents one from reaching large system sizes, we note that qualitatively similar phase diagrams are obtained for other values of . The phase diagram contains four distinct regions that have been labelled in Fig. 3. In order to develop some intuition behind the identification of these phases, it is instructive to also inspect the typical (i.e. from a single, arbitrary disorder configuration) CD and ES in each of the regions in the phase diagrams, which are shown in Figs. 4 and 5, respectively. We next discuss in detail each of the four phases in the diagram, and their transitions to neighboring phases.
IV.1 Identification of phases
First, we identify a robust region corresponding to topological order of the Laughlin state, indicated by the yellow color in Fig. 3. As the Laughlin state represents an incompressible liquid, we expect its CD to be spatially uniform, as indeed confirmed by Fig. 4(a). Furthermore, as the Laughlin phase is a gapped liquid, it remains stable for some finite amount of perturbations, either by softening of the interactions () or by disorder . For this region, the ANN output based on CD and ES perfectly match in identification of the phase boundary.
In the clean limit (), the system is expected to undergo a quantum phase transition from the FQH phase into a CDW phase upon increasing the magnitude of the pseudopotential perturbation Prange and Girvin (1990). Indeed, we can see in Fig. 3 that for weak disorder () and sufficiently negative , the ANN finds a phase transition based on both CD and ES facets of the data. The plot of the charge density in the large region Fig. 4(a) clearly shows a stripe CDW phase.
We now turn to the light purple region of Fig. 3 at intermediate disorder strength. At moderate disorder strength of , the long-range CDW (i.e., correlation length of the order of the system size) is destroyed. Here the two facets of the data, CD and ES give us different insights. From the CD facet, the formation of large droptlets as shown in Fig. 4(c) is recognized by the ANN to be similar to the CD distribution of localized phase in Fig. 4(d). But clearly the distribution of charge in Fig. 4(c) is more organized to the extent that it is somewhat reminiscent of a crystalline CDW bubble phase Koulakov et al. (1996); Moessner and Chalker (1996); Haldane et al. (2000) that is usually discussed in the context of clean, fractionally filled higher Landau levels. However, considering the boundary conditions, the CD only exhibits two droplets and does not really match the description of a crystalline state with multiple electrons per site.
Further insight into this light purple region is afforded by looking at the ES facet. While the ANN assessment of the region based on the CD data was to identify it with the localized phase, this changes when the ES data is given. Actually, the ANN looking at the ES data identifies this region with the CDW phase. Looking at the plot of typical rank-ordered entanglement spectra shown in Fig. 5 it is clear that the ES of this intermediate disorder regime is distributed in a fashion quite similar to that of the CDW phase, especially at low entanglement energies. Hence, the comparison between the ANN assessment based on CD and that based on ES is that this region shares characteristics of both a heterogeneous state and a CDW state.
According to the Imry-Ma argumentImry and Ma (1975), the CDW order is expected to first break into droplets of CDW states of correlation length smaller than the system size. Although the stripe pattern is invisible in the CD distribution of this region in Fig. 4(c) due to the resolution of our calculation, the fact that the size of the droplets are such that they can contain several CDW wavelengths makes it plausible that the purple region is supporting a CDW-microemulsion (CDW-ME) rather than a featureless localized state. A new finding is that ANN can distinguish this state from a localized state, which is realized at even stronger disorder [see Fig. 4(d)], based on the ES facet. Our ANN is finding the ES structure of this CDW-ME to be identifiable as that of the long-range CDW state, while the CD structure of the CDW-ME to be identifiable as that of localized state. This identification of the CDW-ME is a new diagnostic afforded by our multifaceted application of ANN.
IV.2 Phase transitions
We now examine in detail the transitions between the phases by studying one-parameter slices of our phase diagram in Fig. 3. This will provide us with further benchmarks against some results that are available in the literature, which have been obtained via more conventional diagnostics of quantum phase transitions varying only one of the two parameters of our phase space.
In the clean limit, a transition between a CDW phase and an FQH state is known to occur as a function of Prange and Girvin (1990). The cut along the axis is shown in Fig. 6(a), and it indeed reveals a sharp transition between the FQH output dominant region and the CDW output dominant region around . It is illuminating to contrast this neural network based detection of the phase transition to the conventional measures such as the wave function overlap with the Laughlin state, which is shown in Fig. 6(b). We observe that the overlap drops sharply to near zero at around the same value as well. Note that because we still have very weak but non-zero disorder () in Fig. 6, we present the overlap between equal amplitude superpositions of the three topologically degenerate Laughlin states and the three lowest energy eigenstates of the exact Hamiltonian, which are topologically degenerate in the FQH phase. The remarkable agreement between different diagnostics of the transition suggests that our neural network can accurately distinguish competing phases that are not related by symmetry, solely based on either the rank-ordered entanglement spectrum without reference to a good quantum number or the charge density.
Finally, we turn to the localization transition along the axis and pure Coulomb interaction (). The cut shown in Fig. 7 shows a broad transition around . In the case of the CD input (lower panel), we assess the threshold as in Ref. Venderley et al., 2018: at , the output from all three neurons is approximately , corresponding to a point of maximal confusion for a three neuron softmax layer. Unlike the CDW transition in the clean case, however, there is no rigorously established conventional criteria for this localization transition. Liu and Bhatt Liu and Bhatt (2017, 2016) have recently proposed tracking the finite-size scaling of the numerical derivative of the ground state entanglement entropy with respect to disorder strength, . This diagnostic (also used in Ref. Schliemann, 2011 for a bilayer quantum Hall system) puts the threshold at a much smaller disorder strength of . On the other hand, our threshold is consistent with the result found in Refs. Sheng et al., 2003; Wan et al., 2005 using the fluctuations in the total Chern number of the degenerate ground states on a torus which found .
V Conclusions
We have used supervised machine learning via ANN to study the disorder-interaction phase diagram involving three competing states: FQH, CDW, and localized state. Using multiple facets of the data (rank-ordered ES and CD), we have reproduced known results along the two axes of the phase diagram. In the weak disorder limit (), the ANN finds the phase transition between the FQH phase and the CDW phase around , which agrees with other estimates of the transition based on wave function overlap. In the Coulomb interaction limit (), the ANN finds the FQH phase to localize around disorder strength , roughly consistent with earlier findings using the total Chern number of the topologically degenerate ground states Sheng et al. (2003); Wan et al. (2005).
Furthermore, we have extended the previous results to the full two-dimensional phase diagram. We found the FQH phase to be more robust to the disorder than CDW, as is expected from the fact that FQH is a topologically ordered state and CDW should be sensitive to disorder. At the same time, using the rank-ordered ES and CD as two independent facets of the computational data revealed the new regime of CDW-ME which has droplets of CDW with CDW correlation length less than the system size that nevertheless has the same entanglement structure as the CDW phase.
Our study also shows that the ES can serve as a diagnostic of phase transitions in the case of competing interaction and disorder when the relevant phases are distinguished by entanglement properties, even in the absence of a traditional organizing principle for the ES. Moreover we have seen that the ES contains structure that understands the formation of multiple CDW droplets as being similar to a single CDW, as opposed to just recognizing symmetry breaking, which appears to be the only structure learned from the CD.
A distinct advantage of the ML method is its numerical efficiency: it only requires a large number of disorder configurations at the points of neural network training, whereas interpolation can be performed by averaging over far fewer (e.g. 500 at each interpolation point compared to several thousand at each training point). There is also no need to search through the entirety of parameter space to locate a phase transition: it is found directly by interpolating between the neural network training points. This is especially advantageous in the case of a multidimensional parameter space. Note also that this method is not tied to any particular system geometry or disorder model. When studying the ground state of systems with competing interactions and disorder, the success of supervised machine learning in studying transitions between the FQH, CDW, and localized states supports the search for diagnostic quantities that distinguish the relevant phases that can be understood via machine learning without needing to be understood by humans.
VI Acknowledgements
We thank Jordan Venderley, Simon Trebst, Roger G. Melko, Zhao Liu and Nicolas Regnault for useful discussions. E-AK acknowledges DOE support under Award DE-SC0010313 and Award DOE DE-SC0018946 as well as Simons Fellow in Theoretical Physics Award 392182. YZ acknowledge support from the Bethe Postdoctoral Fellowship and from the W.M. Keck Foundation. ZP acknowledges support by EPSRC grant EP/R020612/1. Statement of compliance with EPSRC policy framework on research data: This publication is theoretical work that does not require supporting research data. The authors thank KITP supported by NSF grant NSF PHY-1748958, for its hospitality during the initial stage of the collaboration.
The reference list from the paper itself. Each links out to its DOI / PubMed record.
- 1Broecker et al. (2017 a) P. Broecker, J. Carrasquilla, R. G. Melko, and S. Trebst, Scientific Reports 7 , 8823 (2017 a) . · doi ↗
- 2Broecker et al. (2017 b) P. Broecker, F. F. Assaad, and S. Trebst, ar Xiv preprint (2017 b).
- 3Zhang and Kim (2017) Y. Zhang and E.-A. Kim, Phys. Rev. Lett. 118 , 216401 (2017) . · doi ↗
- 4Zhang et al. (2017) Y. Zhang, R. G. Melko, and E.-A. Kim, Phys. Rev. B 96 , 245119 (2017) . · doi ↗
- 5Wang (2016) L. Wang, Phys. Rev. B 94 , 195105 (2016) . · doi ↗
- 6Carleo and Troyer (2017) G. Carleo and M. Troyer, Science 355 , 602 (2017) . · doi ↗
- 7Carrasquilla and Melko (2017) J. Carrasquilla and R. G. Melko, Nature Physics 13 , 431 EP (2017) . · doi ↗
- 8van Nieuwenburg et al. (2017) E. P. L. van Nieuwenburg, Y.-H. Liu, and S. D. Huber, Nature Physics 13 , 435 EP (2017) . · doi ↗