A New Method to Measure Star Formation Rates in Active Galaxies Using Mid-infrared Neon Emission Lines
Ming-Yang Zhuang (1, 2), Luis C. Ho (1, 2), Jinyi Shangguan, (3) ((1) KIAA, PKU (2) DoA, PKU (3) MPE)

TL;DR
This paper introduces a new method to accurately measure star formation rates in active galaxies by using mid-infrared neon emission lines, accounting for AGN contamination.
Contribution
It develops a photoionization model to separate AGN and star formation contributions in neon lines, improving SFR diagnostics in active galaxies.
Findings
Neon lines effectively trace SFR in active galaxies.
AGN contribution to neon lines can be estimated using [NeV].
Neon-based SFRs agree well with independent measurements.
Abstract
The star formation rate (SFR) is one of the most fundamental parameters of galaxies, but nearly all of the standard SFR diagnostics are difficult to measure in active galaxies because of contamination from the active galactic nucleus (AGN). Being less sensitive to dust extinction, the mid-infrared fine-structure lines of [NeII] 12.81 micron and [NeIII] 15.56 micron effectively trace the SFR in star-forming galaxies. These lines also have the potential to serve as a reliable SFR indicator in active galaxies, provided that their contribution from the AGN narrow-line region can be removed. We use a new set of photoionization calculations with realistic AGN spectral energy distributions and input assumptions to constrain the magnitude of [NeII] and [NeIII] produced by the narrow-line region for a given strength of [NeV] 14.32 micron. We demonstrate that AGNs emit a relatively restricted…
Click any figure to enlarge with its caption.
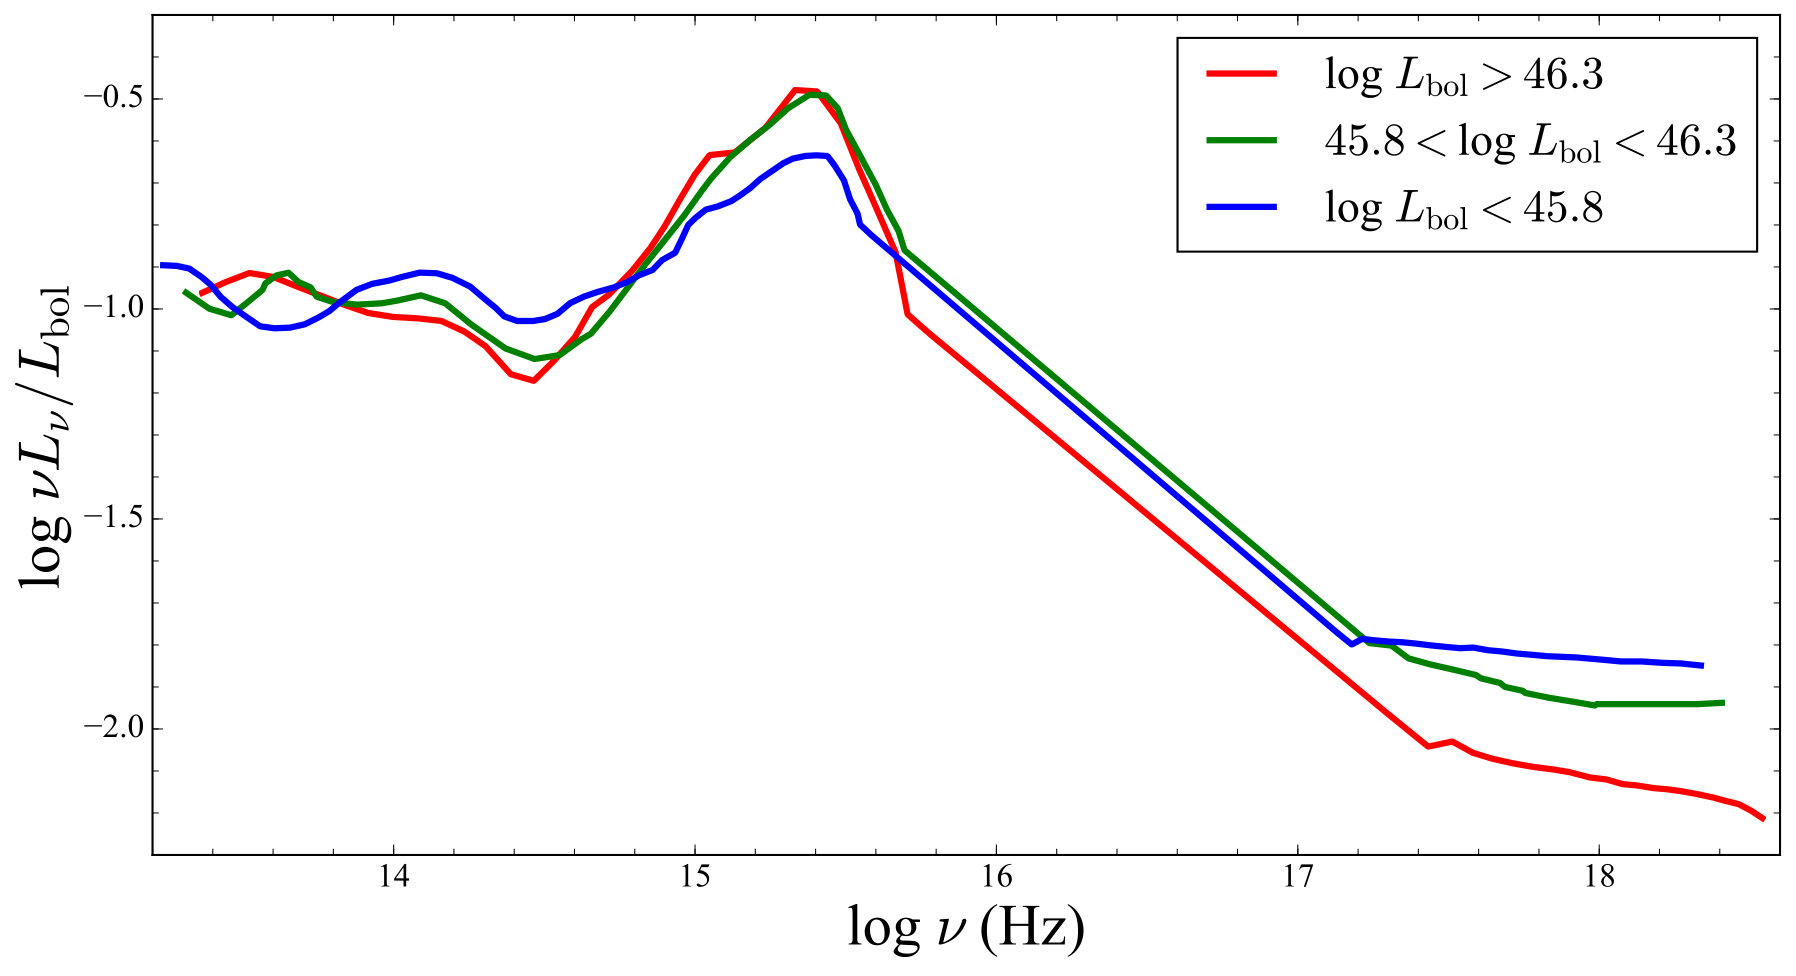 Figure 1
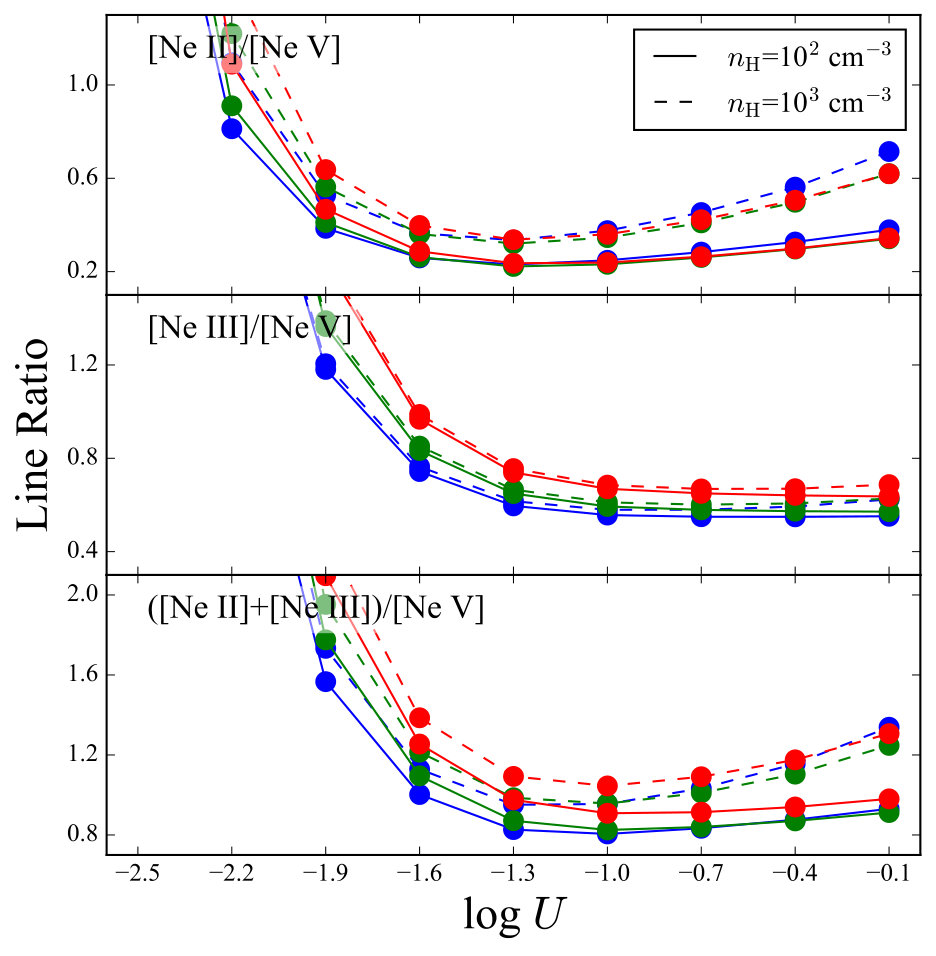 Figure 2
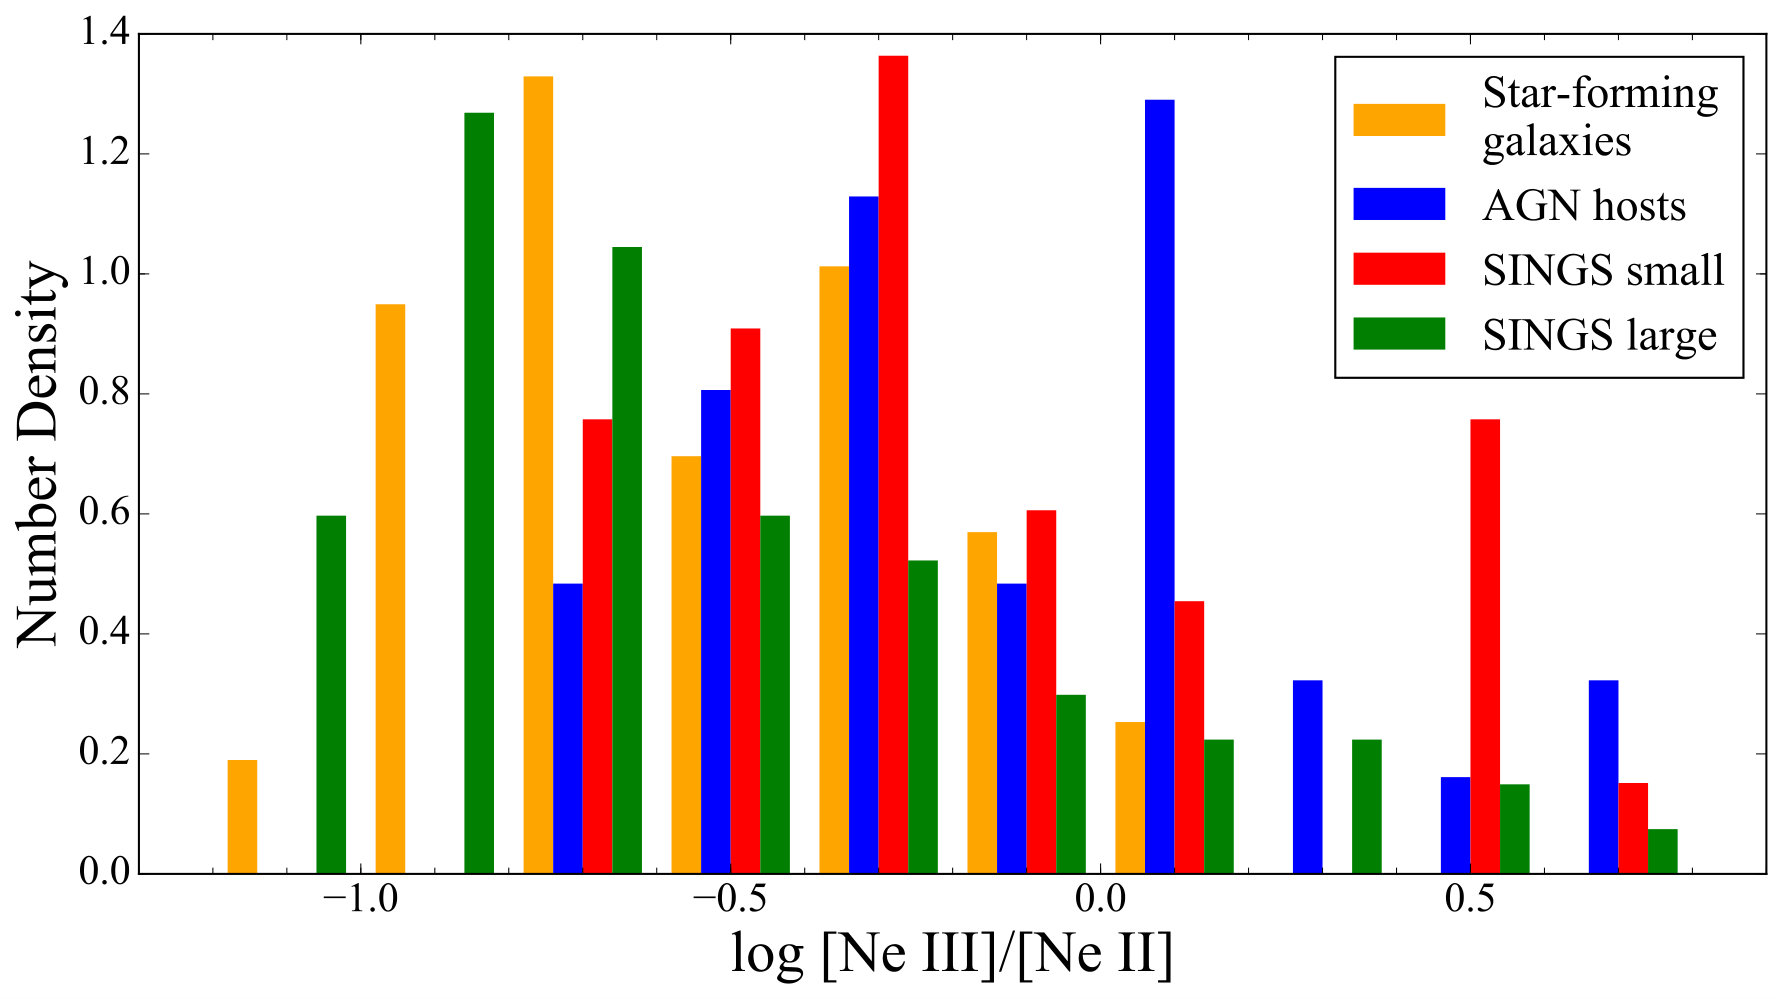 Figure 3
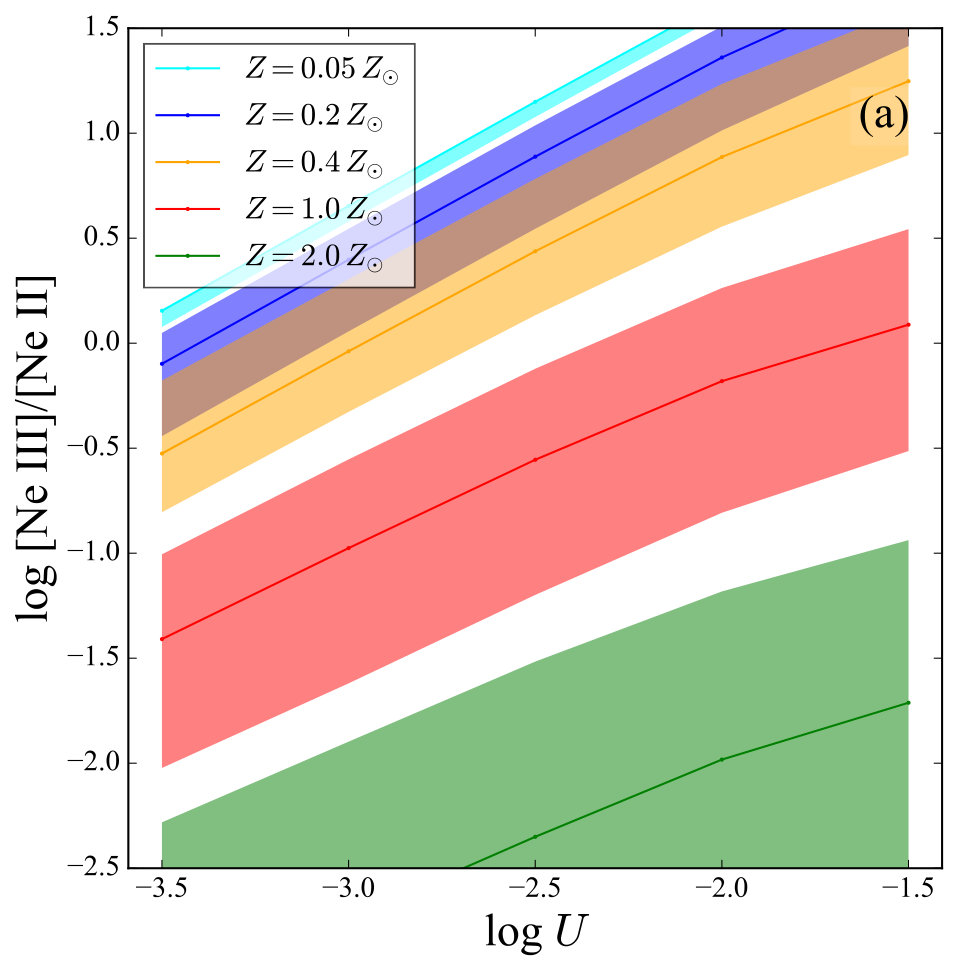 Figure 4
 Figure 5
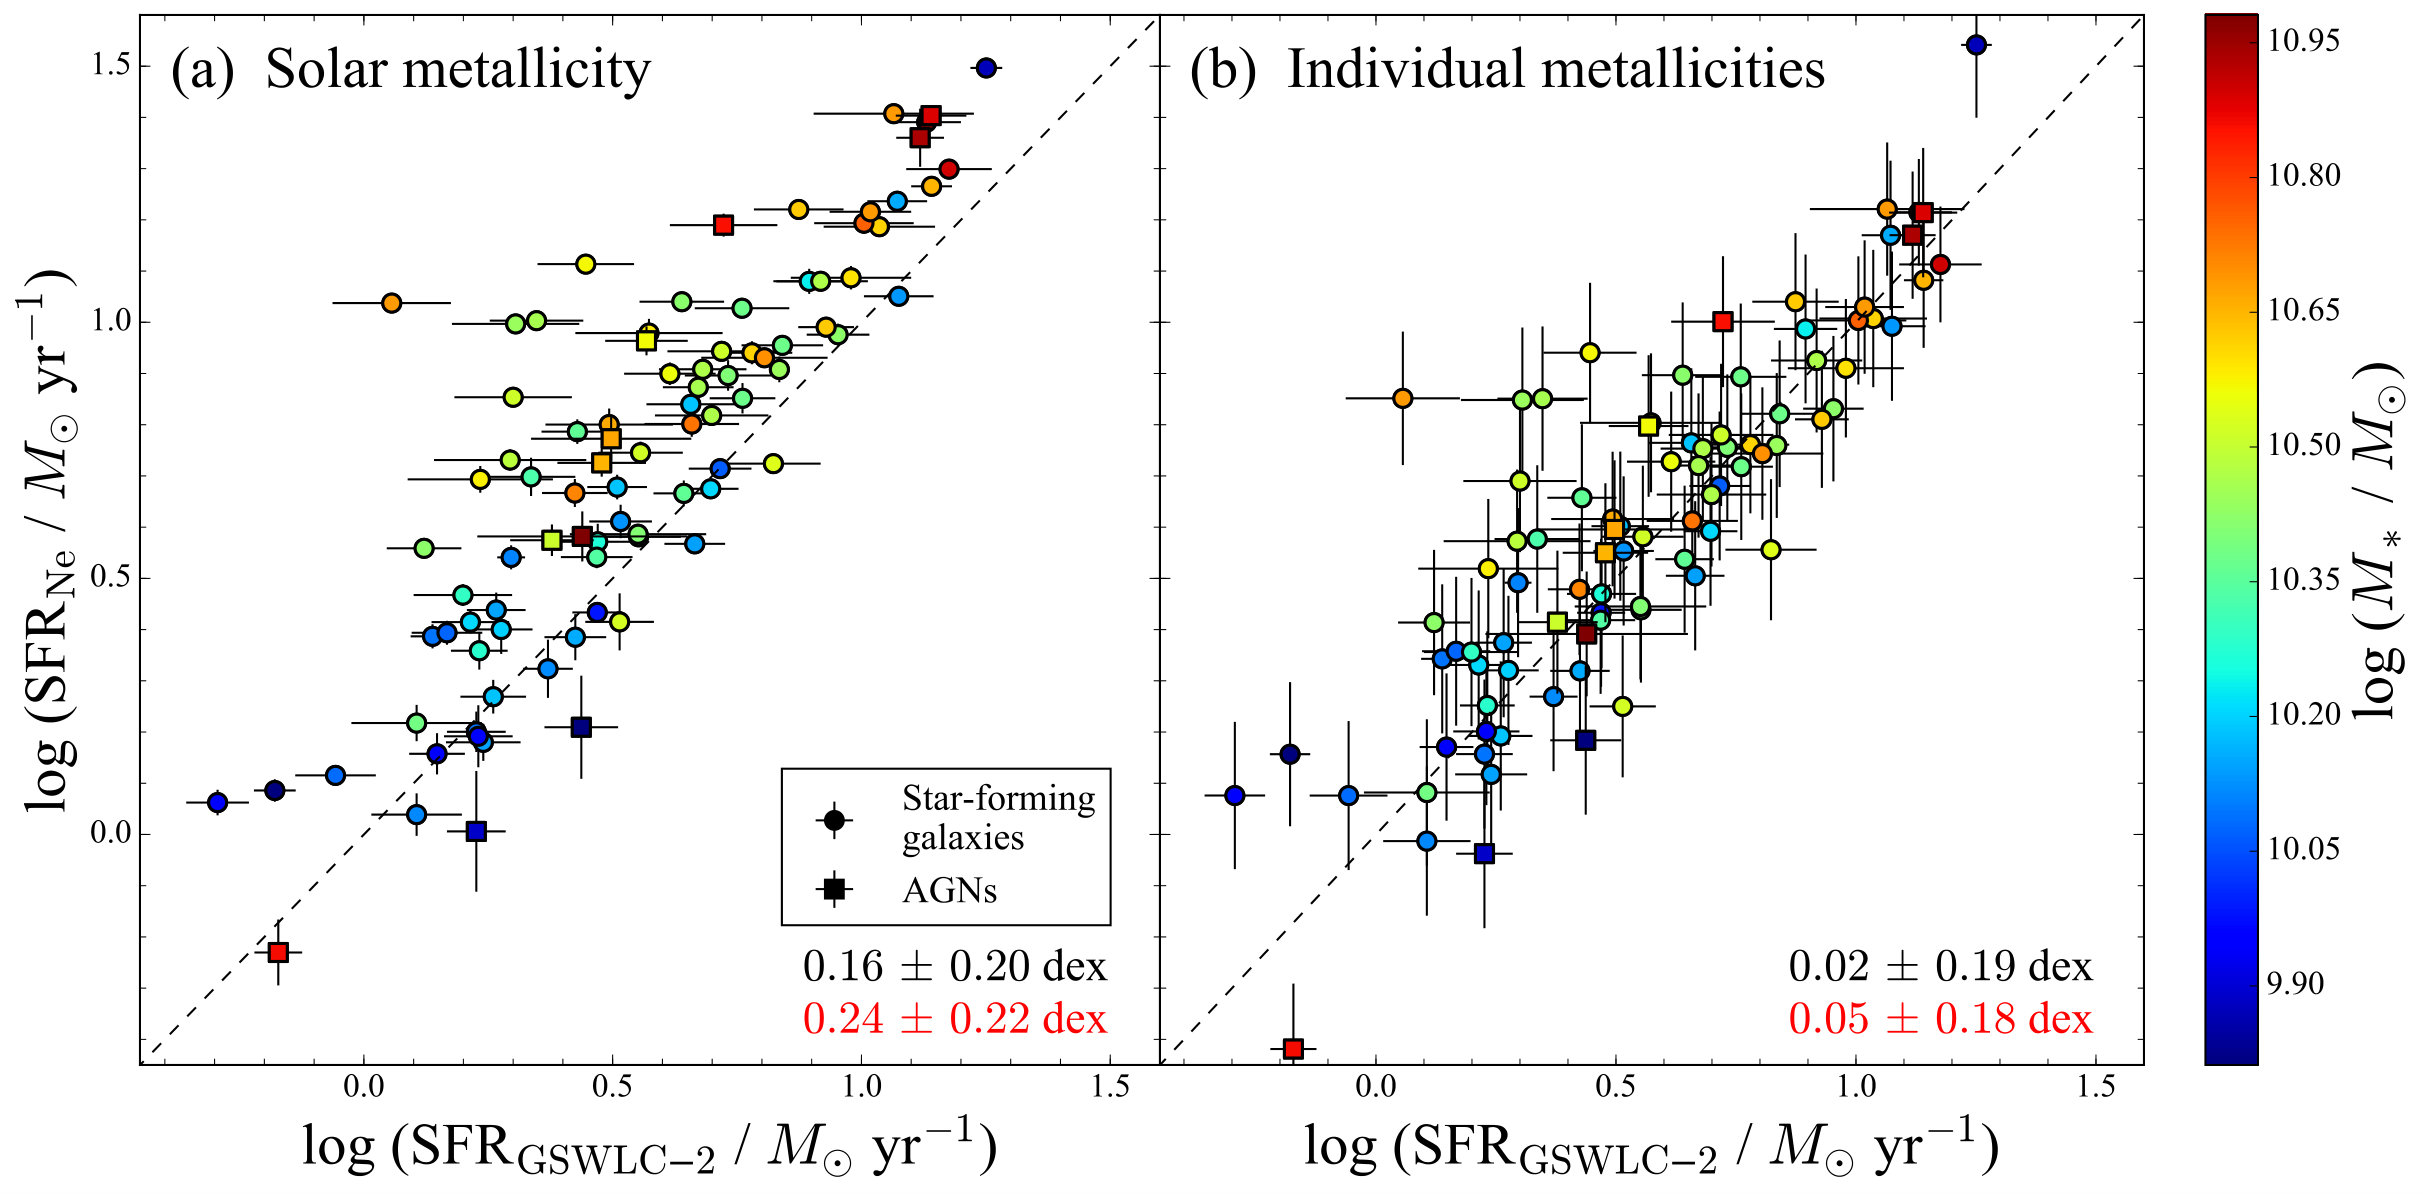 Figure 6
Peer Reviews
No public reviews on file for this paper yet. If you reviewed it on a platform where reviews are public (OpenReview, ICLR, NeurIPS, ICML), you can paste yours below so the community can read it here.
Videos
No videos yet. Explain this paper in a talk, walkthrough, or lecture? Add one.
A New Method to Measure Star Formation Rates in Active Galaxies Using
Mid-infrared Neon Emission Lines
Kavli Institute for Astronomy and Astrophysics, Peking University, Beijing 100871, China
Department of Astronomy, School of Physics, Peking University, Beijing 100871, China
Kavli Institute for Astronomy and Astrophysics, Peking University, Beijing 100871, China
Department of Astronomy, School of Physics, Peking University, Beijing 100871, China
Max-Planck-Institut für extraterrestrische Physik, Gießenbachstr. 1, D-85748 Garching, Germany
Abstract
The star formation rate (SFR) is one of the most fundamental parameters of galaxies, but nearly all of the standard SFR diagnostics are difficult to measure in active galaxies because of contamination from the active galactic nucleus (AGN). Being less sensitive to dust extinction, the mid-infrared fine-structure lines of [Ne ii] 12.81 µm and [Ne iii] 15.56 µm effectively trace the SFR in star-forming galaxies. These lines also have the potential to serve as a reliable SFR indicator in active galaxies, provided that their contribution from the AGN narrow-line region can be removed. We use a new set of photoionization calculations with realistic AGN spectral energy distributions and input assumptions to constrain the magnitude of [Ne ii] and [Ne iii] produced by the narrow-line region for a given strength of [Ne v] 14.32 µm. We demonstrate that AGNs emit a relatively restricted range of [Ne ii]/[Ne v] and [Ne iii]/[Ne v] ratios. Hence, once [Ne v] is measured, the AGN contribution to the low-ionization Ne lines can be estimated, and the SFR can be determined from the strength of [Ne ii] and [Ne iii]. We find that AGN host galaxies have similar properties as compact extragalactic H ii regions, which indicates that the star formation in AGN hosts is spatially concentrated. This suggests a close relationship between black hole accretion and nuclear star formation. We update the calibration of [Ne ii] and [Ne iii] strength as a SFR indicator, explicitly considering the effects of metallicity, finding very good relations between Ne fractional abundances and the [Ne iii]/[Ne ii] ratio for different metallicities, ionization parameters, and starburst ages. Comparison of neon-based SFRs with independent SFRs for active and star-forming galaxies shows excellent consistency with small scatter ( dex).
galaxies: active — galaxies: ISM — galaxies: nuclei — galaxies: starburst — quasars: general
††journal: ApJ
1 Introduction
The empirical correlations between the masses of central black holes and the properties of their host galaxies (e.g., Gebhardt et al., 2000; Ferrarese & Merritt, 2000; Kormendy & Ho, 2013) have led to the widely accepted idea that the growth of central black holes must be connected to galaxy evolution (e.g., Richstone et al., 1998; Ho, 2004; Di Matteo et al., 2005; Bower et al., 2006; Fanidakis et al., 2011; Heckman & Best, 2014). Discussions of the coevolution of active galactic nuclei (AGNs) and their hosts usually takes two forms: (1) the weak form: galaxies affect the growth of black holes by controlling AGN accretion and merging via global, galaxy-wide processes; (2) the strong form: black holes control galaxy properties via energy and momentum feedback into their large-scale environment (Alexander & Hickox, 2012; Fabian, 2012; Kormendy & Ho, 2013). Studying the growth of black holes and their host galaxies is the key to understanding this coevolution. From an observational point of view, one of the major challenges is to measure the star formation rate (SFR) of AGN host galaxies.
A number of methods to obtain precise SFRs have been developed for star-forming galaxies, including diagnostics involving the ultraviolet (UV) and infrared (IR) continuum, as well as emission-line strengths that trace the budget of ionizing photons from massive stars (see Kennicutt 1998, for a review). Unfortunately, none of these methods can be applied unambiguously to active galaxies. AGNs emit copious ionizing and high-energy photons across its broad-band spectral energy distribution (SED), which greatly affect the ionization balance of the line-emitting gas exposed to it. This compromises most of the traditional SFR diagnostics, if not rendering them essentially useless. For instance, photoionization by a central AGN source produces strong hydrogen recombination lines (e.g., H) and forbidden lines (e.g., [O ii] 3727). In extreme cases, the narrow-line region (NLR) of the AGN can occupy the entire extent of the host galaxy (Greene et al., 2011). Dust grains, on circumnuclear (torus) scales and beyond, absorb and reprocess high-energy photons from the nucleus, generating thermal radiation across a broad IR spectrum.
Neon shares a nucleosynthetic history similar to that of oxygen, and is the third most abundant metal in the interstellar medium next to oxygen and carbon. With an ionization potential of 21.56 eV, [Ne ii] 12.81 µm acts as one of the primary coolants in H ii regions. In environments of lower metallicity, [Ne iii] 15.56 µm, which has an ionization potential of 40.96 eV, becomes more dominant. These mid-IR neon lines suffer significantly less extinction than conventional UV and optical transitions. Ho & Keto (2007) show that the sum of [Ne ii] and [Ne iii] correlates tightly with the far-IR luminosity and Br luminosity in H ii regions and star-forming galaxies, and hence can be used as an excellent tracer of star formation. However, as the NLR of AGNs can also produce [Ne ii] and [Ne iii], these low-ionization lines alone cannot serve as robust indicators of the SFR in active galaxies. Fortunately, the ionization potential of 97.12 eV for [Ne v] 14.32 µm, which lies sandwiched between [Ne ii] and [Ne iii], is sufficiently high that, under almost all circumstances, it can be uniquely attributed to AGN photoionization alone (e.g., Armus et al., 2007). The only exception might be environments in which fast shocks contribute to the excitation of the gas (e.g., Moy & Rocca-Volmerange, 2002; Randall et al., 2011). Hence, so long as [Ne v] is visible, we can be reasonably confident that an AGN is present111The converse is not true. The absence of [Ne v] does not mean that there is no AGN, for the AGN can be of low ionization (e.g., low-ionization nuclear emission-line regions), as typifies systems with low mass accretion rates (Ho, 2008, 2009).
Whenever all three mid-IR neon lines are detected, can we estimate the amount of [Ne ii] and [Ne iii] emission expected from AGN photoionization, given the observed strength of [Ne v]? As we know that [Ne v] can only be produced by AGNs, if we can reliably use theoretical calculations to bracket the level of the lower-ionization transitions associated with [Ne v], we can ascertain whether there is any “excess” [Ne ii] and [Ne iii] emission beyond that expected from the NLR, which then can be attributed to star formation. This strategy closely follows that of Ho (2005), who proposed a method of estimating SFRs in AGNs based on [O ii] 3727, using [O iii] 5007 to predict the relative strength of [O ii] 3727 expected from photoionization in high-ionization AGNs (Kim et al., 2006).
Numerous attempts have been made to analyze the narrow-line spectrum of AGNs in the context of photoionization models (e.g., Ferland & Osterbrock, 1986; Ho et al., 1993; Groves et al., 2004a, 2006; Stern et al., 2014). This paper focuses on a limited goal: to use realistic AGN photoionization models to predict the maximum range of the strengths of [Ne ii] 12.81 µm and [Ne iii] 15.56 µm relative to [Ne v] 14.32 µm. We show that in the radiation pressure-dominated regime, AGNs produce a relatively stable, restricted range of mid-IR neon emission-line spectra, paving the way for an updated calibration of [Ne ii] and [Ne iii] as a new SFR indicator for active galaxies. Our neon-based SFRs show good consistency with independent SFRs based on SED fitting.
2 Photoionization Model
We perform photoionization calculations using the latest version (C17.01) of CLOUDY (Ferland et al., 2017). CLOUDY is designed to predict the observed spectrum of interstellar clouds by solving the equations of statistical and thermal equilibrium to predict their thermal, ionization, and chemical structure for a given set of input conditions.
2.1 Incident Radiation Field
Early photoionization models of AGNs typically assume a canonical power-law ionizing spectrum () with an IR and high-energy cutoff (e.g., Ferland & Osterbrock, 1986; Groves et al., 2004a). However, this estimation does not fully describe all the key features of the SED, including the “big blue bump,” whose peak and detailed shape in the far-UV and extreme-UV affect the line ratios studied here. To properly constrain the big blue bump, one must construct a composite SED by combining multi-wavelength data of objects covering a large range of redshift to ensure coverage of the rest-frame region shortward of 912 Å. Scott & Stewart (2014) assembled a large sample of 761 type 1 AGNs spanning a range of redshifts from 0.11 to 3.29, with data covering up to 19 photometric bands. Studying a subset of 231 objects with high-quality SEDs, they found that the peak of the big blue bump shifts slightly but systematically toward longer wavelengths with increasing redshift. Because luminosity correlates with redshift in this flux-limited sample, the systematic dependence of the SED on redshift translates into a dependence on luminosity. The peak of the big blue bump for low-, lower luminosity objects lies at 1100 Å, similar to that reported in Shang et al. (2005), who analyzed 17 AGNs with quasi-simultaneous spectrophotometry covering rest-frame Å. With increasing redshift or luminosity, the contribution of the UV to the bolometric luminosity increases, while X-rays become less important. This overall trend is consistent with simultaneous UV, optical, and X-ray observations that find that the relative flux between X-rays and UV decreases with increasing UV luminosity (e.g., Wu et al., 2012). As input incident radiation fields for our calculations, we choose three median SEDs from Scott & Stewart (2014) binned by bolometric luminosity: log (/erg s*-1*) 46.3, 45.846.3, and 45.8 (Figure 1). With increasing , the peak of the big blue bump shifts toward longer wavelength, and a greater fraction of the energy emerges in the UV relative to the X-rays.
2.2 Narrow-line Region Properties
We assume isobaric conditions with radiation pressure and thermal pressure mainly contributing to the total pressure. The NLR clouds have a plane-parallel geometry and coexist with dust grains (e.g., Radomski et al., 2003). We adopt the default solar metallicity abundances and dust depletion factors from CLOUDY C17.01222Values in Tables 7.1 and 7.8 of the CLOUDY documentation Hazy 1., except for the abundance of nitrogen, which is scaled to twice the solar value, following Kim et al. (2006). The composition and size distribution of the dust grains are similar to those of Orion. The size-resolved polycyclic aromatic hydrocarbons (PAHs) have the same size distribution as in Abel et al. (2008). We consider photoelectric heating of the gas by dust, which is very important in determining the temperature structure of the NLR (Dopita et al., 2002). The ionization parameter, defined as the dimensionless ratio of the incident ionizing photon density to the hydrogen density, , where is the flux of hydrogen ionizing photons per second, is the hydrogen density, and is the speed of light. We consider two initial values for the hydrogen density, and cm*-3*, which covers most of the values inferred for Seyfert galaxies based on the [S ii] ratio (Zhang et al., 2013). As we are interested in powerful AGNs with detected [Ne v] emission, sources with relatively high ionization parameter, we restrict our investigation to log to , in steps of 0.3 dex. This range of ionization parameters is typical of the NLR in classical Seyfert nuclei (e.g., Ho et al., 1993) and low-redshift type 2 quasars (Villar-Martín et al., 2008).
3 Results and Discussions
3.1 AGN Contribution to Mid-IR Neon Lines
Figure 2 shows the influence of the ionization parameter on the strengths of the low-ionization lines [Ne ii] and [Ne iii] relative to the high-ionization line [Ne v]. Remarkably, all the line ratios remain stable when log , with a scatter of , within the range of hydrogen densities and ionizing spectra considered in our model grid. This behavior is consistent with that of the dusty, radiation pressure-dominated isobaric photoionization models of Dopita et al. (2002), in which the ionization parameter-sensitive line ratio [O iii] /H shows only mild variation with in the regime of high . When (Stern et al., 2014), dust becomes the dominant source of opacity and effectively couples radiation pressure to gas pressure. Dust influences the temperature structure of the NLR via photoelectric heating and excitation of the high-ionization gas. Radiation becomes the dominant source of pressure contributing to the static gas pressure, and the gas density scales linearly with ionizing flux, making the local ionization parameter independent of the initial ionization parameter (Dopita et al., 2002). In any event, the line ratios depicted in Figure 2 are affected only mildly by the range of densities explored in our calculations. As shown in Dopita et al. (2002) and Stern et al. (2014), the small dispersion of derived for Seyferts suggests that the NLRs of most AGNs are radiation pressure-dominated. In the radiation pressure-dominated regime ( log ) and over the range of parameters investigated here, we find
[TABLE]
[TABLE]
[TABLE]
This indicates that AGNs that span typical NLR conditions (in terms of ionizing SED, ionization parameter, and density) emit a relatively restricted range of [Ne ii] and [Ne iii] for a given level of [Ne v]. Similar trends are found by Groves et al. (2006) and Stern et al. (2014). The absolute value of their line ratios differs somewhat from ours mainly because of the choice of different input ionizing spectra. As described in Section 2.1, our adopted incident radiation field is based on observed intrinsic SEDs of unobscured AGNs that span a wide range in bolometric luminosity.
The above results are welcomed news from the point of view of our primary science goal of using the low-ionization neon lines to estimate the SFR in AGN host galaxies. A stable [Ne ii]/[Ne v] and [Ne iii]/[Ne v] ratio from the NLR ensures that we can use the detected [Ne v] emission to forecast—and thereby subtract—the amount of [Ne ii] and [Ne iii] emission originating from the AGN, leaving the remainder, if any, to star formation. We stress, once again, that this method breaks down for low-ionization sources, which, by definition, exhibit weak high-ionization species compared to low-ionization transitions.
3.2 Star Formation in AGN Host Galaxies
In order to test the reliability of our results, we use the galaxy sample of LaMassa et al. (2012), which contains 33 AGNs with [Ne ii], [Ne iii], and [Ne v] detections and 79 star-forming galaxies with both [Ne ii] and [Ne iii] detections obtained from high-resolution spectra observed with the Spitzer/Infrared Spectrograph (IRS). We also augment this sample with 103 nuclear and extranuclear high-resolution IRS spectra from the Spitzer Infrared Nearby Galaxies Survey (SINGS; Dale et al., 2009), after excluding objects classified as AGNs and those lacking [Ne ii] or [Ne iii] detections.
Figure 3 shows the distribution of [Ne iii]/[Ne ii] for star-forming galaxies, AGN hosts, and emission-line regions extracted from SINGS. The ratios for the AGN host galaxies were obtained after subtracting the NLR contribution of the AGN using Equations 1 and 2. The SINGS sources are further divided into two subgroups: 34 targets with spectra extracted over a relatively small projected area of kpc2 (SINGS small), and 69 targets with a larger extraction area of 0.3 kpc2 (SINGS large). For star-forming galaxies, [Ne iii]/[Ne ii] spans , with a median value of 0.26. AGN hosts have a higher median of [Ne iii]/[Ne ii] = 0.66, but their distribution still largely overlaps with that of star-forming galaxies. Interestingly, the two subgroups of SINGS spectra show different distributions: objects extracted from a larger physical area tend to have [Ne iii]/[Ne ii] ratios similar to those of star-forming galaxies, while those extracted from smaller areas closely resemble AGN hosts. A Kolmogorov-Smirnov test of the distributions of [Ne iii]/[Ne ii] for AGN hosts and the “SINGS small” sample indicates that the null hypothesis that the two distributions are drawn from the same parent population cannot be rejected with a probability of 71.9%. The close similarity between the neon line ratios of AGN hosts and small-area SINGS extractions probably arises from the fact that both probe regions of higher ionization parameter. For the nearby SINGS galaxies, the slit width of the short-high module (47) only covers the central several hundred parsecs, thereby isolating the nuclear region, which most likely has higher than average ionization parameter, at the expense of the low-excitation gas from the outer regions.
As discussed in Section 4.1, three parameters affect the [Ne iii]/[Ne ii] ratio in a starburst system: metallicity, ionization parameter, and starburst age. Low metallicity, high ionization parameter, and younger starburst age enhance [Ne iii]/[Ne ii]. High values of [Ne iii]/[Ne ii] are observed in starbursts (e.g., Brandl et al., 2006) and blue compact dwarfs (e.g., Hunt et al., 2010). The [Ne iii]/[Ne ii] ratio in blue compact dwarfs generally exceeds 1, with extremes up to 18 (Lebouteiller et al., 2011). Like blue compact dwarfs, objects from the SINGS sample with [Ne iii]/[Ne ii] 2 also have sub-solar metallicity. However, the SINGS objects are generally not metal-poor; most have oxygen abundance that are at least solar [12+log(O/H) ] (Allende Prieto et al., 2001), indicating that high ionization parameter, not low metallicity, is responsible for their elevated [Ne iii]/[Ne ii]. As the metallicity of the NLR in most AGNs is times solar (Groves et al., 2004a, b; but see Ludwig et al., 2012), we conclude that the star-forming regions in AGN host galaxies are also characterized by high ionization parameters, presumably because they are similarly centrally concentrated.
The centrally concentrated star formation we infer from the large [Ne iii]/[Ne ii] ratios of AGN hosts is also supported by observations of PAHs in these systems. While commonly observed in star-forming galaxies, PAHs are not expected to survive the harsh radiation field of an AGN. Yet, PAHs are detected in a significant fraction of nuclear regions of Seyfert galaxies, pointing to the prevalence of compact central star formation in nearby active galaxies (Imanishi & Wada, 2004). Esquej et al. (2014) and Lutz et al. (2018) arrive at similar conclusions based on other evidence.
Our inference that star formation in AGN host galaxies occurs preferentially in their nuclear regions resonates with the notion that black hole accretion and star formation ultimately rely on a common source of gas supply, plausibly driven to the center of the galaxy by internal dynamical instabilities (e.g., a bar: Lynden-Bell, 1979; Bournaud & Combes, 2002) or galaxy-galaxy interactions and mergers (Springel et al., 2005; Hopkins et al., 2005; Hong et al., 2015).
4 Revisiting the Neon SFR Estimator
Ho & Keto (2007) first proposed a calibration for SFR based on the strength of the low-ionization mid-IR neon lines:
[TABLE]
where (in ) is the luminosity of [Ne ii] 12.81 µm and [Ne iii] 15.56 µm, and and are the fraction of Ne that is singly and doubly ionized, respectively.
4.1 Ionization Fractions for Neon
Ho & Keto (2007) did not consider the influence of neon abundance and did not explicitly calculate and , which, in principle, can vary from galaxy to galaxy, depending, for instance, on the metallicity and shape of the ionizing spectrum. To determine the neon ionization fractions, we run simple photoionization models of H ii regions with input SEDs from Starburst99 (Leitherer et al., 1999) for instantaneous star formation with age 1.5, 2, and 2.5 Myr, a Salpeter (1955) initial mass function with a power-law index , and a lower and upper mass cutoff of 1 and 100 , respectively. Starburst ages of 1–3 Myr have previously been inferred to reproduce the strong forbidden lines of of Galactic and extragalactic H ii regions (e.g., Dors et al., 2011, and references therein). We employ stellar evolutionary tracks with high mass loss from the Geneva group (Maeder & Meynet, 1994) with , 0.2, 0.4, 1.0, and 2.0 , where . Other parameters (e.g., wind model and stellar atmosphere) are kept at their default values, as described in Leitherer et al. (1999, 2014). We assume a closed geometry with spherical distribution. We adopt typical H ii region (mean of the Orion nebula; Ferland et al., 2017) dust grain size distribution and consider solar metal abundance with five metallicities (, 0.2, 0.4, 1.0, and 2.0 , in order to match the stellar metallicity), with dust appropriately scaled with metallicity. PAHs, with properties as in Abel et al. (2008), are also included. We vary the ionization parameter from log to in steps of 0.5 dex, and the hydrogen density from log (/cm*-3*) = 1 to 2.5 in steps of 0.5 dex, covering the typical ranges of star-forming galaxies (Zhang et al., 2013). The calculation stops when the temperature drops below 4000 K (i.e. when reaching the ionization front and almost capturing all the [Ne ii] and [Ne iii]).
Figure 4(a) shows the effect of ionization parameter, metallicity, and starburst age on the ratio [Ne iii]/[Ne ii] for a 2 Myr starburst. The [Ne iii]/[Ne ii] ratio is an excellent diagnostic of ionization parameter once the metallicity and starburst age are fixed, with almost no dependence on (see also Yeh & Matzner, 2012). As metallicity increases, the ionizing spectrum becomes softer and more dust contributes to the cooling, resulting in a decline in [Ne iii]/[Ne ii]. The same trend is seen for starburst ages of 1.5 and 2.5 Myr, but the lines are shifted along the vertical axis. As the starburst evolves, massive stars die and the rest of the older stellar population produces a softer spectrum compared to that of a younger starburst. Lower metallicity, younger starburst age, and higher radiation field strength all raise the [Ne iii]/[Ne ii] ratio. These parameters can be disentangled using other emission-line diagnostics, such as the O32 ratio333O32 [O iii] /[O ii] for ionization parameter and the ratio444 ([O ii] + [O iii] )/H for metallicity (e.g., Kewley & Dopita, 2002; Kobulnicky & Kewley, 2004), but this is beyond the scope of this paper. Although the [Ne iii]/[Ne ii] ratio depends on many parameters, we find no dependence of or on parameters other than [Ne iii]/[Ne ii]. Figure 4(b) shows the relation between fractional abundance of [Ne ii] () and [Ne iii] () on the [Ne iii]/[Ne ii] ratio. The values for different metallicities, ionization parameters, and ages form a continuous sequence. The observable [Ne iii]/[Ne ii], containing all the information on the ionization source and environment, is a good proxy of and in star-forming galaxies.
We use the Levenberg-Marquardt algorithm to fit the relation for all three starburst ages together, in the region log [Ne iii]/[Ne ii] 1.5, which covers most of the galaxies. We obtain
[TABLE]
where is or , and the error function is . The best-fit parameters for and are given in Table 1.
4.2 New SFR Calibrations
We modify the neon-based SFR calibration as follows. To include the effect of neon abundance, Equation 4 should be multipled by , where is the metallicity, which scales linearly with the abundance of Ne. For star-forming galaxies, Equation 4 becomes
[TABLE]
with specified as the user deems appropriate (e.g., from the mass-metallicity relation or other more direct information on metallicity, when available). The neon ionization fractions ( and ) are given by Equation 5. In the case of AGNs,
[TABLE]
where (in ) is the luminosity of [Ne v] 14.32 µm, and Equation 5 is modified to
[TABLE]
4.3 Comparing Neon with Other SFR Indicators
We use data for 11/33 AGNs and 78/79 star-forming galaxies from LaMassa et al. (2012) to compare SFRs calculated from our revised method with those derived independently to test the consistency between them. We take reference SFRs from the second version of the GALEX-SDSS-WISE Legacy Catalog (GSWLC-2; Salim et al., 2018), which provides physical properties (stellar masses, dust attenuations, and SFRs) for 700,000 galaxies with Sloan Digital Sky Survey (SDSS) redshifts below 0.3 (Salim et al., 2016). GSWLC-2 constrains UV/optical SED fits with IR luminosity, obtained from luminosity-dependent IR templates and parameterized attenuation curves determined with the Code Investigating GALaxy Emission (CIGALE; Boquien et al., 2018) for fitting SEDs. For AGNs, they applied a correction to the IR luminosities to account for dust heating by the central source. Following GSWLC-2, we assume a Chabrier (2003) initial mass function and WMAP7 flat cosmology ( km s*-1* Mpc*-1*, ). To obtain consistent metallicities for both active and inactive galaxies, the metallicities are estimated via the mass-metallicity relation (Tremonti et al., 2004; Kewley & Ellison, 2008) using stellar masses () from GSWLC-2. Depending on the choice of metallicity calibration, absolute metallicities can carry significant uncertainties (up to dex; Kewley & Ellison, 2008). To minimize this source of uncertainty, we use the best-fit mass-metallicity relation from Kewley & Ellison (2008) with metallicities derived from a combination of the N2O2 method (the ratio of [N ii] to [O ii] ; Kewley & Dopita, 2002) and the N2 method (the ratio of [N ii] to H; Pettini & Pagel, 2004). Both of the methods have low residual discrepancies in relative metallicities and suffer less from AGN contamination; the N2O2 method is also less sensitive to ionization parameter (Kewley & Ellison, 2008). The N2O2 method has a high absolute metallicity calibration, while the N2 method has low absolute metallicity calibration. We adopt the average of the two values as the final metallicity, with those of N2O2 and N2 as upper and lower boundaries, respectively.
We compare the SFRs derived using our neon method and those from SED fitting. With the metallicity fixed to solar (Figure 5a), the neon-based SFRs are slightly but systematically higher than those from GSWLC-2, for both star-forming and AGN host galaxies, with a clear tendency for the magnitude of the excess to correlate with the stellar mass of the system (see color bar). The offset is marginally higher for AGNs ( dex) than for star-forming galaxies ( dex), because AGN hosts tend to be more massive (Ho et al., 2003; Kauffmann et al., 2003), and hence more metal-rich. After adopting individual metallicities (Figure 5b), the neon-based SFRs are shifted downward and come into much better agreement with the SED-based SFRs. The systematic offset between the two methods essentially disappears, and the scatter also is reduced somewhat (star-forming galaxies: dex; AGNs: dex). We also run models with twice solar metallicity. Although slight differences exist for [Ne ii]/[Ne v] and [Ne iii]/[Ne v] ratios, the resulting SFRs for AGNs are only affected by 0.04 dex (0.09 dex), much smaller than the scatter. Furthermore, the overall consistency between the two subgroups emphasizes the robustness of our procedure for subtracting the NLR contribution to the [Ne ii] and [Ne iii] lines (Section 3.1).
4.4 Future Applications
The spectroscopic capabilities of Spitzer/IRS have enabled detailed mid-IR diagnostics of the physical conditions in a wide range of extragalactic systems, from dwarf galaxies to starbursts and AGNs (e.g., Wu et al., 2006; Brandl et al., 2006; Buchanan et al., 2006; Farrah et al., 2007; Pereira-Santaella et al., 2010; Inami et al., 2013). The neon-based SFR indicator proposed in this work presents a new tool with which to further exploit the rich heritage of spectroscopic data contained in the Spitzer archive. Our technique will also find broad applicability to future infrared facilities, which can push investigations of extragalactic star formation to finer spatial scales in nearby galaxies and extend spatially integrated studies to much higher redshifts. The mid-infrared instrument (MIRI; Rieke et al., 2015) onboard the upcoming James Webb Space Telescope (JWST; Gardner et al., 2006) will provide medium-resolution () integral-field spectroscopy from 4.9 to 28.8 µm with diffraction-limited spatial resolution longward of 8 µm. This can enable, for example, studies of circumnuclear star formation out to . On a longer timescale, the superior sensitivity of the Space Infrared Telescope for Cosmology and Astrophysics (SPICA; Swinyard et al., 2009; Egami et al., 2018; Roelfsema et al., 2018; van der Tak et al., 2018) promises even greater reach to the early Universe. For instance, the instantaneous wavelength coverage of 34–230 µm by the SPICA Far Infrared Instrument (SAFARI) in principle can detect the rest-frame mid-IR neon lines in the first-generation galaxies and AGNs.
5 Conclusions
We use the photoionization code CLOUDY to model the NLR of AGNs, incorporating realistic AGN SEDs and input assumptions, with the aim of predicting the full, realistic range of intensities for the mid-IR fine-structure lines of [Ne ii] 12.81 µm, [Ne iii] 15.56 µm, and [Ne v] 14.32 µm. Our main conclusions are as follows:
- •
We demonstrate that AGNs, over a wide range of realistic conditions, emit a relatively restricted range of [Ne ii]/[Ne v] and [Ne iii]/[Ne v] ratios.
- •
This implies that once [Ne v] is measured, we can estimate the amount of [Ne ii] and [Ne iii] produced by the AGN, and hence any excess [Ne ii] and [Ne iii] that can be attributed to star formation from the host galaxy using the neon-based SFR estimation method of Ho & Keto (2007).
- •
We compute photoionization models of H ii regions to obtain an empirical relation that enables us to estimate the fractional abundance of singly and doubly ionized neon, thereby improving the neon-based SFR estimator for galaxies.
- •
Applying our methodology to a sample of low-redshift active galaxies, we find that star-forming regions in AGN host galaxies tend to have large [Ne iii]/[Ne ii] ratios indicative of high ionization parameters, plausibly a consequence of their nuclear environments.
- •
We update the neon-based SFR estimator by explicitly including metallicity as a key factor.
- •
The good consistency between the neon-based SFRs and those independently derived from SED fitting emphasizes the effectiveness of our method for correcting for NLR contamination and the overall robustness of the newly proposed SFR calibration for AGNs.
- •
Our method provides a promising tool to explore star formation in active and inactive galaxies across cosmic time with future IR facilities such as JWST and SPICA.
We thank an anonymous referee for helpful comments and suggestions. This work was supported by the National Key R&D Program of China (2016YFA0400702) and the National Science Foundation of China (11721303).
The reference list from the paper itself. Each links out to its DOI / PubMed record.
- 1Abel et al. (2008) Abel, N. P., van Hoof, P. A. M., Shaw, G., Ferland, G. J., & Elwert, T. 2008, Ap J, 686, 1125
- 2Alexander & Hickox (2012) Alexander, D. M., & Hickox, R. C. 2012, New A Rev., 56, 93
- 3Allende Prieto et al. (2001) Allende Prieto, C., Lambert, D. L., & Asplund, M. 2001, Ap J, 556, L 63
- 4Armus et al. (2007) Armus, L., Charmandaris, V., Bernard-Salas, J., et al. 2007, Ap J, 656, 148
- 5Boquien et al. (2018) Boquien, M., Burgarella, D., Roehlly, Y., et al. 2018, ar Xiv e-prints, ar Xiv:1811.03094
- 6Bournaud & Combes (2002) Bournaud, F., & Combes, F. 2002, A&A, 392, 83
- 7Bower et al. (2006) Bower, R. G., Benson, A. J., Malbon, R., et al. 2006, MNRAS, 370, 645
- 8Brandl et al. (2006) Brandl, B. R., Bernard-Salas, J., Spoon, H. W. W., et al. 2006, Ap J, 653, 1129