Multi-choice opinion dynamics model based on Latane theory
Przemyslaw Bancerowski, Krzysztof Malarz

TL;DR
This paper extends the Nowak--Szamrej-Latané opinion formation model to multiple opinions, demonstrating that phase transition signatures persist and analyzing how the number of opinions affects critical social temperature through computer simulations.
Contribution
The paper introduces a multi-opinion extension of the Latané social impact model and analyzes phase transition behavior with simulations, expanding understanding of opinion dynamics.
Findings
Signatures of order/disorder phase transition are observed in the multi-opinion model.
Critical social temperature decreases as the number of opinions increases.
Model parameters influence the phase transition characteristics.
Abstract
In this paper Nowak--Szamrej-Latan\'e model is reconsidered. This computerised model of opinion formation bases on Latan\'e theory of social impact. We modify this model to allow for multi (more than two) opinions. With computer simulations we show that in the modified model the signatures of order/disorder phase transition are still observed. The transition may be observed in the average fraction of actors sharing the -th opinion, its variation and also average number of clusters of actors with the same opinion and the average size of the largest cluster of actors sharing the same opinion. Also an influence of model control parameters on simulation results is shortly reviewed. For a homogeneous society with identical actors' supportiveness and persuasiveness the critical social temperature decreases with an increase of available opinions from () via 4.7, 4.1…
Click any figure to enlarge with its caption.
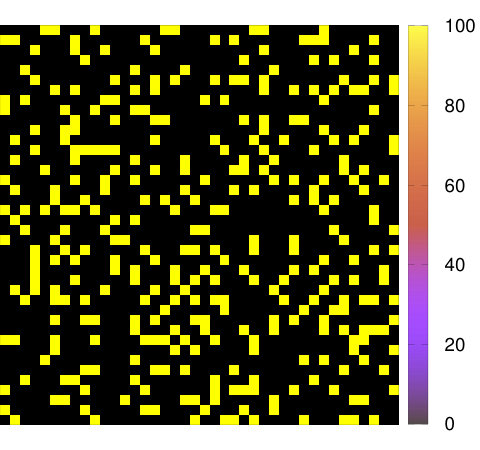 Figure 0
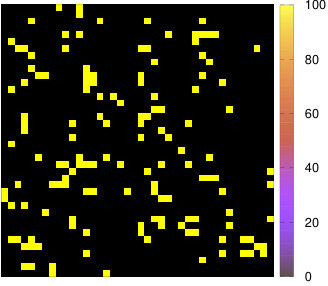 Figure 1
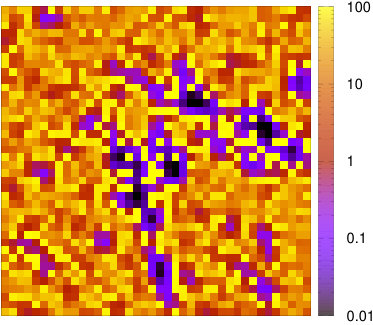 Figure 10
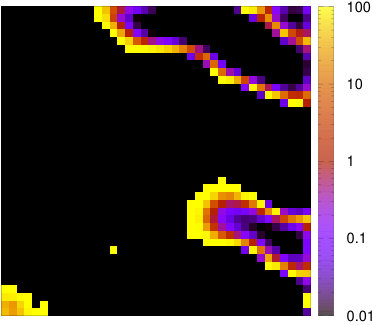 Figure 11
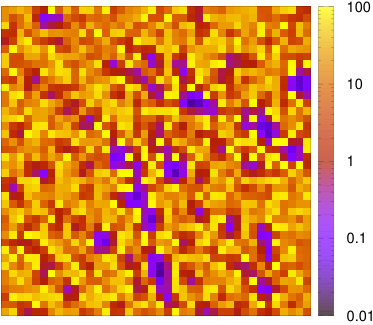 Figure 12
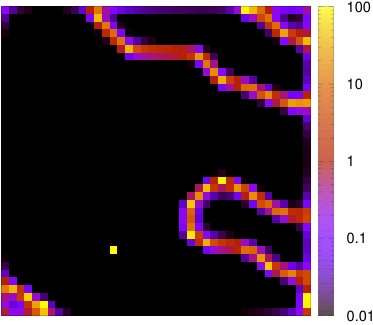 Figure 13
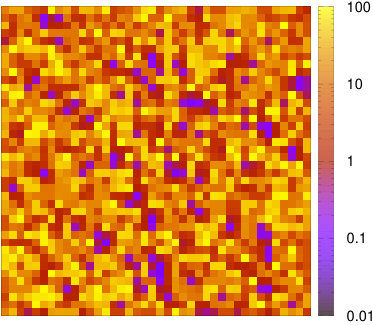 Figure 14
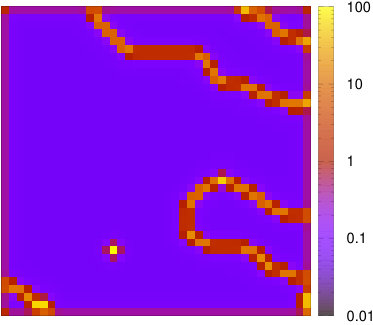 Figure 15
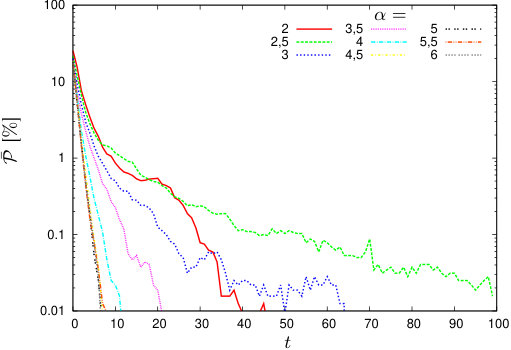 Figure 16
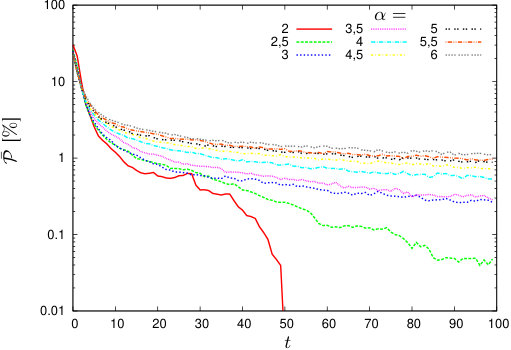 Figure 17
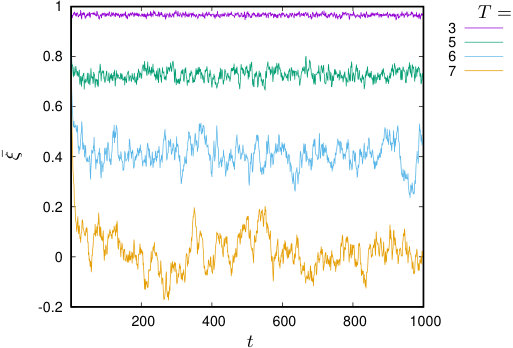 Figure 18
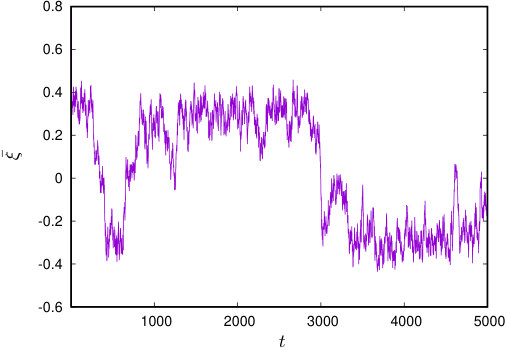 Figure 19
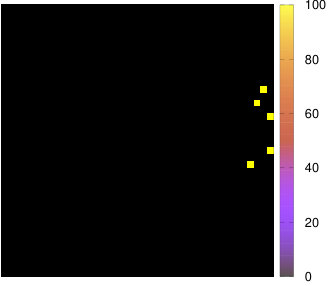 Figure 2
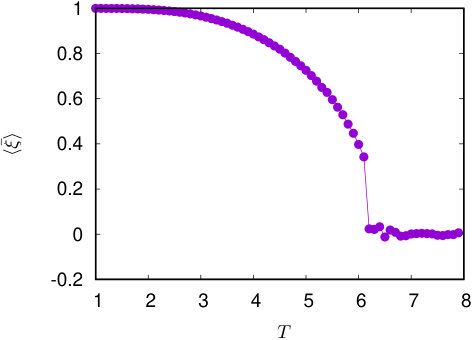 Figure 20
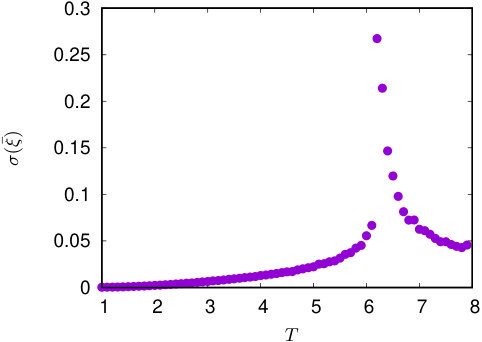 Figure 21
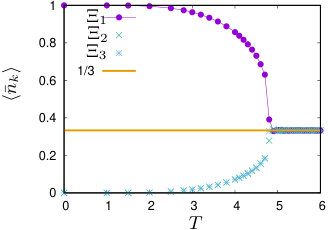 Figure 22
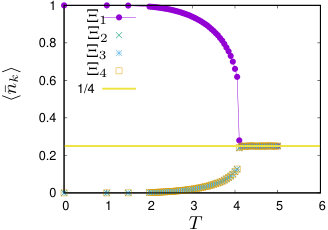 Figure 23
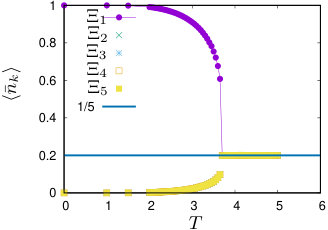 Figure 24
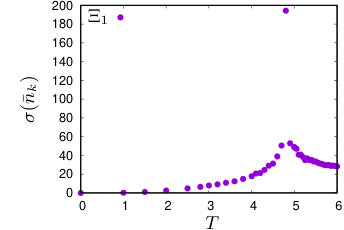 Figure 25
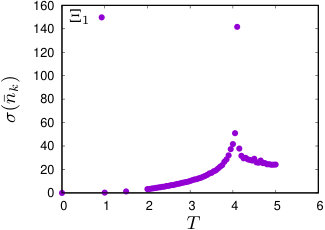 Figure 26
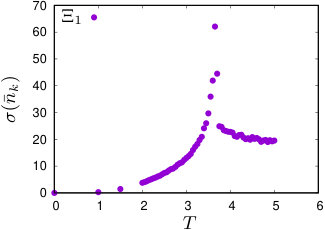 Figure 27
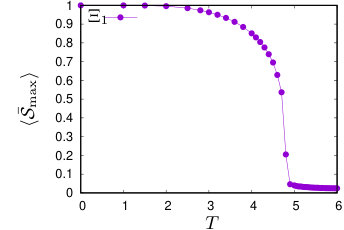 Figure 28
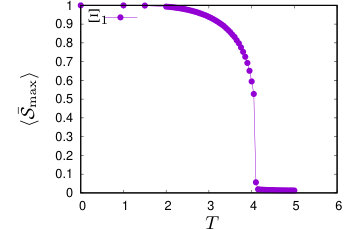 Figure 29
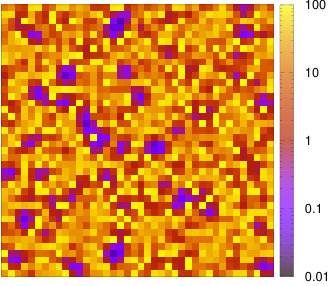 Figure 3
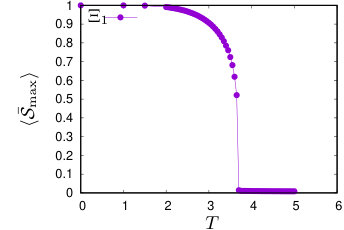 Figure 30
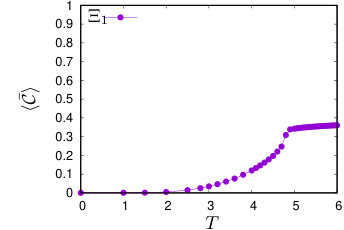 Figure 31
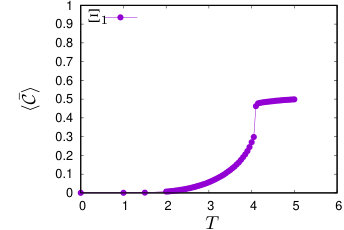 Figure 32
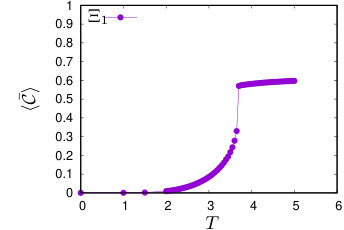 Figure 33
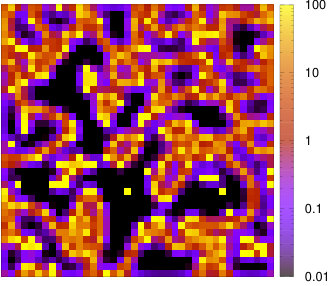 Figure 4
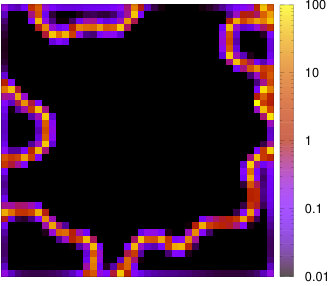 Figure 5
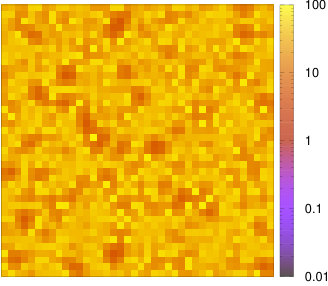 Figure 6
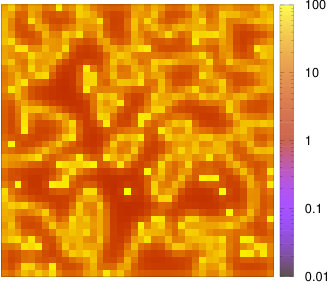 Figure 7
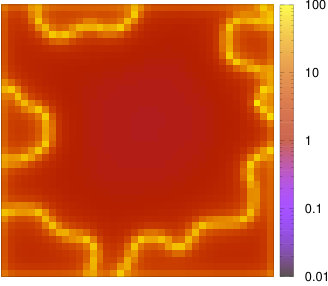 Figure 8
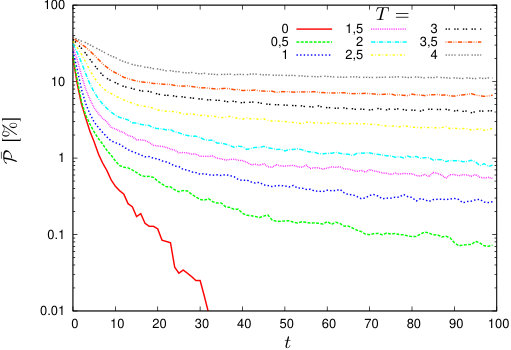 Figure 9
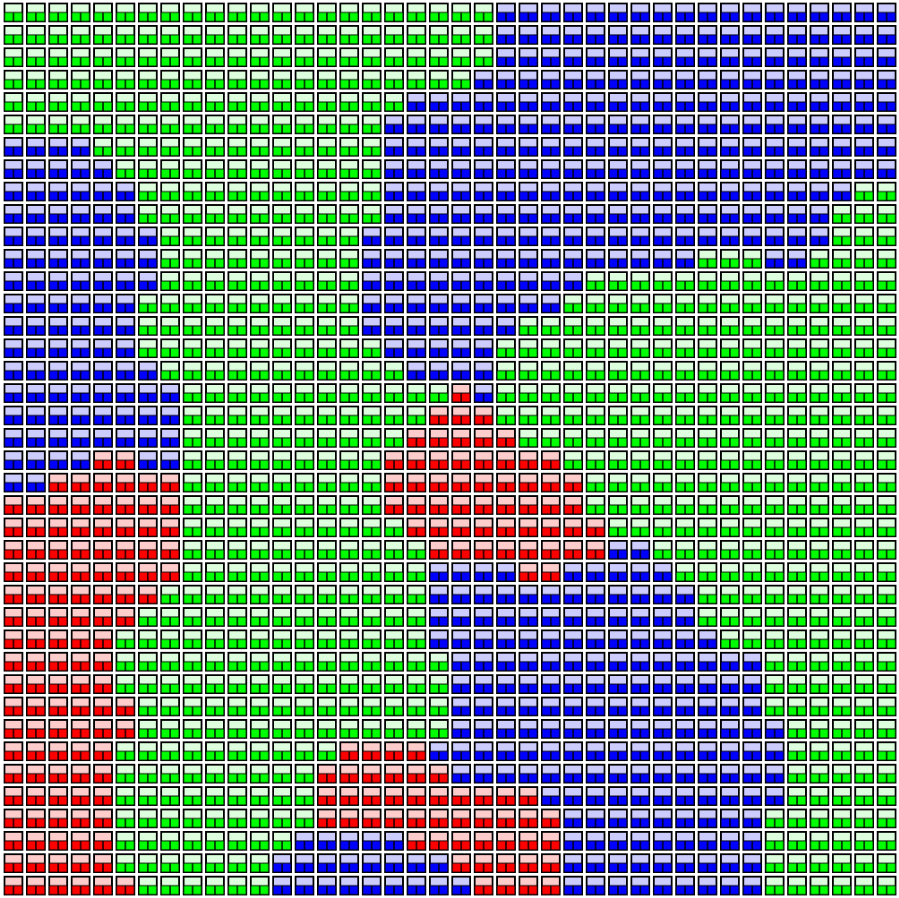 Figure 35
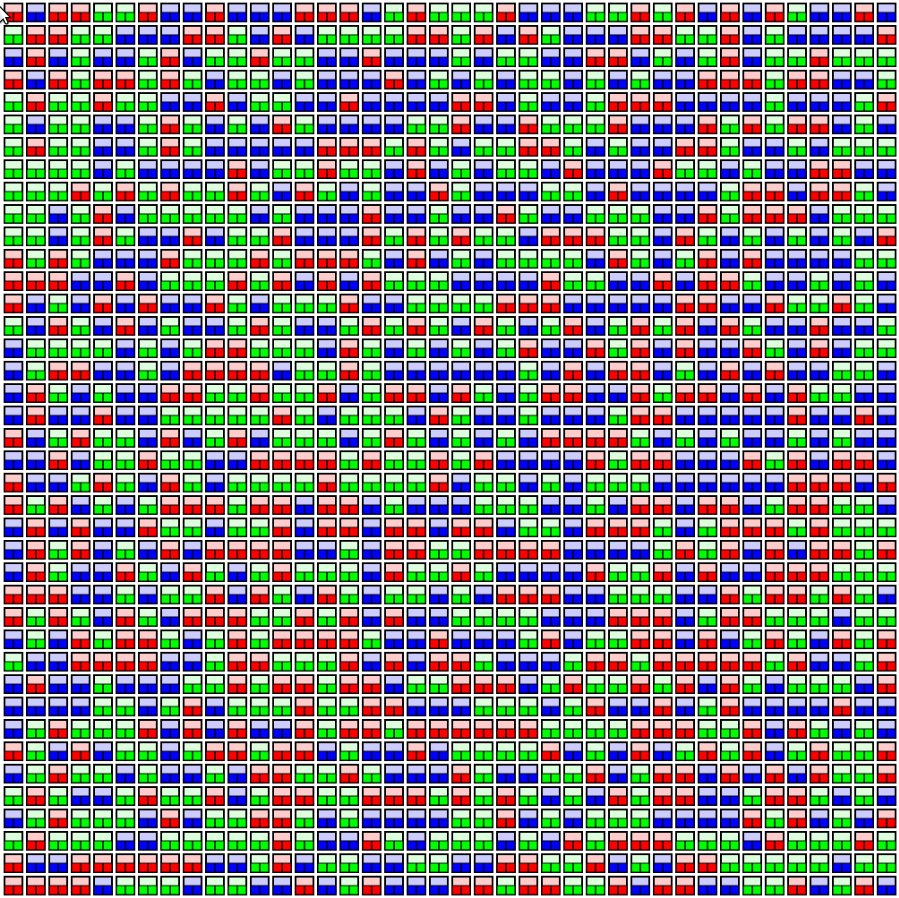 Figure 36
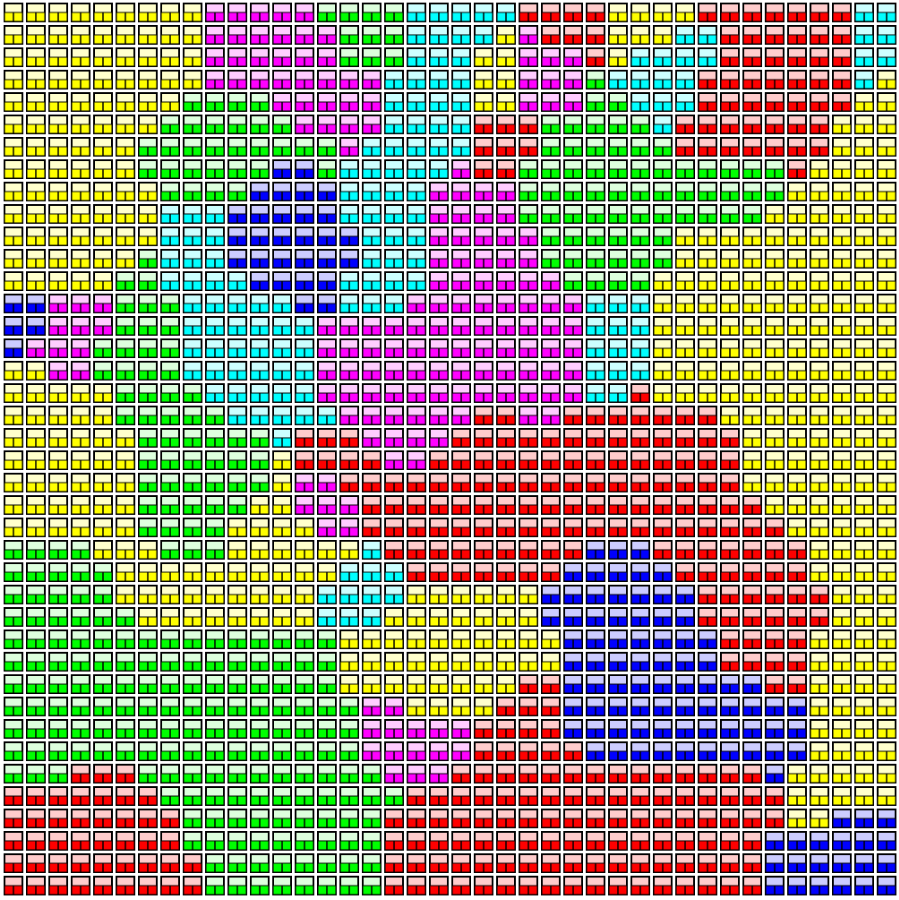 Figure 37
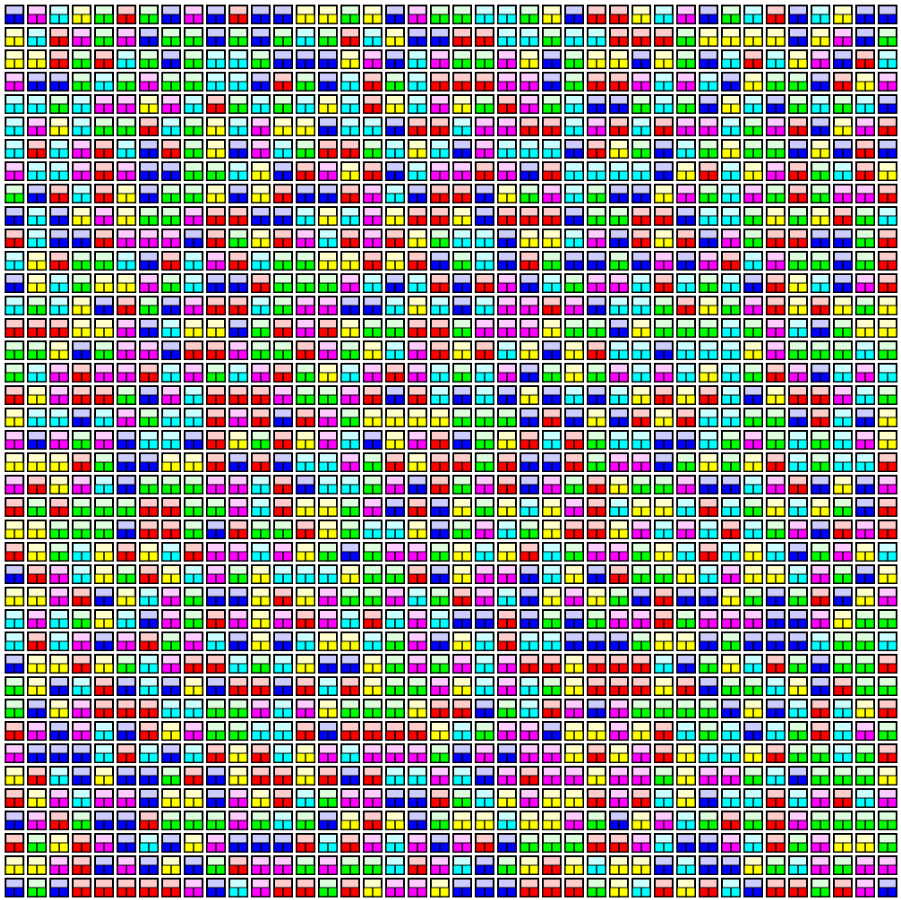 Figure 38
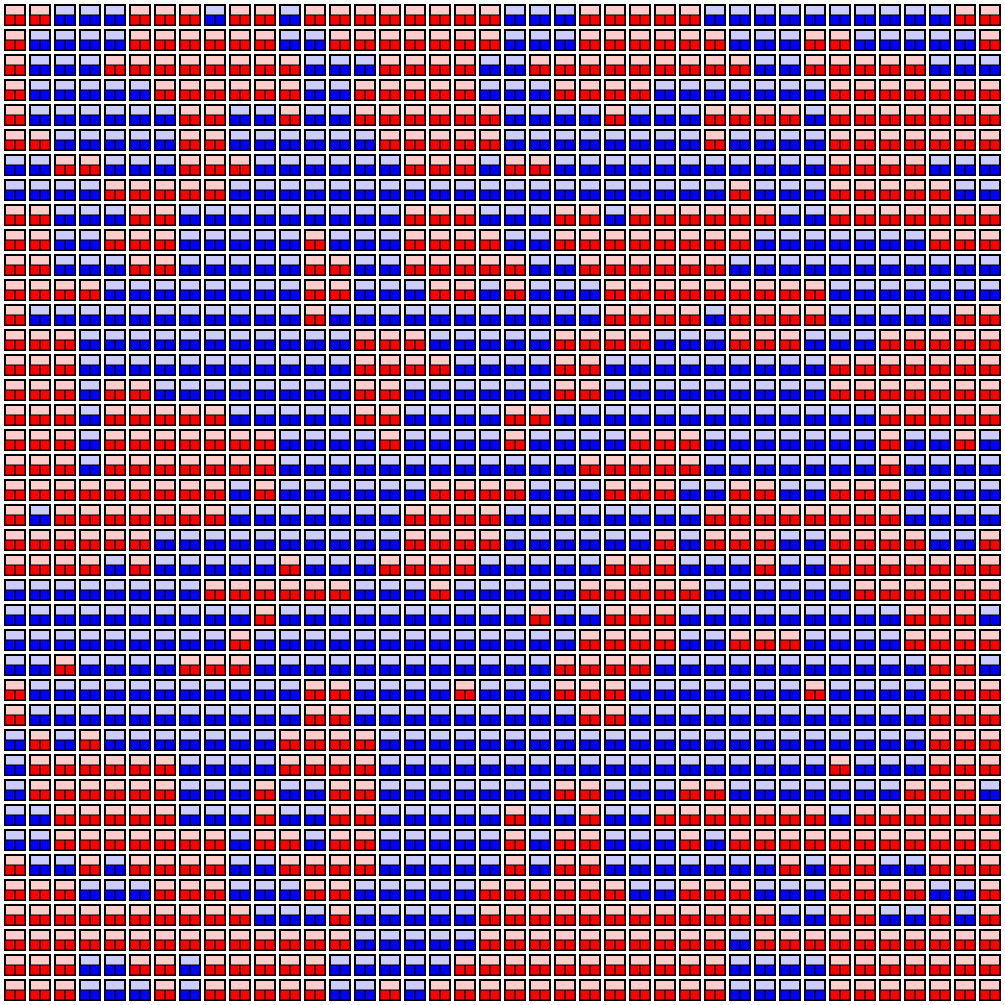 Figure 39
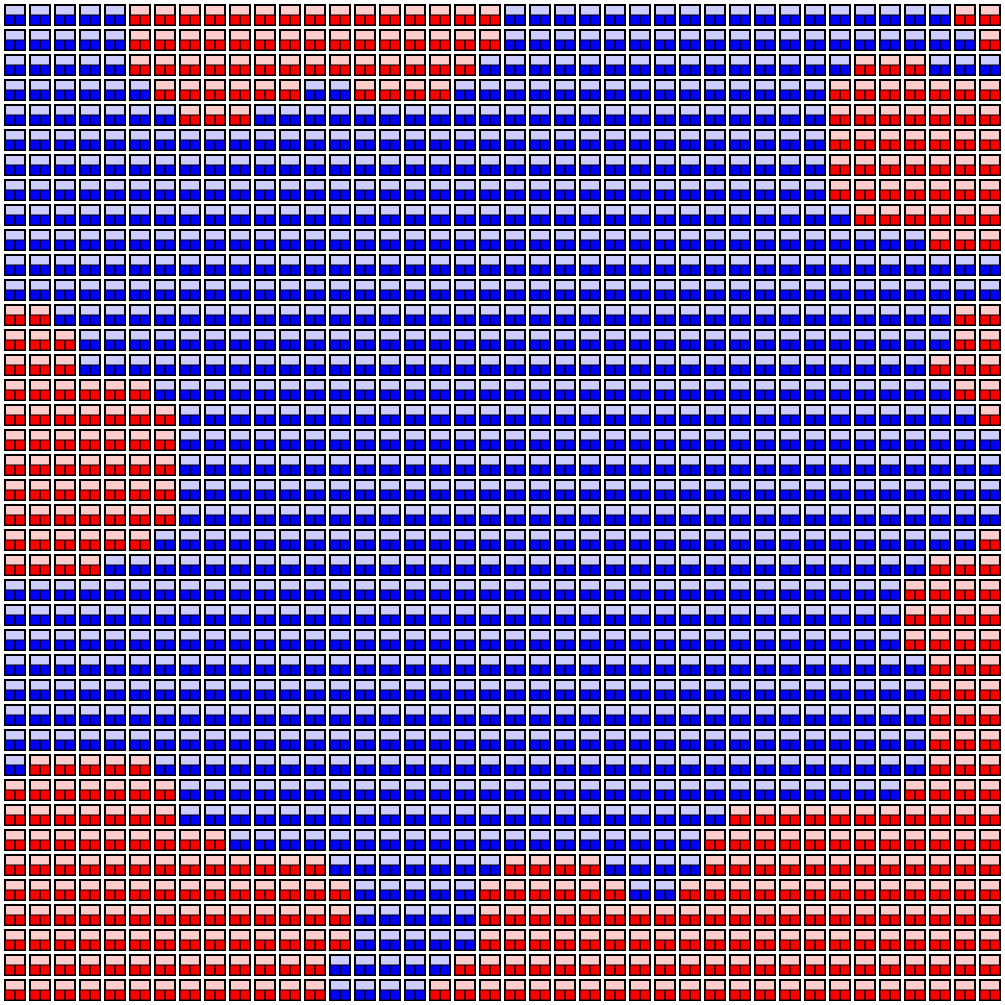 Figure 40
| 2 | 3 | 4 | 5 | |
|---|---|---|---|---|
| 6.1 | 4.7 | 4.1 | 3.6 |
Peer Reviews
No public reviews on file for this paper yet. If you reviewed it on a platform where reviews are public (OpenReview, ICLR, NeurIPS, ICML), you can paste yours below so the community can read it here.
Videos
No videos yet. Explain this paper in a talk, walkthrough, or lecture? Add one.
Multi-choice opinion dynamics model based on Latané theory
Przemysław Bańcerowski
Krzysztof Malarz http://home.agh.edu.pl/malarz/ [email protected]
AGH University of Science and Technology, Faculty of Physics and Applied Computer Science, al. Mickiewicza 30, 30-059 Krakow, Poland
Abstract
In this paper Nowak–Szamrej-Latané model is reconsidered. This computerised model of opinion formation bases on Latané theory of social impact. We modify this model to allow for multi (more than two) opinions. With computer simulations we show that in the modified model the signatures of order/disorder phase transition are still observed. The transition may be observed in the average fraction of actors sharing the -th opinion, its variation and also average number of clusters of actors with the same opinion and the average size of the largest cluster of actors sharing the same opinion. Also an influence of model control parameters on simulation results is shortly reviewed. For a homogeneous society with identical actors’ supportiveness and persuasiveness the critical social temperature decreases with an increase of available opinions from () via 4.7, 4.1 to for , 4, 5, respectively.
Complex systems; Social and economic systems; Opinion dynamics; Ising and Potts model; Long range interactions
pacs:
89.65.-s, 89.75.-k
I Introduction
Simulations of opinion dynamics Stauffer (2009) are core subject of sociophysics Galam (2008); *GalamSociophysics, an interdisciplinary field of research in complex systems directly connected to computational sociology. Numerous examples of such research are published in interdisciplinary sections of physical journals Gros (2017); Nyczka and Sznajd-Weron (2013); Kułakowski (2009); Gekle et al. (2005); Sznajd-Weron and Sznajd (2005); Amblard and Deffuant (2004); Hołyst et al. (2000); Kacperski and Hołyst (2000), and in journals devoted to computational sociology Mathias et al. (2016); Malarz et al. (2011); Deffuant (2006); Hegselmann and Krause (2002); Feliciani et al. (2017); Li and Xiao (2017); Duggins (2017). The models of opinions dynamics deals with binary (or Boolean), Ising-like Lenz (1920); *Ising1925 variables, corresponding to two-states models of opinions Malarz and Kułakowski (2008); Slanina et al. (2008); Sznajd-Weron (2005); Sznajd-Weron and Sznajd (2000) or multi-state, but still discrete state opinions models Malarz and Kułakowski (2010); Gekle et al. (2005) or discrete vector-like variables Sznajd-Weron and Sznajd (2005). The second group of models deals with continuous opinions Mathias et al. (2016); Deffuant (2006); Hegselmann and Krause (2002); Deffuant et al. (2000); Lima (2017); Malarz (2006); Baccelli et al. (2017); Su et al. (2017); Zhu et al. (2017); Anteneodo and Crokidakis (2017); Chen et al. (2017); Zhang et al. (2017).
Another classification of opinion dynamics models may be based on geometry of underlying network of connections among actors. Basing on this criteria we can deal with continuous (plane-like) Kułakowski (2009); Malarz and Kułakowski (2014, 2012); Malarz et al. (2011) or discrete geometry. The later may be divided into additional sub-groups, with regular lattices Malarz and Kułakowski (2010); Sznajd-Weron (2005); Sznajd-Weron and Sznajd (2000); Lima and Crokidakis (2017); Lima (2017) or complex networks Malarz and Kułakowski (2008); Amblard and Deffuant (2004); Li et al. (2017); Alatas et al. (2017); Medina-Guevara et al. (2017); Parsegov et al. (2017); Albi et al. (2017); Xiong et al. (2017).
The last classification includes system dynamics in terms of time evolution of the system, which again may occurring in discrete or in continuous time.
Assumed scheme of system representation force choosing the most adequate numerical technique for computer simulation of the system, including solving set of differential equations Evans (2010) (continuous space of opinions, continuous geometry and continuous time) or cellular automata technique Hegselmann et al. (2000); *Ilachinski-2001; *Wolfram-2002; *Chopard-2005; *Chopard-2012 (discrete space of opinions, discrete time and discrete geometry).
In this paper Nowak–Szamrej–Latané model is reconsidered Nowak et al. (1990). We propose multi-choice opinion dynamics model based on Latané Latané and Harkins (1976); Latané and Nida (1981); Latané (1981) theory. With computer simulation we show that in the system with the long-range interactions among actors and more than two opinions the order-disorder phase transition is also observed.
I.1 Theory of social impact
The mathematical model being the foundation of this work relies on Latané social impact theory Latané and Harkins (1976); Latané and Nida (1981); Latané (1981) and its computerised version proposed by Nowak et al. (1990). This approach for binary opinions and possible charismatic leader localised in the system centre has been thoroughly explored in Hołyst, Kacperski and Schweitzer papers Hołyst et al. (2000); Kacperski and Hołyst (2000) (see Ref. Hołyst et al. (2011) for review).
Latané assumes that people are social animals and in their natural environment (society) they influence each other. These interactions do not have to be intentional. Under this assumption we understand all interactions among people. Persuasion, joke, sharing emotions and feelings—all of these can affect others. Latané describes these interactions as social impact.
The theory of social impact bases on three fundamental principles: i) social force, ii) psycho-social law and iii) multiplication/division of impact.
I.1.1 Social force
The social force principle Latané (1981) says that social impact on -th actors is a function of the product of strength , immediacy , and the number of sources
[TABLE]
The strength of influence is the intensity, power or importance of the source of influence. This concept may reflect socio-economical status of the one that affects on our opinion, his/her age, prestige or position in the society.
The immediacy determines the relationship between the source and the goal of influence. This may mean closeness in the social relationship, lack of communication barriers and ease of communication among actors.
Latané called this principle ‘a bulb theory of social relations’. According to this analogy the social impact plays a role of illuminance. The illuminance depends on
- •
the power of the bulb (physicists prefer to think about bulb’s luminous flux)—equivalent of the strength of impact
- •
the distance from sources (bulbs)—equivalent of the immediacy
- •
and the number of bulbs—equivalent of the number of people.
I.1.2 Psycho-social law
The data of the famous Asch (1955) and Milgram et al. (1969) experiments may be fitted to formula proposed by Latané:
[TABLE]
where is the number of people exerting the impact, is a strength of impact and is the scaling exponent. This means that each next actor sharing the same opinion as actor exerts the lower impact on the -th actor. This formula has been independently confirmed experimentally by Latané and Harkins (1976).
I.1.3 Multiplication/division of impact
The lecture for single student influence his/her much more the same lecture given for hundred of students. In the latter case, the impact of lecture is roughly equally divided among all listeners Darley and Latané (1968). For this issue Latané proposes
[TABLE]
where the scaling exponent . Latané and Nida (1981) gathered results over hundred experiments to validate Eq. (3).
I.1.4 The limitations of the theory
The main limitation of the social impact theory lies in treating people as totally passive. The second trouble is the absence of dynamics in the model. These issues have been solved by Nowak et al. (1990) in the computerised version of Latané model.
II Model
Every actor at position is characterised by his/her discrete opinion , his/her persuasiveness () and his/her supportiveness (). Parameter describes the intensity of persuasion to change the opinion by actor from a person with opinion different than , while describes the intensity of supporting people with the same views.
II.1 Two opinions ()
For two opinions one can assume integer values of . For evaluation of social impact on actor at position one can apply formula proposed in Ref. Hołyst et al. (2011):
[TABLE]
where , , , stand for scaling functions and is Euclidean distance between sites and . The system dynamics may be governed by heat-bath-like dynamics Kacperski and Hołyst (2000), i.e.:
[TABLE]
where is a noise parameter (social temperature Kułakowski (2008)).
For the rule (5) may be reduced to fully deterministic rule Kacperski and Hołyst (2000)
[TABLE]
as is practically impossible to occur.
II.2 Three and more opinions ()
For multi-state space of opinions we do not assign numeric values to opinions , where is the number of available opinions. We rather prefer to think about various ‘colours’ of opinions, or about orthogonal versors in -dimensional vector space. Also we propose some modifications of Eq. (4). We propose to separate the social impact on actor from actors sharing opinion of actor ()
[TABLE]
where enumerates the opinions. The factor of four in Eq. (7) guaranties exactly the same impact on actor as calculated basing on Eq. (4) for .
The calculated social impacts influence the -th actor opinion at the subsequent time step. For this opinion is determined by those opinions which believers exert the largest social impact on -th actor
[TABLE]
For finite values of social temperature we apply the Boltzmann choice
[TABLE]
which yield probabilities
[TABLE]
of choosing by -th actor in the next time step -th opinion:
[TABLE]
The form of dependence (9) in statistics and economy is called logit function Anderson et al. (1992); *Byrka-2016.
We assume identity function for scaling functions , , . The distance scaling function should be an increasing function of its argument. Here, we assume the distance scaling function as
[TABLE]
what ensures non-zero values of denominator for self-supportivenees in Eq. (7a). Newly evaluated opinions are applied synchronously to all actors.
The simulations are carried out on square lattice of linear size with open boundary conditions. We assume identical values of supportivenees and persuasiveness for all actors . We set exponent in the distance scaling function (12).
The web application allowing for direct observation of the system evolution is available at http://www.zis.agh.edu.pl/app/MSc/Przemyslaw_Bancerowski/. The short manual for this application is available in Appendix A.
III Results
III.1 Two opinions
III.1.1 Influence of the model parameters on opinion dynamics
To understand better the system time evolution the maps of probabilities of opinion changes at sites (for ) are presented in Fig. 1. The snapshots of system states at , 1 and 10 are presented in the first row of Fig. 1. The corresponding to these states probabilities of opinion changing (flipping) for social temperatures , 1 and 3 are presented in the second, third and fourth row of the Fig. 1, respectively. For (the second row) the system is fully deterministic and . For long enough times of evolution the system reaches the nearly-steady state (with single spinsons111The term ‘spinson’ comes from merging words ‘spin’ and ‘person’ and it describes actor who may have only two opinions. The term was introduced in 2013 by Nyczka and Sznajd-Weron (2013). going to change their minds) and clearly defined borders between groups (clusters) of spinsons with different opinions. The static picture of the system is also observed for , with non-zero probabilities of changing opinions for spinson located at the clusters borders.
In Fig. 2 the time evolution of the spatial average of probabilities of opinion changes
[TABLE]
is presented. The spatial average over sites is marked through this paper by a bar (). For long enough times the average probabilities of opinion changes increases smoothly with increase of social temperature, reaching for .
As expected, an increase the social temperature enhances the spinsons nonconformity, i.e. they are able to change their minds although social impact exerted on them by other members of the society with the same opinion. In the limit of infinite social temperature every actor chooses his/her opinion randomly, as
[TABLE]
In Fig. 3 the maps of probabilities changes are presented again. The first row shows the snapshots from simulations indicating the spinsons opinions for (first column) and (second column). The subsequent rows correspond to probabilities of opinion changes for various values of exponent in the distance scaling function [Eq. (12)]—, 3, 6 in the second, third and fourth row, respectively. The random initial configuration of opinions leads to random maps of . However, ten time steps of system relaxation allows for an observation of both: the spatial clusterization of spinsons shearing the same opinion and high probabilities of opinion changing at the borders of these clusters. Moreover, for high values of exponent differences among the minimal and the maximal values of are much smaller than for small values of .
Quantitatively these differences may be observed in Fig. 4 for purely deterministic () and non-deterministic () cases. In principle, for the higher value of the exponent leads to the higher value of which values saturate on the level after hundred simulation steps for and .
III.1.2 Phase transition
In Fig. 5(a) the results on an average opinion
[TABLE]
for various values of the social temperature are presented. Similarly to the Ising model some signatures of the phase transition in the system may be observed. For low social temperature () the system is in ordered phase with majority of one (initially dominant) opinion. However, for high enough temperature () the average opinion oscillates around .
In Fig. 5(b) an example of time evolution of the spatial average opinion in the system for is presented. Although the long-range interaction among actors is assumed, the time evolution is not different from ‘magnetisation’ evolution in the Ising model with characteristic ‘magnetisation’ switching between its positive and negative values above the Curie temperature.
In Fig. 6(a) we plot the temporal average
[TABLE]
for various temperatures . The temporal average over times steps is marked through this paper by brackets (). Here, , i.e. the first hundred of time steps is excluded from the averaging procedure.
The ordered phase phase vanishes for . This critical value of coincidences nicely with a peak of average opinion dispersion
[TABLE]
as presented in Fig. 6(b). The values of plays a role of static susceptibility in Ising-like systems. We confirm the earlier results indicating the phase transition in Nowak–Szamrej–Latané model for binary opinions Hołyst et al. (2000).
In the next Section we show that the above mentioned results are generic also when multi-opinions are available in the system.
III.2 Three and more opinions
As we mentioned in Section II.2 for we do not assign numerical values to opinions . Instead, we prefer to think about ‘colours’ of opinions (see Fig. 7 for snapshots from simulations presenting spatial distributions of opinions for , 6 and , 6). This assumption does not allow for dealing with [Eq. (14)] and [Eq. (15)] in order to identify the critical social temperature . Thus for this purpose we propose to deal with a fraction of actors sharing the -th opinion and its standard deviation .
In Figs. 8(a)-8(c) and Figs. 8(d)-8(f) we plot and for , respectively.
As we can see in Figs. 8(a)-8(c) the majority of holders of opinion vanishes with increasing the social temperature . For critical social temperature all available opinions in the system are equally occupied ( for and for ).
Again, vanishing of initially major opinion at coincidences nicely with maximal values of as presented in Figs. 8(d)-8(f). Similar critical behaviour may be observed in thermal evolution of the size of the larger cluster of actors sharing the same opinion (see Figs. 8(g)-8(i)) and the total number of clusters of actors sharing the same opinion (see Figs. 8(j)-8(l)). The increase of the number of clusters with increasing social temperature is also clearly visible in the Fig. 7.
IV Discussion and conclusions
In this paper we proposed multi-choice opinion dynamics model based on Latané theory. With computer simulation we show, that for multi-opinion version of the Nowak–Szamrej–Latané model of opinion dynamics even without assigning numeric values for opinions we are able to observe phase transition similar to this occurring in two-state Ising-like models of opinion dynamics.
As we avoid signing a numerical values to possible opinions, we do not need to use the Likert-like scale Likert (1932) with possible Likert items as ‘1 = Strongly disagree’, ‘2 = Disagree’, ‘3 = Neither agree nor disagree’, ‘4 = Agree’ and ‘5 = Strongly agree’. Likert scale falls within the ordinal level of measurement accordingly to the best known classification of scales of measurement by Stevens (1946).
Instead of signing a numerical values to possible opinions we deal with ‘colours’ of opinions and probabilities of choosing these opinions given by Eqs. (9)-(10). Please note that these ‘colours’ are equally distanced to each other and none of them is better or worse than others. Thus our scale of opinions corresponds to the nominal level of measurement Stevens (1946). Please note, that term responsible for actors interactions with other actors who share the same opinions [Eq. (7a)] is not dissimilar to the Potts model Potts (1952), where phase transition is also observed.
As we do not assign numerical values to differentiate actors opinions we can observe the order/disorder phase transition in thermal dependence of , , , . The results of our simulations indicate that the critical temperature decreases with increasing the number of opinions available in the system. We conclude, that for opinion Nowak–Szamrej–Latané model—with multi-choice of opinions and long-rage interactions among actors—the phase transition from ordered to disordered phase is also observed.
Acknowledgements.
This work was supported by the AGH-UST statutory tasks No. 11.11.220.01/2 within subsidy of the Ministry of Science and Higher Education.
Appendix A Manual
Application was designed to show dynamic process of opinion formation. It allows to change parameters during simulation and tracking results. Application consists of two main elements:
- •
control and results panels on the left,
- •
simulation area on the right.
Control panels are divided into small windows. Each of them may be collapsed by clicking on the upper bar. From the top there are the following panels:
- •
Control allows to pause and restart simulation with applied parameters.
- •
Grid parameters contains following parameters:
Height and Width
dimensions of the grid.
Number of opinion
, number of available opinions.
Random opinion
indicates whether starting opinion of each actor is randomly chosen from allowed values or all actors have the same opinion.
Random parameters
when this option is selected then parameters and are randomly chosen from range with uniform distribution.
Parameter p, Parameter s
when Random parameters is not selected then all actors have the same fixed persuasiveness and supportiveness equal to this two values.
Parameters located here can not be changed during simulation. After change user have to apply them by clicking button on bottom, after this new grid will be created and previous simulation will be lost.
- •
Simulation parameters allows to change following parameters during the simulation:
External field
button which opens pop-up with numeric values. Changing these values introduce impact from outside. It allows to strengthen or weaken a particular opinion.
Temperature
social temperature .
Distance function exponent
exponent used in distance scaling function (12).
Delay
slider specifying pause time between steps of simulation.
- •
Leader parameters allows to manually changing opinion and parameters , of an actor in grid center. This allows to introduce a strong leader with persuasiveness and supportiveness higher than .
- •
Results numbers of actors with particular opinion.
- •
Chart dynamically generated chart which shows the results over time.
The simulation area is built of squares. Each square represents one actor. The color of square represents opinion. Height of the darker bars on the bottom of the square indicates values of parameters (on the left) and (on the right). When simulation is paused user can click on actor to see impacts from each opinion and chance of changing opinion in next step.
The reference list from the paper itself. Each links out to its DOI / PubMed record.
- 1Stauffer (2009) D. Stauffer, “Opinion dynamics and sociophysics,” in Encyclopedia of Complexity and Systems Science , edited by R. A. Meyers (Springer, New York, NY, 2009) pp. 6380–6388. · doi ↗
- 2Galam (2008) S. Galam, “Sociophysics: A review of Galam models,” International Journal of Modern Physics C 19 , 409–440 (2008) . · doi ↗
- 3Galam (2004) S. Galam, “Sociophysics: A personal testimony,” Physica A 336 , 49–55 (2004) . · doi ↗
- 4Gros (2017) C. Gros, “Entrenched time delays versus accelerating opinion dynamics: are advanced democracies inherently unstable?” European Physical Journal B 90 , 223 (2017) . · doi ↗
- 5Nyczka and Sznajd-Weron (2013) P. Nyczka and K. Sznajd-Weron, “Anticonformity or independence?—Insights from statistical physics,” Journal of Statistical Physics 151 , 174–202 (2013) . · doi ↗
- 6Kułakowski (2009) K. Kułakowski, “Opinion polarization in the receipt–accept–sample model,” Physica A 388 , 469–476 (2009) . · doi ↗
- 7Gekle et al. (2005) S. Gekle, L. Peliti, and S. Galam, “Opinion dynamics in a three-choice system,” European Physical Journal B 45 , 569–575 (2005) . · doi ↗
- 8Sznajd-Weron and Sznajd (2005) K. Sznajd-Weron and J. Sznajd, “Who is left, who is right?” Physica A 351 , 593–604 (2005) . · doi ↗