Identification of epileptic regions from electroencephalographic data: Feigenbaum graphs
Gabriel Guarneros B., Cristian P\'erez A., Andrea Montiel P., J. F., Rojas

TL;DR
This paper introduces a novel method using Feigenbaum graphs to analyze EEG data, effectively distinguishing epileptic regions by characterizing data sets through graph metrics, aiding in epilepsy diagnosis.
Contribution
The study presents a new approach applying Feigenbaum graphs to EEG signals for identifying epileptic zones, demonstrating its potential as a diagnostic aid.
Findings
Successfully characterized focal and non-focal EEG data sets
Achieved good results in identifying epileptic regions
Method shows promise for assisting clinical diagnosis
Abstract
Diagnosing epilepsy is a problem of crucial importance. So analysing EEG data is of much importance to help this diagnosis. Assembling the Feigenbaum graphs for EEG signals. And calculating their average clustering, average degree, and average shortest path length. We manage to characterize two different data sets from each other. Each data set consisted of focal and non-focal activity, from where epileptic regions could be identified. This method yields good results for identifying sets of data from epileptic zones. Suggesting our approach could be used to aid physicians with diagnosing epilepsy from EEG data.
Click any figure to enlarge with its caption.
 Figure 1
 Figure 2
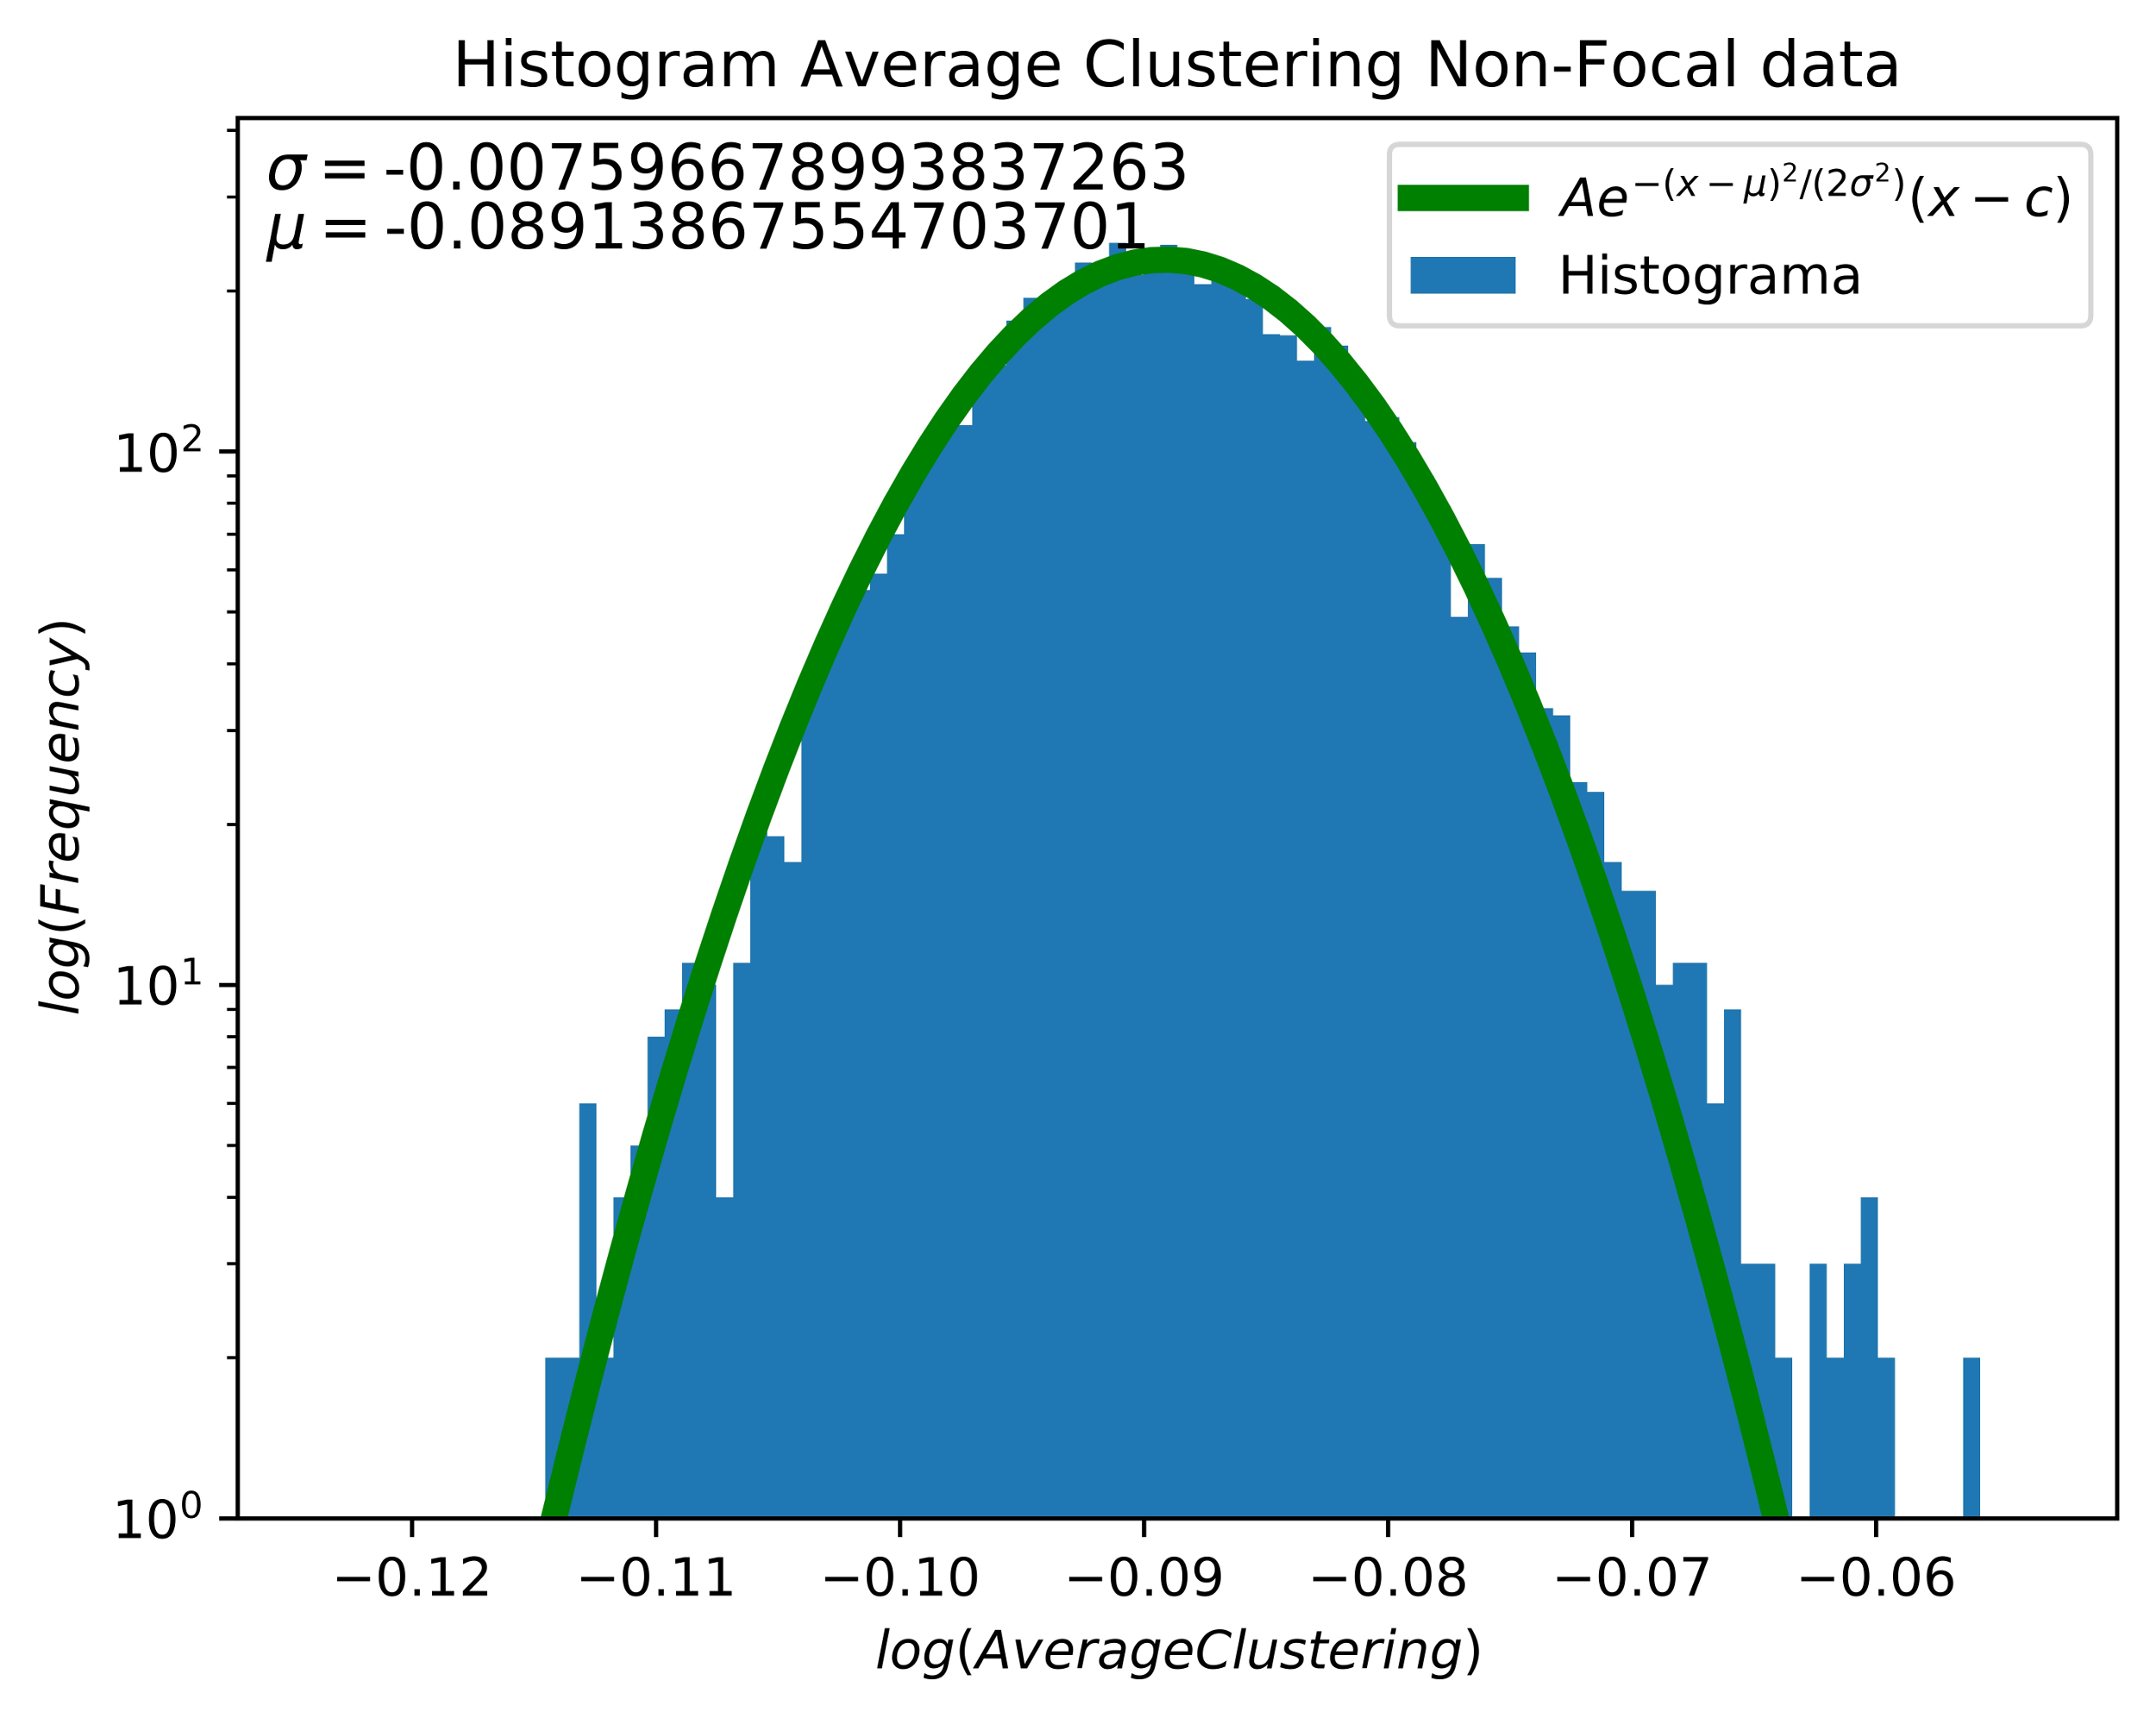 Figure 3
 Figure 4
 Figure 5
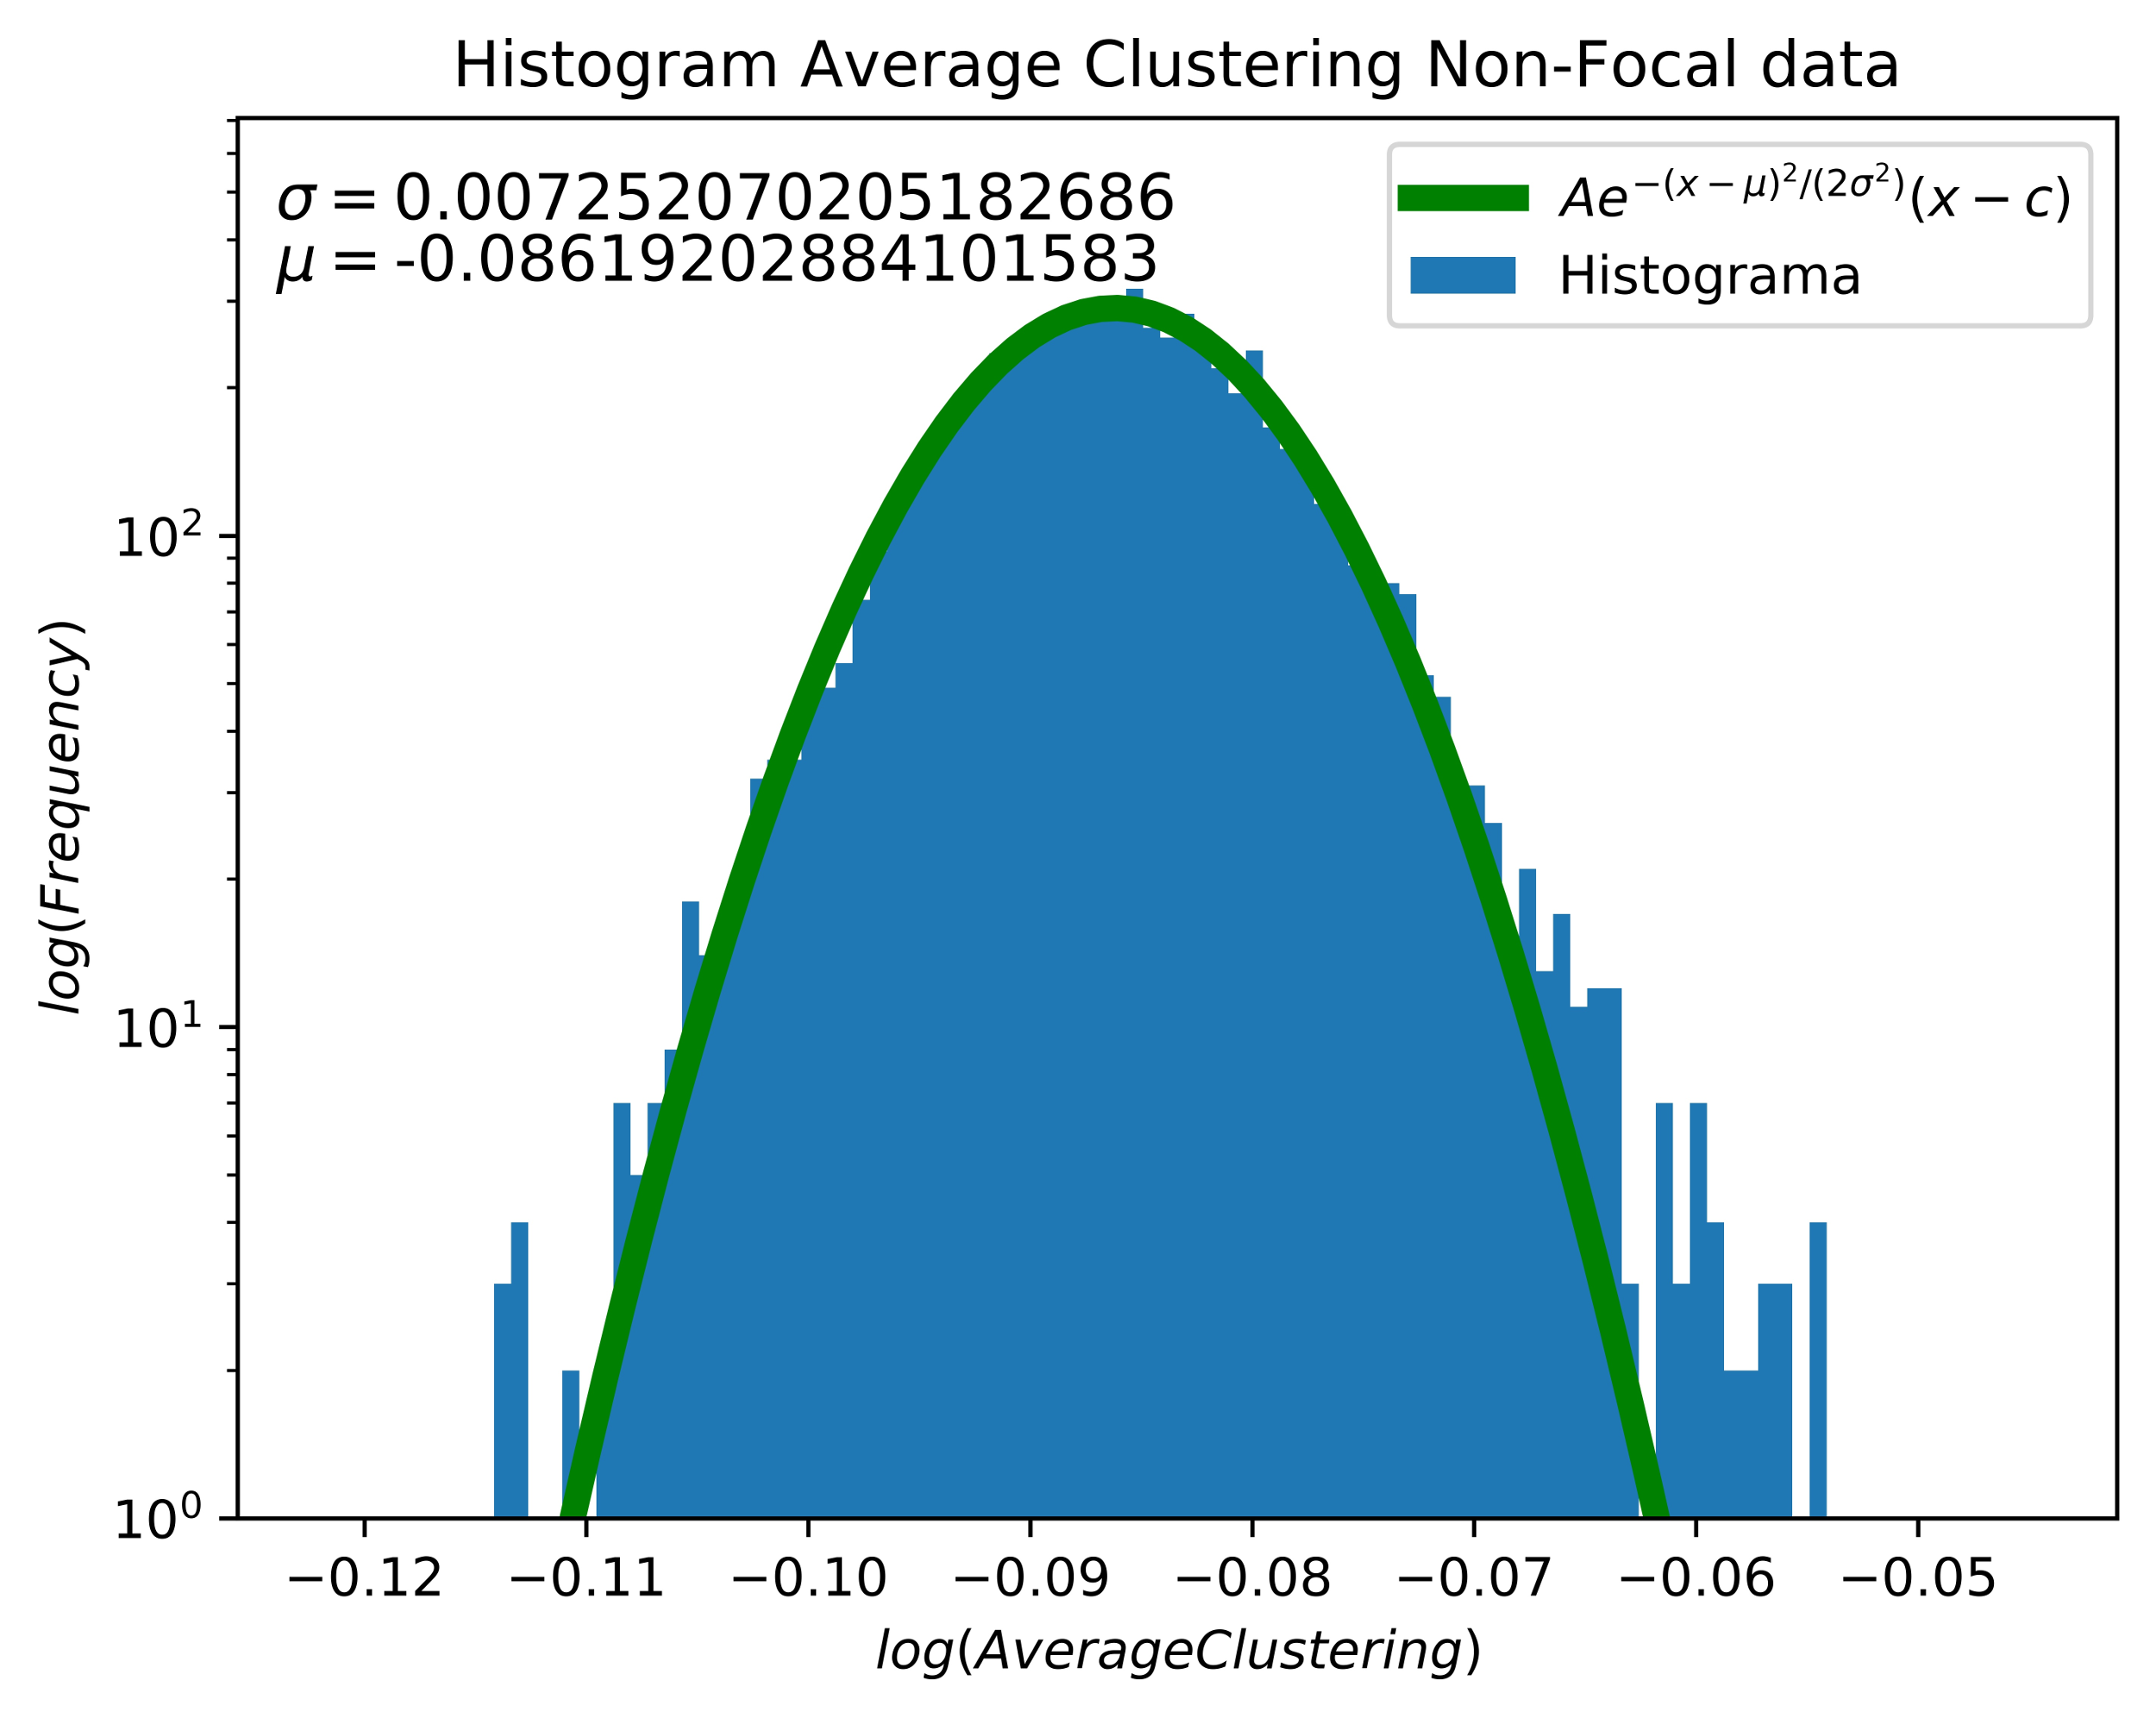 Figure 6
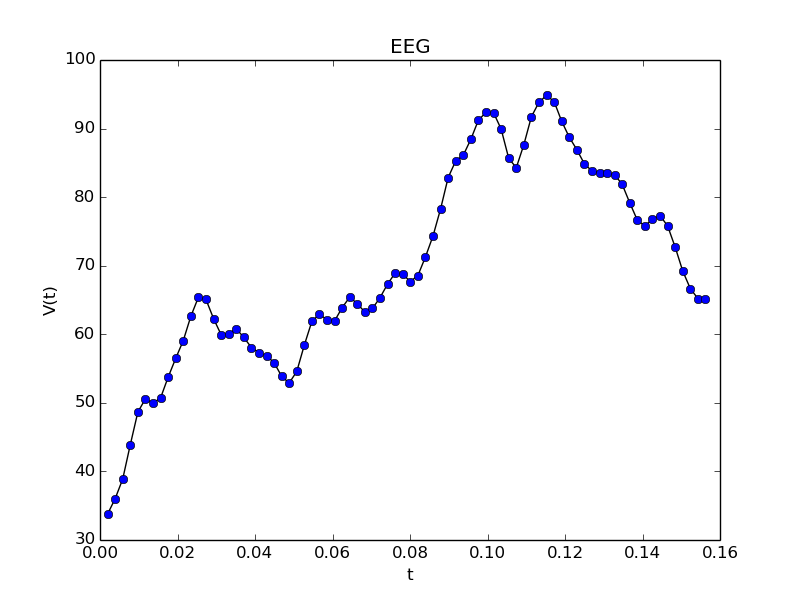 Figure 7
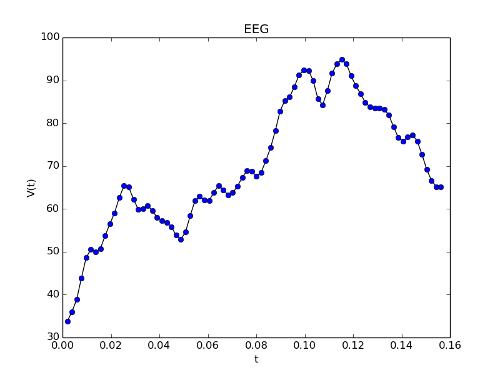 Figure 8
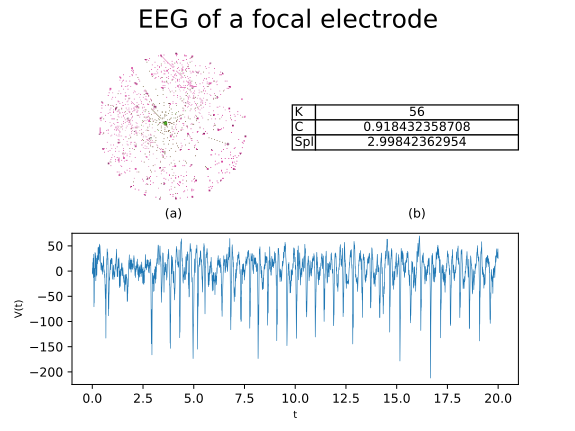 Figure 9
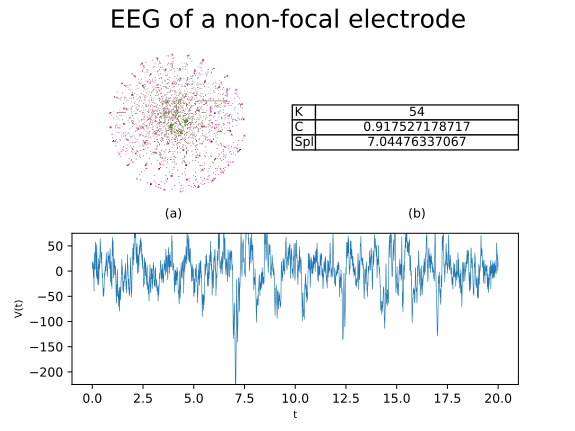 Figure 10
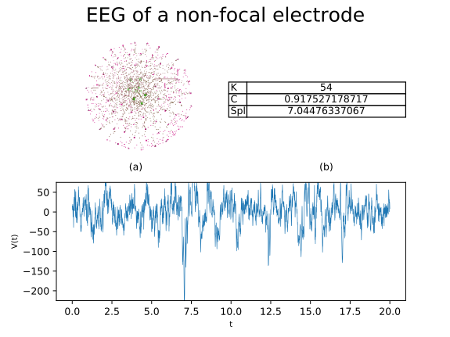 Figure 11
 Figure 12
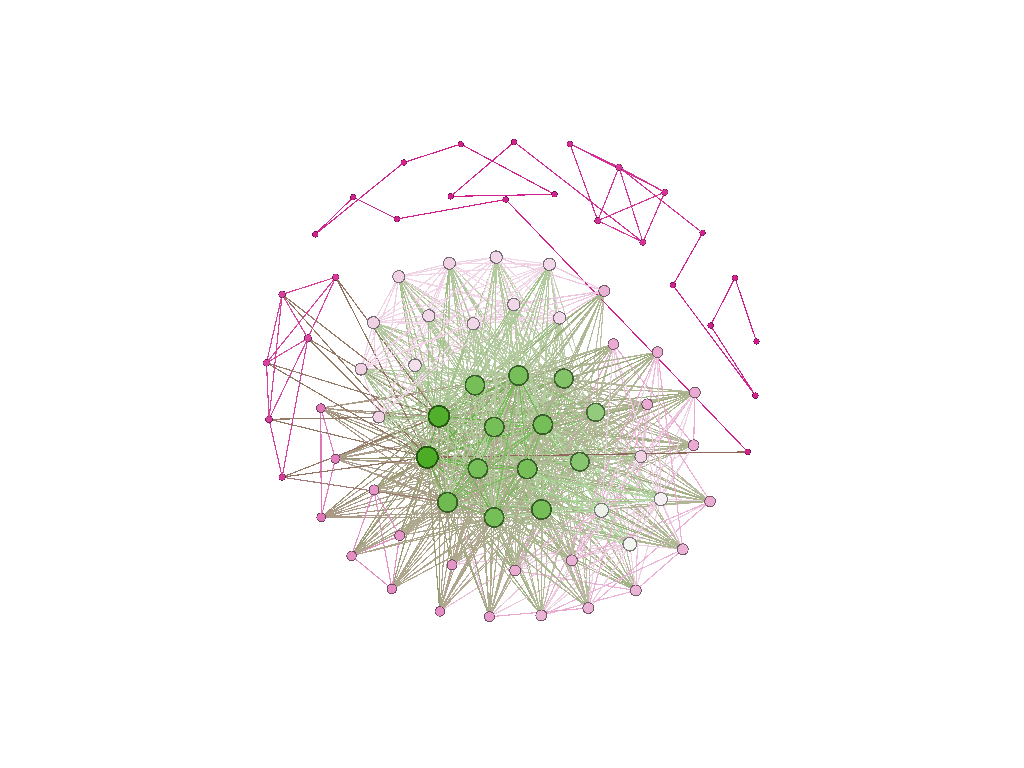 Figure 13
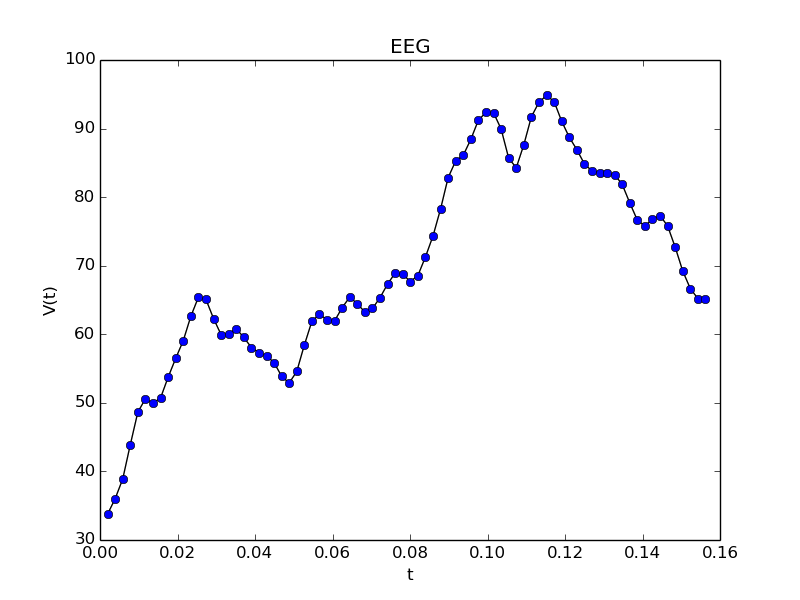 Figure 14
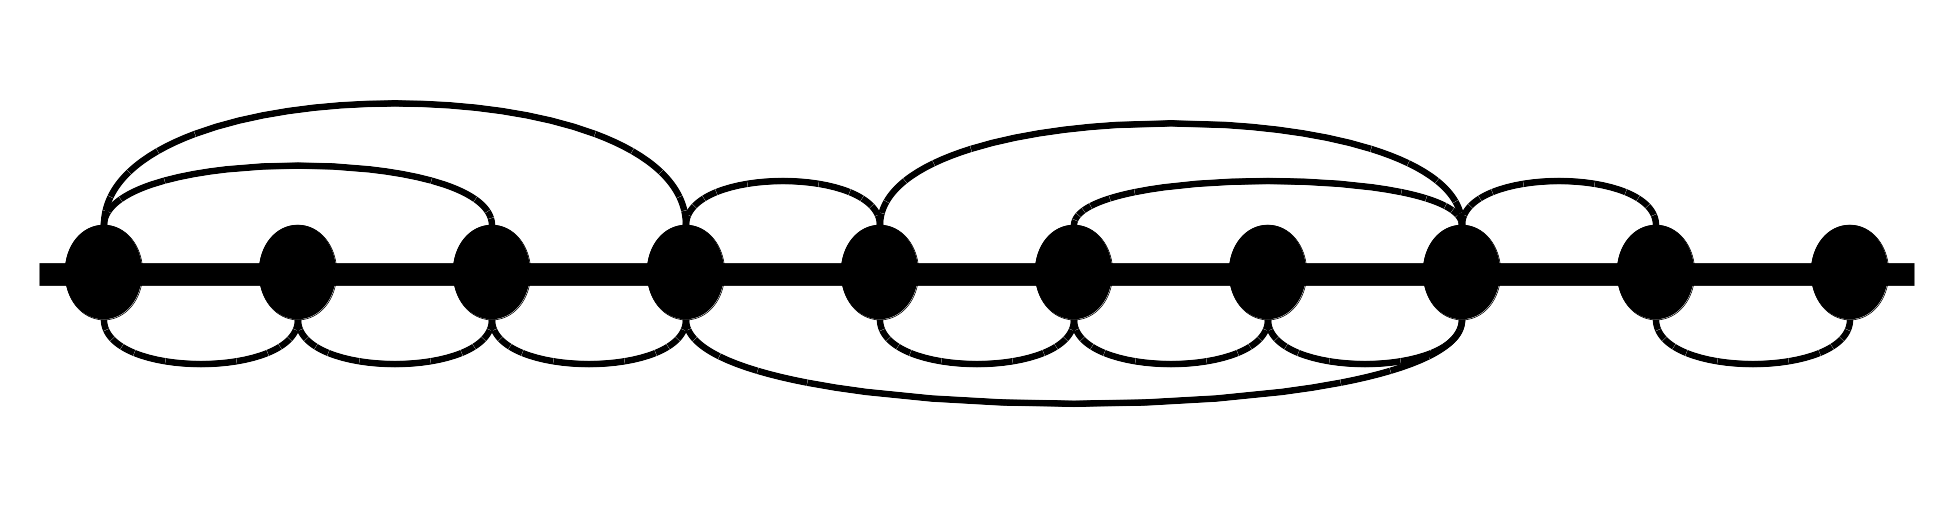 Figure 15
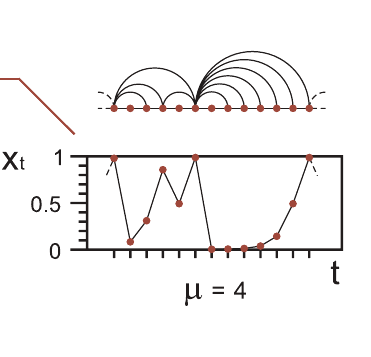 Figure 16
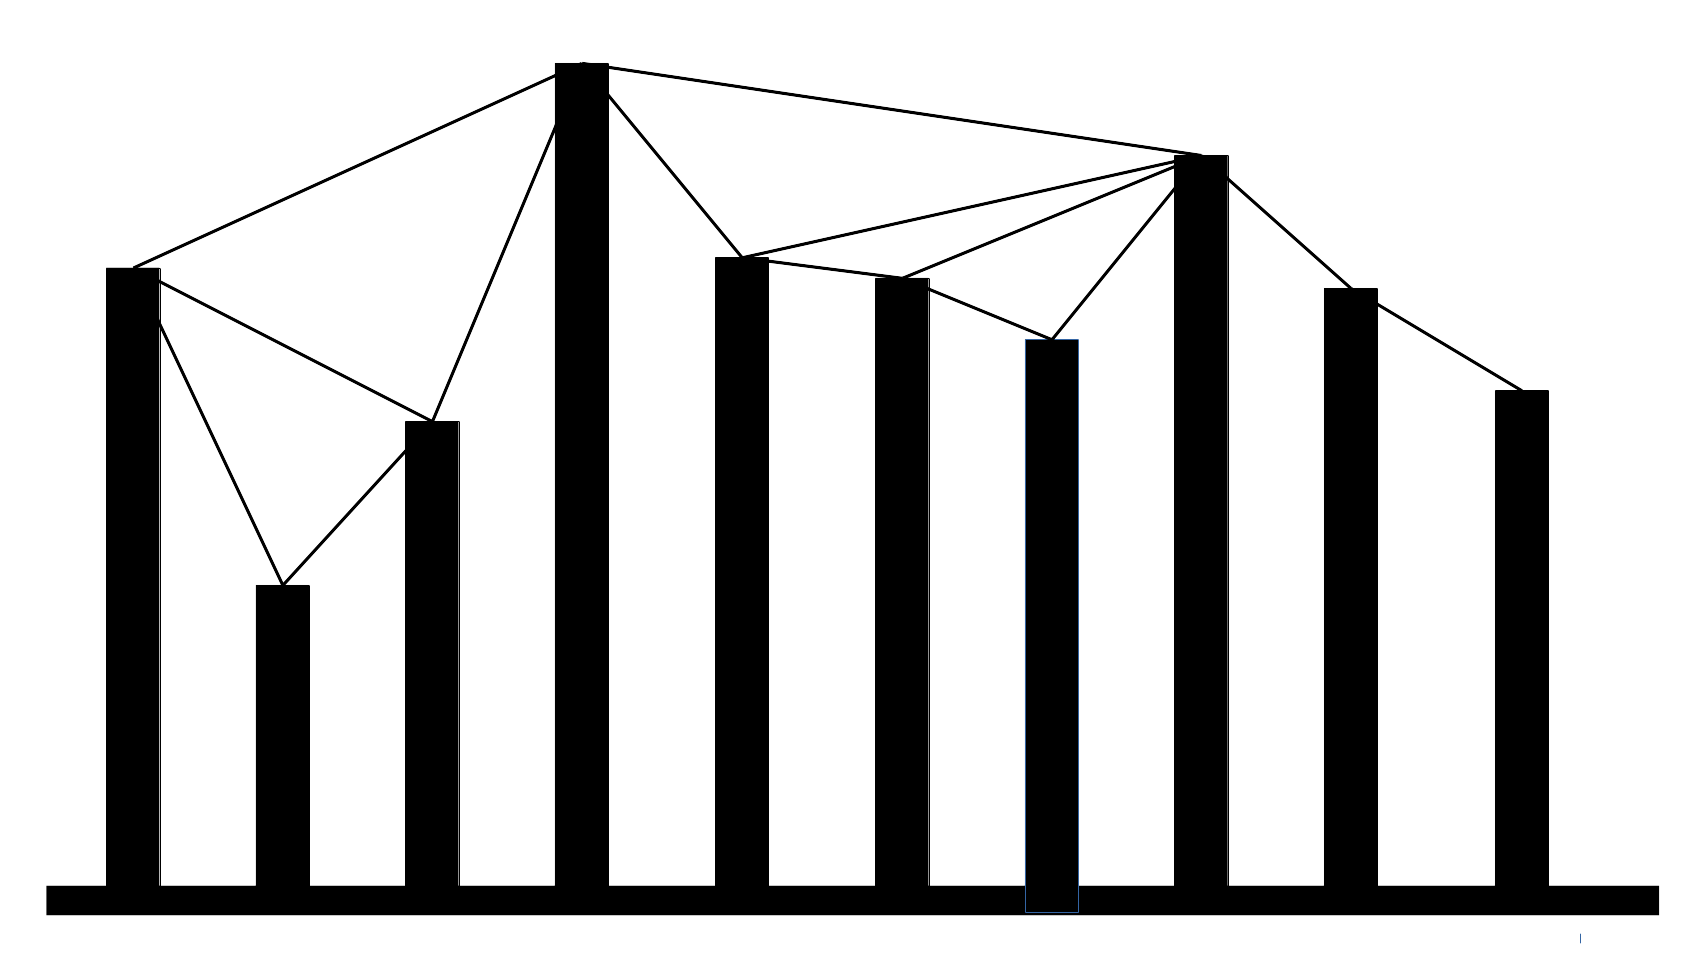 Figure 17
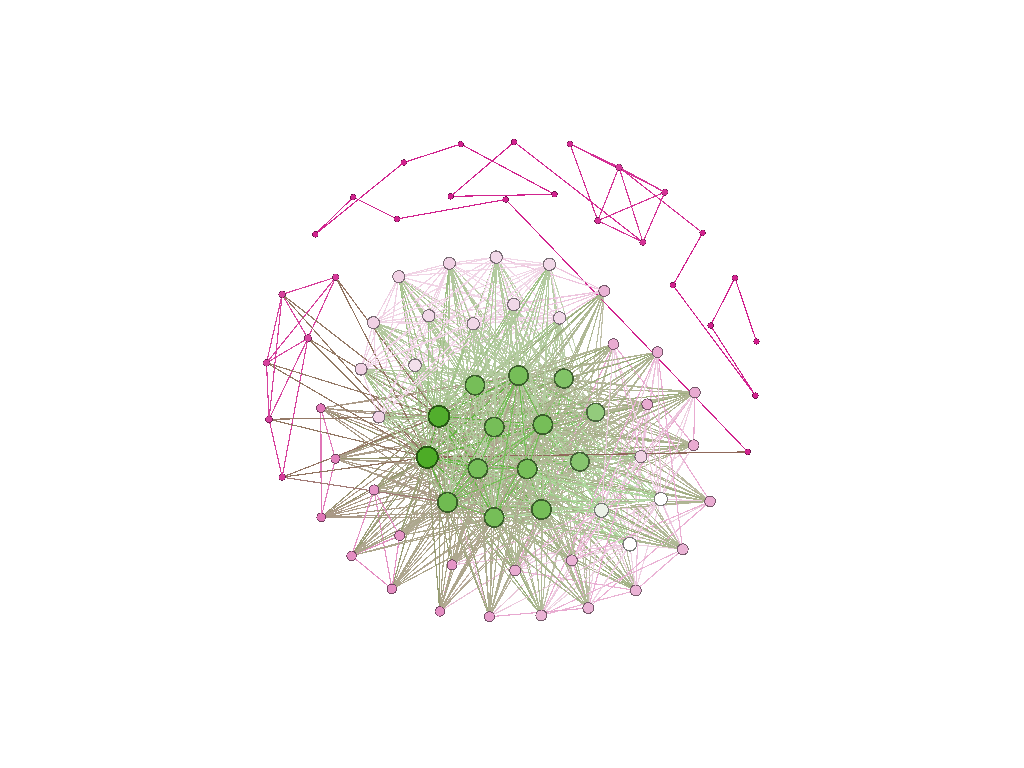 Figure 18
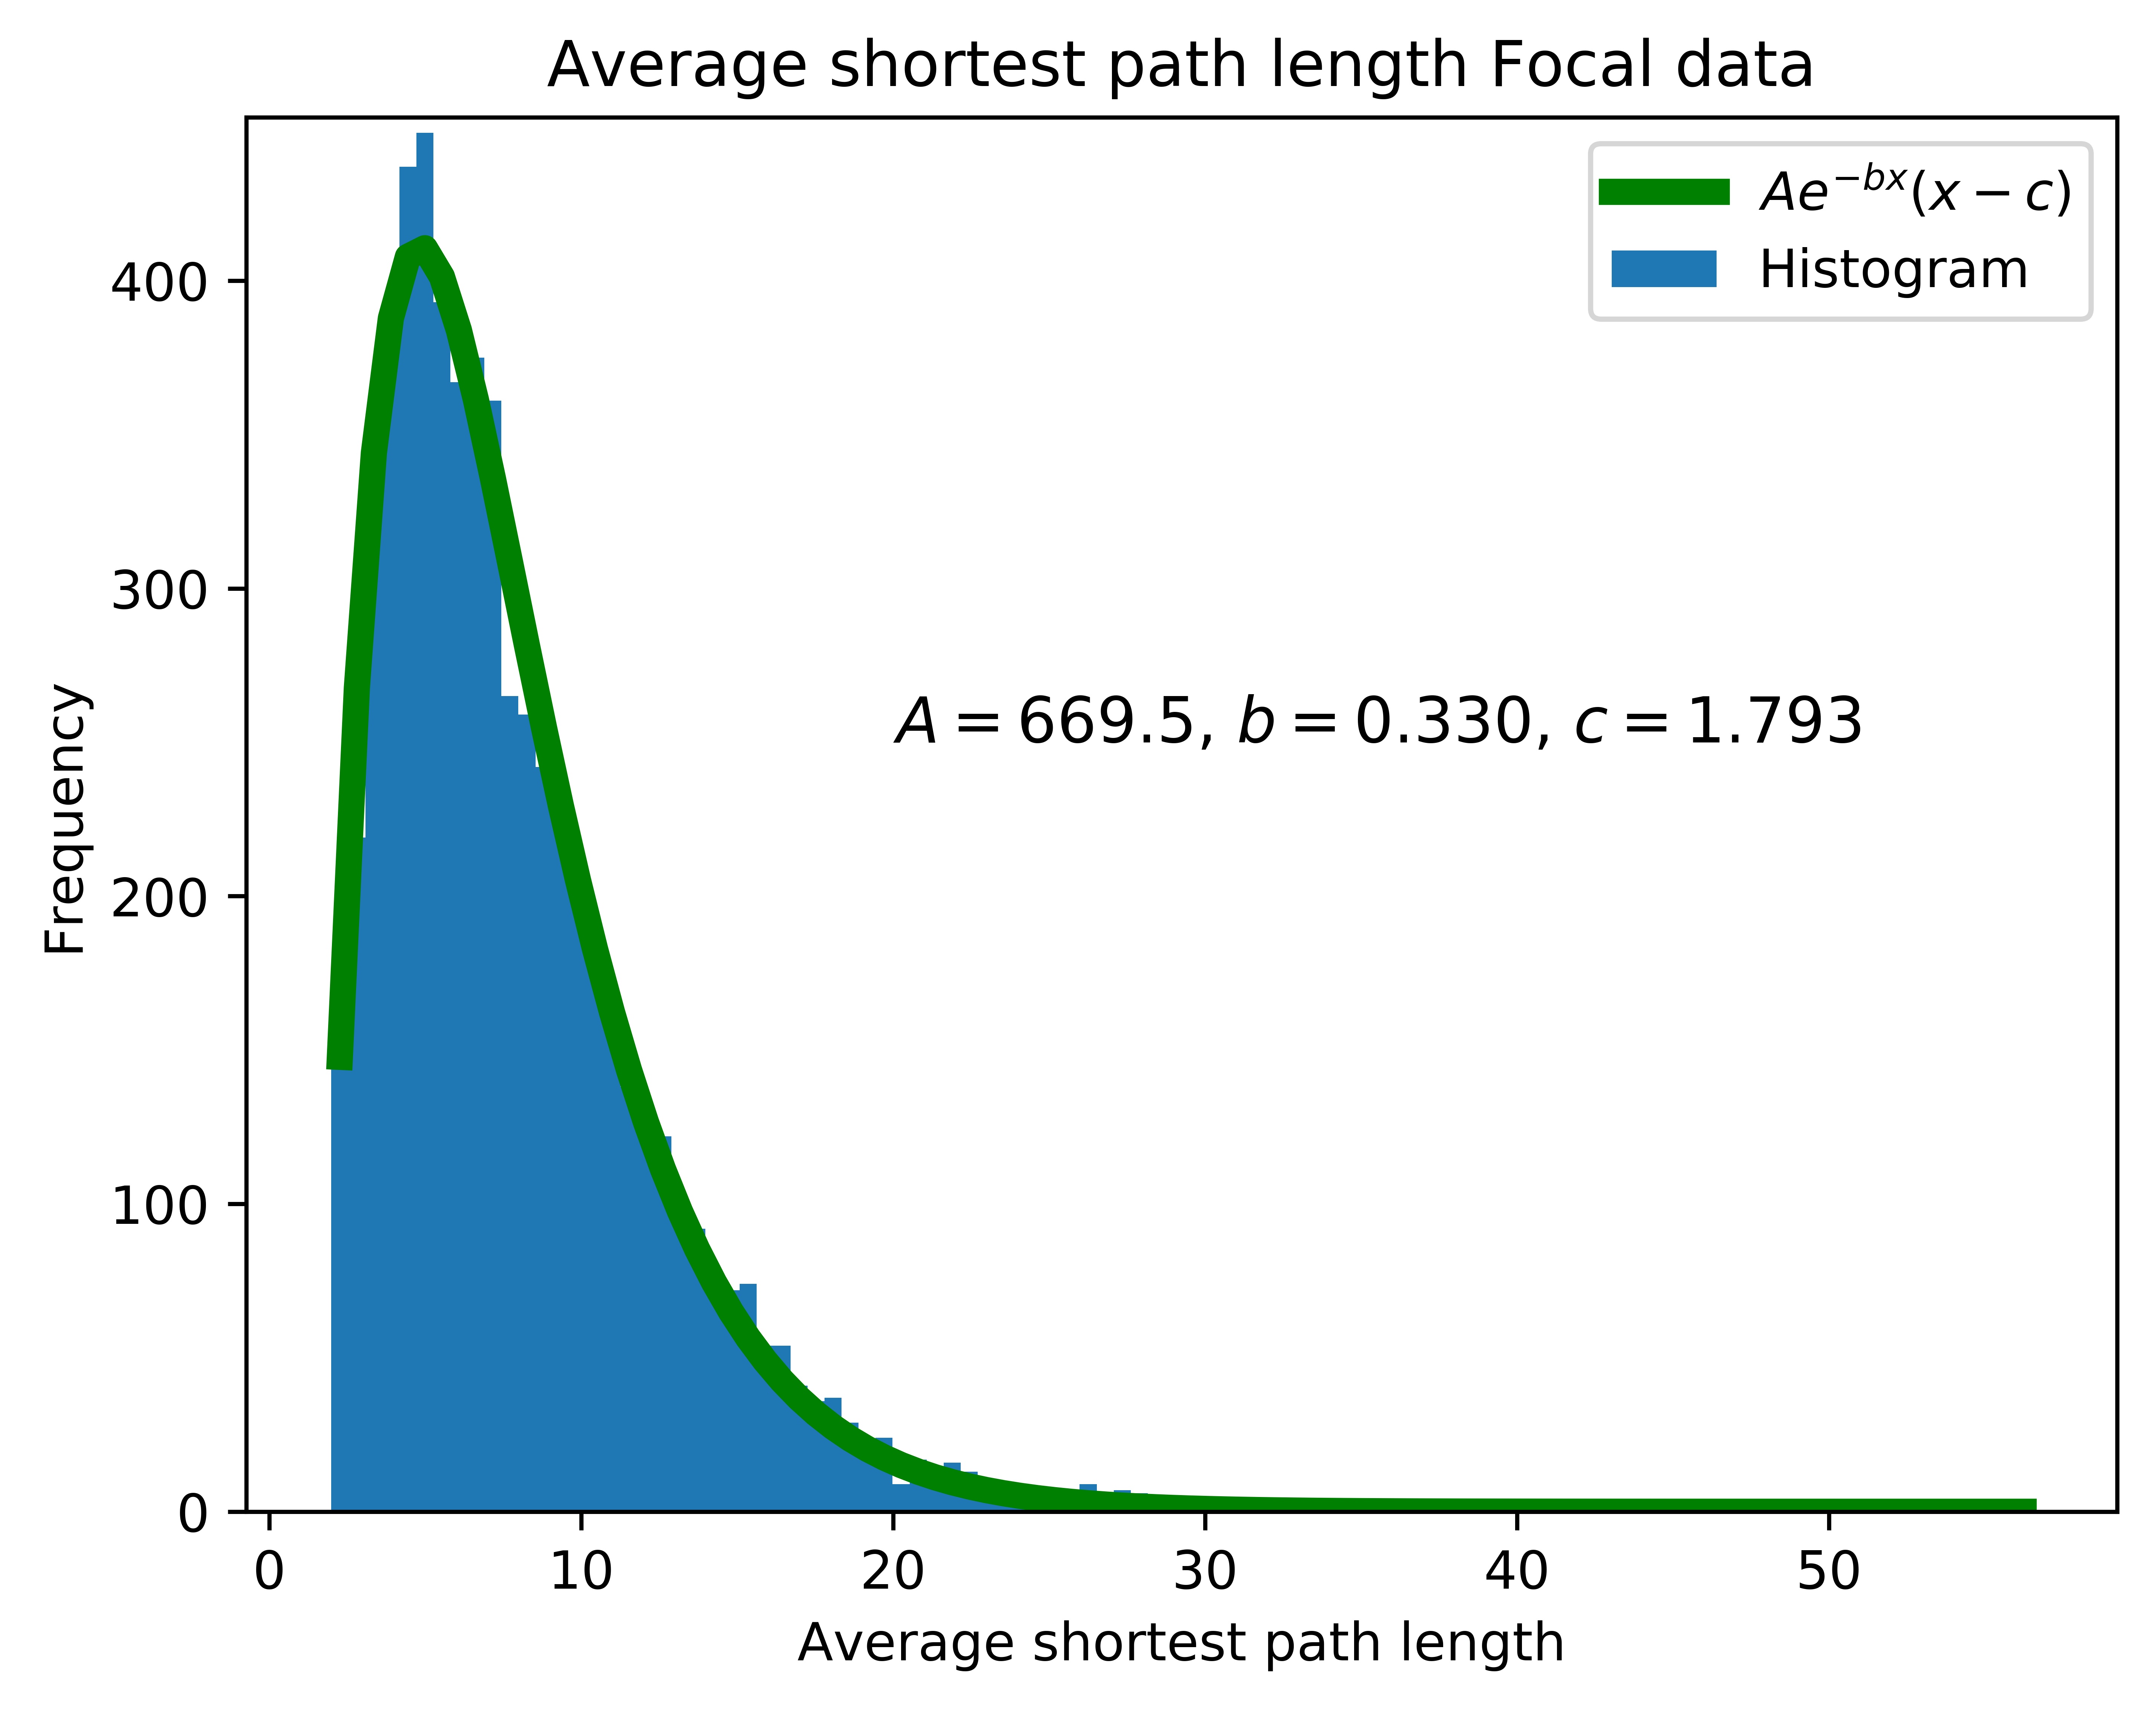 Figure 19
 Figure 20
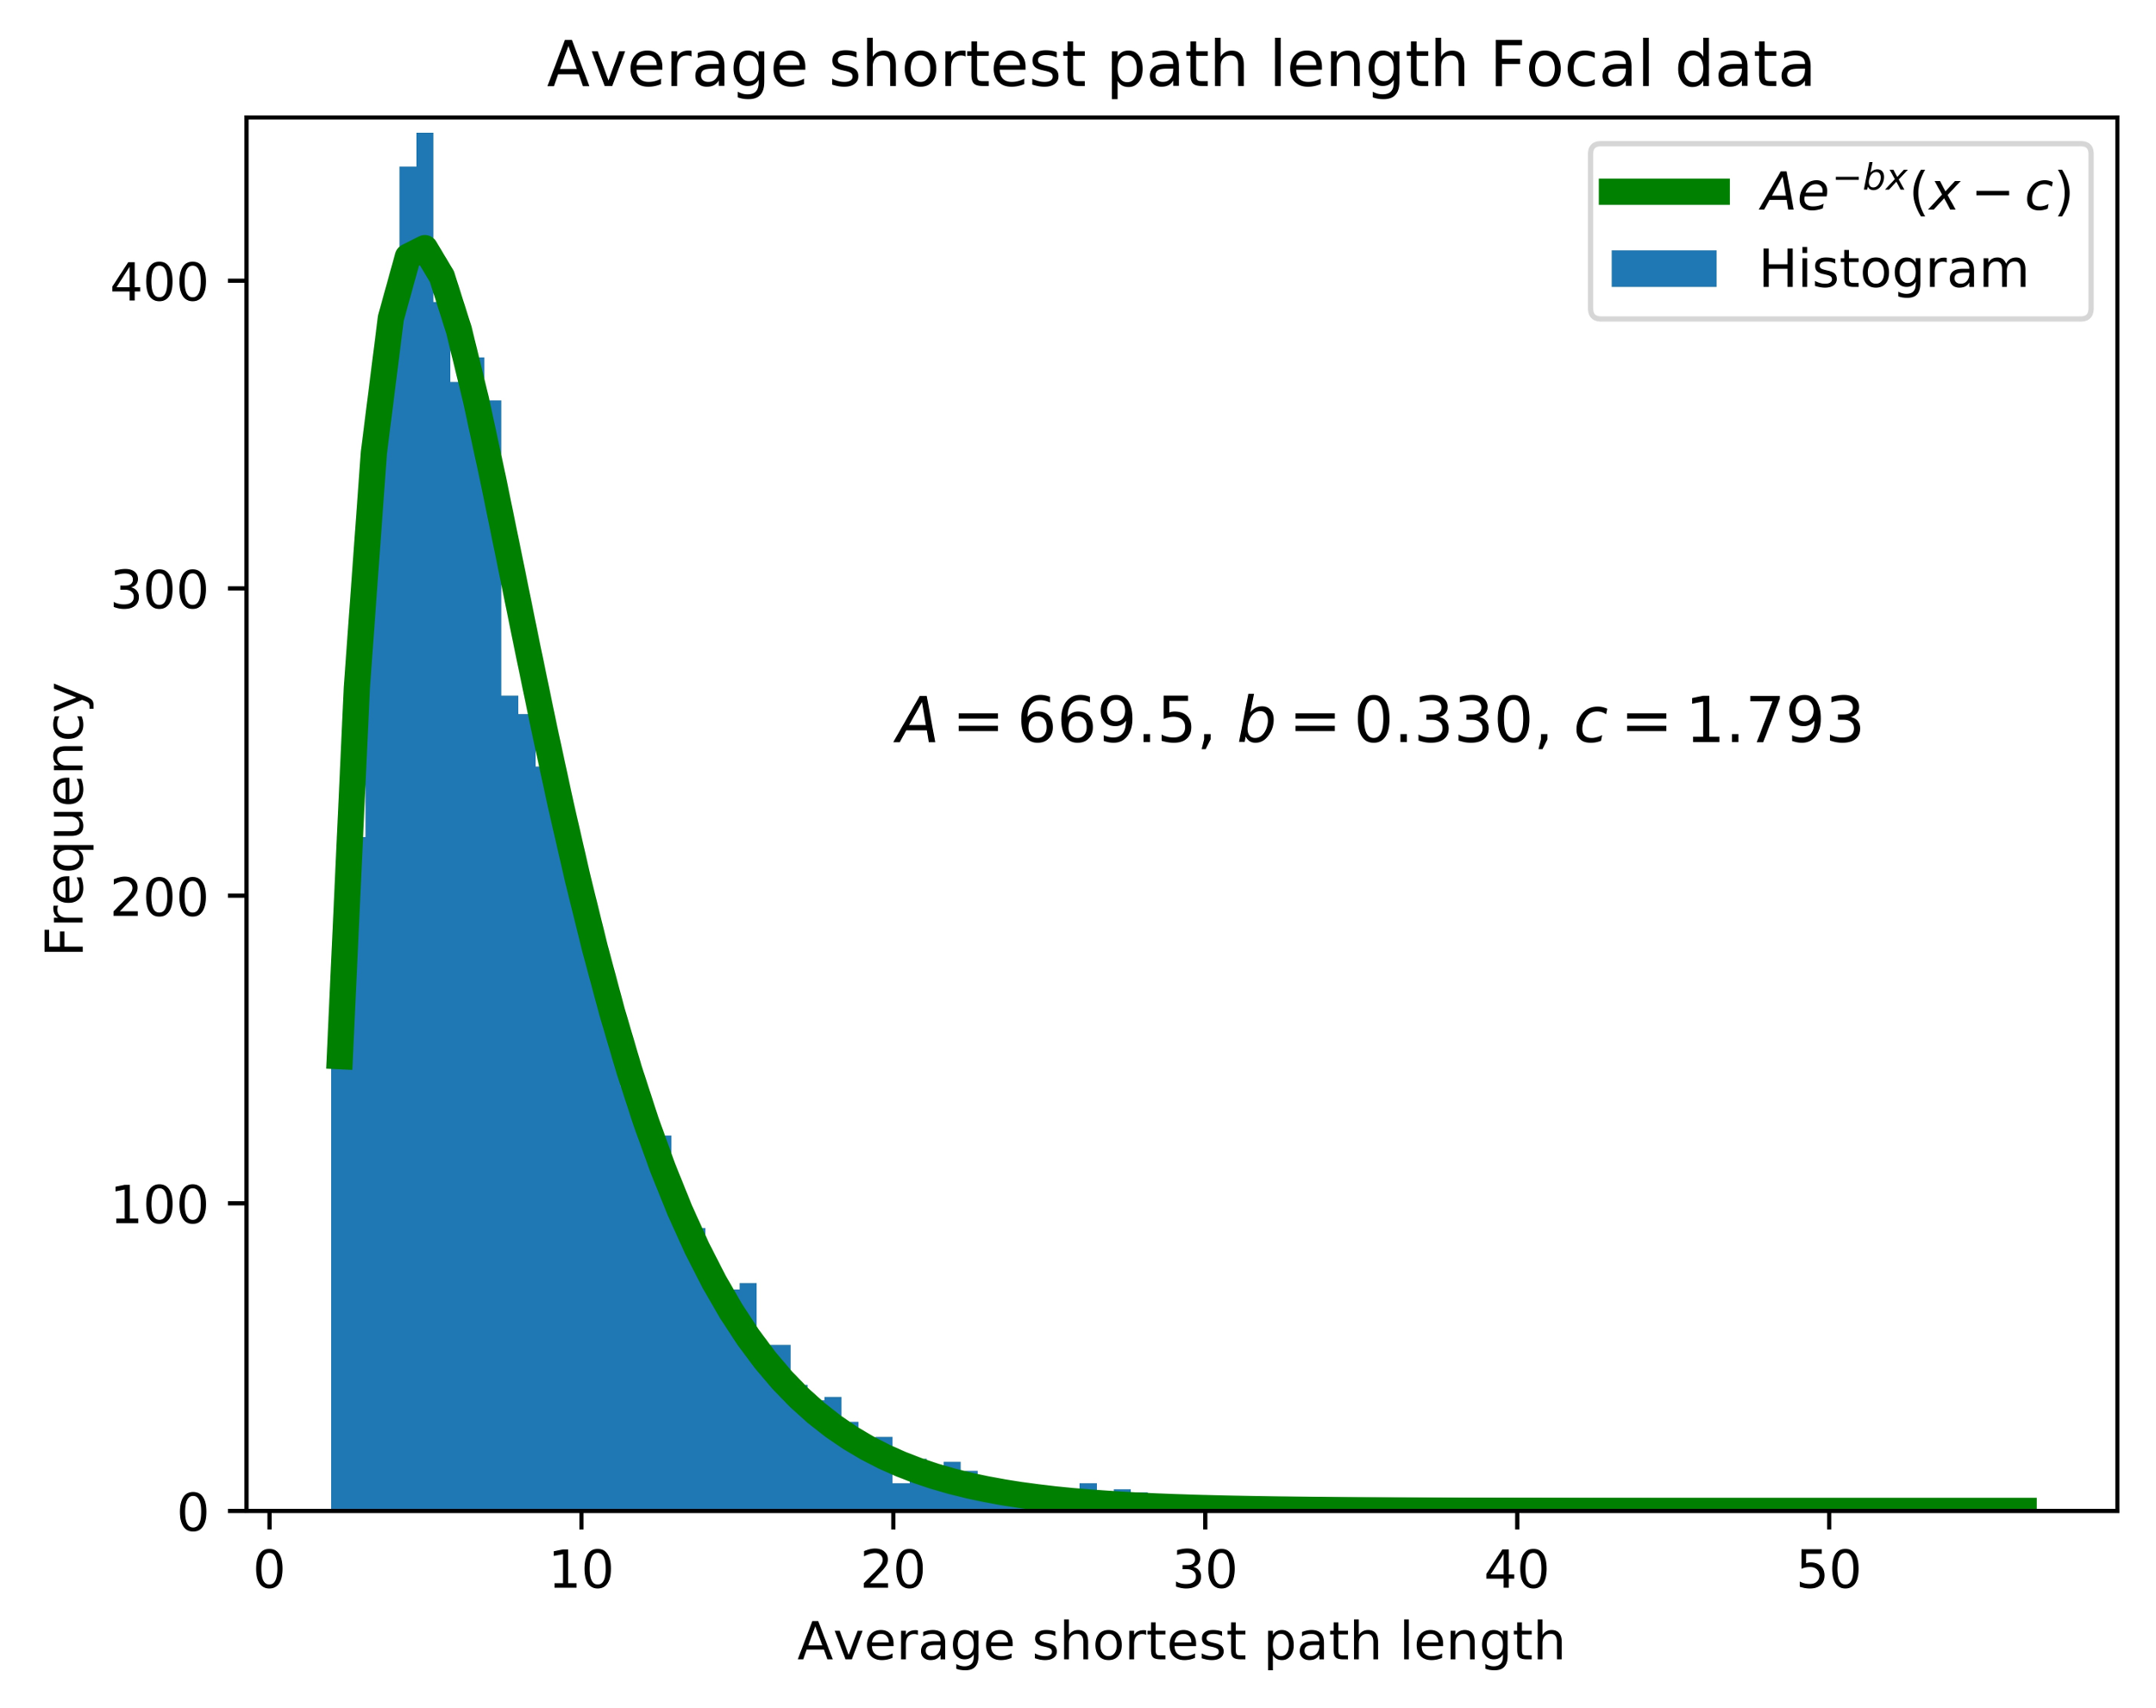 Figure 21
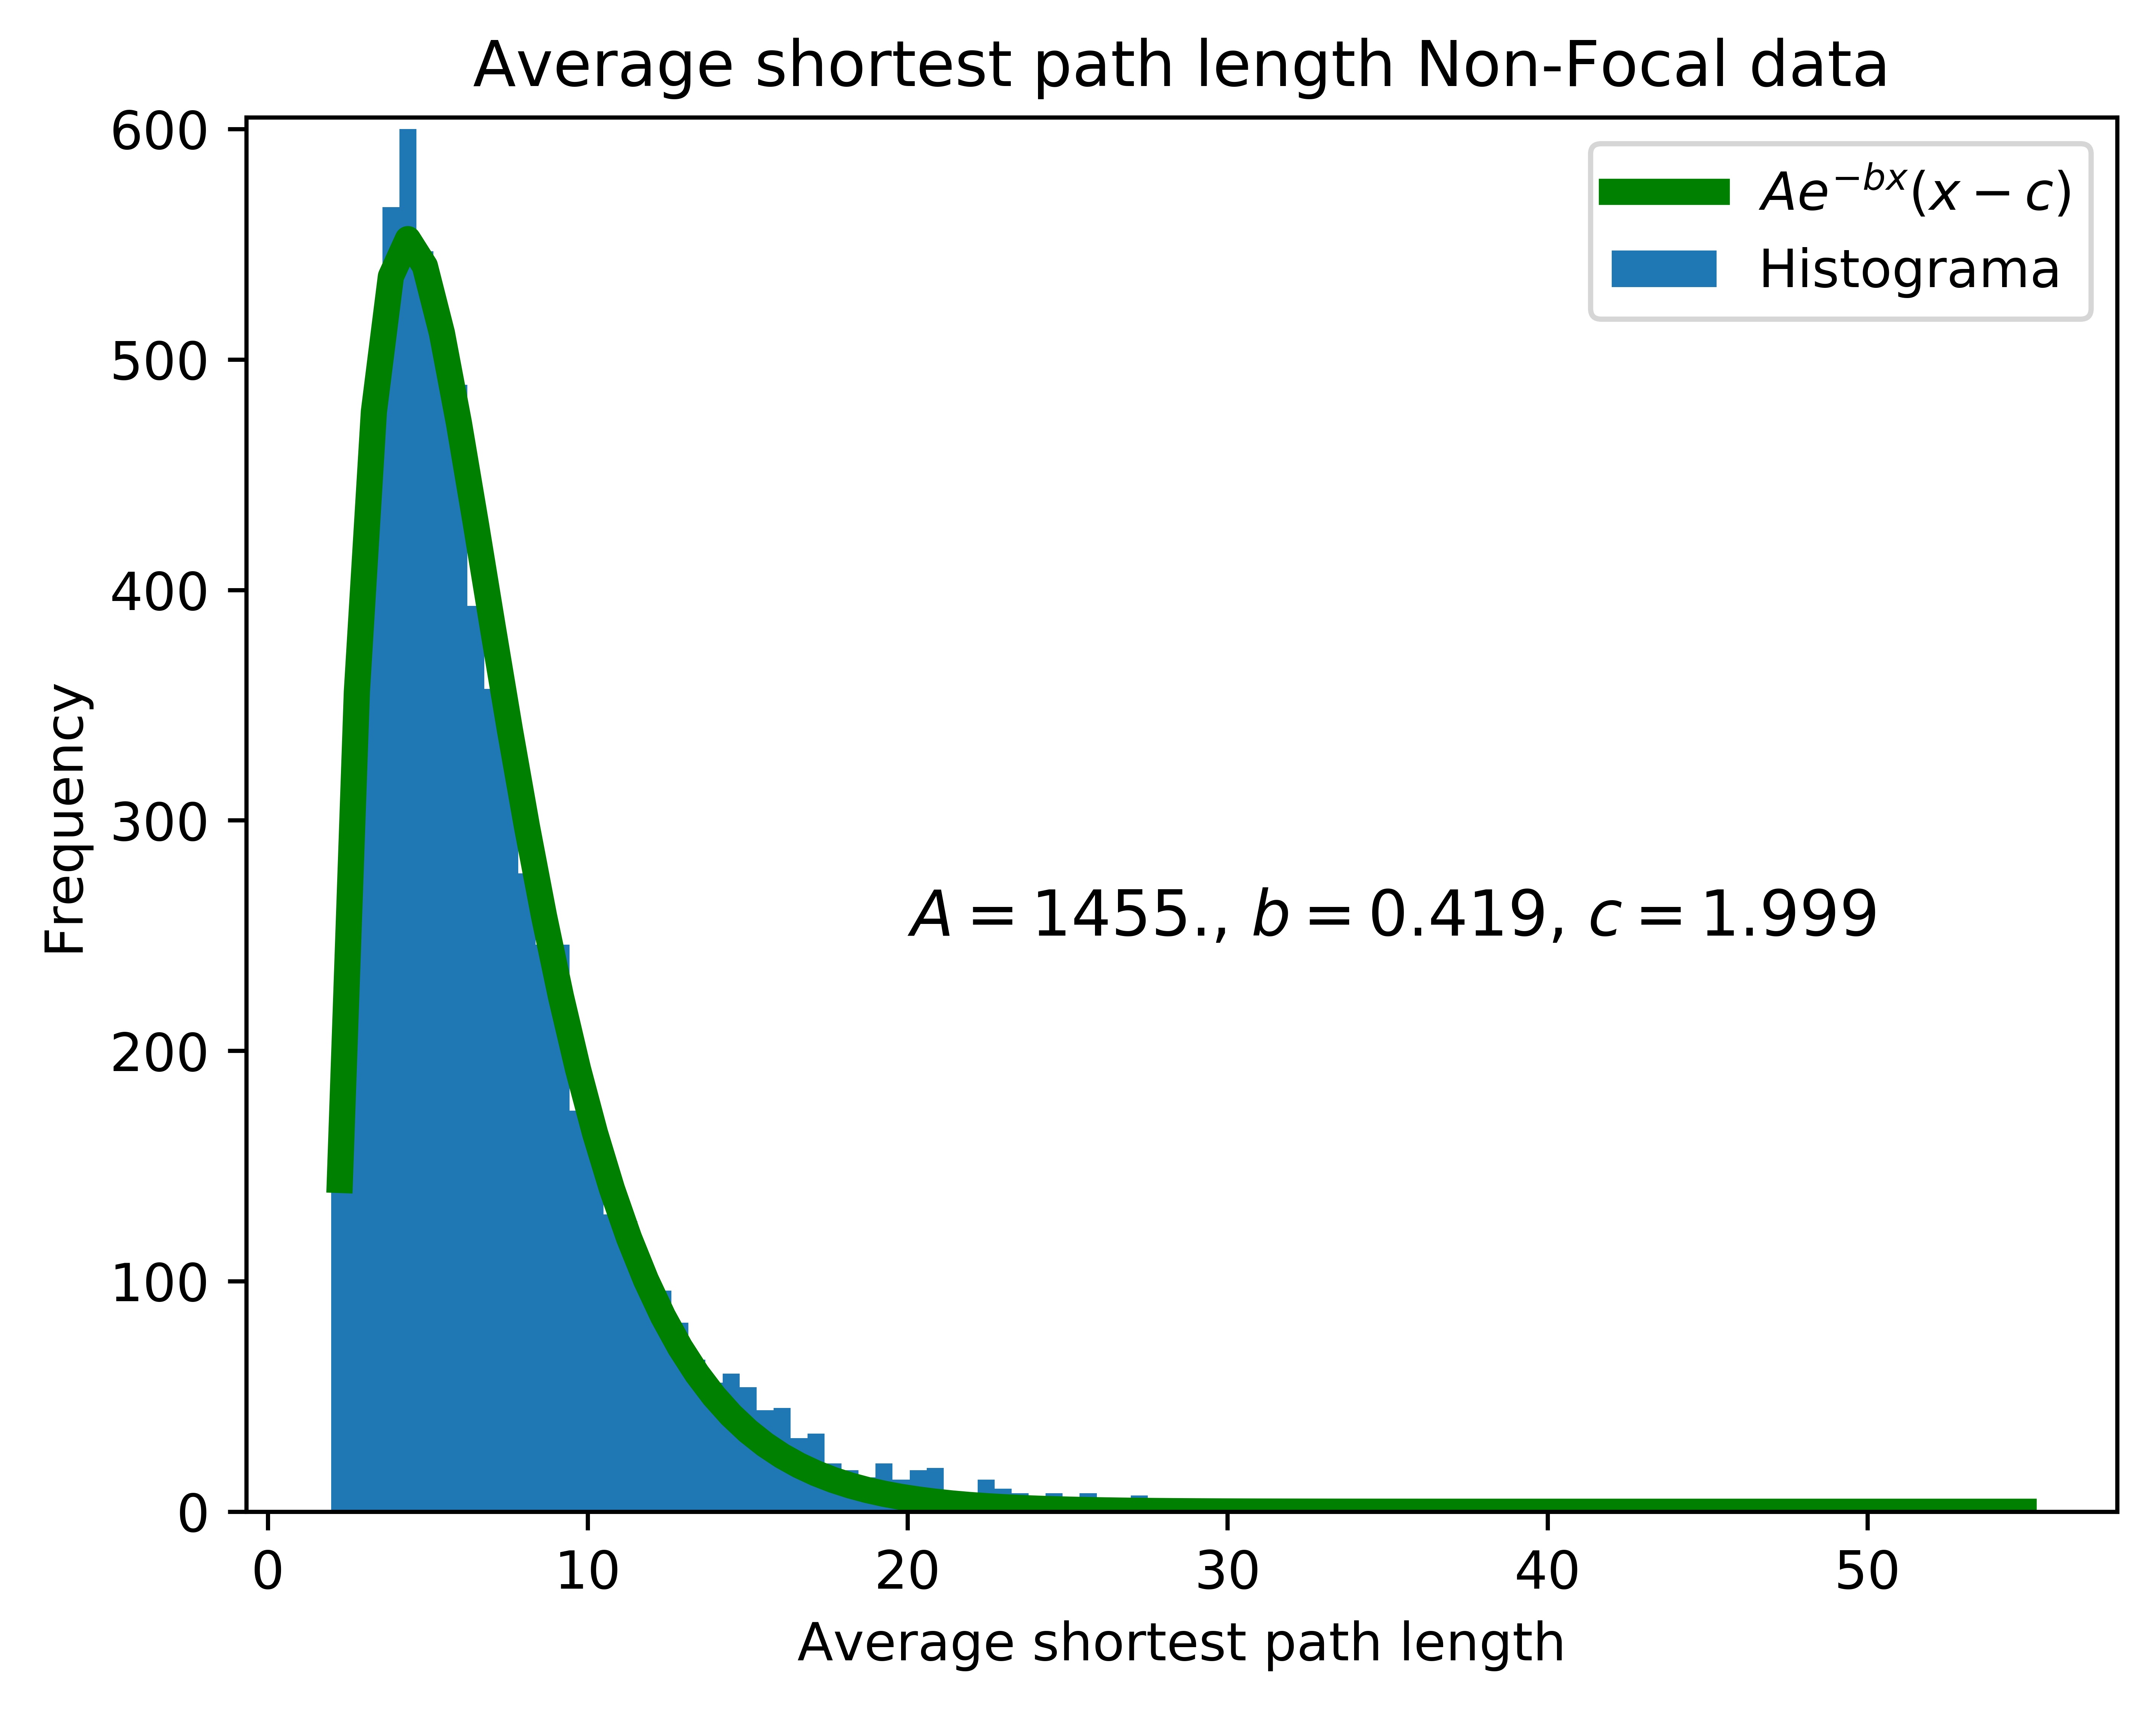 Figure 22
 Figure 23
 Figure 24
Peer Reviews
No public reviews on file for this paper yet. If you reviewed it on a platform where reviews are public (OpenReview, ICLR, NeurIPS, ICML), you can paste yours below so the community can read it here.
Videos
No videos yet. Explain this paper in a talk, walkthrough, or lecture? Add one.
Taxonomy
TopicsEEG and Brain-Computer Interfaces · Functional Brain Connectivity Studies · Neural dynamics and brain function
Identification of epileptic regions from
electroencephalographic data: Feigenbaum graphs
Gabriel Guarneros B
Cristian Pérez A
Andrea Montiel P
J. F. Rojas
Abstract
Diagnosing epilepsy is a problem of crucial importance. So analysing EEG data is of much importance to help this diagnosis. Assembling the Feigenbaum graphs for EEG signals. And calculating their average clustering, average degree, and average shortest path length. We manage to characterize two different data sets from each other.
Each data set consisted of focal and non-focal activity, from where epileptic regions could be identified. This method yields good results for identifying sets of data from epileptic zones. Suggesting our approach could be used to aid physicians with diagnosing epilepsy from EEG data.
Keywords: EEG, Epilepsy, Feigenbaum graphs, visibility graph
1 Introduction
Epilepsy is a disease that affects sixty five million people in different countries [1]. And two and a half million new cases are detected every year [1]. Epilepsy is a disease characterized, by an enduring predisposition to generate epileptic seizures. And by the neurobiological, cognitive, psychological, and social consequences of this condition [2].
Epileptic people are two or three times more likely to die prematurely [3]. And of the cases, begin in childhood or adolescence [4].
Epilepsy is characterized by seizures, which can affect persons of any age. The seizures can be as sparse as once a year, or as often as several times a day [5]. Seizure disorders are not necessarily epilepsy. Or in other words, not all seizures are epileptic fits [6, 7].
Epileptic seizures are unprovoked, due the involvement of the central nervous system. And, non-epileptic seizures could be due to several measurable causes [6]. Such as stroke, dementia, head injury, brain infections, congenital birth defects, birth-related brain injuries, tumors and other space occupying lesions [6, 8].
Given this factors, the importance of diagnosing epilepsy is very high [9]. And so, are the tools and techniques used and developed for this end [10, 11].
One of the procedures for diagnosing epilepsy, comes from analysing the EEG of a patient [12]. The EEG measures the electrical activity of the cortical area, by means of electrodes placed on the scalp of the patient [13]. More accurately, it measures the electrical potential of the dendrites of the neurons adjacent to cortical surface. Hence, the relevance of EEG analysis in diagnosing neural disorders, and epilepsy in particular [14].
Due to the fact that, EEG recordings are in essence a time series with lots of noise [15]. The task of analysing, and achieving a diagnosis, becomes a very difficult one [16, 17]. And requires a very well trained physician [9].
That is why many scientists, are trying to develop techniques to ease this workload, and facilitate the physician’s job [18, 19, 20].
One field of study of much relevance, is the automated EEG analysis. Which includes many computer aided algorithms, such as: component analysis [21], Fourier Transform [22, 23], wavelet transform [24, 25], and entropy analysis[26, 27, 28] among others [22, 29, 27, 30, 20].
Resenty Zhong-Ke Gao et al [31] presented a time-frequency visibility graph to classify epileptiform EEG data. They build the Adaptive Optimal time-frequency representation of the EEG, that renders a diagnostic energy distribution. Then, they assemble the visibility graphs, and classify them. Mainly by clustering coefficient, degree and coefficient entropy. Where they manage to achieve promising results to classify between, data with epileptiform activity and data without it.
Guohun Zhu et al [32] characterized sleep stages from EEG data. Using visibility graphs, and degree distributions for segments of single channel EEG recordings. They assembled the visibility graph, and subtracted a horizontal visibility graph edges, to obtain essential degree sequences. With this, they manage to obtain an accuracy for a six sleep stage classification.
On other hand, Deng Wang et al [33] manage to identify epilepsy seizure features. Using the basis-based wavelet packet entropy method, and a cross validation with the k-nearest neighbors. They manage to identify epilepsy on EEG recordings, with accuracy of about . Via 2- ,5-, and 10-fold cross validation.
In this study, we use Feigenbaum graphs to analyse EEG data from [34]. Using statistical criteria, such as average shortest path length and average clustering coefficient. We discern between signals “F” form a focal region, and “N” from the non focal region.
The data was taken from intracranial EEG, from five different epileptic patients. It was divided into two different datasets: the F set, that is the data from the focal epileptic point. The focal point was identified as the first electrode that measure the epileptic seizure. And the “N” set, that is the data from the non focal point. A non focal point is any other point that didn’t shows the epileptic seizure first [34].
2 Theory
2.1 Feigenbaum graphs
The Feigenbaum graphs are a tool to characterize time series data, by constructing a network from a given time series data set [35, 36]. Where the structure of the network, subtracts important information from the time series [37, 38, 39, 40].
The process for building the network is as follows: for each point in the data set, a node is added to the network. Then for each pair of points, and in the set. Every time the criterion , for all , such that is met. An edge is added between nodes and [6, 39].
Take the EEG from figure 5. For each data point, a node is added to the network in figure 6. And the edges are created following the procedure in figures 3 and 4 .
3 Statistical measurements
Having assembled the Feigenbaum graphs, we proceeded to analyse them. To find a measure to characterize them as “N” or “F” whichever was the case.
For this end, we calculated the average shortest path length for each graph. Which has a direct correlation to the size of the graph, and the data itself. On other hand, we calculated the average clustering coefficient. That is a measurement, of how the network is connected. And has correlation with how auto-similar the data is.
The average clustering coefficient is calculated by means of the equation 1 [41, 42].
[TABLE]
Where is the number of nodes in the network , and is the clustering coefficient for each node .
The clustering coefficient is calculated by means of equation 2 [43].
[TABLE]
Where is the number of triangles through node , and is the degree of .
Then the average shortest path length is calculated by means of the equation 3 [44].
[TABLE]
Where is the set of nodes in the graph, is the shortest path length from to . And is the number of nodes in the graph.
As we obtained the average shortest path length, and the average clustering coefficient for each signal in each data set. We then, assembled the distributions for the shortest path measurement in each data set. Shown in figures 8 and 11.
4 Results and Discussion
For each EEG signal in the data set, a feigenbaum graph was generated. Once all the graphs for each signal type (focal “F” and non-focal “N”) were obtained. The average shortest path length is calculated. The same as average clustering coefficient.
This renders two numbers to characterize each signal. Since we aim to characterize the data set as a hole. A distribution of this single parameter values comes in hand. Hence the figures 8, 9, 11, and 12.
Since the difference of parameters in average clustering coefficient fits, is not significant enough. The clustering coefficient, should not be considered as a good measurement for classification and desertion between the two data sets.
However, the difference in parameters for the curve fit for the average shortest path length distributions is significant. And given the data set is assembled in such a way, that does not include epileptogenic activity [34]. It is a measurement of different states of neural configurations.
Since activity for epileptic and non epileptic neural configurations are compiled in the database. And the difference in parameters and is significant. It suggests that it could be a measurement for epilepsy, or epileptic neural configurations, for any patient.
5 Conclusions
In this work we propose a new method to identify epileptic focal zones from the [34] database. Which we manage by assembling the Feigenbaum graph. And calculating the average shortest path length, and average clustering coefficient for every dataset.
The average clustering coefficient, turns to be not helpful in the desertion from different states of the data set. The average shortest path length does.
Following the idea and the way the dataset is assembled. This measurement could be calculated for a single patient. By assembling a dataset created from segments of EEG studies, no matter the time line.
Suggesting the calculation of the curve fit for the average shortest path length distribution, of Feigenbaum graphs of the dataset. Could help the physician assess a better diagnosis for the patient.
Acknowledgments
We are grateful for the facilities provided by the Laboratorio Nacional de Supercómputo (LNS) del Sureste de México to obtain these results.
The reference list from the paper itself. Each links out to its DOI / PubMed record.
- 1[1] Epilepsy Foundation. https://www.epilepsy.com/. Accessed: 2018-08-27.
- 2[2] Deborah Buck, Gus A Baker, Ann Jacoby, David F Smith, and David W Chadwick. Patients’ Experiences of Injury as a Result of Epilepsy. Epilepsia , 38(4):439–444, 1997.
- 3[3] Leone Ridsdale. Avoiding premature death in epilepsy. BMJ , 350, 2015.
- 4[4] A. T. Berg, F. A. Zelko, S. R. Levy, and F. M. Testa. Age at onset of epilepsy, pharmacoresistance, and cognitive outcomes: a prospective cohort study. Neurology , 79(13):1384–1391, Sep 2012.
- 5[5] W. Allen Hauser, John F. Annegers, and Leonard T. Kurland. Incidence of Epilepsy and Unprovoked Seizures in Rochester, Minnesota: 1935–1984. Epilepsia , 34(3):453–458.
- 6[6] N M G Bodde, J L Brooks, G A Baker, P A J M Boon, J G M Hendriksen, O G Mulder, and A P Aldenkamp. Psychogenic non-epileptic seizures–definition, etiology, treatment and prognostic issues: a critical review. Seizure , 18(8):543–553, October 2009.
- 7[7] M. Bandarabadi, J. Rasekhi, C. A. Teixeira, M. R. Karami, and A. Dourado. On the proper selection of preictal period for seizure prediction. Epilepsy Behav , 46:158–166, May 2015.
- 8[8] C. Zhou, L. Zemanova, G. Zamora, C. C. Hilgetag, and J. Kurths. Hierarchical organization unveiled by functional connectivity in complex brain networks. Phys. Rev. Lett. , 97(23):238103, Dec 2006.