A Closer Look at Some Gas-Phase Depletions in the ISM: Trends for O, Ge, and Kr vs. $F_*$, $f({\rm H}_2)$, and Starlight Intensity
Edward B. Jenkins

TL;DR
This study analyzes ultraviolet spectra of 100 stars to understand how interstellar element abundances of O, Ge, and Kr are affected by dust depletion, molecular hydrogen fraction, and ultraviolet starlight intensity, revealing environmental influences.
Contribution
It provides a detailed investigation of how specific environmental factors independently influence gas-phase abundances of O, Ge, and Kr in the interstellar medium, extending previous abundance studies.
Findings
Gas-phase abundances of O, Ge, and Kr negatively correlate with dust depletion factor.
Oxygen abundance positively correlates with molecular hydrogen fraction and starlight intensity.
No significant regional variations in Ge and O abundances after corrections.
Abstract
In a survey of archived ultraviolet spectra of 100 stars recorded by the echelle spectrograph of the Space Telescope Imaging Spectrograph (STIS) on the Hubble Space Telescope (HST), we measure the strengths of the weak absorption features of O I, Ge II and Kr I in the interstellar medium. Our objective is to undertake an investigation that goes beyond earlier abundance studies to see how these elements are influenced independently by three different environmental properties: (1) values of a generalized atomic depletion factor due to condensations onto dust grains (revealed here by the abundances of Mg and Mn relative to H), (2) the fraction of H atoms in the form of molecular hydrogen, , and (3) the ambient intensity of ultraviolet starlight relative to an average value in our part of the Galaxy . As expected, the gas-phase abundances of all three elements…
Click any figure to enlarge with its caption.
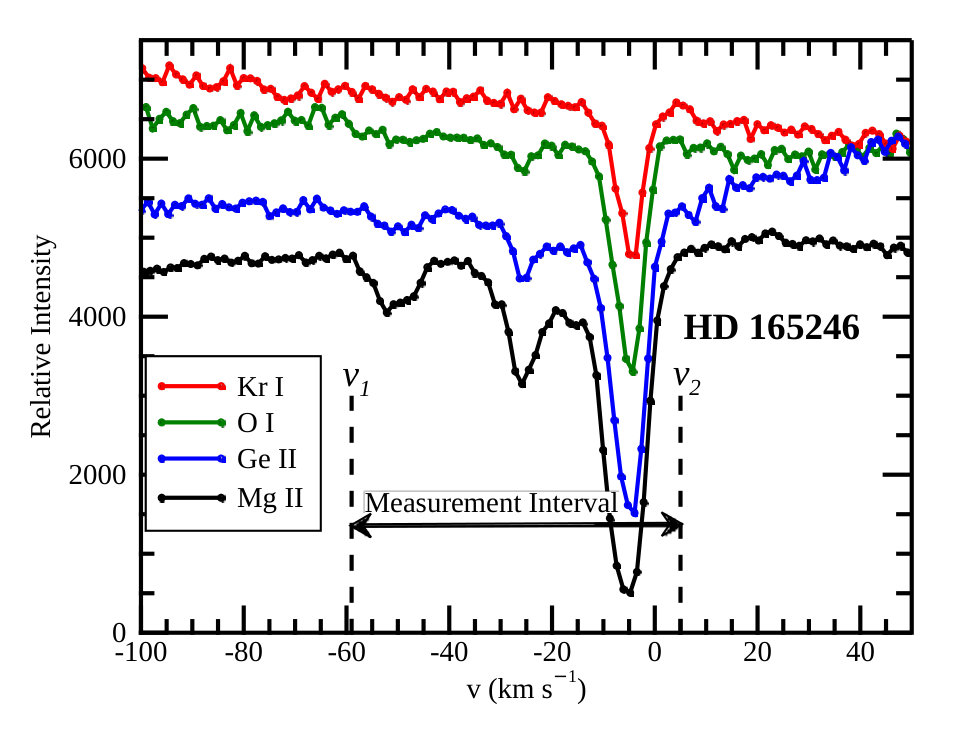 Figure 1
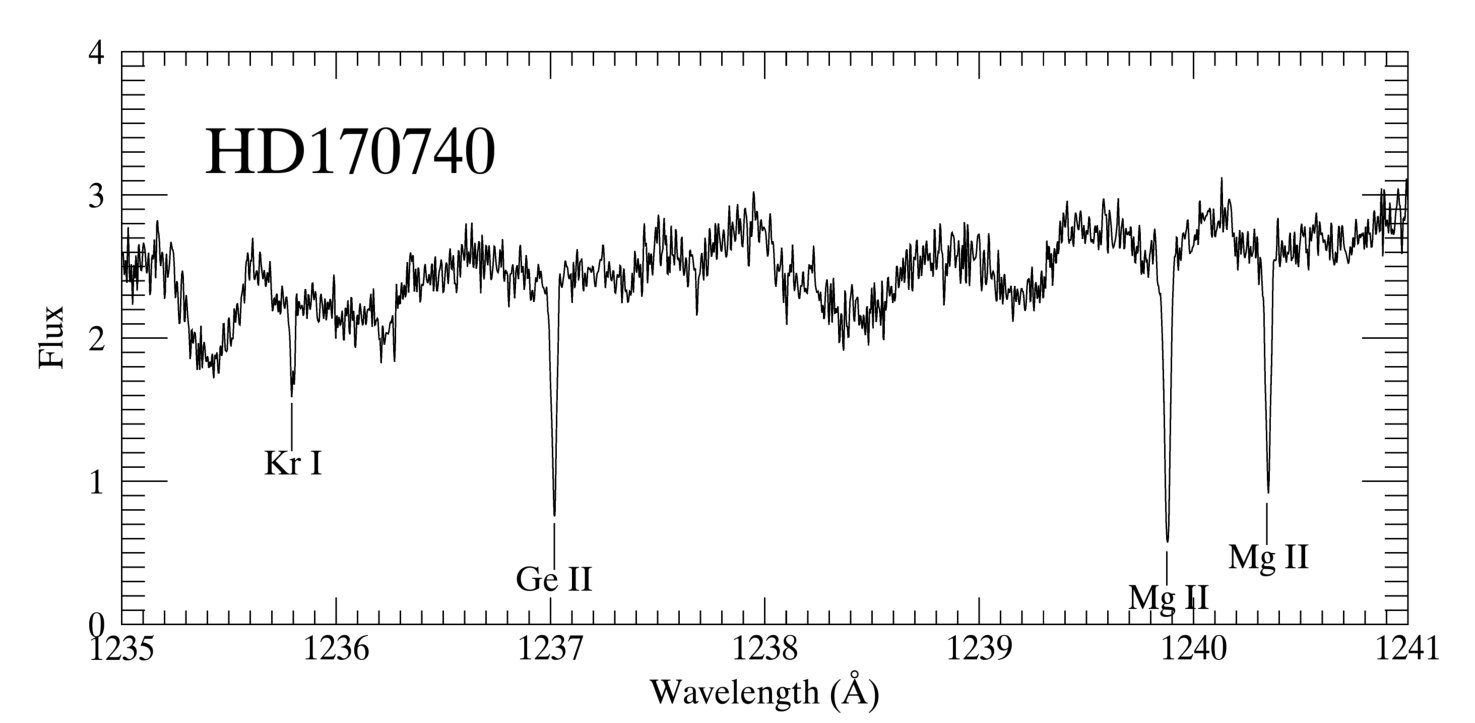 Figure 2
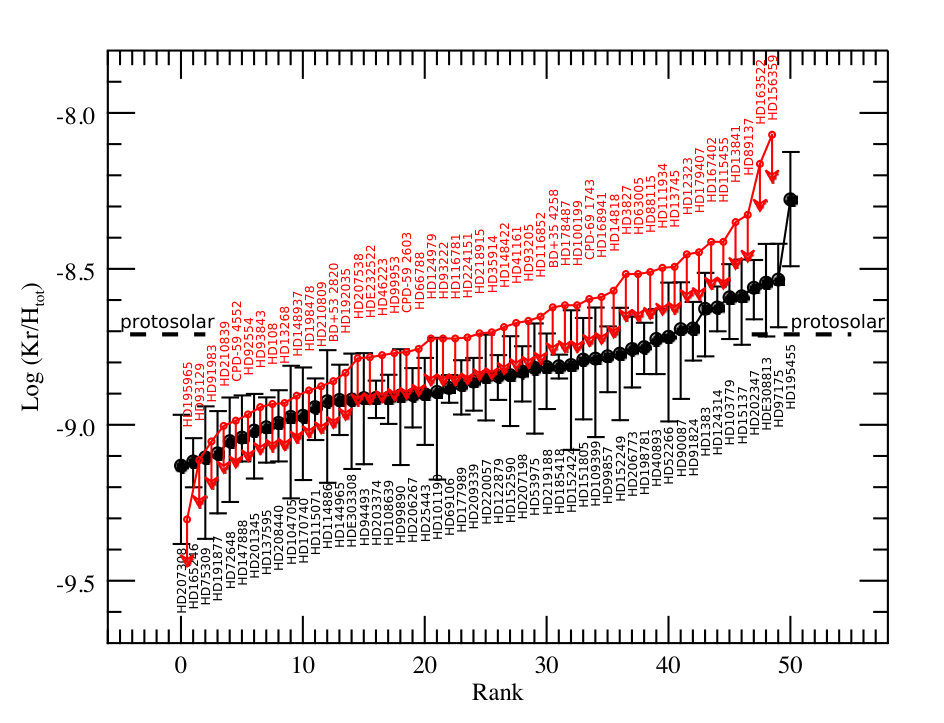 Figure 3
 Figure 4
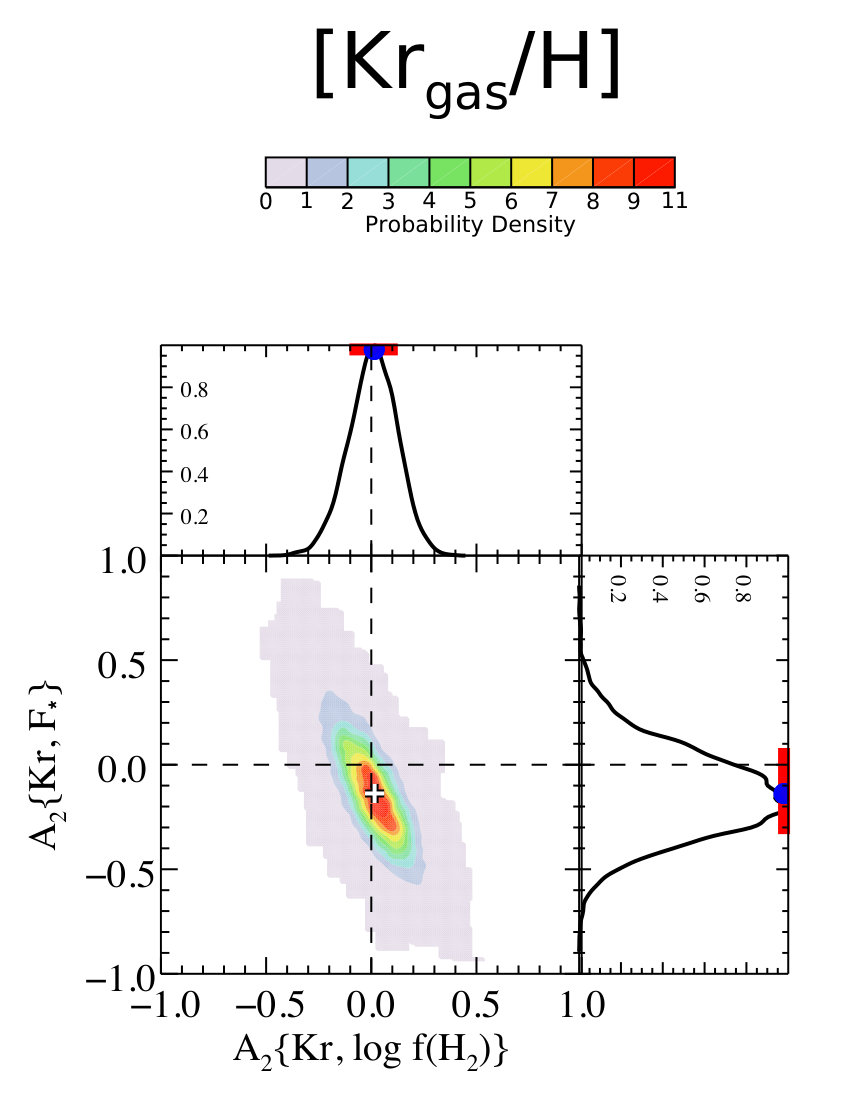 Figure 5
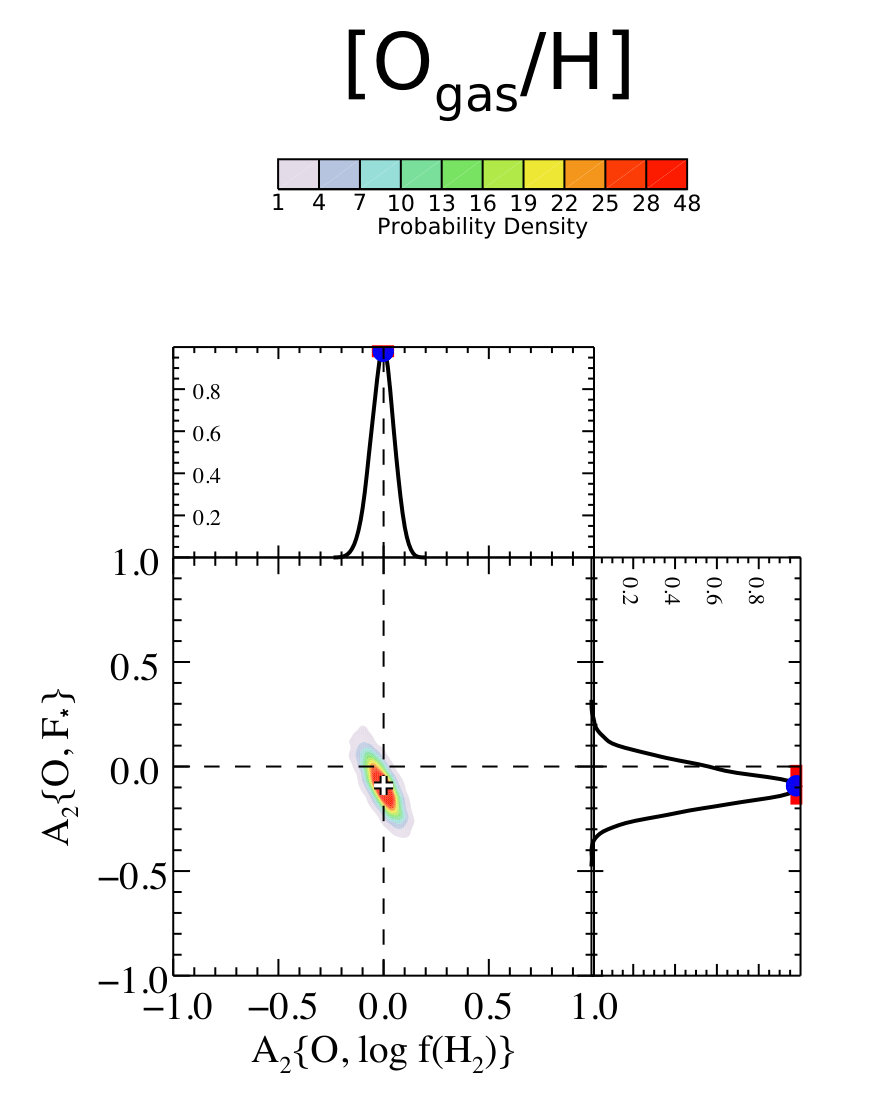 Figure 6
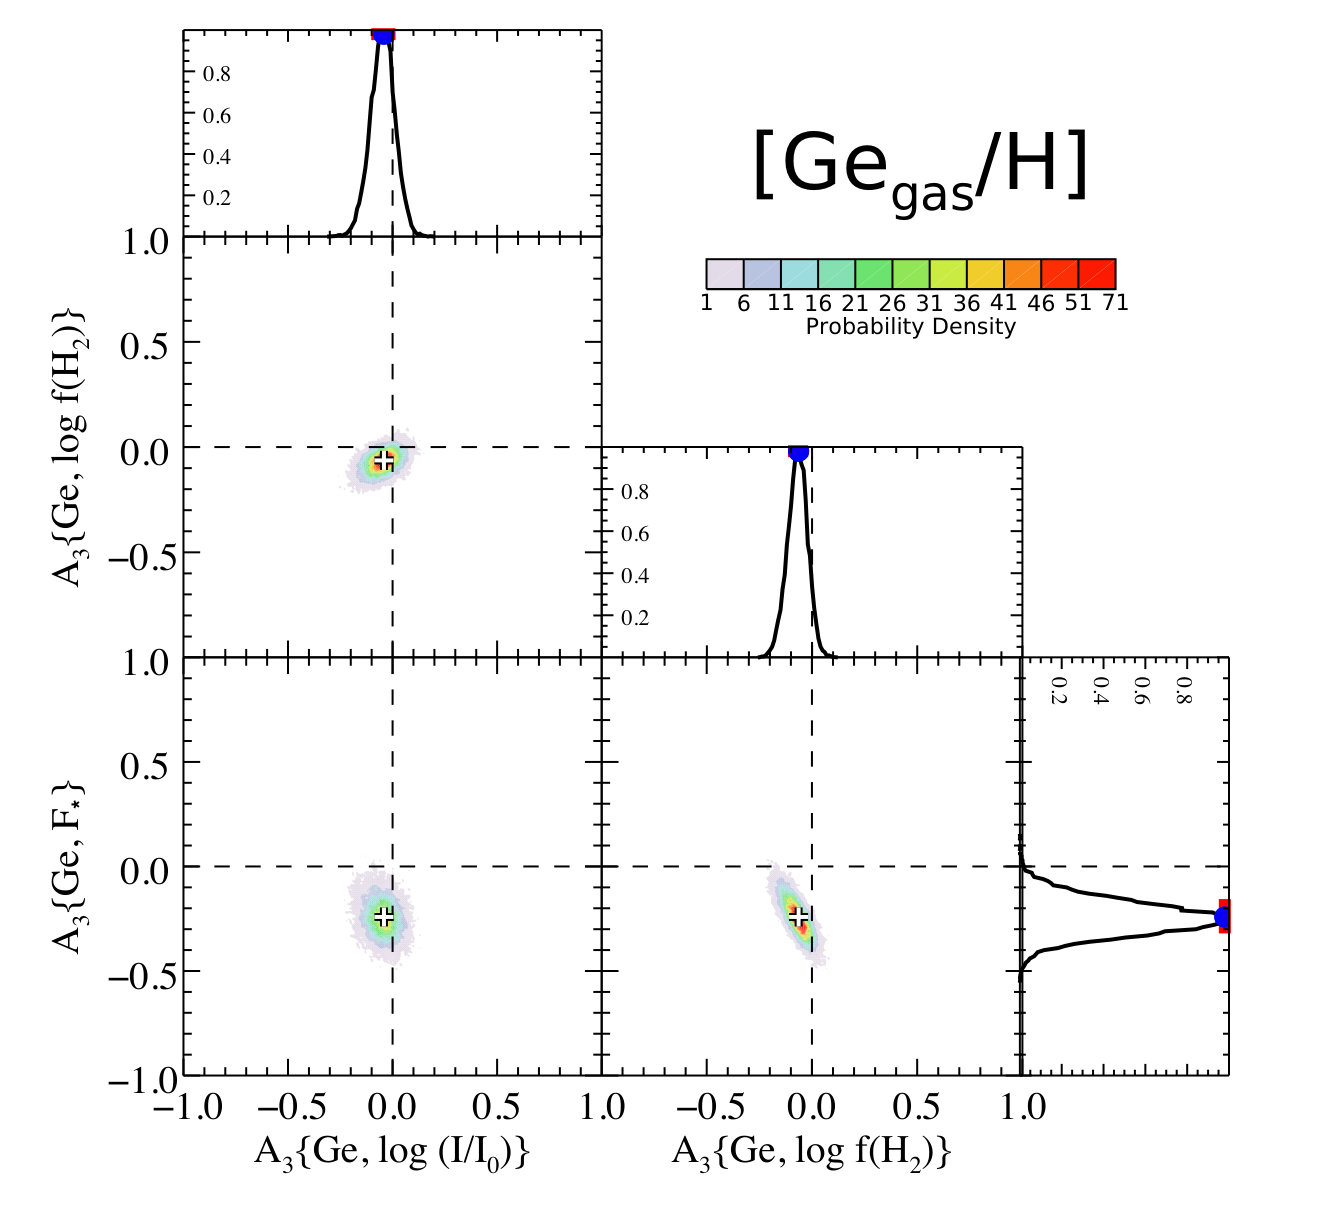 Figure 7
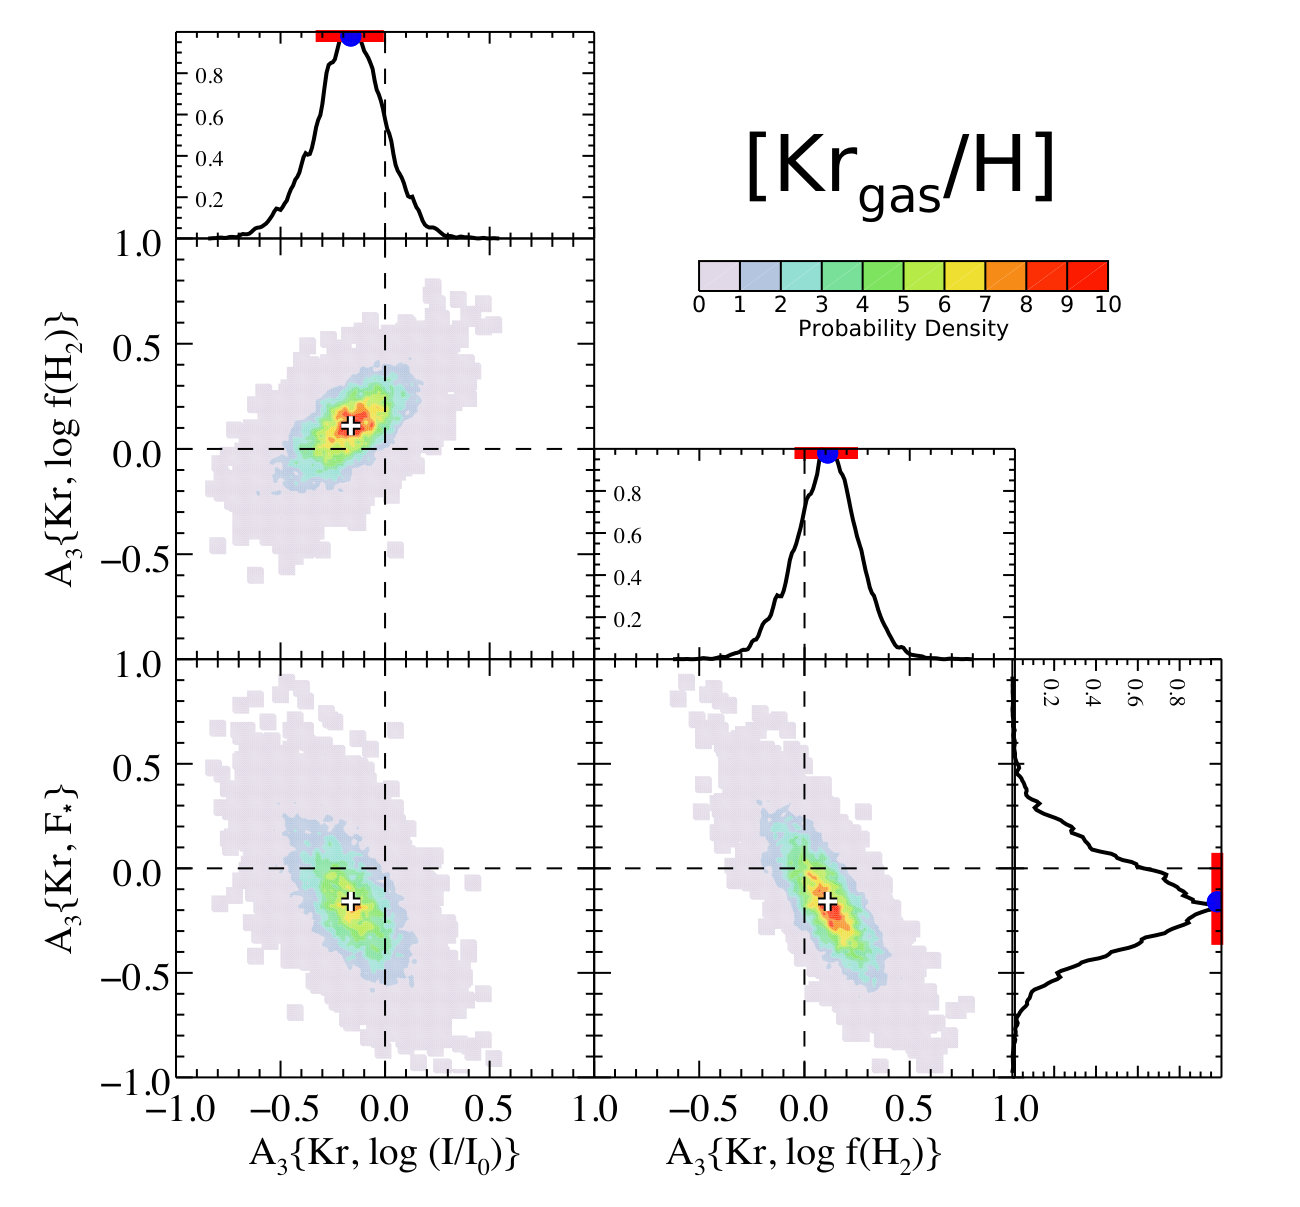 Figure 8
 Figure 9
 Figure 10
 Figure 11
| Target | Galactic Coordinates | Sourceaa(1) Bowen et al. (2008), (2) Jenkins (2009), (3) Savage et al. (2017), (4) this paper. | Magnitudes | Depletion | Starlight | Spectral | |||||
|---|---|---|---|---|---|---|---|---|---|---|---|
| Star | (kpc) | for | (kpc) | (mag) | Strength bbSee Section 4. | ccLogarithm of the intensity of starlight capable of ionizing neutral carbon for the foreground gas, relative to the Galactic average, as computed by Jenkins & Tripp (2011). See Section 5 | Type | ||||
| (1) | (2) | (3) | (4) | (5) | (6) | (7) | (8) | (9) | (10) | (11) | (12) |
| BD+35 4258 (catalog ) | 77.19 | 2.9 | 2 | 9.42 | 9.46 | 0.22 | B0.5 Vn | ||||
| BD+53 2820 (catalog ) | 101.24 | 5.1 | 2 | 10.02 | 9.96 | 0.28 | B0 IV:n | ||||
| CPD-59 2603 (catalog ) | 287.59 | 3.5 | 1 | 8.93 | 8.75 | 0.43 | 0.31 | O7 Vf | |||
| CPD-59 4552 (catalog ) | 303.22 | 2.0 | 4 | 8.337 | 8.24 | 0.31 | B1 III | ||||
| CPD-69 1743 (catalog ) | 303.71 | 5.5 | 2 | 9.43 | 9.46 | 0.19 | B0.5 IIIn | ||||
| HD108 (catalog ) | 117.93 | 3.8 | 1 | 7.58 | 7.40 | 0.42 | 0.30 | O6 pe | |||
| HD1383 (catalog ) | 119.02 | 2.9 | 2 | 7.89 | 7.63 | 0.37 | 0.27 | B1 II | |||
| HD3827 (catalog ) | 120.79 | 1.8 | 4 | 7.76 | 7.95 | 0.05 | 0.16 | B0.7 Vn | |||
| HD12323 (catalog ) | 132.91 | 4.4 | 1 | 8.87 | 8.92 | 0.23 | O9 V | ||||
| HD13268 (catalog ) | 133.96 | 2.1 | 1 | 8.24 | 8.18 | 0.35 | O8 Vnn | ||||
| HD13745 (catalog ) | 134.58 | 3.2 | 1 | 7.99 | 7.90 | 0.34 | O9.7 IIn | ||||
| HD13841 (catalog ) | 134.38 | 2.9 | 4 | 7.60 | 7.37 | 0.33 | B1.5Ib | ||||
| HD14818 (catalog ) | 135.62 | 2.8 | 4 | 6.56 | 6.26 | 0.37 | B2 Ia | ||||
| HD15137 (catalog ) | 137.46 | 3.5 | 1 | 7.92 | 7.86 | 0.24 | 0.32 | O9.5 II-IIIn | |||
| HD25443 (catalog ) | 143.68 | 1.1 | 4 | 6.998 | 6.76 | 0.44 | B0.5 III | ||||
| HD35914 (catalog ) | 215.21 | 5.4 | 4 | 9.78 | 13.0 | 0.37 | O7fp | ||||
| HD40893 (catalog ) | 180.09 | 3.1 | 2 | 9.05 | 8.99 | 0.31 | 0.37 | B0 IV | |||
| HD41161 (catalog ) | 164.97 | 1.4 | 1 | 6.658 | 6.76 | 0.19 | O8 Vn | ||||
| HD46223 (catalog ) | 206.44 | 2.1 | 4 | 7.50 | 7.28 | 0.44 | O4 Vf | ||||
| HD52266 (catalog ) | 219.13 | 1.8 | 2 | 7.22 | 7.23 | 0.22 | 0.48 | O9 IVn | |||
| HD53975 (catalog ) | 225.68 | 1.4 | 2 | 6.40 | 6.50 | 0.16 | O7.5 V | ||||
| HD63005 (catalog ) | 242.47 | 5.4 | 1 | 9.12 | 9.13 | 0.22 | O6 Vf | ||||
| HD66788 (catalog ) | 245.43 | 4.3 | 1 | 9.35 | 9.43 | 0.20 | O9 V | ||||
| HD69106 (catalog ) | 254.52 | 1.5 | 1 | 7.020 | 7.13 | 0.14 | 0.45 | B0.5 IVnn | |||
| HD72648 (catalog ) | 262.23 | 3.8 | 4 | 7.75 | 7.62 | 0.21 | B1 Ib | ||||
| HD75309 (catalog ) | 265.86 | 2.9 | 1 | 7.82 | 7.84 | 0.18 | 0.46 | B1 IIp | |||
| HD88115 (catalog ) | 285.32 | 3.7 | 1 | 8.26 | 8.31 | 0.12 | 0.51 | B1.5 Iin | |||
| HD89137 (catalog ) | 279.69 | 3.1 | 1 | 7.93 | 7.97 | 0.17 | O9.7 IIInp | ||||
| HD90087 (catalog ) | 285.16 | 2.8 | 1 | 7.80 | 7.80 | 0.22 | O9 IIIn | ||||
| HD91824 (catalog ) | 285.70 | 3.0 | 2 | 8.09 | 8.15 | 0.22 | 0.78 | O7 V | |||
| HD91983 (catalog ) | 285.88 | 3.0 | 2 | 8.62 | 8.58 | 0.14 | 0.51 | B1 III | |||
| HD92554 (catalog ) | 287.60 | 6.9 | 1 | 9.60 | 9.50 | 0.34 | O9.5 IIn | ||||
| HD93129 (catalog ) | 287.41 | 2.8 | 1 | 7.06 | 6.90 | 0.46 | O2 If | ||||
| HD93205 (catalog ) | 287.57 | 3.3 | 1 | 7.80 | 7.75 | 0.44 | 0.58 | O3 Vf | |||
| HD93222 (catalog ) | 287.74 | 3.6 | 1 | 8.15 | 8.10 | 0.32 | 0.82 | O7 IIIf | |||
| HD93843 (catalog ) | 288.24 | 3.5 | 1 | 7.29 | 7.33 | 0.24 | 0.66 | O5 IIIf | |||
| HD94493 (catalog ) | 289.01 | 3.4 | 1 | 7.27 | 7.27 | 0.15 | 0.49 | B1 Ib | |||
| HD97175 (catalog ) | 294.53 | 3.9 | 4 | 8.79 | 8.87 | 0.16 | B0.5 III | ||||
| HD99857 (catalog ) | 294.78 | 3.5 | 1 | 7.68 | 7.47 | 0.27 | 0.55 | B0.5 Ib | |||
| HD99890 (catalog ) | 291.75 | 3.5 | 1 | 8.23 | 8.31 | 0.15 | B0 IIIn | ||||
| HD99953 (catalog ) | 293.93 | 3.0 | 4 | 6.88 | 6.57 | 0.39 | B2 Ia | ||||
| HD100199 (catalog ) | 293.94 | 3.3 | 1 | 8.147 | 8.17 | 0.19 | B0 IIIne | ||||
| HD101190 (catalog ) | 294.78 | 2.1 | 1 | 7.37 | 7.33 | 0.30 | O6 Vf | ||||
| HD103779 (catalog ) | 296.85 | 4.3 | 2 | 7.185 | 7.22 | 0.17 | 0.33 | B0.5 Iab | |||
| HD104705 (catalog ) | 297.45 | 5.0 | 1 | 7.78 | 7.83 | 0.17 | 0.53 | B0 Ib | |||
| HD108639 (catalog ) | 300.22 | 2.4 | 2 | 7.89 | 7.81 | 0.26 | 0.55 | B0.2 III | |||
| HD109399 (catalog ) | 301.71 | 2.9 | 2 | 7.67 | 7.67 | 0.19 | 0.59 | B0.7 II | |||
| HD111934 (catalog ) | 303.20 | 2.3 | 2 | 7.12 | 6.92 | 0.32 | 0.63 | B1.5 Ib | |||
| HD114886 (catalog ) | 305.52 | 1.8 | 2 | 6.98 | 6.89 | 0.32 | 0.37 | O9 IIIn | |||
| HD115071 (catalog ) | 305.76 | 2.7 | 2 | 8.13 | 7.97 | 0.40 | 0.74 | B0.5 Vn | |||
| HD115455 (catalog ) | 306.06 | 2.6 | 1 | 8.17 | 7.97 | 0.40 | 0.58 | O7.5 III | |||
| HD116781 (catalog ) | 307.05 | 2.2 | 1 | 7.74 | 7.62 | 0.31 | 0.47 | B0 IIIne | |||
| HD116852 (catalog ) | 304.88 | 4.5 | 2 | 8.38 | 8.47 | 0.14 | 0.80 | O9 III | |||
| HD122879 (catalog ) | 312.26 | 3.3 | 1 | 6.64 | 6.50 | 0.29 | 0.49 | B0 Ia | |||
| HD124314 (catalog ) | 312.67 | 1.4 | 1 | 6.85 | 6.64 | 0.43 | 0.58 | O6 Vnf | |||
| HD124979 (catalog ) | 316.40 | 2.8 | 1 | 8.61 | 8.51 | 0.30 | O8 Vf | ||||
| HD137595 (catalog ) | 336.72 | 0.50 | 2 | 7.52 | 7.49 | 0.18 | B3 Vn | ||||
| HD144965 (catalog ) | 339.04 | 0.51 | 2 | 7.206 | 7.11 | 0.27 | 0.76 | B2 Vne | |||
| HD147888 (catalog ) | 353.65 | 0.12 | 2 | 7.05 | 6.74 | 0.42 | 1.20 | B3 V | |||
| HD148422 (catalog ) | 329.92 | 10 | 1 | 8.69 | 8.64 | 0.23 | B1 Ia | ||||
| HD148937 (catalog ) | 336.37 | 1.2 | 4 | 7.12 | 6.71 | 0.52 | 0.67 | O6 fp | |||
| HD151805 (catalog ) | 343.20 | 6.0 | 1 | 9.01 | 9.01 | 0.19 | B1 Ib | ||||
| HD152249 (catalog ) | 343.45 | 2.1 | 4 | 6.65 | 6.45 | 0.42 | O9 Iab | ||||
| HD152424 (catalog ) | 343.36 | 2.1 | 4 | 6.69 | 6.27 | 0.57 | O9.2 Ia | ||||
| HD152590 (catalog ) | 344.84 | 3.6 | 2 | 8.56 | 8.48 | 0.37 | 0.77 | O7 V | |||
| HD156359 (catalog ) | 328.68 | 17 | 4 | 9.52 | 9.72 | 0.06 | B0 Ia | ||||
| HD163522 (catalog ) | 349.57 | 9.9 | 2 | 8.43 | 8.43 | 0.16 | B1 Ia | ||||
| HD165246 (catalog ) | 6.40 | 1.9 | 2 | 7.70 | 7.60 | 0.33 | 0.79 | O8 Vn | |||
| HD167402 (catalog ) | 2.26 | 7.0 | 3 | 8.94 | 8.95 | 0.21 | B0 II/B0.5 Ib | ||||
| HD168941 (catalog ) | 5.82 | 7.8 | 2 | 9.36 | 9.37 | 0.24 | O9.5 IIp | ||||
| HD170740 (catalog ) | 21.06 | 0.28 | 2 | 5.96 | 5.72 | 0.38 | B2 IV-V | ||||
| HD177989 (catalog ) | 17.81 | 6.0 | 1 | 9.22 | 9.34 | 0.11 | 0.35 | B0 III | |||
| HD178487 (catalog ) | 25.78 | 5.7 | 1 | 8.78 | 8.69 | 0.29 | B0.5 Ib | ||||
| HD179407 (catalog ) | 24.02 | 9.2 | 2 | 9.44 | 9.44 | 0.23 | B0.5 Ib | ||||
| HD185418 (catalog ) | 53.60 | 1.2 | 1 | 7.639 | 7.49 | 0.38 | 0.23 | B0.5 V | |||
| HD191877 (catalog ) | 61.57 | 2.3 | 1 | 6.217 | 6.27 | 0.14 | B1 Ib | ||||
| HD192035 (catalog ) | 83.33 | 2.7 | 1 | 8.26 | 8.22 | 0.28 | B0 III-IVn | ||||
| HD195455 (catalog ) | 20.27 | 5.8 | 2 | 9.02 | 9.20 | 0.07 | B0.5 III | ||||
| HD195965 (catalog ) | 85.71 | 1.1 | 1 | 6.899 | 6.97 | 0.19 | 0.32 | B0 V | |||
| HD198478 (catalog ) | 85.75 | 1.3 | 2 | 5.28 | 4.86 | 0.43 | 0.43 | B3 Ia | |||
| HD198781 (catalog ) | 99.94 | 0.69 | 2 | 6.472 | 6.45 | 0.26 | 0.37 | B0.5 V | |||
| HD201345 (catalog ) | 78.44 | 2.2 | 1 | 7.611 | 7.76 | 0.14 | 0.32 | O9 V | |||
| HD202347 (catalog ) | 88.22 | 1.0 | 1 | 7.41 | 7.50 | 0.11 | 0.20 | B1.5 V | |||
| HD203374 (catalog ) | 100.51 | 0.34 | 2 | 6.908 | 6.67 | 0.43 | 0.31 | B2 Vne | |||
| HD206267 (catalog ) | 99.29 | 0.86 | 2 | 5.83 | 5.62 | 0.45 | 0.30 | O6.5 V | |||
| HD206773 (catalog ) | 99.80 | 0.82 | 2 | 7.10 | 6.87 | 0.39 | 0.19 | B0 V:nnep | |||
| HD207198 (catalog ) | 103.14 | 1.3 | 1 | 6.25 | 5.94 | 0.47 | 0.20 | O9.5 Ib-II | |||
| HD207308 (catalog ) | 103.11 | 1.2 | 2 | 7.74 | 7.49 | 0.44 | B0.7 III-IV(n) | ||||
| HD207538 (catalog ) | 101.60 | 0.94 | 2 | 7.55 | 7.30 | 0.51 | O9.5 V | ||||
| HD208440 (catalog ) | 104.03 | 1.1 | 2 | 7.93 | 7.91 | 0.27 | 0.35 | B1 V | |||
| HD209339 (catalog ) | 104.58 | 1.2 | 2 | 6.733 | 6.73 | 0.24 | 0.34 | B0 IV | |||
| HD210809 (catalog ) | 99.85 | 4.3 | 1 | 7.61 | 7.56 | 0.28 | 0.29 | O9 Iab | |||
| HD210839 (catalog ) | 103.83 | 1.1 | 1 | 5.29 | 5.05 | 0.49 | 0.47 | O6 Infp | |||
| HD218915 (catalog ) | 108.06 | 5.0 | 1 | 7.22 | 7.20 | 0.21 | 0.33 | O9.5 Iabe | |||
| HD219188 (catalog ) | 83.03 | 2.1 | 2 | 6.90 | 7.06 | 0.09 | 0.01 | B0.5 IIIn | |||
| HD220057 (catalog ) | 112.13 | 0.77 | 2 | 6.948 | 6.94 | 0.17 | 0.35 | B3 IV | |||
| HD224151 (catalog ) | 115.44 | 1.3 | 2 | 6.21 | 6.00 | 0.34 | 0.16 | B0.5 II-III | |||
| HDE232522 (catalog ) | 130.70 | 6.1 | 1 | 8.65 | 8.70 | 0.14 | 0.35 | B1 II | |||
| HDE303308 (catalog ) | 287.59 | 3.8 | 1 | 8.30 | 8.17 | 0.33 | 0.59 | O3 Vf | |||
| HDE308813 (catalog ) | 294.79 | 3.1 | 1 | 9.30 | 9.32 | 0.26 | O9.5 V | ||||
| Star | Reason |
|---|---|
| BD+48 3437 | Too many lines were difficult to measure. |
| HD23478 | B3, |
| HD24190 | B2 V and no photometric data availableaaPhotometric data are needed to compute using the method of Diplas & Savage (1994). |
| HD27778 | B3V; |
| HD62542 | B5V, but see note belowbbThis case is unusual: Mg and Mn are very weak and hard to measure against bad stellar lines, but Ge and Kr show up as narrow and very believable absorptions. Abundances of Ge and Kr must be high relative to other elements, and their measurement outcomes are listed in Table A. This sightline seems to be noteworthy, even though we could not include it in the general statistical analysis. |
| HD72754 | Too many lines were difficult to measure. |
| HD102065 | Enormous stellar Ly absorption, even though listed as a B2V star |
| HD114441 | B2 V and no photometric data availableaaPhotometric data are needed to compute using the method of Diplas & Savage (1994). |
| HD117111 | B2 V and no photometric data availableaaPhotometric data are needed to compute using the method of Diplas & Savage (1994). |
| HD153262 | B0/3, so photometric data probably not usefulaaPhotometric data are needed to compute using the method of Diplas & Savage (1994). |
| HD203532 | B3 IV; |
| Atom and | Source of the | Revision in the | ||
|---|---|---|---|---|
| Ionization StateaaThe Arabic numerals that follow some of the elements link the transitions to their measurements reported in Table A. | (Å) | -value | Value of bbAdopted value of minus the value reported in Morton (2000) or Morton (2003). | |
| (1) | (2) | (3) | (4) | (5) |
| O I | 1355.598ccFour stars had wavelength coverages that did not include this transition. | -2.805 | (Morton 2003) | |
| Mg II 1 | 1239.925 | -0.106 | (Morton 2003) | |
| Mg II 2 | 1240.395 | -0.355 | ||
| Mn II 1 | 1197.184 | 2.248 | (Toner & Hibbert 2005) | |
| Mn II 2 | 1201.118 | 1.999 | ||
| Ge II | 1237.059 | 3.033 | (Heidarian et al. 2017) | |
| Kr I | 1235.838 | 2.422 | (Chan et al. 1992) | +0.020 |
Peer Reviews
No public reviews on file for this paper yet. If you reviewed it on a platform where reviews are public (OpenReview, ICLR, NeurIPS, ICML), you can paste yours below so the community can read it here.
Videos
No videos yet. Explain this paper in a talk, walkthrough, or lecture? Add one.
A Closer Look at Some Gas-Phase Depletions in the ISM:
Trends for O, Ge and Kr vs. , f(H2), and Starlight Intensity111Based on observations with the NASA/ESA Hubble Space Telescope obtained from the Data Archive at the Space Telescope Science Institute, which is operated by the Associations of Universities for Research in Astronomy, Incorporated, under NASA contract NAS5-26555. ©2019. The American Astronomical Society. All rights reserved.
Princeton University Observatory
Princeton, NJ 08544-1001
Abstract
In a survey of archived ultraviolet spectra of 100 stars recorded by the echelle spectrograph of the Space Telescope Imaging Spectrograph (STIS) on the Hubble Space Telescope (HST), we measure the strengths of the weak absorption features of O I, Ge II and Kr I in the interstellar medium. Our objective is to undertake an investigation that goes beyond earlier abundance studies to see how these elements are influenced independently by three different environmental properties: (1) values of a generalized atomic depletion factor due to condensations onto dust grains (revealed here by the abundances of Mg and Mn relative to H), (2) the fraction of H atoms in the form of H2 , and (3) the ambient intensity of ultraviolet starlight relative to an average value in our part of the Galaxy . As expected, the gas-phase abundances of all three elements exhibit negative partial correlations with . The abundances of free O atoms show significant positive partial correlations with and , while Ge and Kr exhibit negative partial correlations with at marginal levels of significance. After correcting for these trends, the abundances of O relative to H show no significant variations with location, except for the already-known radial gradient of light-element abundances in the Milky Way. A comparison of Ge and O abundances revealed no significant regional enhancements or deficiencies of neutron-capture elements relative to -process ones.
dust — ISM: abundances — ISM: atoms — ultraviolet: ISM
††facilities: HST (STIS), FUSE††software: mlinmix_err (Kelly 2007)
1 Background
From studies of interstellar absorption lines in the UV spectra of stars in our region of the Galaxy, it is well established that interstellar dust sequesters into solid form much of the available interstellar gas atoms for elements heavier than helium, and these atomic depletions, some of which are profound for some elements, offer additional insights on the elemental composition and relative amounts of the dust (Savage & Sembach 1996). In broadest terms, we know that the severity of element depletions is related to two factors: (1) elements that can form highly stable, refractory compounds experience the strongest depletions, and (2) depletions appear to increase for regions that have high gas densities, indicating that the growth and destruction of grains depend on the local gas environments.
To understand better variations in the amounts of dust grains and their composition, we consider a logarithmic depletion factor for any element from the gas phase,
[TABLE]
where is the column density of the preferred ionization stage of element , and the reference abundance ratio can apply to either B-type stars (Nieva & Przybilla 2012) or the Sun (Asplund et al. 2009).
In a study aimed at improving our understanding of such depletions, Jenkins (2009, hereafter J09) devised a unified interpretation for 17 different elements reported in more than 100 papers that covered 243 sight lines to different stars. His interpretation made use of an empirically determined principle that, from one region to the next, the logarithmic strengths of depletions of different elements followed one another in a linear fashion, and this behavior could be characterized with good accuracy in terms of a few simple coefficients. First, the overall severity of depletions for any sight line could be collectively characterized by a single scale factor, which he designated as . According to this construction, any element responds to changes in in a manner that could be described by three coefficients unique to this element through the equation
[TABLE]
where the constants , , and are unique to each element .222The offset quantity may seem superfluous for a linear equation that needs only two coefficients, but its use is intended to make the covariances in the errors for and equal to zero, which then simplifies the derivations of uncertainties of any relationships that make use of and . It follows that if all of the missing atoms are sequestered into solid form (or free molecules), their abundances relative to hydrogen are given by
[TABLE]
Equations 2 and 3 assign absolute values for the depletions and dust abundances, but they rely on the reference abundances in Eq. 1 being correct. One can instead focus on differential changes as atoms accumulate in (or depart from) solid forms using the relationship
[TABLE]
which depends only on the how rapidly the depletions change with (through the slope coefficient ) and the measured interstellar medium (ISM) abundance relative to hydrogen at a given value of .
The present study is motivated by two puzzling conclusions that emerged from the depletion analysis reported in J09. The depletions of oxygen and krypton appeared to exceed what one might have expected, as will be outlined in the following subsections. We now hope to gain new insights by enlarging the sample of sight lines and studying how the abundances of O and Kr relate not only to but also to other interstellar gas parameters such as the molecular hydrogen fraction and the intensity of starlight in the ultraviolet. Another quantity that may seem relevant is the average volume density of hydrogen along a sight line , where is the distance to the star. Many studies have shown that correlates strongly with the strengths of depletions for those elements that are strongly depleted (Savage & Bohlin 1979 ; Harris et al. 1984 ; Murray et al. 1984 ; Gondhalekar 1985 ; Jenkins et al. 1986 ; Jenkins 1987 ; Welsh et al. 1997 ; Snow et al. 2002 ; Cartledge et al. 2004, 2006 ; Jensen & Snow 2007b, 2007a). We are not surprised to find that the quantities and are strongly correlated with each other (see Fig. 16 of J09). In making a choice between these two parameters, we regard to be a more direct indicator of the maturity of the depletion process in any given sight line.
1.1 The Problem with Oxygen
Cartledge et al. (2004) found that [] showed a weak but convincing downward trend with increasing values of . From a qualitative perspective, this is not surprising since is strongly correlated with , and the relative concentrations of oxygen-bearing compounds such as silicates and oxides should increase with greater values of . However, as recognized by J09, quantitatively speaking the depletion of gas-phase oxygen is surprisingly strong. For instance, for a representative sight line with strong depletions (at ), we can use the coefficients in J09 and Eq. 3 to arrive at a value parts per million (ppm) if ppm is taken from B-star abundances (Nieva & Przybilla 2012).333The B-star reference abundance adopted here happens to be the same as the one adopted by J09, which was based on the present-day solar photospheric abundance recommended by Lodders (2003) plus her +0.07 dex correction for gravitational settling to arrive at a protosolar abundance. If such a correction were applied to some more recent measurements of the present-day solar photospheric O abundance of approximately 8.77 by Ayres et al. (2013) and Steffen et al. (2015), would revert to a value of , , and then an application of Eqs. 2 and 3 for would yield . This value for is substantially larger than 170 ppm taken from the corresponding sum of the dust abundances of 113 ppm for Mg, Si, and Fe multiplied by the largest plausible ratio of 1.5 for O for the most favorable combination of silicate and oxide compounds, MgSiO3 plus Fe2O3 (Cardelli et al. 1996 ; Whittet 2010). The disparity between ppm and that consumed by silicates and oxides has created a challenge for explaining where some of the oxygen atoms are sequestered (Whittet 2010 ; Wang et al. 2015).
A contrasting view was presented by Voshchinnikov & Henning (2010). They claimed that a large fraction of their determinations of came out to be considerably lower than 170 ppm, and they argued that there was no problem in accounting for all of the O being incorporated into silicates. However, they adopted a value ppm, and this reduced value affects both of the major terms on the right-hand side of Eq. 3 to create a prediction for a removal of only 155 ppm with the J09 coefficients at .
If one distrusts the reference abundances, one can resort to comparing the differential depletions of O and Si+Mg+Fe through the use of Eq. 4. At the quantity divided by equals 2.30, which to within the uncertainties is acceptable for O being incorporated into silicates and oxides. However, the ratio increases to 16 at , which indicates that in dense regions with strong depletions O must bind to some other element that has a high abundance (or to itself in the form of O2). Clues on what processes may facilitate the removal of gas-phase O could emerge from a more comprehensive comparison of oxygen abundances with factors other than just .
1.2 The Problem with Krypton
Superficially, one might expect krypton to be an element that is unlikely to show any depletions. It is a noble gas that is chemically inert because its outer valence shell of electrons is filled. Its van der Waals binding with neutral systems is extremely weak and easily disrupted. From these two perspectives, it may seem puzzling that the strengths of absorption features of this element’s dominant ionization state, Kr I, indicated an apparent, almost universal deficiency ( dex) of gas-phase Kr (Cardelli & Meyer 1997 ; Cartledge et al. 2003, 2008 ; Ritchey et al. 2018) when compared to its reference abundance relative to hydrogen. A link between Kr depletions and the relative concentrations of solid materials in the ISM was established later by J09, who found that Kr depletions appeared to become more severe with increasing values of (i.e., , but with an uncertainty of 0.103). The statistical significance of this trend was improved in the more recent investigation by Ritchey et al. (2018) in their study of the interstellar abundances of -process elements.
In a related development, there evolved an awareness that an acid-resistant residue of some primitive meteorites, known as phase Q,444Q stands for quintessence, a designation originated by Lewis et al. (1975). This phase typically composes less than 0.04% of the mass of a meteorite. was shown to have significant concentrations of noble gases, with fractionations favoring the retention of heavier elements (Schelhaas et al. 1990 ; Amari et al. 2013) . Laboratory experiments designed to explore this issue indicated that noble gases can be made to bind to certain compounds found in meteoritic materials (Amberg et al. 1955 ; Yang & Anders 1982a, 1982b ; Yang et al. 1982 ; Wacker 1989 ; Marrocchi et al. 2005).
There has also evolved a recognition that free noble gas atoms could bind to positive ions and charged molecular complexes (Holloway 1968 ; Wyatt et al. 1975). Within the contexts of the ISM and protoplanetary disks, the most prominent possibilities are the couplings with the partners H+, H, and H (Pauzat & Ellinger 2007 ; Pauzat et al. 2009 ; Theis et al. 2015). Indeed, emission and absorption features arising from interstellar ArH+ have been detected in spectra recorded by instruments on the Herschel mission (Barlow et al. 2013 ; Schilke et al. 2014). Nevertheless, the concentrations of ArH+ are small compared to the total abundances of Ar. Dissociative recombinations with free electrons are likely to strongly inhibit any accumulations of these complexes by amounts that could cause significant depletions of the atomic forms of noble gases. Electron fractions and typical destruction reaction rate constants of order (Mitchell 1990)555One exception is the rate for , which is (Mitchell et al. 2005). make it doubtful that appreciable amounts of Kr can be bound in charged molecular complexes.
Two other considerations may be factored into the krypton abundance findings. One is that there might exist a real change in the overall abundance of Kr from one region to another, as proposed by Cartledge et al. (2008). The other possibility is that if the Kr and H are exposed to ionizing radiation with a sufficiently high energy to penetrate the mostly neutral hydrogen, the Kr could be more strongly ionized than H because its ionization cross section just above its threshold energy (14 eV) is much higher than that of H by about one order of magnitude (Sterling 2011). As a result, the apparent would be lowered, much as what one sees with the ratio of Ar I to O I in the low-density, partly ionized medium (Jenkins 2013).
2 Investigation Strategy
2.1 Basic Design
Ultraviolet spectra of stars observed using the echelle spectrographs of the Goddard High Resolution Spectrograph (GHRS) and the Space Telescope Imaging Spectrograph (STIS) on the Hubble Space Telescope (HST) have enabled observations for the investigation of interstellar atomic abundances, including those of O and Kr. There have been many publications of results for these two elements, and references to these works are listed in Table 1 of J09.666More recent measurements have been carried out by Ritchey et al. (2018). Since the time of the latest of these publications, many new spectra have been recorded using the STIS echelle spectrograph in the medium- and high-resolution modes. The new spectra were acquired after the repair of STIS during the Fourth Servicing Mission (SM4) for HST in 2009, and they allow us to increase the number of samples. So that we can maintain a uniform approach for interpreting the absorption features, none of the previously reported measurements of column densities are incorporated in the present study; all of the outcomes given here are based on an original analysis using a set of rules applied in a consistent manner throughout all cases.
A particularly large volume of the STIS echelle spectra cover the wavelength region from 1170 to 1372 Å, which includes transitions of O I, Mg II, Mn II, Kr I, and Ge II. These spectra are available from the Mikulsky Archive for Space Telescopes (MAST). Except for Kr, whose absorption is securely detected in only about half of the sight lines, the transitions for these elements are strong enough to measure with reasonable accuracy, but not so strong that saturation effects seriously compromise the derivations of column densities. The strongly depleted elements Mg and Mn allow us to determine after their abundances are compared to those of atomic and molecular hydrogen. While O and Kr are the main focus of this investigation, we also consider abundances of Ge to check on whether or not enhancements or deficiencies of this element might signify variations in the total abundances of neutron capture elements from one location to the next, as suggested by Kr data analyzed by Cartledge et al. (2008). Ge is also a mildly depleted element whose correlation behaviors can be instructive when comparing them with those of O and Kr.
The remainder of this section and the one that follows describe how target stars and atomic transitions were selected and how the absorption features were analyzed. Tables 3.1 and 3.2 in Section 3 present the column density outcomes, and the more detailed measurement results appear in Table A in the appendix of this paper. Sections 4 and 5 describe the derivations of and starlight intensity parameters, respectively. Section 6 describes some analyses of the depletion trends, followed by Section 7 that interprets them. Finally, Section 8 describes two investigations that attempted to reveal regional changes in abundances after correcting for the local environmental conditions that we identified earlier.
2.2 Selection of Target Stars
The first step to identify candidate spectral exposures was to collect all STIS E140H and E140M observations of stars listed as of 2016 in the Planned and Archived Exposures Catalog (PAEC) maintained by the Space Telescope Science Institute (STScI). By examining the quick-look preview displays in MAST and checking spectral types in the Simbad database, useful observations were identified that satisfied all of the following criteria:
The spectrum did not suffer from confusion arising from narrow stellar lines (E140M spectra are less tolerant for such confusion than those taken with E140H). The spectrum must also have had a respectable signal-to-noise ratio. (17 stars had no preview spectra available, so they were excluded in the selection process.) 2. 2.
The strengths of the two Mg II lines (see Fig. 1) are used to indicate that there is a sufficient amount of interstellar gas to make a meaningful determination of the fractional abundance of Kr. We do not exclude cases where the Kr I lines themselves are too weak to see, since the resulting upper limits for (Kr I) could signify a large and interesting deficiency. 3. 3.
Stars of spectral type later than B3 were excluded, since the strong stellar Ly feature prevents one from determining (H I). Initially, stars with temperatures corresponding to the B2 and B3 were deemed acceptable if their E(BV) values were of order or greater than 0.2, since the interstellar H I absorption could dominate over the stellar feature. In later stages of selection, stars that had corrections for stellar features (described in Section 3.2) that were larger than the apparent value of were excluded. Stars B1 and earlier are acceptable, but some luminous stars with strong N V P Cygni absorptions depressed the flux at 1236 Å to too low a level to see any Kr I absorption. 4. 4.
The star must have had a spectrum covering the region containing H2 lines (at around 1100Å and shortward) available from the MAST archive of observations by the Far Ultraviolet Spectroscopic Explorer (FUSE). However, a few exceptions are noted in Table A.
The properties of the stars considered in this survey are summarized in Table 2.2. Except for the entries in Columns 10 and 11, which will be explained later, the meaning of the listed quantities should be self-evident. Stars with spectra in the archive that survived the initial screening but that were later rejected are listed in Table 2. Most of these rejections were based on our inability to obtain satisfactory corrections for the effects of the stellar Ly absorption features. \startlongtable
The reference list from the paper itself. Each links out to its DOI / PubMed record.
- 1(1)
- 2(2) Amari, S., Matsuda, J.-i., Stroud, R. M., & Chisholm, M. F. 2013, Ap J, 778, 37
- 3(3) Amberg, C. H., Spencer, W. B., & Beebe, R. A. 1955, Ca J Ch, 33, 305
- 4(4) André, M., Oliveira, C., Howk, J. C., et al. 2003, Ap J, 591, 1000
- 5(5) Asplund, M., Grevesse, N., Sauval, A. J., & Scott, P. 2009, ARA&A, 47, 481
- 6(6) Ayres, T. R., Lyons, J. R., Ludwig, H. G., Caffau, E., & Wedemeyer-Böhm, S. 2013, Ap J, 765, 46
- 7(7) Barlow, M. J., Swinyard, B. M., Owen, P. J., et al. 2013, Sci, 342, 1343
- 8(8) Barlow, R. 2003, Ar Xiv Physics e-prints.0306138