Constraints on high-J CO emission lines in $z\sim 6$ quasars
S. Carniani, S. Gallerani, L. Vallini, A. Pallottini, M. Tazzari, A., Ferrara, R. Maiolino, C. Cicone, C. Feruglio, R. Neri, V. D'Odorico, R. Wang,, J. Li

TL;DR
This study uses ALMA to observe high-J CO lines in two $z ext{~}6$ quasars, revealing their molecular gas properties and suggesting different heating mechanisms compared to other quasars.
Contribution
First detailed high-J CO line observations in two $z ext{~}6$ quasars, providing insights into their molecular gas excitation and heating mechanisms.
Findings
CO line luminosities are consistent with local AGN and starburst galaxies.
Different gas heating mechanisms may explain the variation in CO luminosities.
Future high-J CO observations are needed to understand molecular gas excitation in high-$z$ quasars.
Abstract
We present Atacama Large Millimiter/submillimiter Array (ALMA) observations of eight highly excited CO (J) lines and continuum emission in two quasars: SDSS J231038.88+185519.7 (hereafter J2310), for which CO(8-7), CO(9-8), and CO(17-16) lines have been observed, and ULAS J131911.29+095951.4 (J1319), observed in the CO(14-13), CO(17-16) and CO(19-18) lines. The continuum emission of both quasars arises from a compact region ( kpc). By assuming a modified black-body law, we estimate dust masses of Log and Log and dust temperatures of and , respectively for J2310 and J1319. Only CO(8-7) and CO(9-8) in J2310 are detected, while upper limits on luminosities are reported for the other lines of both quasars. The CO…
Click any figure to enlarge with its caption.
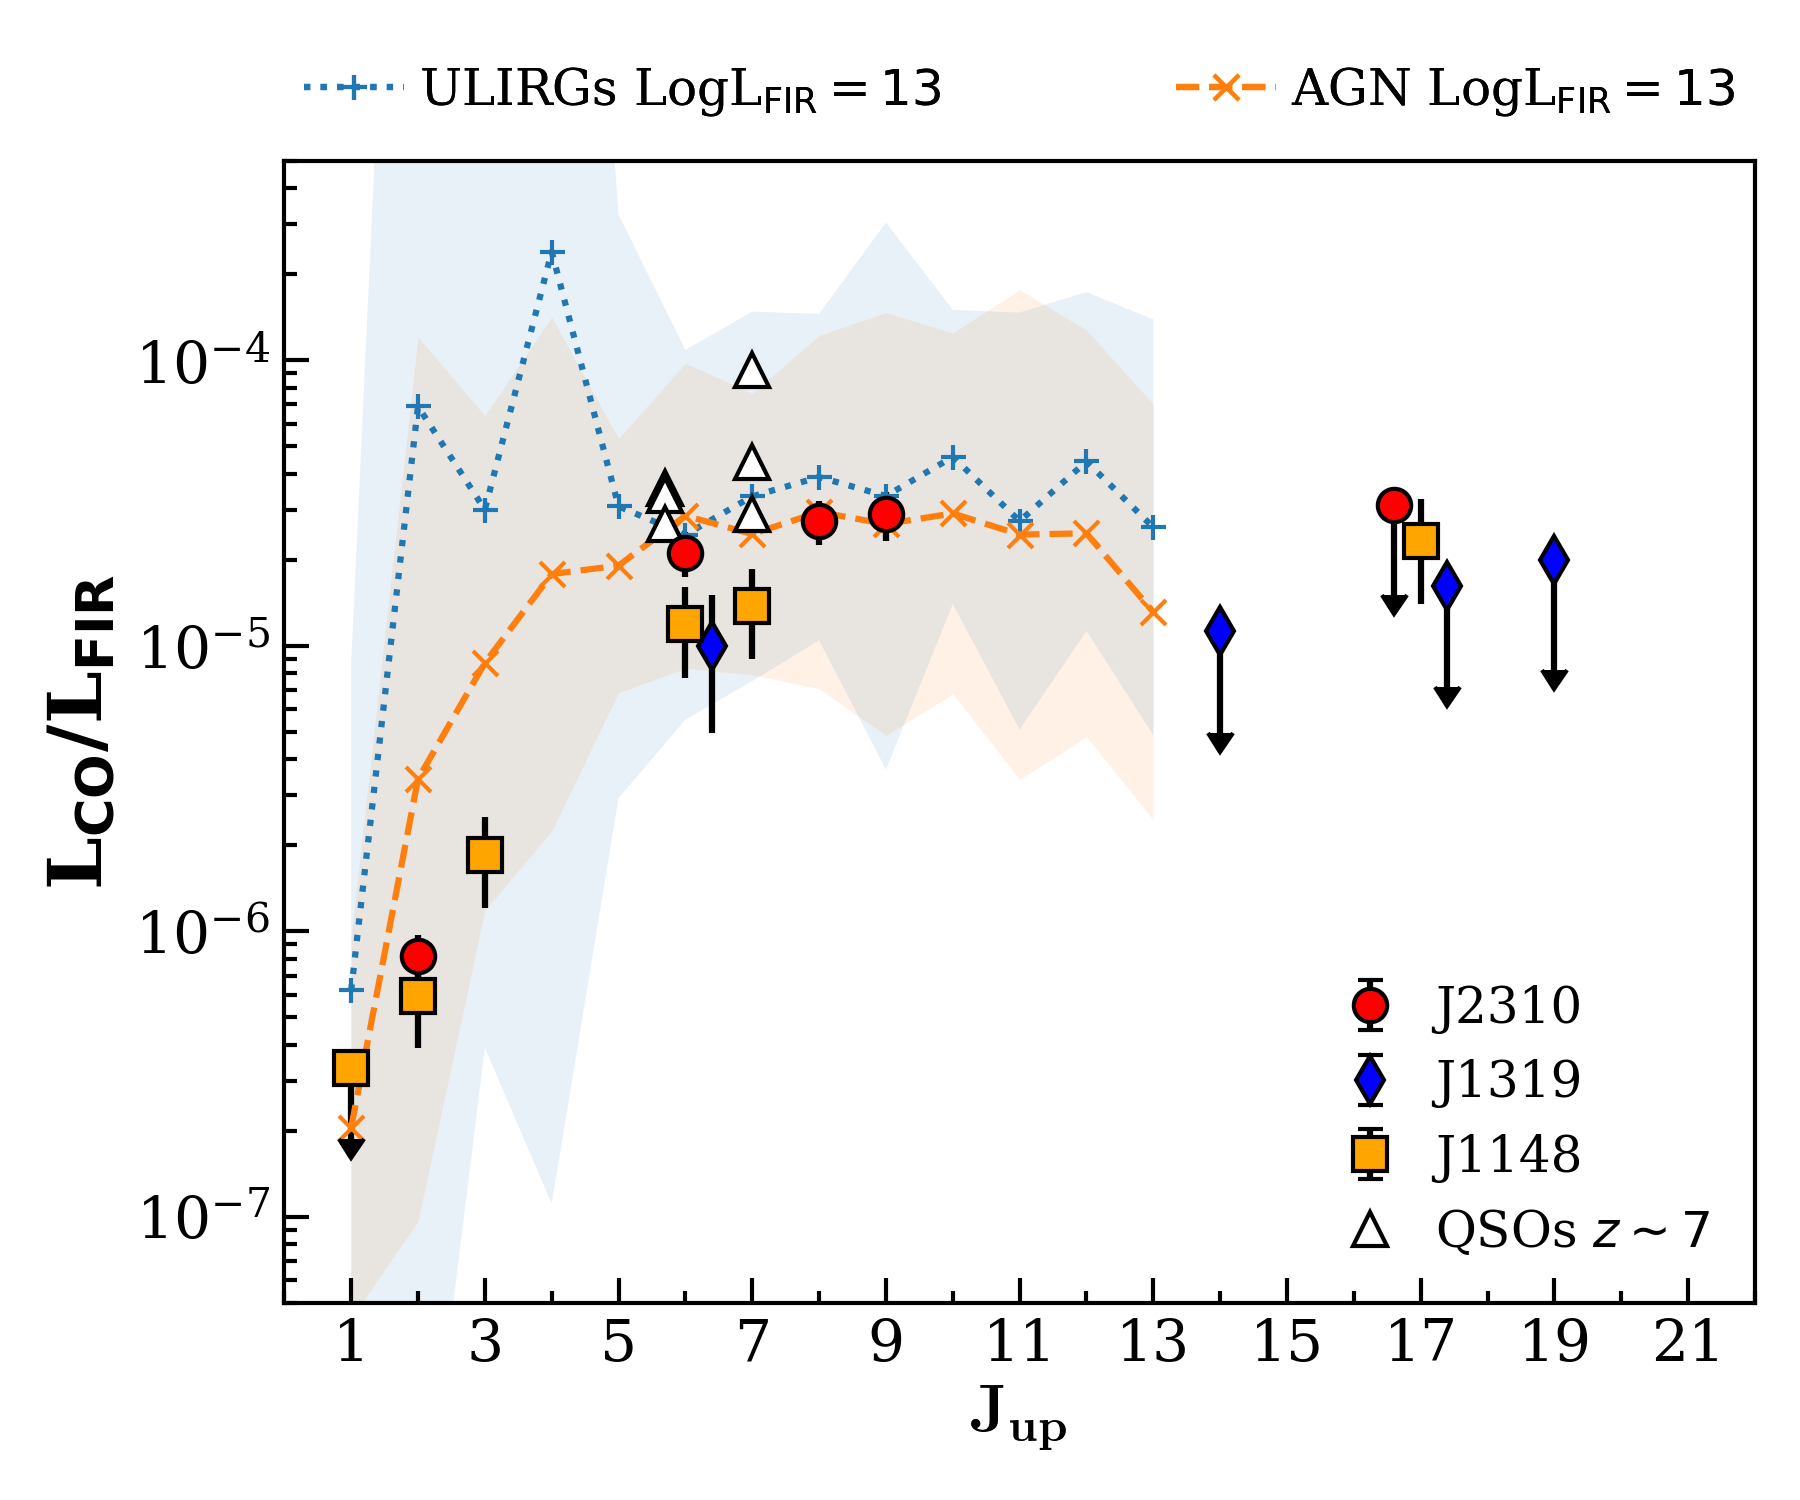 Figure 1
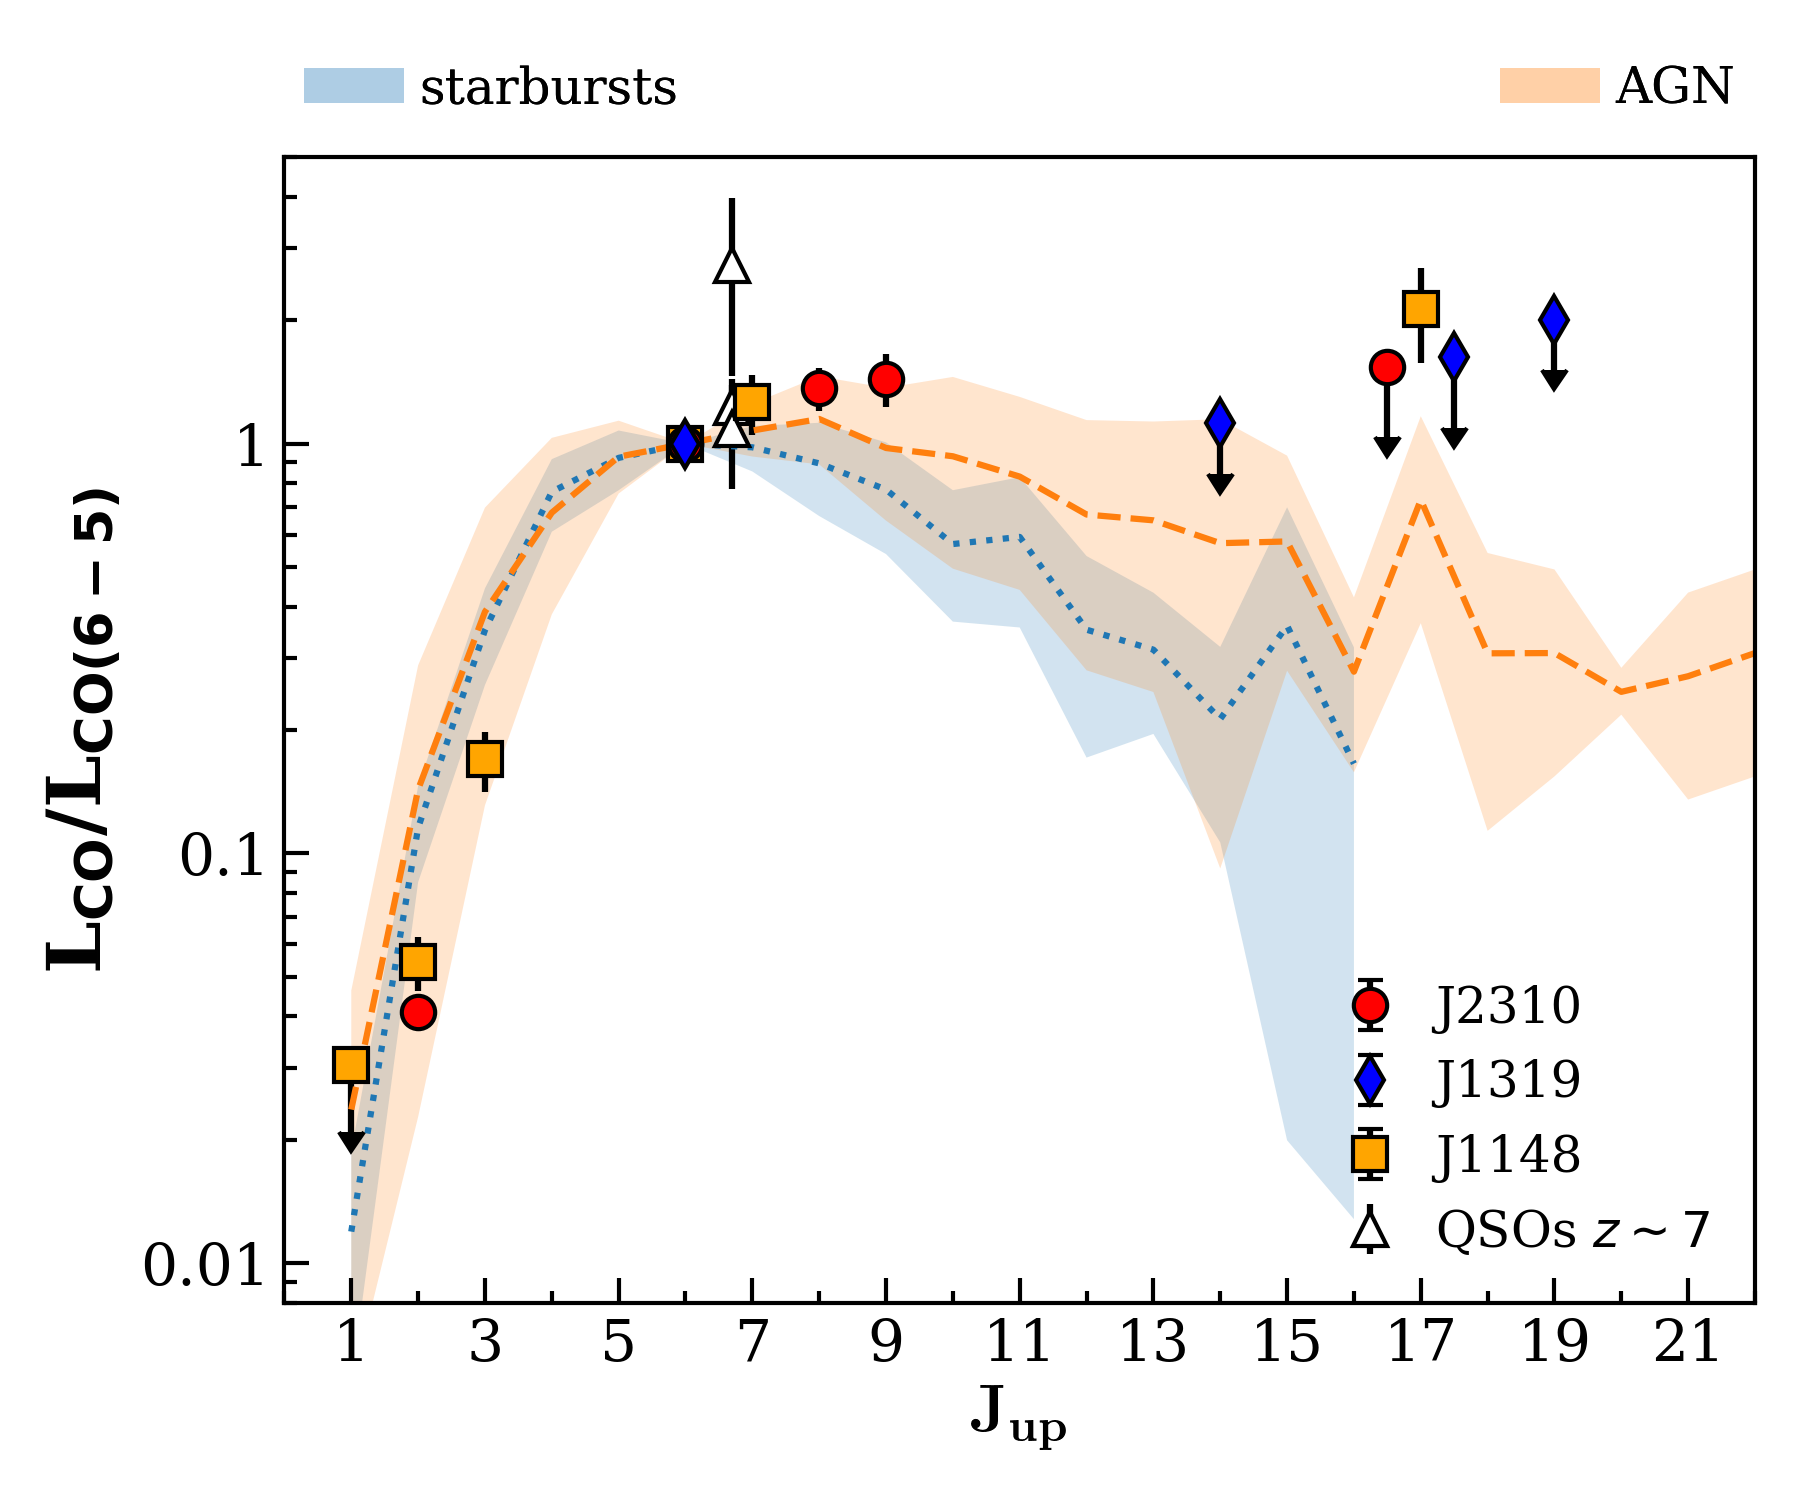 Figure 2
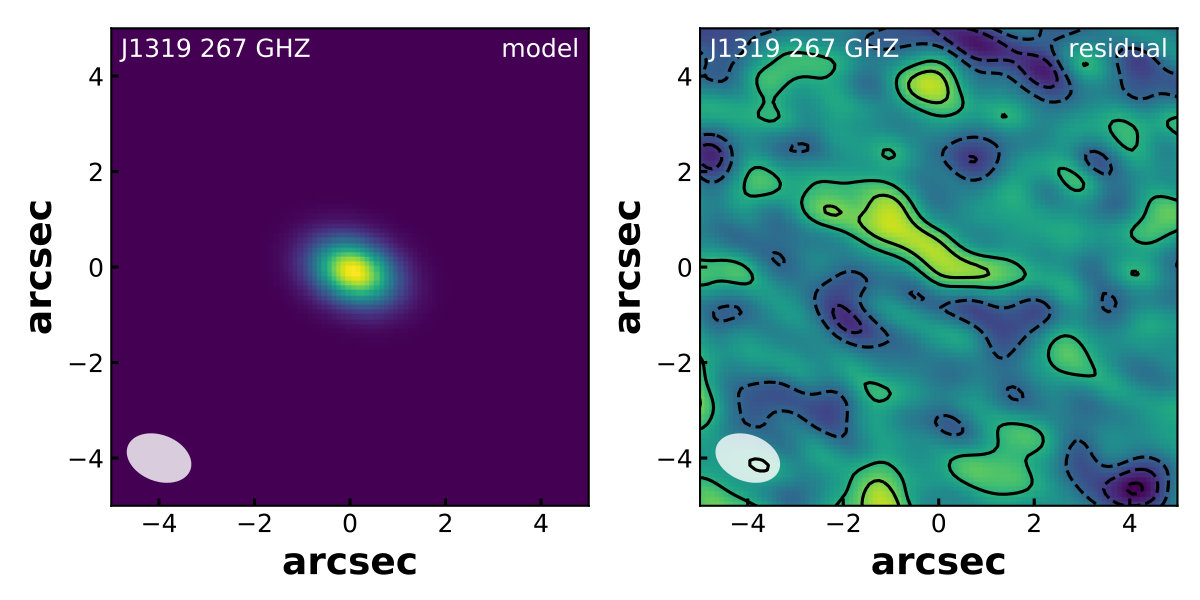 Figure 3
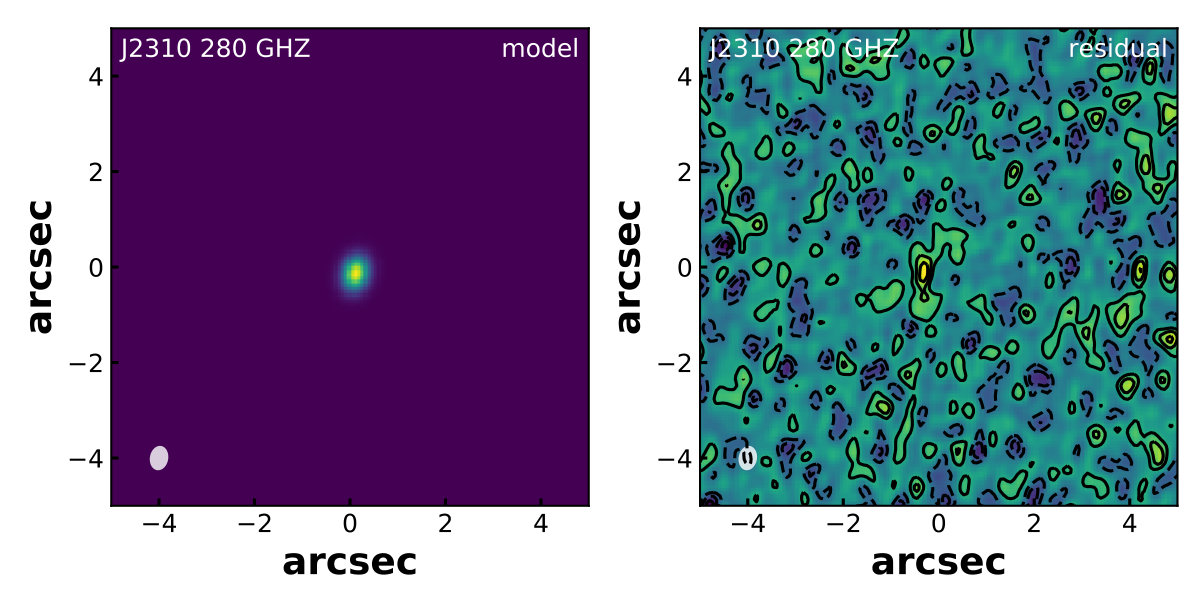 Figure 4
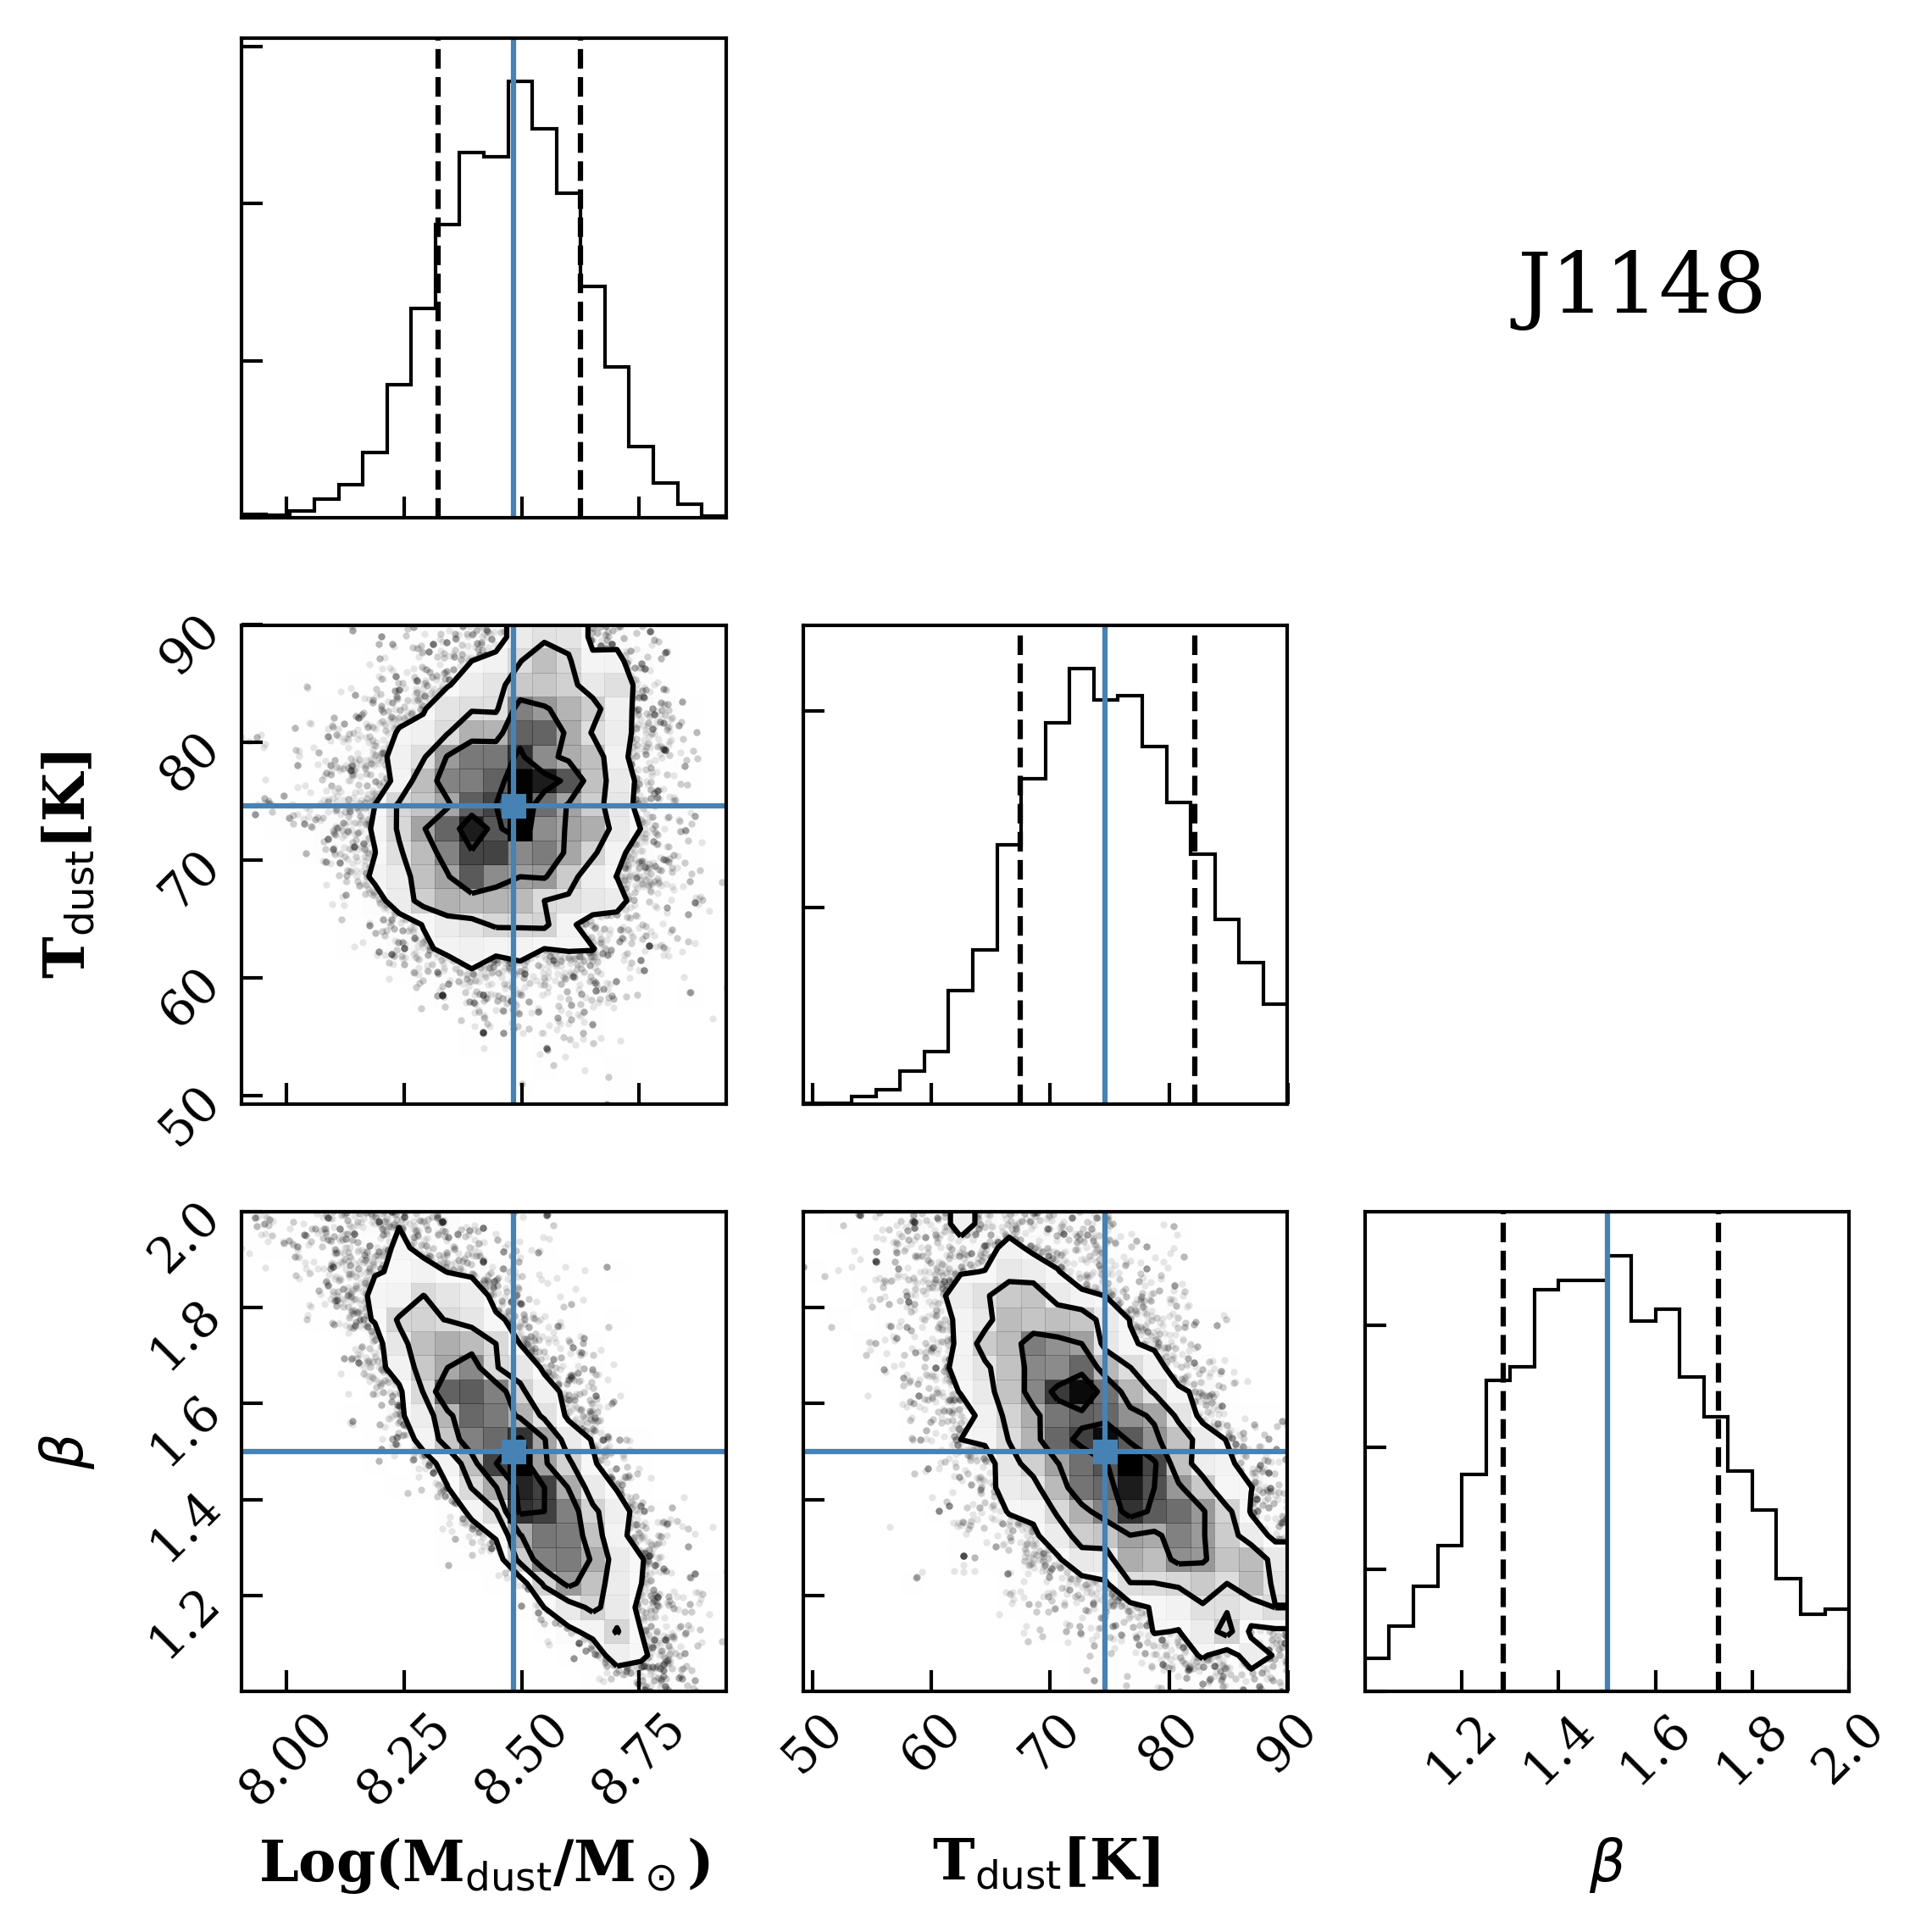 Figure 5
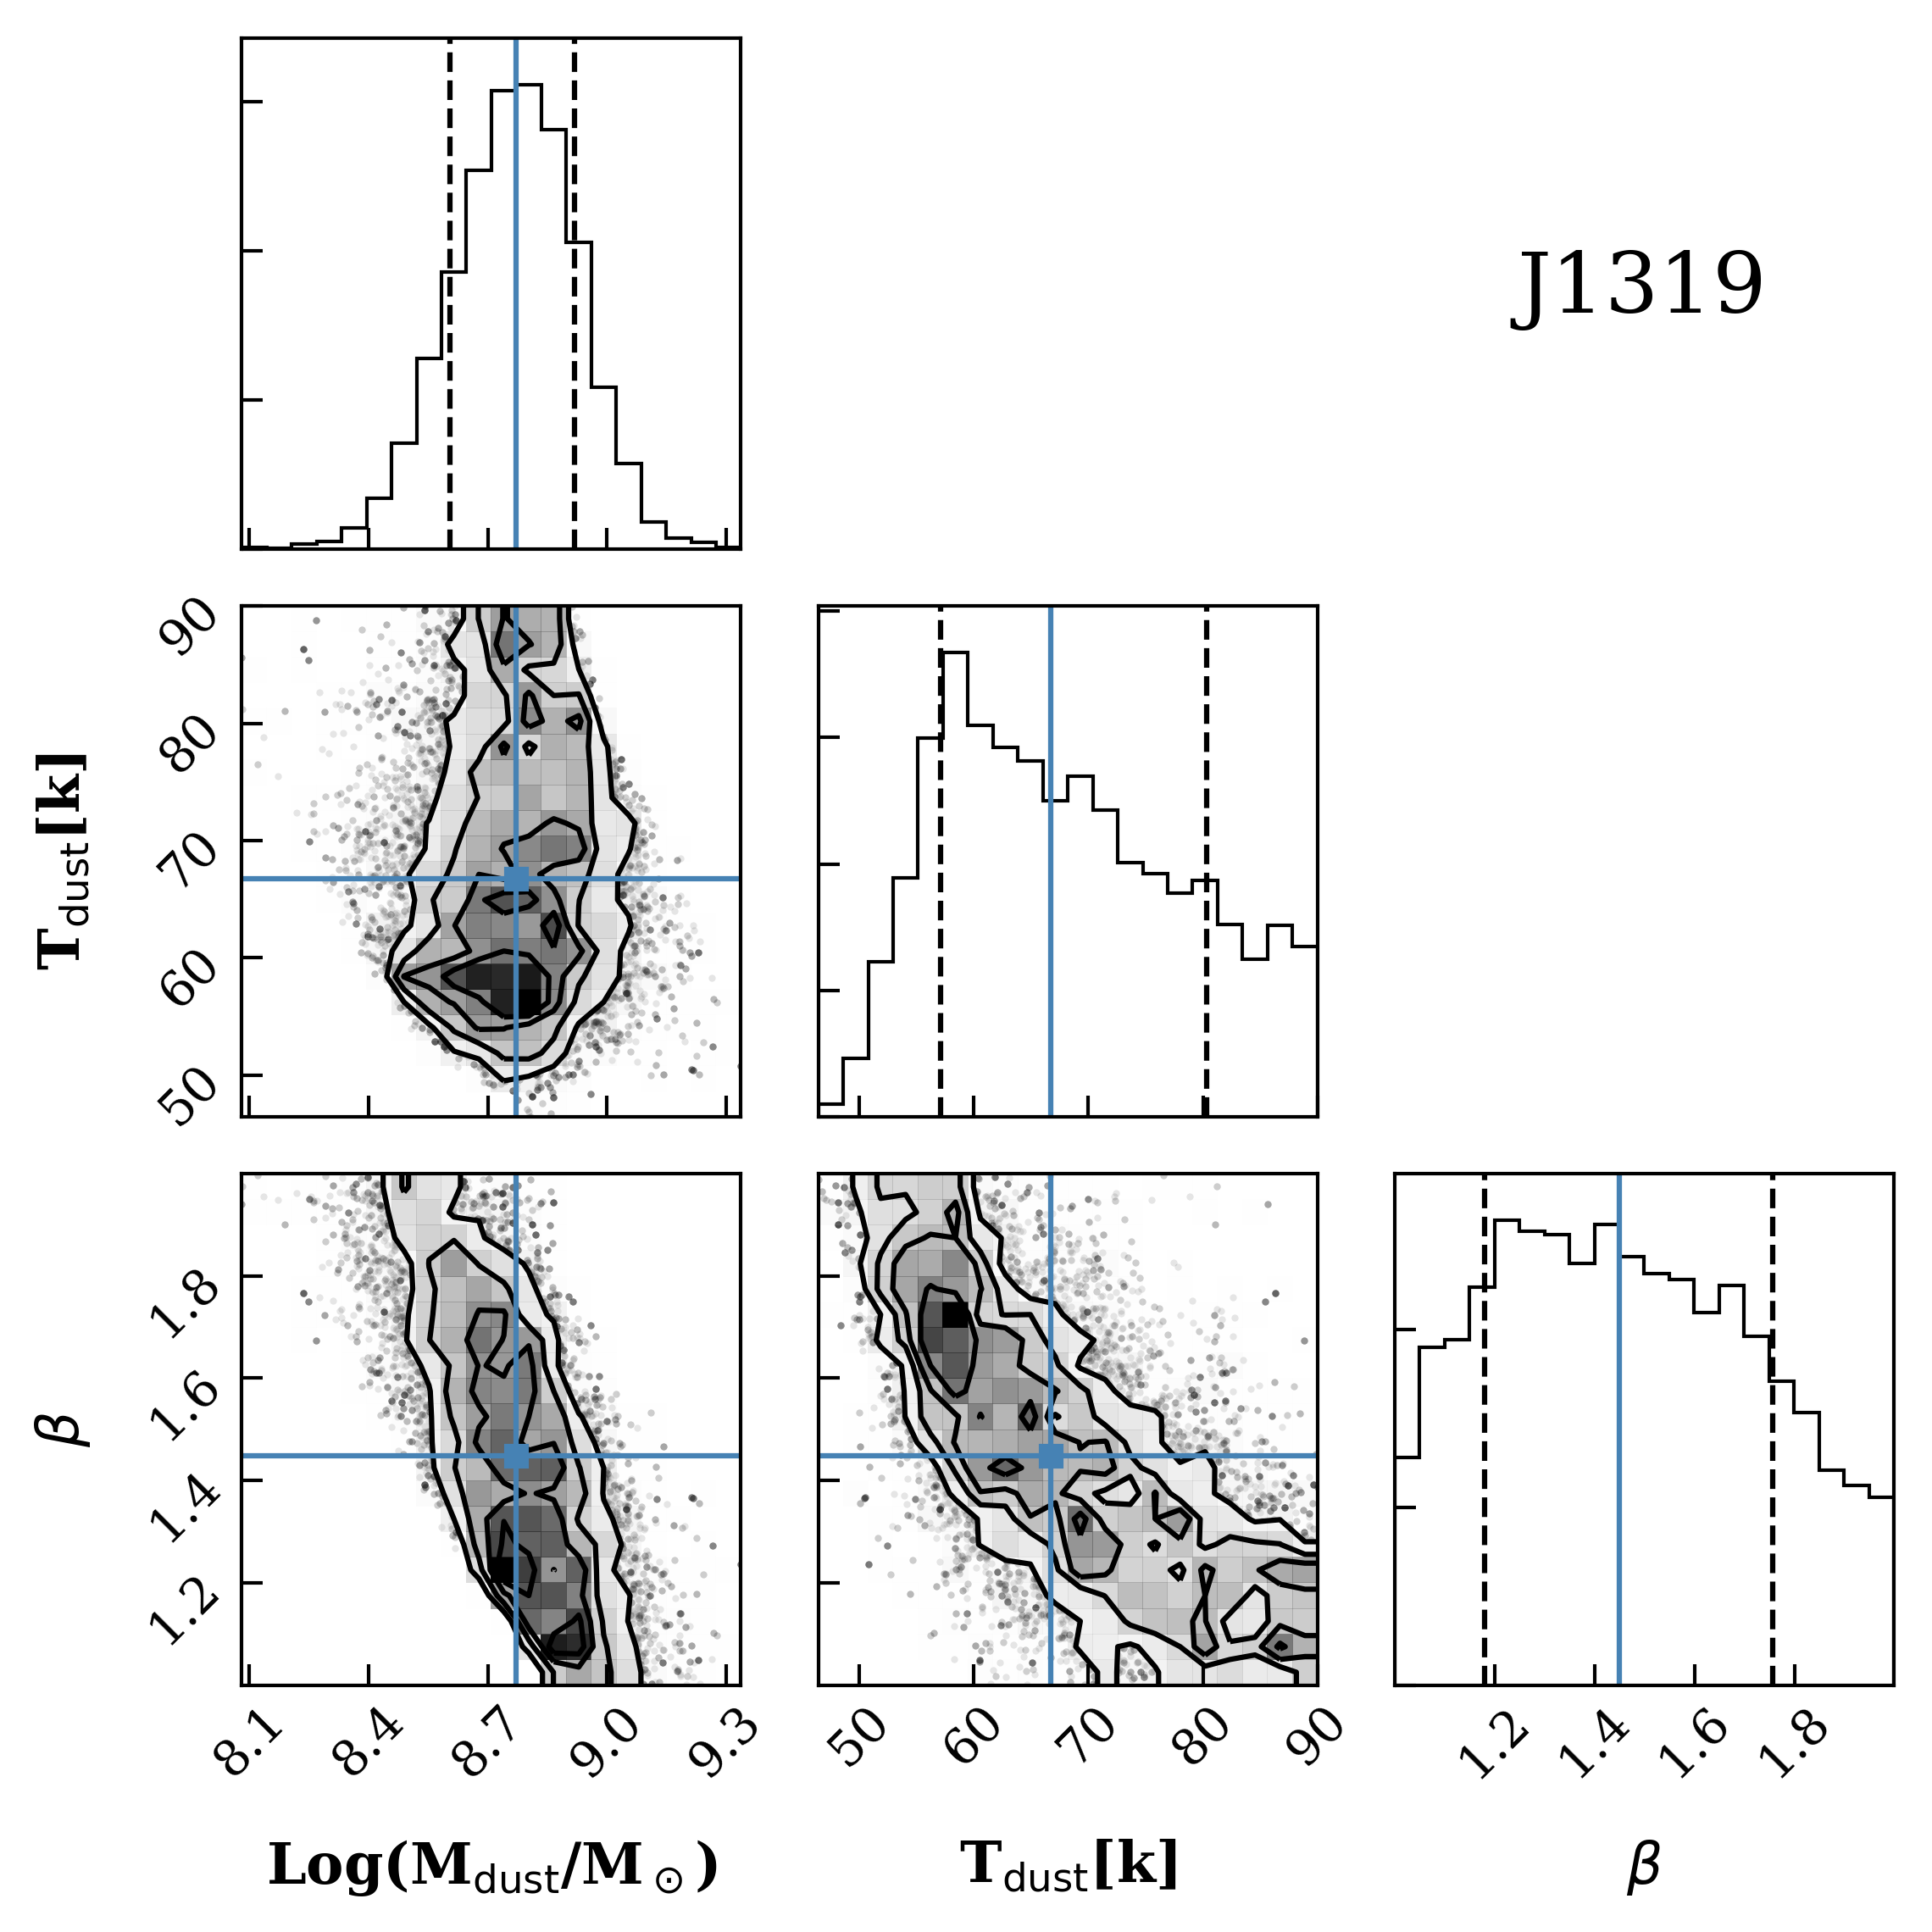 Figure 6
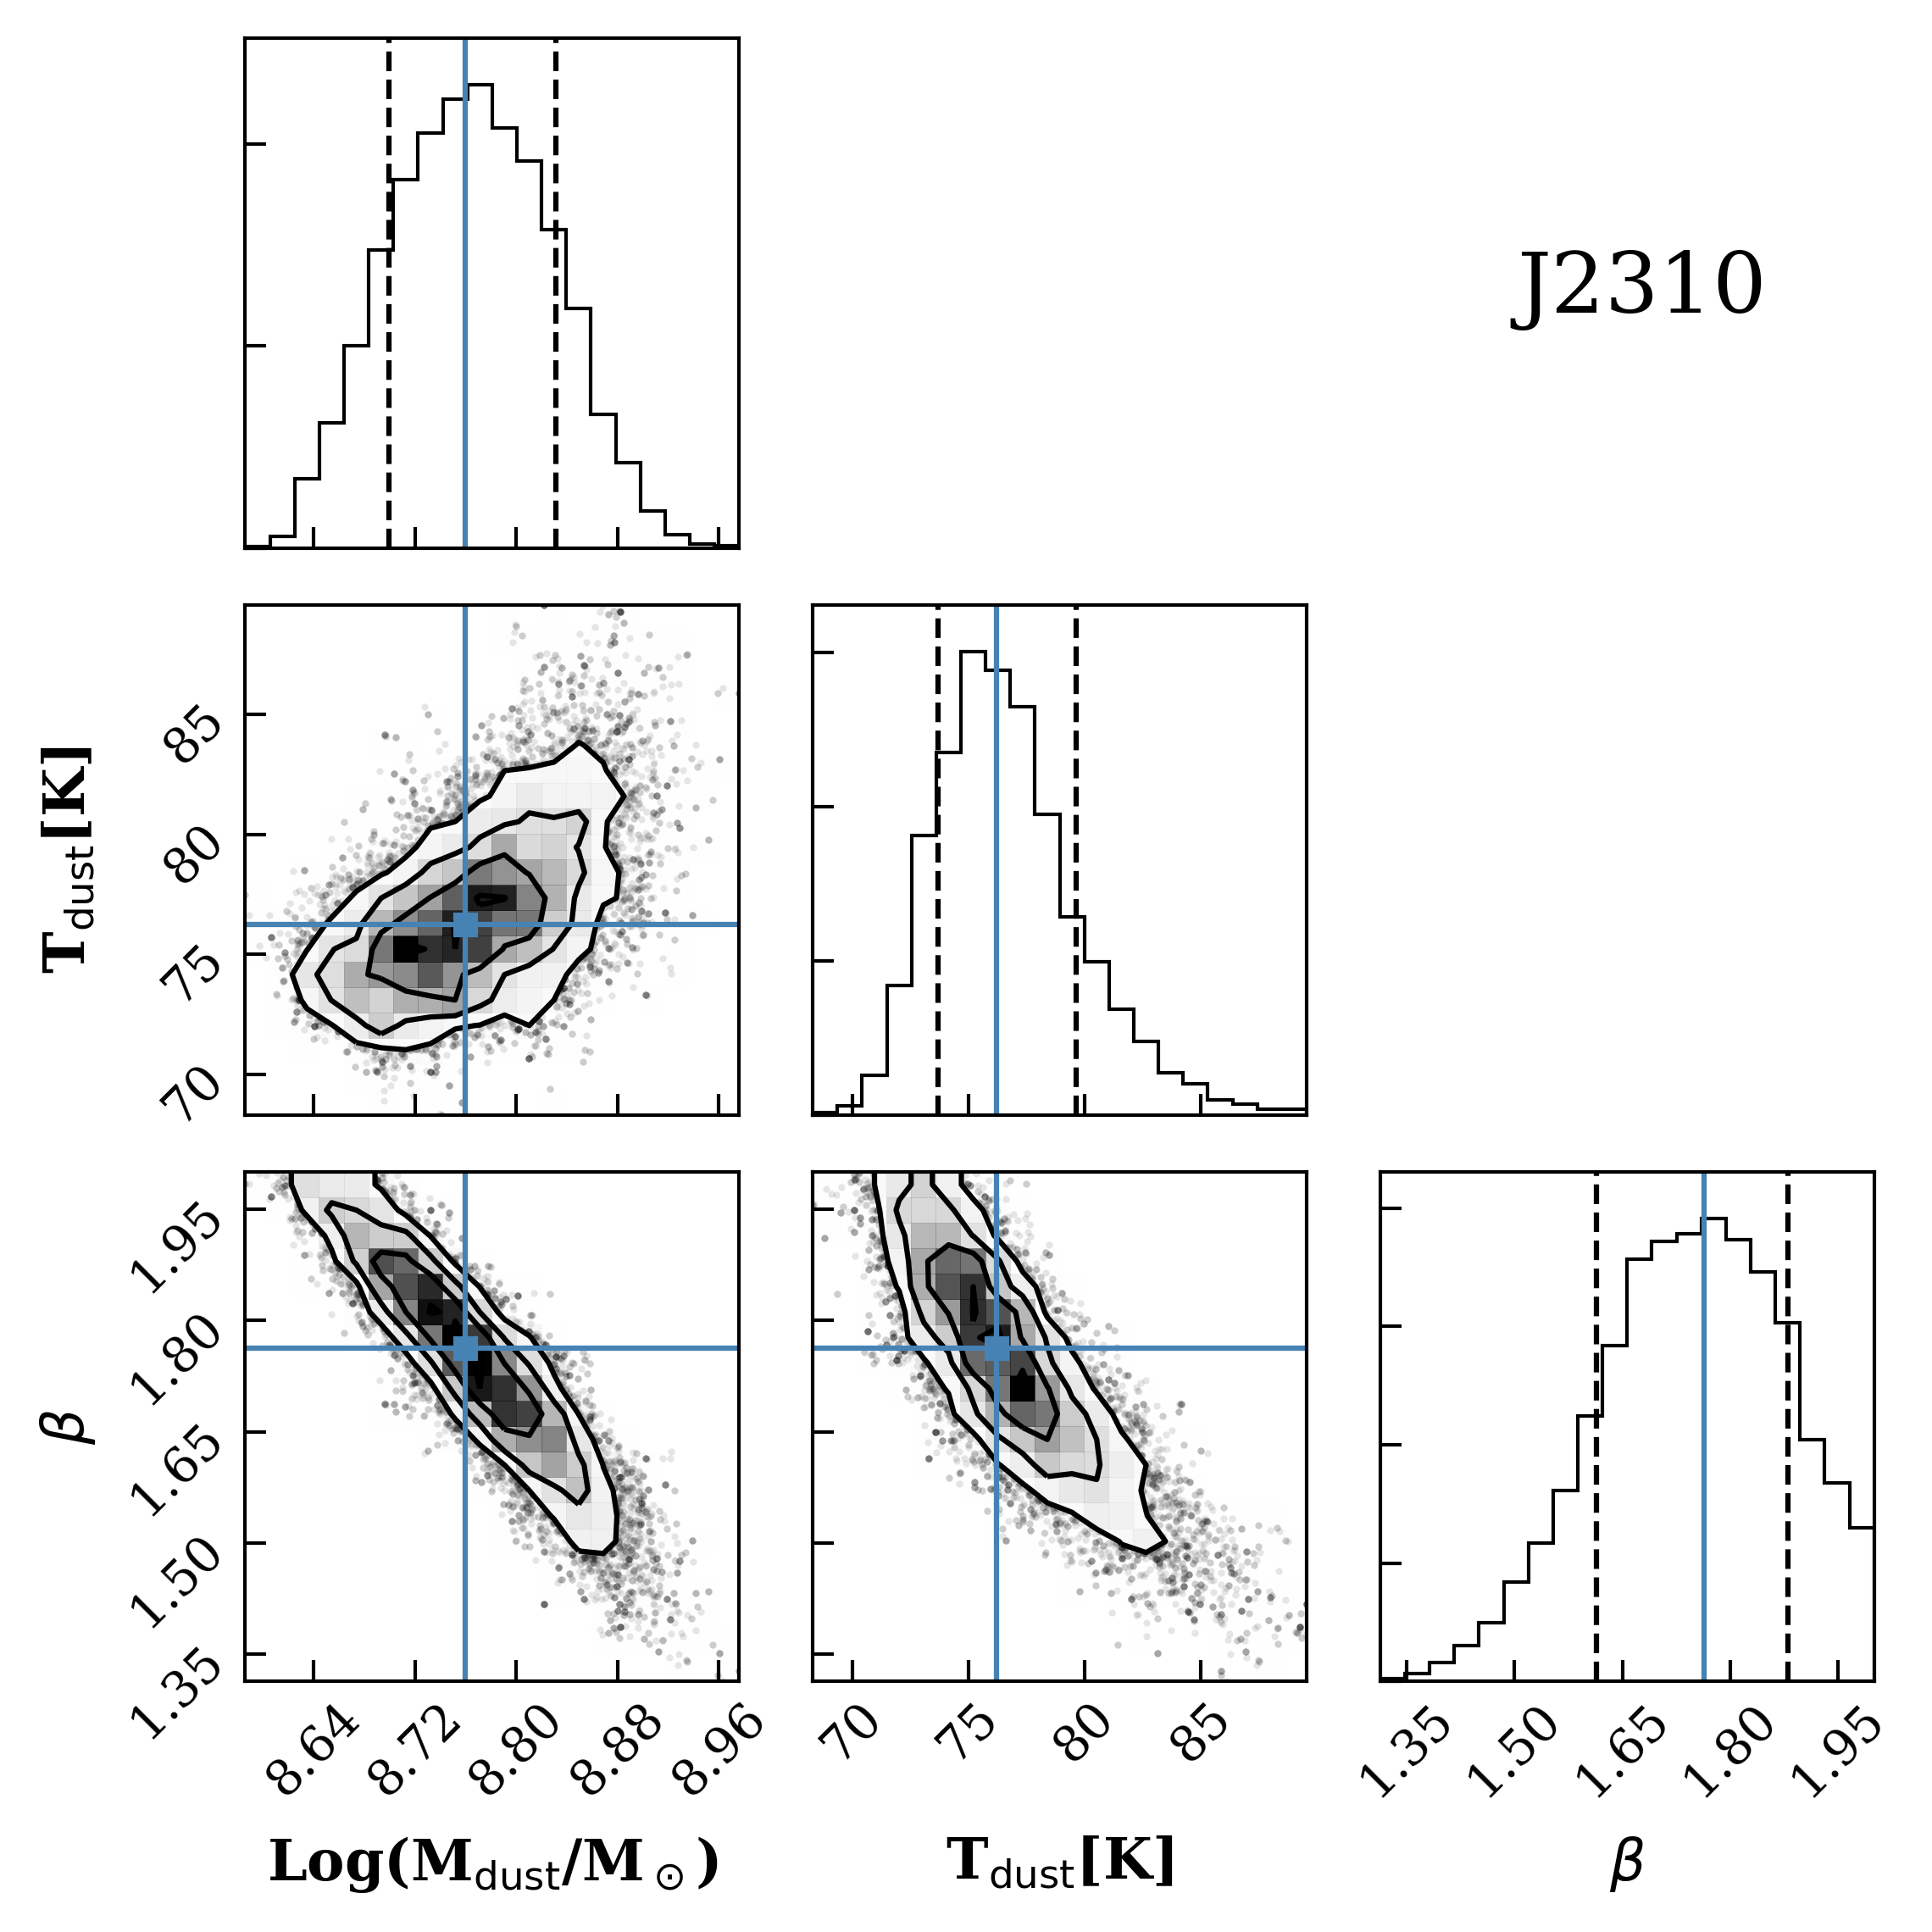 Figure 7
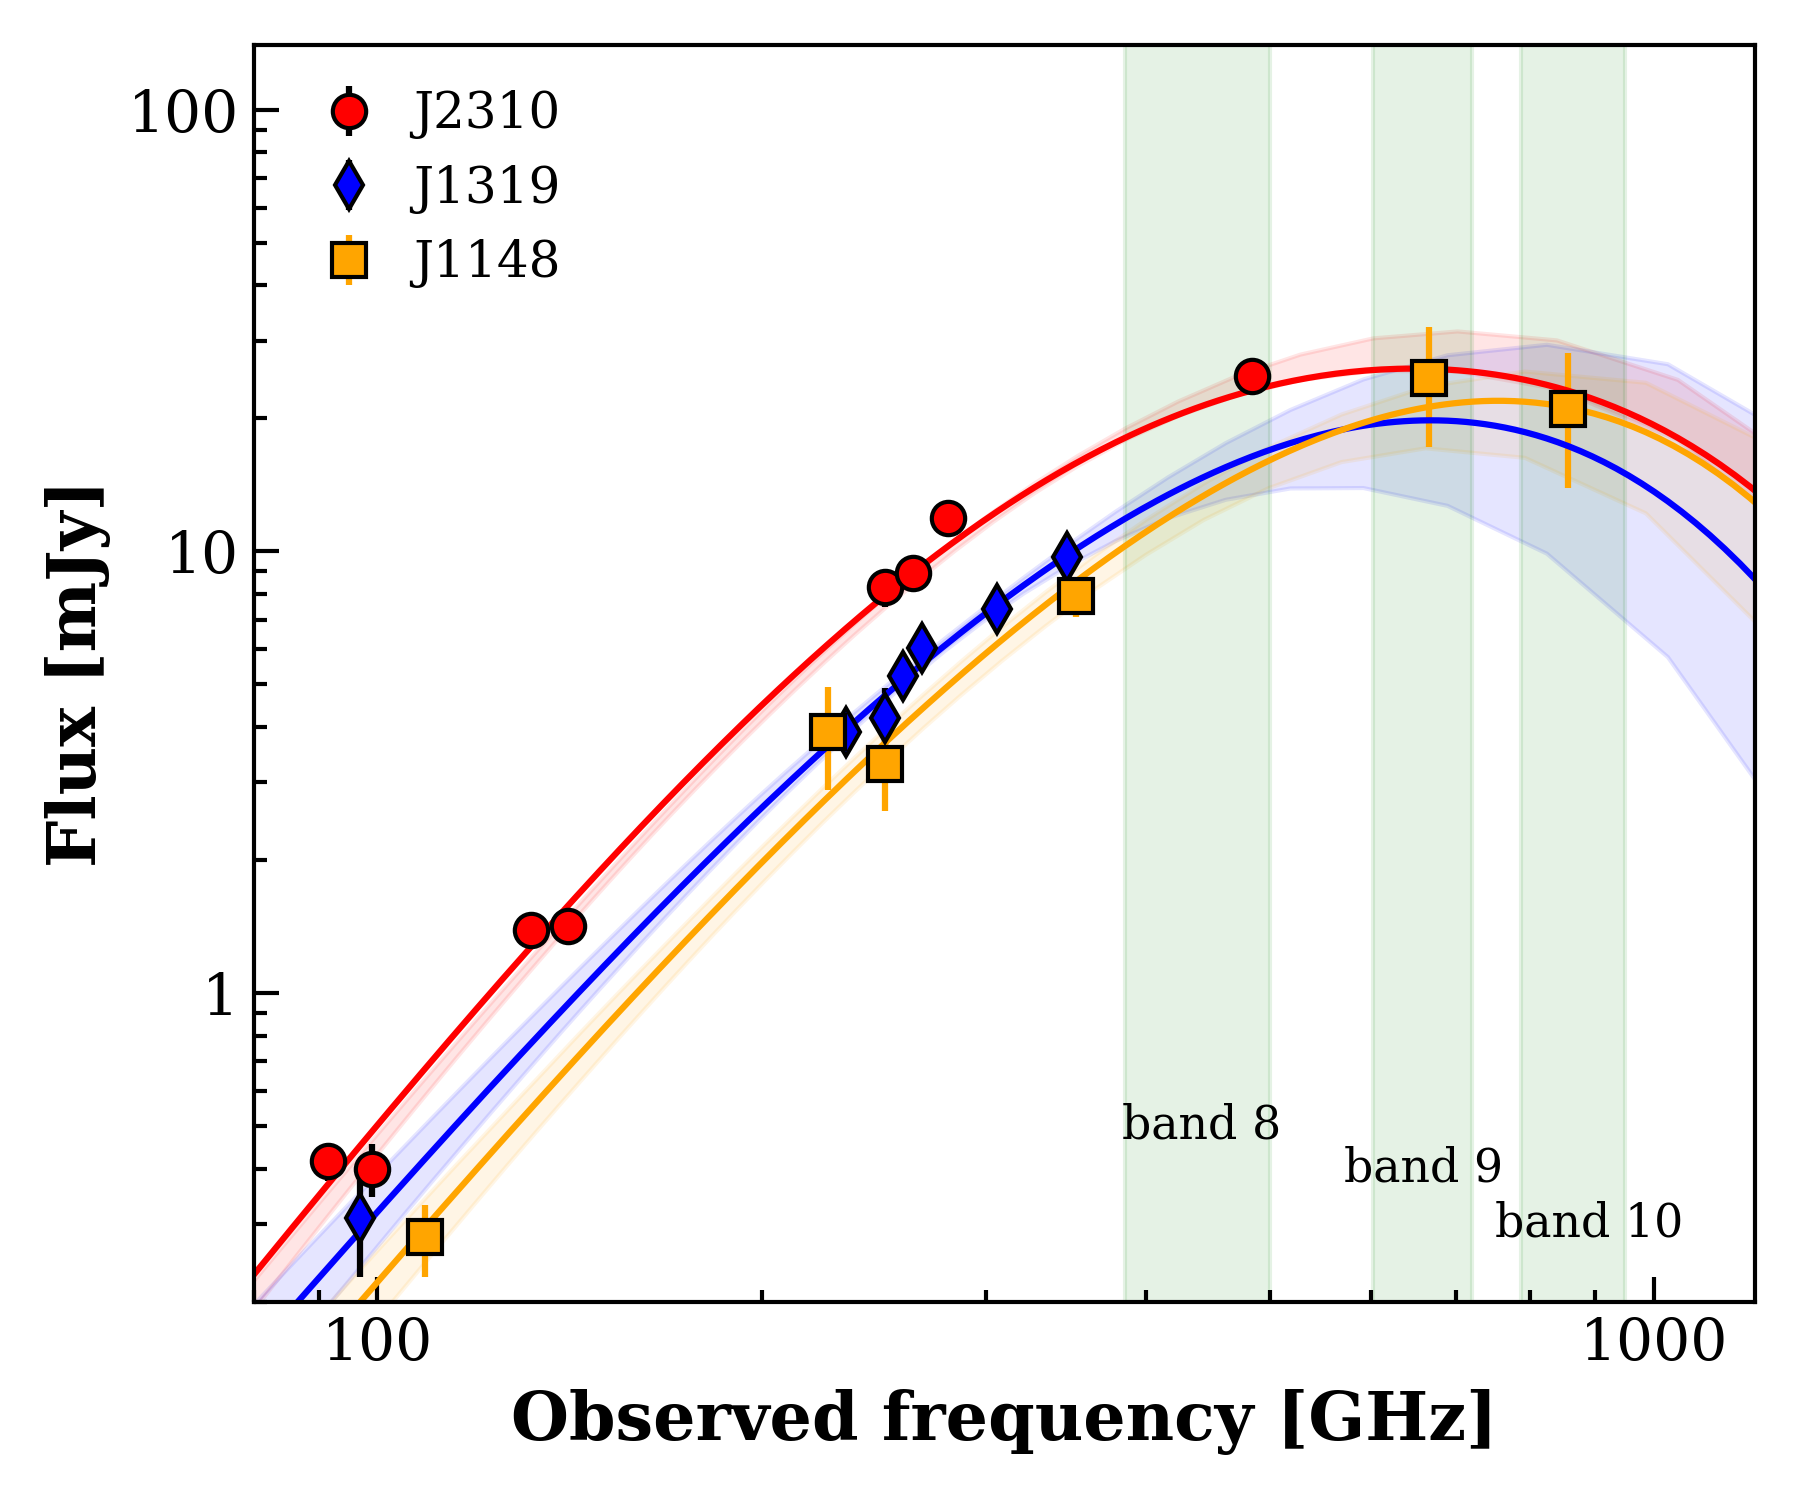 Figure 8
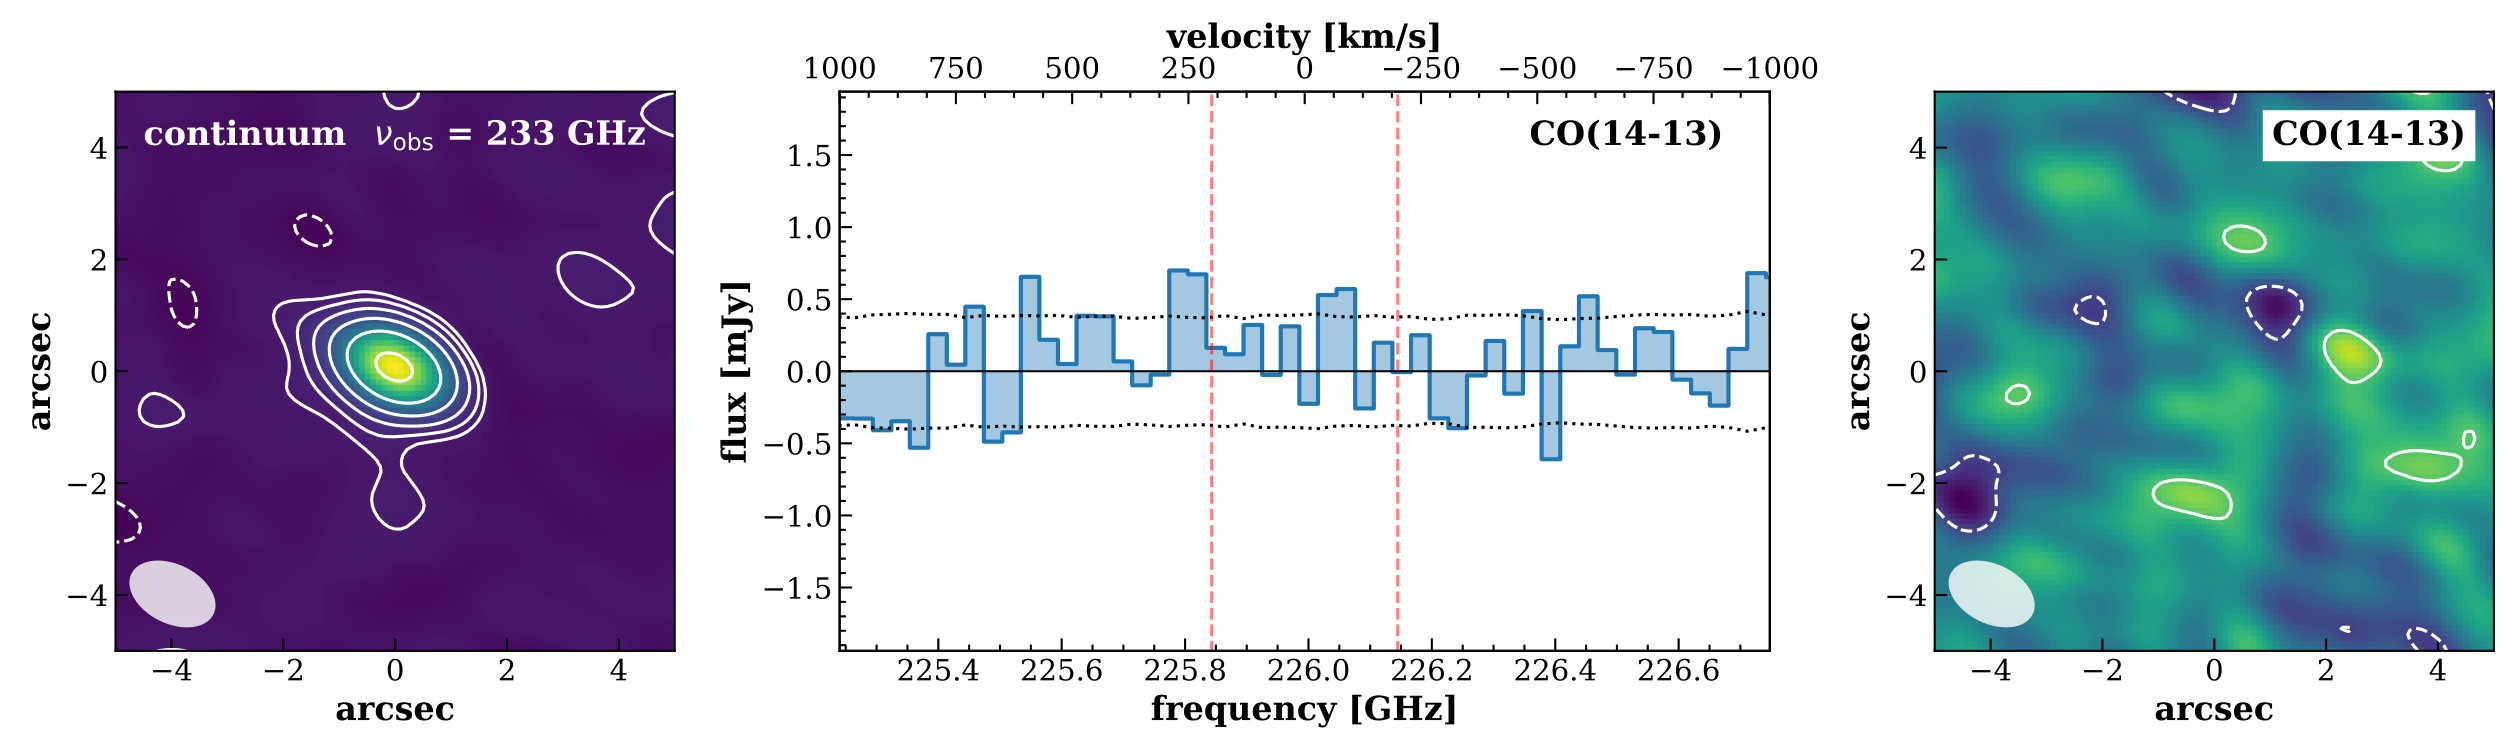 Figure 9
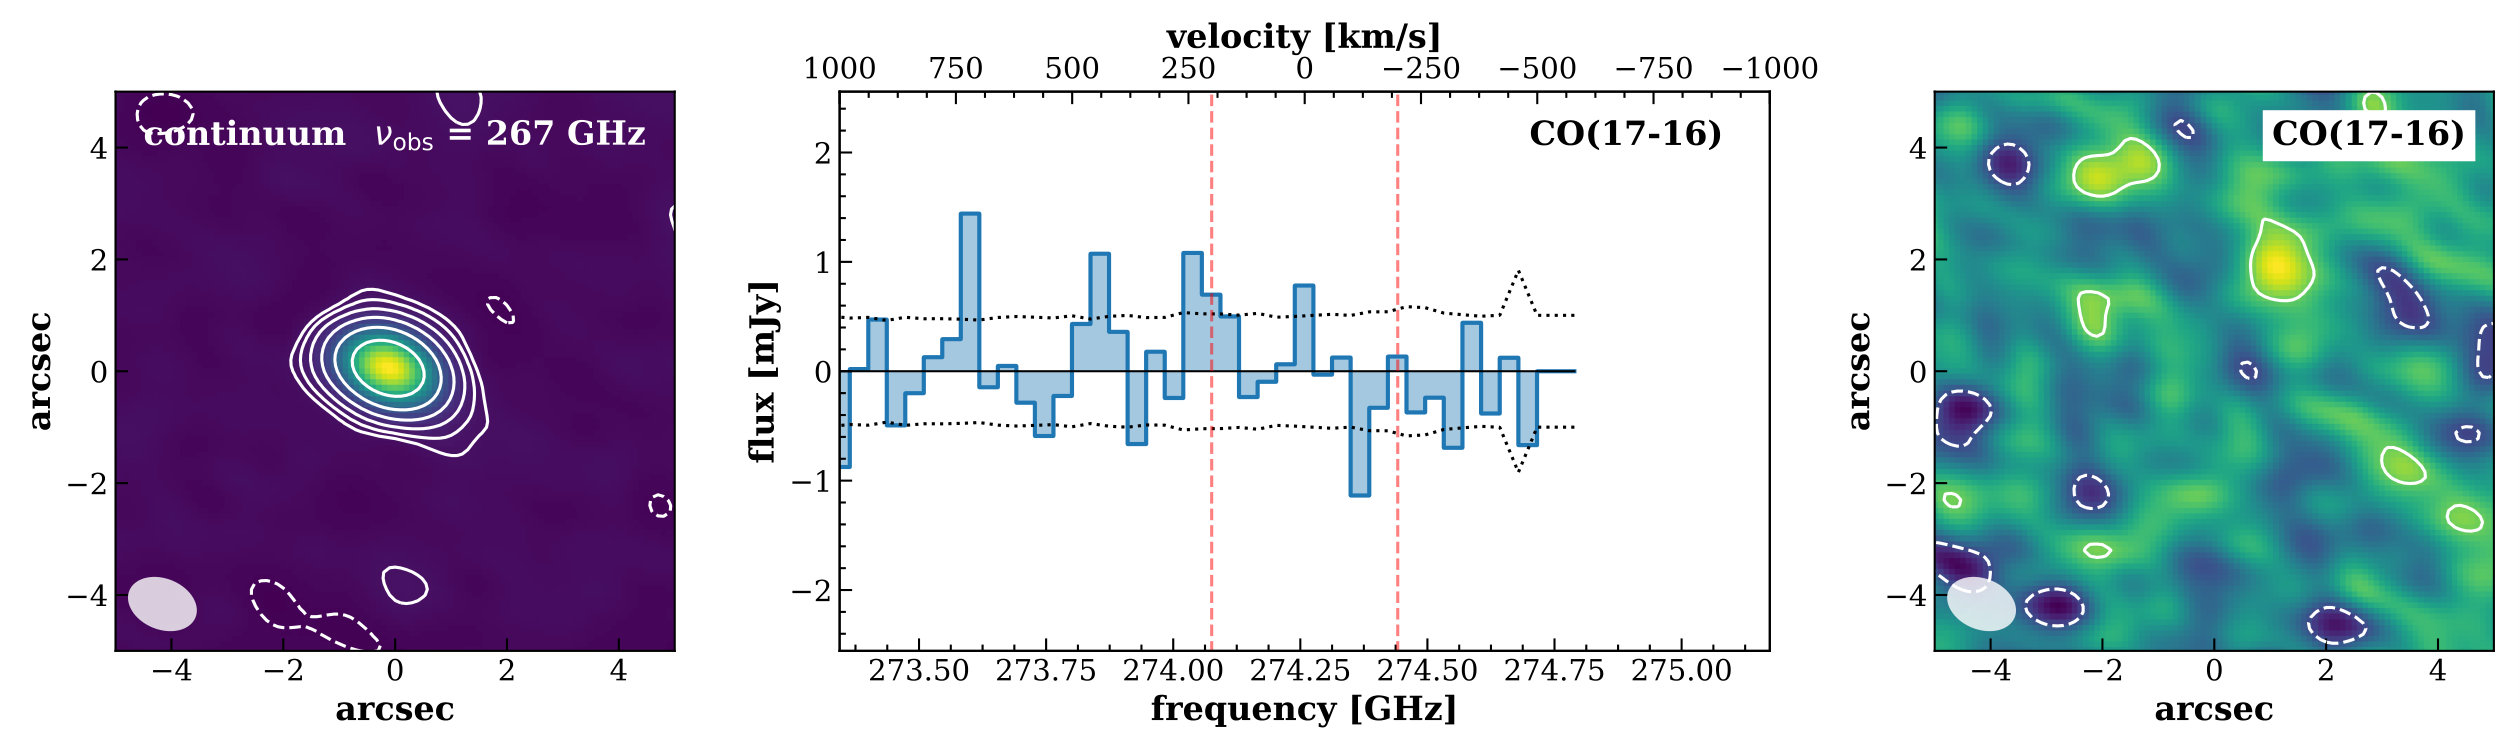 Figure 10
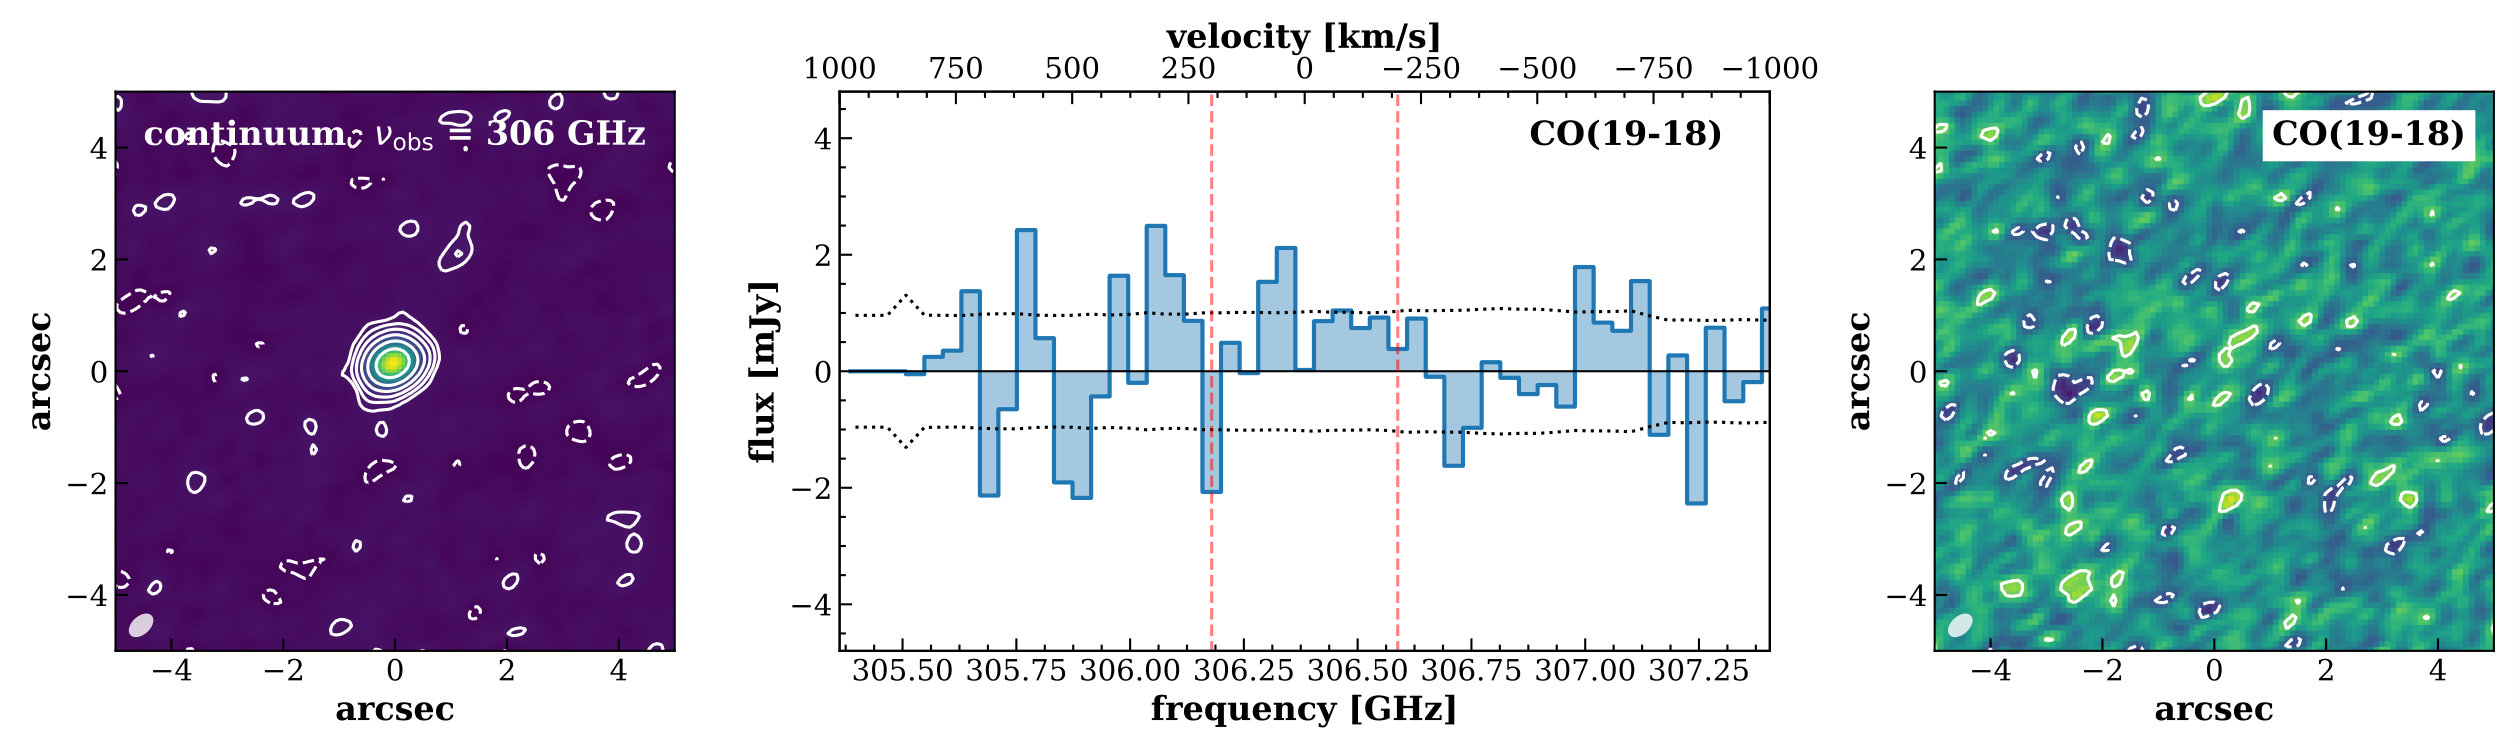 Figure 11
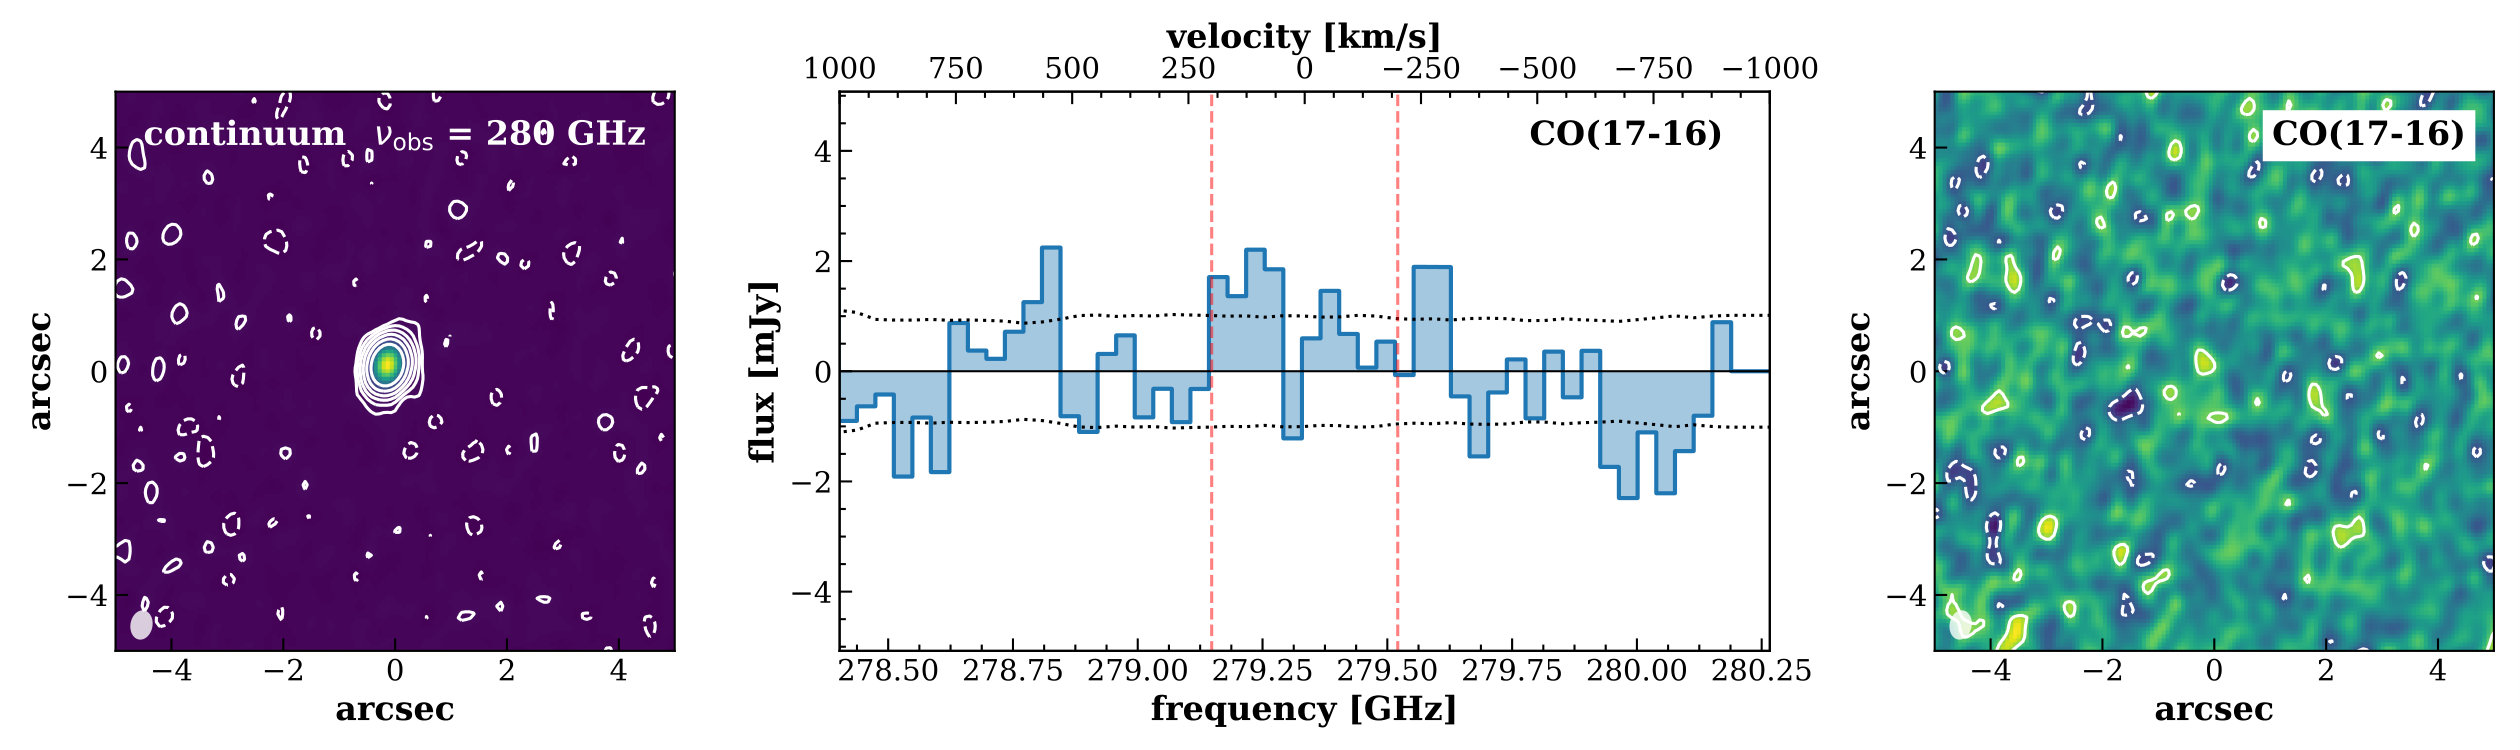 Figure 12
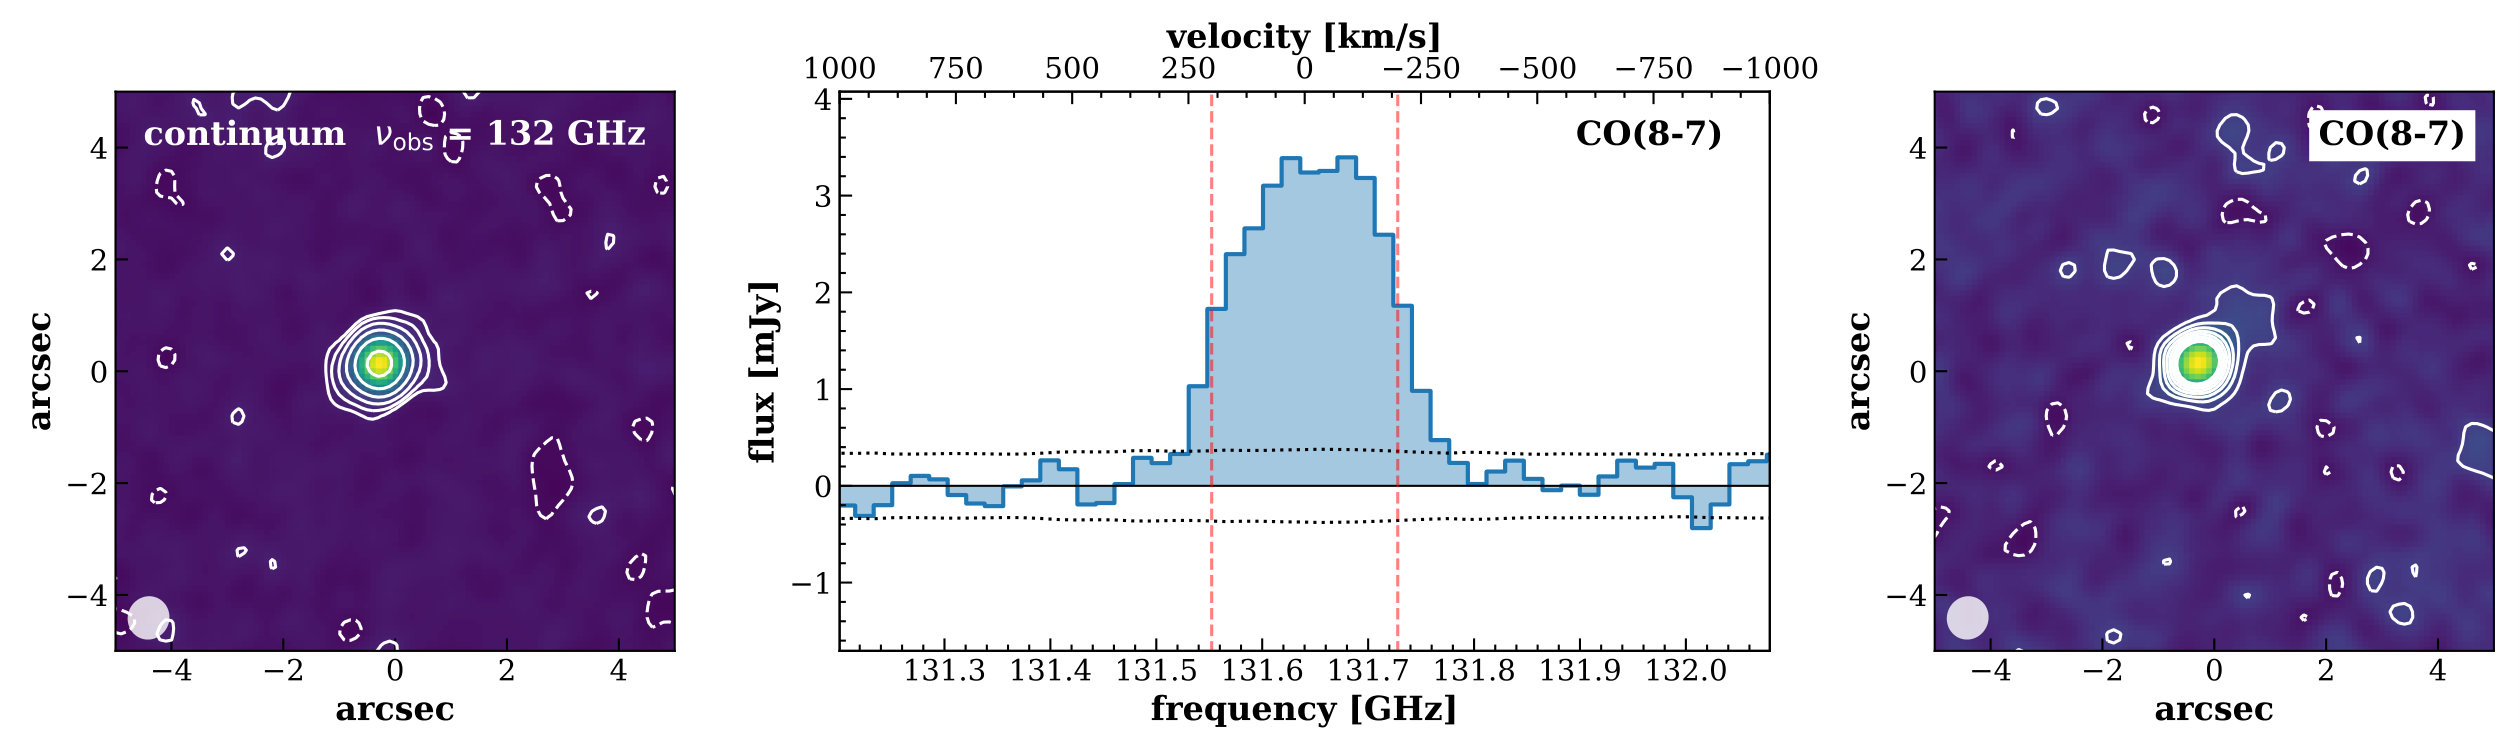 Figure 13
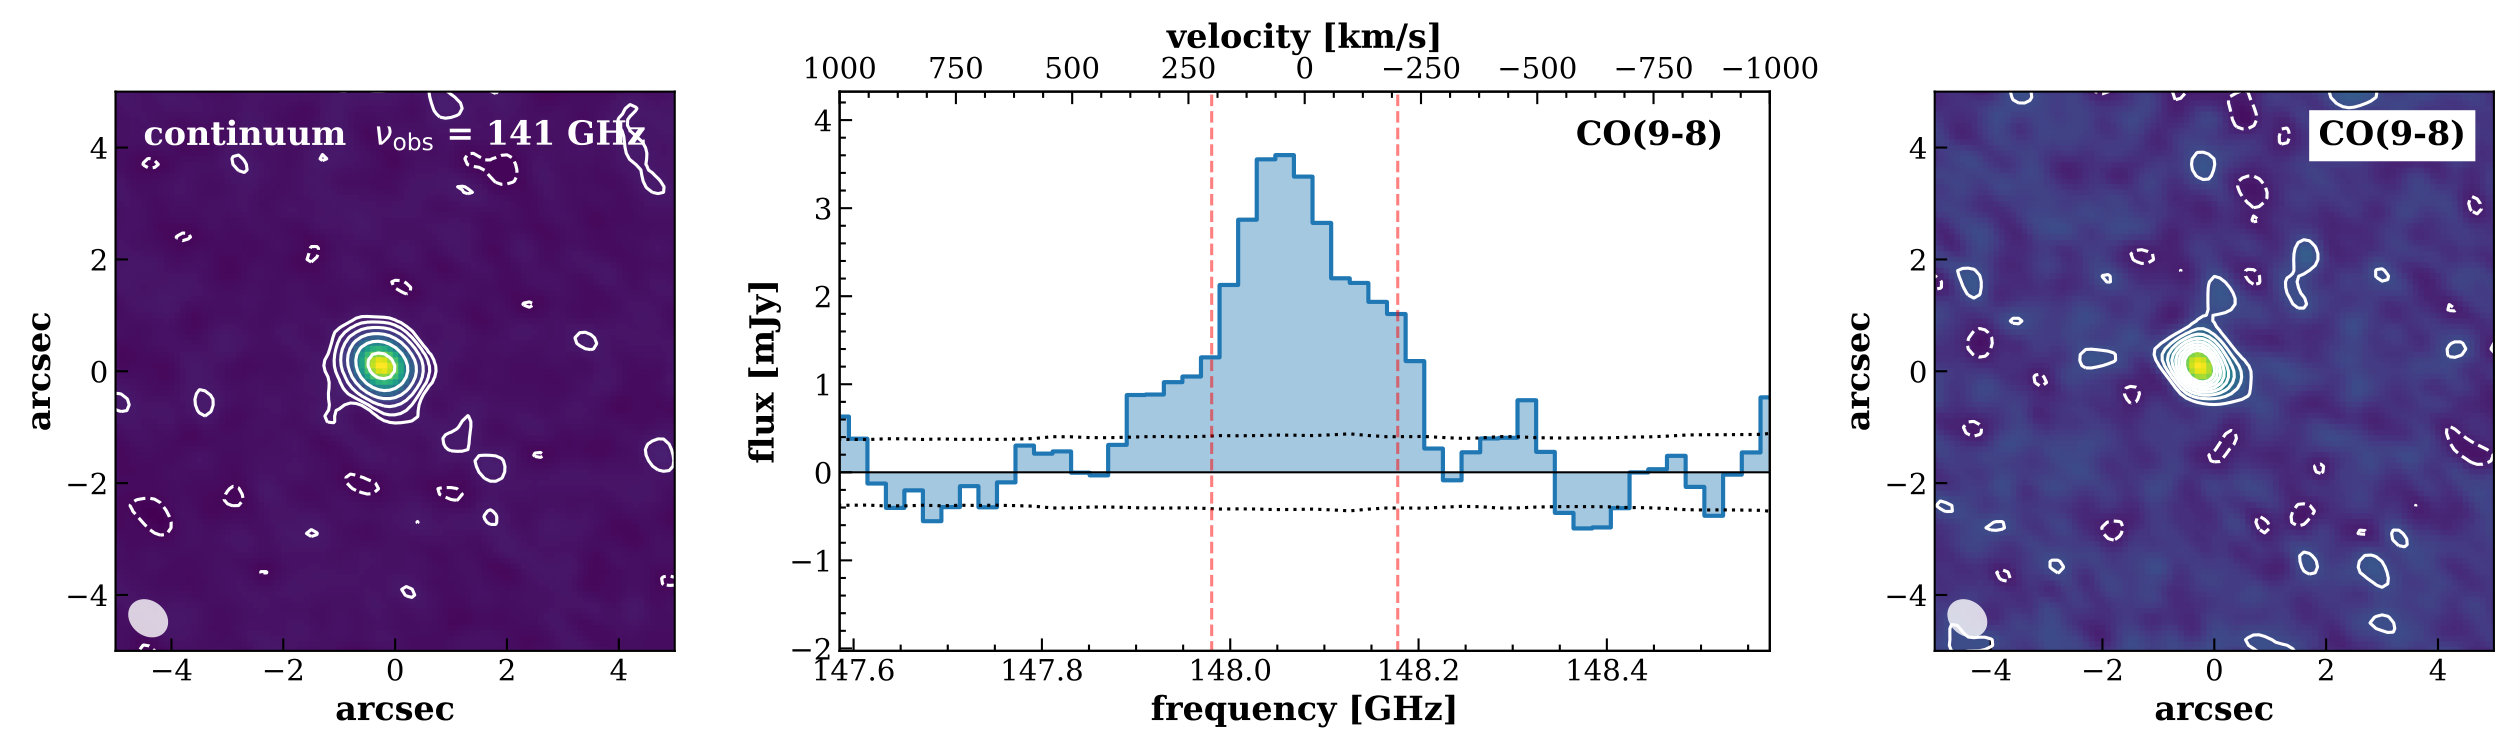 Figure 14
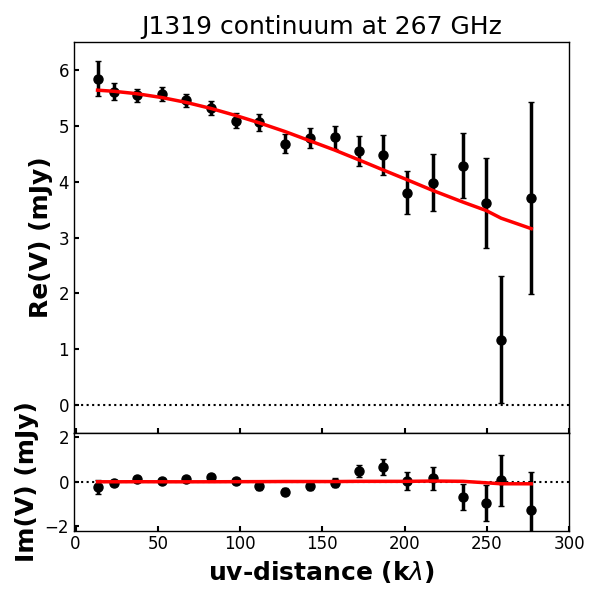 Figure 15
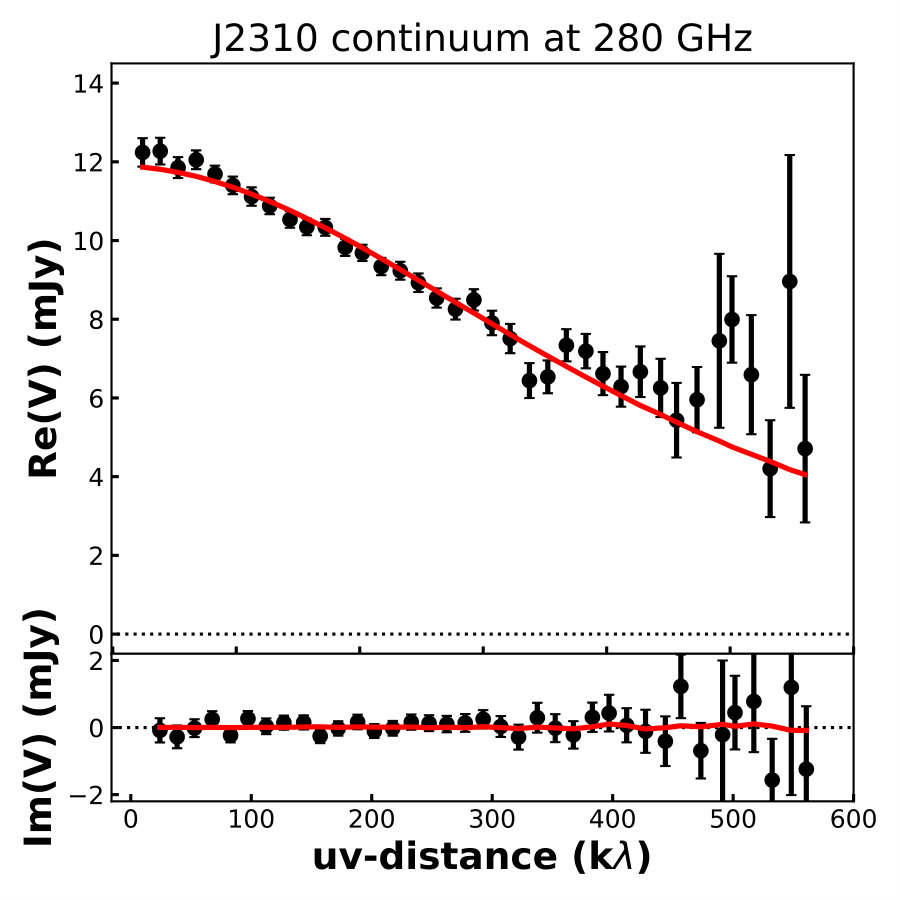 Figure 16
| Source | Scont | Angular | Half-light | Ell. | P.A | Reference | |||
| [GHz] | [Jy beam-1] | [mJy] | resolution | radius | |||||
| (a) | (b) | (c) | (d) | (e) | (f) | (g) | (h) | (i) | (j) |
| J2310 | 6.0031 | 91.5 | 5 | 0.4160.033 | 0.5″0.3″ | 0.12″0.02″ | 138°24° | [1] | |
| 99 | 50 | - | - | - | [3] | ||||
| 132 | 15 | this work | |||||||
| 141 | 15 | 1.420.02 | this work | ||||||
| 250 | 630 | 8.290.63 | 11″ | - | - | - | [3] | ||
| 263 | 80 | 8.910.08 | 0.7″ | 0.12″0.02″ | 0.20.1 | 162°18° | [2] | ||
| 280 | 42 | 12.00.2 | 0.105″0.016″ | this work | |||||
| 484 | 362 | 24.90.7 | [4] | ||||||
| J1319 | 6.1330 | 97 | 80 | 3.5″ | - | - | - | [2] | |
| 233 | 45 | 110°70° | this work | ||||||
| 250 | 650 | 4.200.65 | - | - | - | [2] | |||
| 258 | 100 | 5.230.10 | [3] | ||||||
| 267 | 43 | 6.030.07 | this work | ||||||
| 306 | 42 | 7.390.11 | this work | ||||||
| 347 | 33 | 9.680.12 | this work | ||||||
| NOTE – Col.(a): object name. Col.(b): redshift. Col.(c): observed frequency. Col.(d): rms on the continuum. Col.(e): continuum flux density. Col.(f): angular resolution. Col.(g): half-light radius of continuum emission; We note that in literature the galaxy size is usually reported in term of either FWHM, if a gaussian profile has been used as model, or radius scale , in the case of an exponential profile model. is related to FWHM and as and , respectively. Col.(h): ellipticity. Col.(i): position angle. Col.(j) reference; [1] Feruglio et al. (2018) [2] Wang et al. (2013) [3] Wang et al. (2011) [4] Hashimoto et al. (2018). | |||||||||
| J2310 | J1319 | J1148 | |
| Dust emission | |||
| Log(Mdust/M⊙) | |||
| Tdust [K] | |||
| LFIR [1013 L⊙] | |||
| CO emission [ L⊙] | |||
| CO(1-0) | - | - | 0.72d |
| CO(2-1) | - | ||
| CO(3-2) | - | - | |
| CO(6-5) | |||
| CO(7-6) | - | - | |
| CO(8-7) | - | - | |
| CO(9-8) | - | - | |
| CO(14-13) | - | - | |
| CO(17-16) | h† | ||
| CO(19-18) | - | - | |
| REFERENCE: aShao et al. (2019); bFeruglio et al. (2018); cWang et al. (2013); dBertoldi et al. (2003b); eStefan et al. (2015); fWalter et al. (2003); gRiechers et al. (2009); hGallerani et al. (2014). NOTE: ‡Upper limits are estimated in a aperture of , and spectral width of for J2310 and for J1319; † The CO(17-16) luminosity of J1148 accounts for the possible contamination by OH+. See Gallerani et al. 2014 and Sec. 5.2 for further details. | |||
| J2310 | J1319 | J1148 | |
|---|---|---|---|
| M1450(1) | -27.61 | -27.12 | -27.80 |
| Log(SFRFIR/M⊙ yr-1)(2) | |||
| L(3) [109 L⊙] | |||
| LX-ray(4) [10] | - | ||
| MBH(5) [109 M⊙] | 1.8 | 2.7 | 3 |
| J2310 | J1319 | J1148 | |
|---|---|---|---|
| Dust parameters (optical thin assumption) | |||
| Log(Mdust/M⊙) | 9.08 | 8.9 | 8.6 |
| Tdust [K] | |||
| LFIR [1013 L⊙] | |||
| AGN | Starburst galaxies |
|---|---|
| NGC 4945 | NGC 253 |
| Circinus | M83 |
| Mrk 231 | M82 |
| NGC 6240 | IC 694 |
| NGC 3690 | NGC 4418 |
| NGC 1068 | MCG+12-02-001 |
| NGC 34 | NGC 1614 |
| IC 1623 | NGC 2146 |
| NGC 1365 | NGC 3256 |
| IRASF 05189-2524 | ESO 320-G030 |
| NGC 2623 | ESO 173-G015 |
| Arp 229 | IRASF 17207-0014 |
| IRAS 13120-5453 | IC 4687 |
| NGC 5135 | NGC 7552 |
| Mrk 273 | NGC 7771 |
| NGC 6240 | Mrk 331 |
| NGC 7469 |
Peer Reviews
No public reviews on file for this paper yet. If you reviewed it on a platform where reviews are public (OpenReview, ICLR, NeurIPS, ICML), you can paste yours below so the community can read it here.
Videos
No videos yet. Explain this paper in a talk, walkthrough, or lecture? Add one.
Constraints on high-J CO emission lines in quasars
S. Carniani1, S. Gallerani1, L. Vallini2,3, A. Pallottini4,1, M. Tazzari5, A. Ferrara1, R. Maiolino6,7, C. Cicone8, C. Feruglio9, R. Neri10, V. D’Odorico11,1, R. Wang12, J. Li13
1 Scuola Normale Superiore, Piazza dei Cavalieri 7, I-56126 Pisa, Italy
2 Leiden Observatory, P.O. Box 9513 NL-2300 RA, (NL)
3 Nordita, KTH Royal Institute of Technology and Stockholm University, Roslagstullsbacken 23, SE-10691 Stockholm, Sweden
4 Centro Fermi, Museo Storico della Fisica e Centro Studi e Ricerche ‘Enrico Fermi’, Piazza del Viminale 1, I-00184 Roma, Italy
5 Institute of Astronomy, University of Cambridge, Madingley Road, Cambridge CB3 0HA, UK
6 Kavli Institute for Cosmology, University of Cambridge, Madingley Road, Cambridge CB3 0HA, UK
7 Cavendish Laboratory, University of Cambridge, 19 J. J. Thomson Ave., Cambridge CB3 0HE, UK
8 INAF - Osservatorio Astronomico di Brera, Via Brera 28, 20121 Milano, Italy
9 INAF Osservatorio Astronomico di Trieste, Via G. Tiepolo 11, Trieste, Italy
10 Institute de Radioastronomie Millimetrique, St. Martin d’Heres, F-38406, France
11 INAF Osservatorio Astronomico di Trieste, via G. Tiepolo 11, Trieste, Italy
12 Kavli Institute of Astronomy and Astrophysics at Peking University, No.5 Yiheyuan Road, Haidian District, Beijing, 100871, China
13 Department of Astronomy, School of Physics, Peking University, Beijing 100871, China E-mail: [email protected]
(Accepted XXX. Received YYY; in original form ZZZ)
Abstract
We present Atacama Large Millimiter/submillimiter Array (ALMA) observations of eight highly excited CO ( ) lines and continuum emission in two quasars: SDSS J231038.88+185519.7 (hereafter J2310), for which CO(8-7), CO(9-8), and CO(17-16) lines have been observed, and ULAS J131911.29+095951.4 (J1319), observed in the CO(14-13), CO(17-16) and CO(19-18) lines. The continuum emission of both quasars arises from a compact region ( kpc). By assuming a modified black-body law, we estimate dust masses of Log and Log and dust temperatures of and , respectively for J2310 and J1319. Only CO(8-7) and CO(9-8) in J2310 are detected, while upper limits on luminosities are reported for the other lines of both quasars. The CO line luminosities and upper limits measured in J2310 and J1319 are consistent with those observed in local AGN and starburst galaxies, and other quasars, except for SDSS J1148+5251 (J1148), the only quasar at with a previous CO(17-16) line detection. By computing the CO SLEDs normalised to the CO(6-5) line and FIR luminosities for J2310, J1319, and J1149, we conclude that different gas heating mechanisms (X-ray radiation and/or shocks) may explain the different CO luminosities observed in these quasar. Future CO observations will be crucial to understand the processes responsible for molecular gas excitation in luminous high- quasars.
keywords:
quasars: individual: SDSS J231038.88+185519.7 - quasars: individual: ULAS J131911.29+095951.4 - galaxies: high-redshift - galaxies: active - galaxies: ISM
††pubyear: 2019††pagerange: Constraints on high-J CO emission lines in quasars–C
1 Introduction
The presence of early super massive black holes (SMBH) represents a challenging problem in modern cosmology. In the last decades, more than 200 quasars have been discovered at and beyond (e.g. Bañados et al., 2016, 2018; Jiang et al., 2016; Matsuoka et al., 2016, 2018; Mazzucchelli et al., 2017); for several of them, the mass of the hosted BH has been measured and found to be (Kurk et al., 2007; Jiang et al., 2007; Willott et al., 2010; De Rosa et al., 2011; Wu et al., 2015; Feruglio et al., 2018). The presence of such supermassive BHs when the Universe was less than 1 Gyr old, is still an open problem (Li et al., 2007; Narayanan et al., 2008; Volonteri, 2010; Di Matteo et al., 2012; Valiante et al., 2017), deeply connected both with the galaxy-BH co-evolution (e.g. Wang et al., 2010; Lamastra et al., 2010; Volonteri & Stark, 2011; Valiante et al., 2014) and the contribution of quasars to the cosmic reionization process (Volonteri & Gnedin, 2009; Giallongo et al., 2015; Madau & Haardt, 2015; Manti et al., 2017; Qin et al., 2017; Parsa et al., 2018; Mitra et al., 2018; Kulkarni et al., 2019).
In the last years, the advent of millimetre and submillimeter interferometers has given the possibility of studying the physical properties of the interstellar medium (ISM) in galaxies hosting SMBHs. In fact, several important tracers of the ISM physical and chemical state, such as the [C ii] line at 158m, CO rotational transitions, and dust continuum emission, are redshifted in the millimetre bands at high redshift and are observable from ground-based facilities (see Gallerani et al., 2017a, for a review on this topic). The Atacama Large Millimiter/submillimiter Array (ALMA) is currently the most powerful interferometer for observing rest-frame far-infrared (FIR) emission in the distant Universe, as highlighted in several recent works showing ALMA capabilities on investigating ISM properties in quasars (Gallerani et al., 2012; Carniani et al., 2013; Venemans et al., 2017a, b; Decarli et al., 2017, 2018; Bischetti et al., 2018; Feruglio et al., 2018).
In this work we focus on CO, the most abundant molecule after H2 (Carilli & Walter, 2013). CO has a finite dipole moment that allows transitions between energy levels with small energy gaps. Examining the CO spectral line energy distribution (SLED), which is the relative luminosity (or intensity) of CO lines as a function of rotational transitions , provides us the opportunity to probe the excitation conditions of molecular gas in galaxies. This kind of observations will not be possible with the fainter quadrupole transitions of H2 until the advent of SPace IR telescope for Cosmology and Astrophysics (SPICA; Spinoglio et al., 2017; Egami et al., 2018)
The strength of low-J and mid-J transitions ( ) is mainly driven by physical properties such as gas density and temperature (e.g. Obreschkow et al., 2009; Mashian et al., 2015). At high redshift () the shape of the CO SLED also depends on the cosmic microwave background (CMB) radiation (da Cunha et al., 2013), since the CMB temperature ( K) becomes comparable to that of the cold/molecular gas ( K). The high increases the gas excitation conditions and boosts the CO line intensities. At the same time, the CMB background against which the line is measured increases too. This twofold effect shifts the peak of the CO SLED at higher transitions up to (Tunnard & Greve, 2016; Vallini et al., 2018). Mid-J CO observations can be therefore used in the early Universe for investigating the molecular gas reservoir and ISM properties in both star-forming (e.g. Genzel et al., 2015; Aravena et al., 2016) and quasar host galaxies (e.g. Kakkad et al., 2017; Carniani et al., 2017b; Venemans et al., 2017a, b; Brusa et al., 2018).
High-J ( ) CO lines are only emitted from states with temperatures 150 - 7000 K above the ground and have critical densities of . These lines trace molecular warm and dense gas and are often over-luminous in extreme environments, such as luminous AGN (e.g. Meijerink et al., 2007; Schleicher et al., 2010), extreme starbursts (SFR M⊙ yr*-1*, e.g. Narayanan et al., 2008), regions shocked by merging or outflows mechanisms (Panuzzo et al., 2010; Hailey-Dunsheath et al., 2012; Richings & Faucher-Giguère, 2018). Identifying the dominant mechanism for molecular gas excitation is crucial for a proper interpretation of high-J CO line observations, and thus for a deeper understanding of the ISM properties.
In the local Universe high-J CO lines have been detected by using the Photodetector Array Camera and Spectrometer (PACS, Poglitsch et al., 2010) on board of the Herschel Space Observatory (Pilbratt et al., 2010). Mashian et al. (2015) reported the high-J CO SLED ( ) of 5 starburst galaxies, 5 AGN, 22 ULIRGs and 2 interacting systems. They found that the extreme diversity in CO emission makes multiple lines essential to constrain the gas properties.
At high-, CO transitions have been observed only in quasars and extreme starburst galaxies (Weiß et al., 2007; Riechers et al., 2013; Gallerani et al., 2014; Venemans et al., 2017b). In particular Gallerani et al. (2014) detected with the Plateau de Bure interferometer (PdBI) an exceptionally strong CO(17-16) line in the quasar SDSS J114816.64+525150.3 (hereafter J1148). By combining previous CO observations (Bertoldi et al., 2003b; Walter et al., 2003; Riechers et al., 2009) with the detection of the CO(17-16), and by comparing the observed CO SLED with Photo-Dissociation Regions (PDR) and X-ray Dominated Region (XDR) models (Meijerink & Spaans, 2005; Meijerink et al., 2007), the authors found that while PDR models can fairly reproduce the observed CO SLED for , the CO(17-16) line can only be explained through the presence of a substantial X-ray radiation field. Indeed, strong X-ray emission () was recently detected in this source (Gallerani et al., 2017b), supporting the idea that high-J CO transitions may be used to infer the presence of X-ray faint or obscured SMBH progenitors in galaxies at . Since J1148 is the unique source where high-J CO lines have been detected so far at high redshift, these results motivated further observations of highly excited CO lines in quasars.
In this work we present ALMA observations of six high-J CO lines and continuum emission in the quasars SDSS J231038.88+185519.7 (hereafter J2310) at and ULAS J131911.29+095951.4 (hereafter J1319) at . We re-analyse the FIR emission and CO SLED of SDSS J1148+5251, and compare the properties of these three quasars. The paper is organised as follows: the two targets are presented in Sec. 2, while ALMA observations are described in Sec. 3. In Sec. 4, we present continuum and CO emission properties of the three quasars. In Sec. 5, we compare our results with local and high- observations. We discuss and summarise our findings in Sec. 6 and Sec. 7, respectively. We adopt the cosmological parameters from Planck Collaboration et al. (2016): H0 = 67.7 km s*-1* Mpc*-1*, = 0.308 and = 0.70, according to which 1″ at corresponds to a proper distance of 5.84 kpc.
2 Targets
2.1 J2310
With a magnitude m, J2310 is one of the brightest quasar in the Sloan Digital Sky Survey. By using the UV lines of C iv and Mg ii, Jiang et al. (2016) and Feruglio et al. (2018) estimate a BH mass M⊙ that is 2.5% of the dynamical mass recently inferred from high-angular ALMA observations of CO(6-5) line (Feruglio et al., 2018). The estimated dynamical and BH masses place J2310 above the local M relation, similarly to most of the quasars studied at these redshifts (Wang et al., 2013; Decarli et al., 2018).
Over the last years J2310 has been also studied extensively in the millimetre bands. FIR line observations of [C ii] at 158m and [O iii] at 88m have been reported by Wang et al. (2013) and Hashimoto et al. (2018), respectively.
2.2 J1319
J1319 was initially discovered in the UKIRT Infrared Deep Sky Survey (UKIDSS) by Mortlock et al. (2009), who measured an optical magnitude of m and identified its redshift from the Ly and Mg ii emission lines. Shao et al. (2017) estimate a black hole mass from the Mg ii line, which contributes 2% of the dynamical mass of the system. The BH-to-dynamical mass ratio is four times larger than the average measured locally (Kormendy & Ho, 2013).
Several millimetre observations have been carried out of this quasar covering the frequency range between 1.4 GHz and 300 GHz, revealing a high far-infrared emission ( L⊙) from the host galaxy (Wang et al., 2011, 2013). The quasar has been also detected in both CO(6-5) and [C ii] at 158m (Wang et al., 2011, 2013).
3 Observations
In ALMA Cycle 2 project 2013.1.00462.S (P.I. S. Gallerani) we proposed high-J CO observations of the quasars J2310 and J1319 that have been already observed in CO(6-5) (Wang et al., 2013; Feruglio et al., 2018). We requested ALMA time to observe the molecular line CO(17-16) at () for J2310, and three high-J CO transitions, CO(14-13) at (), CO(17-16) (), and CO(19-18) at (), for J1319. ALMA band 6 and 7 observations were obtained between January and June 2015, using 34-40 antennas with baselines from 15 m to 700 m. In each observations, one out of the four 1.8 GHz spectral windows was centred at the CO frequency and the other three were used to sample the rest-frame far-infrared (FIR) continuum emission. The spectral channel width was set up in time domain mode with a spectral resolution of 31.250 MHz, corresponding to 20 km s*-1* velocity resolution at the line frequencies. For each CO observations we spent between 13 and 31 minutes on source, reaching a continuum sensitivity of Jy beam*-1* and a spectral sensitivity of 0.35-0.4 mJy beam*-1* per spectral channel.
ALMA visibilities have been calibrated using the CASA software (McMullin et al., 2007). The final continuum images and datacubes have been generated with the CASA task tclean using a natural weighting, which gives the optimum point-source sensitivity in the image plane. Final products have angular resolutions between 0.6″ and 1.5″ depending on the datasets (see Table 1). The uv-coverage of the observations results in a largest angular resolution between (LAS) 1.7″ and 5″ depending on the observed frequencies. Continuum images have been obtained from the line-free channels of the four spectral windows that have been also used in the task uvcontsub task to subtract the continuum emission in the uv-plane. The datacubes have been generated from the continuum-subtracted uv-datasets.
In addition to the observations of our programme, we have searched in the ALMA archive for further public datasets. We have thus used the ALMA observations of the project 2015.1.01265.S (P.I. R. Wang) targeting the CO(8-7) line at () and the CO(9-8) line at () in J2310. The datasets will be presented in a forthcoming paper by Shao et al. (2019) and Li et al. (in prep.). In this work, we present the continuum emissions at 132 GHz and 141 GHz and the two CO lines with their relative luminosities. For J1319, we have benefited from continuum emission at 347 GHz observed in the ALMA project 2012.1.00391.S (P.I. J. Gracia-Carpio). All retrieved observations have been reduced by following the ALMA pipeline released with the datasets and final image have been generated by adopting a natural weight scheme.
In addition to the ALMA data we have collected from the literature all sub/millimetre measurements associated to these two quasars as well as to J1148 (see Table 1 and 2).
4 Results
4.1 Continuum emission
The continuum emission is detected with high level of significance () in all ALMA datasets for both quasars (left panels of Figure 1 and 2). The ALMA coordinates of the two sources are RA=23:10:38.8994 DEC= +18.55.19.83716 (J2310) and RA=13:19:11.2879 DEC= +09.50.51.526 (J1319) and are in agreement with those reported by previous works (Wang et al., 2013; Shao et al., 2017; Feruglio et al., 2018). The centre coordinates of the continuum emission of both sources are consistent with those estimated from the infrared Y-band images of Hubble Space Telescope, once the astrometry of the two observations has been aligned.
We analyse the continuum emission directly in the Fourier plane (hereafter uv-plane) by fitting the interferometric visibilities. We adopt a Sérsic radial profile (with fixed index ) as a model for the continuum brightness and we assume axisymmetry to produce a 2D model image. We use the publicly available GALARIO package (Tazzari et al., 2018) to compute the visibilities of the model image by sampling its Fourier transform in the same (u,v) points sampled by ALMA. The free parameters are the total flux density , the half-light radius , the position angle (P.A., rotation on the plane of sky, defined East of North), the ellipticity (or disc inclination along the line of sight) and the (R.A., Dec) offsets on sky w.r.t. the observations’ phase centre. Since the (R.A., Dec) are nuisance parameters, in the results we present here we marginalise over them. We perform the fit in a Bayesian framework, exploring the parameter space using the Markov Chain Monte Carlo (MCMC) algorithm implemented in the emcee package (Foreman-Mackey et al., 2013). We assume uniform priors on the free parameters and a a Gaussian likelihood where , with and being the model and the observed visibilities and the weight associated to the -th visibility point. We use the GPU-accelerated GALARIO to compute from the model image determined by the free parameter values.
An example of the fit result for J2310(J1319) is given in Figure 3(7), where we compare the model and the observed visibilities (real and imaginary part) as a function of the deprojected baseline (uv-distance). The drop in the real part of the visibilities with the uv-distance indicates that the continuum emission is spatially resolved in the current ALMA dataset. The Figure also shows that the observed continuum profile well matches the radial exponential model. We report the best-fit results of both the datasets in Table 1. More details on the fit procedure using GALARIO are given in Appendix A. We note that the results obtained with the visibility modelling are consistent with the flux densities and de-convolved size estimate measured both in the image plane by using the CASA task imfit and in the uv-plane by using the CASA task uvmodelfit.
By combining all measurements from this work and literature, we infer an half light radius of for J2310 and of of for J1319. This indicates that at least 50% of the dust mass is hosted in a compact region of radius kpc.
4.2 FIR luminosities
We estimate the FIR luminosities and dust masses of the two quasars by combining our continuum data with previous ALMA, PdBI, Max-Planck-Millimeter-Bolometer (MAMBO) and Very-Large-Telescope (VLA) observations (Wang et al., 2011, 2013; Feruglio et al., 2018; Hashimoto et al., 2018), whose continuum flux densities are reported in Table 1.
The spectral-energy-distribution (SED) of dust emission can be represented with a modified black-body function, which is also dubbed grey-body law, given by:
[TABLE]
where is the flux density measured at the observed frequency , is the solid angle subtended by the galaxy111 The solid angle can be also written as where and are the surface area and luminosity distance of the galaxy, respectively., is the black-body emission at the dust temperature , and is the dust optical depth. The optical depth can be expressed in the form
[TABLE]
where and are the surface mass density of dust and dust opacity (Draine & Lee, 1984), respectively. The can be expressed in term of total dust mass () and the physical area of the galaxy (): = (da Cunha et al., 2013); the dust opacity depends on the emissivity index , mass absorption coefficient k0 and . The latter two terms, k0 and , are usually assumed from either observations (e.g. Alton et al. 2004; Beelen et al. 2006) or dust models (e.g. Bianchi & Schneider 2007). In this work we assume kν = 0.45/250 GHz)β cm2 g*-1* (Beelen et al., 2006).
In equation 1 we must also consider the contribution of the CMB emission since, at , the CMB temperature may be comparable (or even higher) to that of dust, thus affecting observations and measurements. An extensive discussion about the CMB effect on the dust emission has been already presented by da Cunha et al. (2013); in this section we only provide a quick review of their main results.
In addition to the galaxy radiation, CMB photons contribute to increase the dust temperature and boost the observed dust emission. The effect on the dust temperature is:
[TABLE]
where is the CMB temperature at , i.e. = 2.73 K (Fixsen et al., 1996). On the other hand, the CMB emission at high- is a strong background against which the dust continuum emission is observed, thus reducing its detectability. The observed SED shape of dust emission can thus be expressed as:
[TABLE]
where is given by equation 3 and (TCMB(z)) is the black-body emission of CMB at the temperature (z)= T.
We use equation 4 to fit the flux continuum densities measured in J2310 and J1319. We estimate the solid angle subtended by each galaxy from the continuum emission size inferred in Section 4.1. and then explore the three free parameters, , , and , by using a MCMC algorithm to estimate the posterior probability distribution for the 3-dimensional parameter space that defines our SED model. We employ uniform distributions for the priors, but we force and since these are the typical ranges observed in star-forming galaxies and quasars (Beelen et al., 2006).
Figure 4 shows the results of the SED model fitting, Table 2 reports the best-fitting results, and Figure 5 shows the confidence contours for the three free parameters obtained from a MCMC with 50 chains and 3000 trials. While the dust masses are well pinned down in both sources with errors smaller than 20%, the emissivity index and dust temperature are constrained only in J2310, where the ALMA band-8 observations are present. We note that our best-fitting values for J2310 and J1319 are higher than the dust temperatures ( K) inferred in previous works (Wang et al., 2013; Shao et al., 2019). This discrepancy can be explained by the different assumptions adopted on the dust opacity when modelling the SED. Indeed, previous works have assumed an optically thin () modified blackbody profile to fit the continuum observations. Here, we are instead also considering dust emission attenuation. In fact, the dust masses and continuum sizes of our AGN host galaxies provide at GHz, thus making the optically thin approximation not valid at higher frequencies. For comparison in Appendix B we report the best-fitting results in the optical thin assumptions, which are in agreement with those reported by previous studies (Wang et al., 2013; Shao et al., 2019).
The shadowed red and blue regions in Figure 4 give an indication of the and degeneration associated to the best-fitting models. While the shaded regions shrink at lower frequencies ( GHz), the uncertainties enlarge close to the peak of the curve. This indicates that high frequency observations, as that in band 8 for J2319, are fundamental to constrain the properties of the dust in the distant Universe. Observations in ALMA band 8, 9 and 10, which are the highest frequency bands in the baseline ALMA project, are thus crucial to compute the dust temperature in the first billion years of the Universe.
We perform the SED fitting of J1148 as well by using the same assumptions made for the other two quasars and taking into account the CMB contribution. We retrieve from the literature all flux continuum densities (Bertoldi et al., 2003a; Walter et al., 2003; Riechers et al., 2009; Cicone et al., 2015) at the wavelength m where the emission is powered mainly by star-formation activity in the host galaxy and the contribution from the AGN is negligible (Leipski et al., 2013). Given the presence of a serendipity source at 10.5″, we give less weight to those continuum measurements of J1148 that may be contaminated by the emission of a serendipity source (Cicone et al., 2015). The results of the Bayesian fit is reported in Figure 4, Figure 5, and Table 2.
We estimate the FIR luminosities by integrating the best-fit models from 8 m to 1000 m rest-frame for the three quasars. Despite the comparable FIR luminosities ( L⊙), from the SED fitting it results that the dust temperature of J1148 is 2 higher than that inferred for J2310, possibly due to a stronger radiation field in the former. For all quasars we turn the FIR luminosities into SFR by using the relations from Kennicutt & Evans (2012). All quasars have SFR M⊙ yr*-1*(see Table 3).
4.3 High-J CO emission
4.3.1 CO measurements in J2310
While the continuum emission is detected in all ALMA datasets of J2310, the detection of CO lines is limited only to the two lower transitions, CO(8-7) and CO(9-8) (Figure 1; see also Li et al. in prep.). Both CO lines have a line width of 380 km and a beam-deconvolved size of ( kpc at ). We measure integrated flux densities of Jy km s*-1* for CO(8-7) and Jy km s*-1* for CO(9-8) that correspond to a luminosity of L⊙ and L⊙, respectively (Table 2).
The flux map of the CO(17-16) emission, which has been obtained by integrating the datacube within 200 km from the expected frequency of the CO line, shows a marginal detection of at the location of the quasar. To be conservative we estimate a upper limit on its flux density in an aperture of 222Current ALMA observations of J2310 and J1319 have different angular resolutions. To compare the CO upper limits, the flux densities have been estimated from the same size aperture as large as the ALMA beam of the poorest angular resolution dataset ()., yielding L⊙.
4.3.2 CO measurements in J1319
At the location of the quasar J1319 all three ALMA observations do not reveal any signature of CO emission. The right panels of Figure 2 show the flux maps obtained by collapsing the datacubes over a channel width of 500 km s*-1* that is comparable to the line widths observed in the CO(6-5) and [C ii] lines (Wang et al., 2013; Shao et al., 2017). In Table 2 we report the upper limit, measured in an aperture size as large as , on each CO transition analysed in this work.
5 CO SLED
In this section, we compute the CO SLED resulting from the ALMA data presented in this work and from the other CO measurements in literature. We then compare our findings with the CO SLEDs observed in low- starburst galaxies and AGN, and the CO SLEDs measured in other quasars.
5.1 CO(6-5)-normalised CO SLED
In the left panel of Fig. 6, we show the CO SLED (normalised to the CO(6-5) line) of J2310, J1319, J1148 (Bertoldi et al., 2003b; Riechers et al., 2009; Gallerani et al., 2014; Stefan et al., 2015), and the three quasars by Venemans et al. (2017b). The blue and red shaded regions represent the averaged CO(6-5)-normalised CO SLEDs from low- starburst galaxies and AGN, respectively (Table 5, Rosenberg et al., 2015; Mashian et al., 2015; Mingozzi et al., 2018). Despite the large uncertainties, the CO SLED of the AGN population is characterised by a slightly different shape with respect to the one of starburst galaxies. At high-J ( ) the starburst CO SLED is less excited and the CO emission steadily declines at , while the AGN CO SLED seems to reach the peak at and declines afterwards.
The CO luminosities and upper limits measured for J2310 and J1319 are consistent with both AGN and starburst CO SLEDs. Although the LCO(8-7)/LCO(6-5) and LCO(9-8)/ LCO(6-5) ratios measured in J2310 are slightly higher relative to the typical ratios observed in starburst galaxies, they are still consistent (within ) with the CO SLED shape of both populations (AGN and starburst galaxies). The same is true for the three quasars by Venemans et al. (2017b) that have , consistently with low- observations.
For what concerns J1148, at lower (), the CO(6-5)-normalised SLED is also similar to that observed in local AGN and starburst populations. However this quasar is characterised by an exceptionally strong CO(17-16) emission line that is larger than the averaged CO SLED of both populations. The CO ratio is also higher than the upper limits on the CO(17-16)/CO(6-5) ratios estimated for J2310 and J1319.
We further discuss the origin of the discrepancy between J1148 and other quasars in Sec. 6. Here, we mention that the CO(17-16) emission detected in J1148 may be contaminated by the presence of several flanking OH*+* lines falling within few hundreds of the CO line. These lines have been observed in local nearby AGN host galaxies (Hailey-Dunsheath et al., 2012; González-Alfonso et al., 2013) and seem to be more luminous in presence of fast outflowing gas and XDRs (González-Alfonso et al., 2013, 2018). By fitting with a double Gaussian profile the emission detected in J1148, Gallerani et al. (2014) estimate that of the measured luminosity can be contaminated by OH*+* line emission. We thus perform, both in J2310 and J1319, a blind line search (see Carniani et al., 2017b, a, for details) to look for possible OH*+*+CO emissions at the location and redshift of the two quasars, but we do not find any emission with an intensity .
To interpret the results found in J2310 we have repeated the analysis done in Gallerani et al. 2014 by adopting the PDR/XDR models by Meijerink & Spaans 2005 and Meijerink et al. 2007. The same analysis is hampered in J1319 given that, in this source, only the CO(6-5) line has been detected. We found that a PDR model alone can fairly explain the intensity of the CO lines observed in J2310. In particular, our analysis suggests that the molecular gas of this source is characterized by a density , irradiated by a FUV flux (in Habing units of ). No information on XDR can be inferred from our J2310 observations: this is expected, since the effect of X-ray photons on the molecular gas excitation can be disentangled from the one due to FUV photons only if CO lines with {\rm J_{\rm up}}$$>10 are available (e.g Schleicher et al., 2010).
5.2 -normalised CO SLED
Tight LCO-LFIR correlations have been found over several orders of magnitude from low- to high-J CO lines ( ; Greve et al., 2014; Liu et al., 2015; Kamenetzky et al., 2016; Lu et al., 2017) suggesting the average CO gas excitation conditions are mainly associated with star-formation activity, while AGN seem to have negligible impact on the CO SLED shape, at least for . We therefore investigate the CO excitation conditions in our quasars by normalising their CO SLED to the FIR luminosity and by comparing the results with star-forming galaxies and AGN hosts (Kamenetzky et al., 2016). The right panel of Fig. 6 shows the FIR-normalised CO SLED for J2310, J1319, J1148, the three quasars by Venemans et al. (2017b), and for local starbursts and AGN host galaxies.
We find that the LCO/LFIR ratios of the three quasars are consistent, within the uncertainties, with the the FIR-normalised SLEDs observed locally, suggesting that the CO emission with are powered by the star-formation activity in the host galaxies. A similar conclusion has been stated by Venemans et al. (2017b) for their three quasars at . By combining CO, [C ii], and [C i] observations, Venemans et al. (2017b) conclude that CO emission in their three quasars predominantly arises in PDR regions heated by young stars, and exclude substantial contribution from XDRs.
From the right panel of Fig. 6, we also note that the CO/LFIR ratios, up to , of both J1319 and J1148 are below the line ratios observed in J2310 and in the other high- quasars despite their comparable FIR luminosities. Such a discrepancy could indicate the heterogeneous properties of PDRs regions among these high- quasars. Indeed the intensity of the CO line depends on the metallicity, gas temperature, molecular density, and radiation field strength (e.g. Uzgil et al., 2016; Vallini et al., 2018). In addition low CO-to-FIR line ratios can be also explained by an over-estimation of the FIR luminosity. Both AGN emission in the rest-frame mid-IR wavelengths (8 m and 40 m) and the presence of PAH features could affect the FIR luminosity estimates (e.g. Greve et al., 2014). In J1148 the AGN contamination at µm ( GHz) is highly uncertain and may vary between 20% and 70% (Leipski et al., 2013; Schneider et al., 2015). The AGN contamination may explain the magnitude of the CO/LFIR discrepancy. A deficiency in the molecular gas content could also explain the low CO-to-FIR line with respect to J2310. As also observed in other lower- quasars characterised by extended ionised outflows (Carniani et al., 2015, 2017b; Brusa et al., 2018), where a substantial gas fraction has been is removed from the host galaxy by AGN winds. In the case of J1148 this scenario is supported by the detection of broad wings in the [C ii] line profile, suggesting the presence of fast outflowing gas in the host galaxy (Maiolino et al., 2012; Cicone et al., 2015). In particular, Cicone et al. (2015) found that J1148 hosts a powerful outflows with a mass outflow rate M⊙ yr*-1* large enough to clear out all the gas content of the galaxy in less than Myr. We further note that, for this quasar, Stefan et al. (2015) infer a molecular gas mass from the CO(2-1) emission of M⊙ that is smaller than that measured in J2310 ( M⊙ Shao et al., 2019). Given the high dust mass of J1319 (Table 2), we exclude that the outflow scenario would explain the low CO-to-FIR line ratios in this quasar.
6 Discussion
The nature of the discrepancy between the high CO(17-16) line luminosity observed in J1148 and local sources/high- quasars is unclear, both because of the complexity of the physical processes involved in the molecular gas excitation and the paucity of observational data. From the theoretical point of view, the emergence of bright high-J ( 13) CO lines can be associated both to extreme star formation, and AGN activity, and shocks induced by merging/outflows/SN-driven winds. In Table 3, we report the properties of J2310, J1319, and J1148 that are more relevant in this context.
- •
Star formation: The properties of J1148, J2310, and J1310 are quite similar in terms of FIR emission (Figure 4). Assuming that dust heating is dominated by stars, the resulting SFRs among the three quasars are comparable (Table 2). If high-J CO lines are predominantly excited by star-formation activity, we should have observed in J2310 and J1319 CO(17-16) lines as luminous as in J1148.
- •
AGN activity: Strong high- CO lines can be excited in X-ray dominated regions (Meijerink et al., 2007; Spaans & Meijerink, 2008; van der Werf et al., 2010; Schleicher et al., 2010). Given the similarity among black hole masses (M M⊙) and AGN luminosities () of the three quasars, we do not expect their X-ray luminosities to differ much. However, we cannot exclude that the high luminosity of the CO(17-16) detected in J1148 can be associated with its X-ray radiation (Gallerani et al., 2014). This interpretation is favoured by the fact that the X-ray luminosity ( erg/s) of J1148 is higher than that of J2310 ( erg/s; Fabio Vito, private communication, Vito et al. in prep.) suggesting the presence of a stronger X-ray radiation in J1148.
- •
Shocks: High temperatures associated with shock dominated regions can also be responsible for boosting the luminosity of high- CO lines (Panuzzo et al., 2010; Hailey-Dunsheath et al., 2012; Meijerink et al., 2013). In this context, it is remarkable that, while J1148 exhibits a massive, powerful outflow with a mass outflow rate M⊙ yr*-1* (Maiolino et al., 2012; Cicone et al., 2015), in the other sources no such strong outflows have been found (Carniani et al. in preparation). High resolution numerical simulations show that AGN feedback can trigger outflows as powerful as the one revealed in J1148 (Barai et al., 2018) and shock heat large quantity of gas to the high temperatures required for the excitation of high-J CO lines (Costa et al., 2014; Costa et al., 2015; Costa et al., 2018; Barai et al., 2018). Nevertheless, these simulations lack both the chemistry of molecular hydrogen (e.g., Pallottini et al., 2017a, b) and radiative transfer of X-ray photons (e.g., Kakiichi et al., 2017), thus hampering a realistic comparison with observations.
To summarise, our analysis disfavours a scenario in which the high CO(17-16) luminosity observed in J1148 is driven by photodissociation regions, even accounting for the possible contamination by OH*+* emission. In the case of CO SLEDs excited by star formation, even in the case of high SFRs, the CO(6-5)- and FIR-normalised CO SLEDs are expected to decreases at high-J with a peak at , as observed in the low- starburst sample and in J2310. Other mechanism associated with AGN (X-ray dominated regions, AGN-driven outflows) are more likely responsible for the excitation of high-J transitions.
However, the lack of CO(17-16) detections in J2310 and J1319 suggests that AGN activity is not always associated with strong high-J CO lines.
7 Conclusions
We have presented ALMA observations of dust continuum and molecular CO line emission in two quasars at , J1319 and J2310. We have also retrieved the CO and dust measurements for J1148 in order to compare the properties of these three quasars and understand the origin of their CO emission. Our main findings are:
By fitting the continuum emission directly in the uv-plane, we have found that the bulk of dust emission arises from a compact ( kpc) region of the host galaxies. We have estimated a half-light radius of for J2310 and for J1319. 2. 2.
We have performed a SED fitting on our two quasars as well as on J1148 using millimetre observations from literature and from this work and taking into account the impact of CMB on dust emission at high redshift. The dust properties, such as FIR luminosity, dust mass, temperature and emissivity index, of the J2310 and J1148 have been estimated with an uncertainties lower than 20% (Table 2). The lack of high frequency ( GHz) observations for J1319 have led to large uncertainties on dust temperature, which spans over a range . With a SFR M⊙ yr*-1* and L L⊙, the host galaxies of the analysed quasars are in a starburst phase of their evolution. 3. 3.
In addition to the dust continuum emission we have discussed the observations of CO(9-8), CO(8-7), and CO(17-16) for J2310, in which we have found a clear detection only for the first two lines. For what concerns J1319, we have presented ALMA observations of the CO(14-13), CO(17-16), and CO(19-18) lines and reported no detection in all the CO transitions observed. 4. 4.
We have computed the CO SLEDs normalised to the CO(6-5) line and FIR luminosity for J2310, J1319, and J1148 and compared our results both with local starburst galaxies and AGN, and with other quasars. For {\rm J_{\rm up}}$$<9, the CO(6-5)- and FIR-normalised CO SLEDs of quasars are consistent with low- sources. However we note that the CO/FIR ratios of J1319 and J1148 are 2 times lower than those measured in J2310. This discrepancy could indicate heterogeneous ISM properties among high- quasars. We have also suggested that the difference of LCO/LFIR between J2310 and J1148 can be explained by either a FIR AGN contamination or a lower molecular gas content in J1148. Latter scenario is supported by the presence of fast outflowing gas that can remove molecular gas from the host galaxies of these quasars. 5. 5.
The upper limits on the CO(17-16) transitions for J2310 and J1319 are consistent with those observed in local AGN and starburst galaxies; vice-versa the upper limits on the CO(17-16)/CO(6-5) ratio measured in these sources is 1 lower than that measured in J1148. Mechanisms associated with AGN (X-ray dominated regions, AGN-driven outflows) are likely responsible for the excitation of this high-J CO transition and for the higher CO(17-16) luminosity measured in J1148.
In summary the no detection of high-J ( ) CO transitions in the quasars J2310 and J1319 reveals that AGN activity is not always associated with luminous () highly excited CO emission lines. The detection of lines in quasars, complemented by X-ray observations and supported by dedicated high resolution numerical simulations (including AGN-driven feedback, molecular hydrogen chemistry, radiative transfer of X-ray photons), represent the best strategy to progress in the field and provide the optimal chances to understand the processes responsible for molecular gas excitation.
Acknowledgements
This paper makes use of the following ALMA data: ADS/JAO.ALMA#2013.1.00462.S, ADS/JAO.ALMA#2015.1.01265.S, ADS/JAO.ALMA#2012.1.00391.S. ALMA is a partnership of ESO (representing its member states), NSF (USA) and NINS (Japan), together with NRC (Canada), MOST and ASIAA (Taiwan), and KASI (Republic of Korea), in cooperation with the Republic of Chile. The Joint ALMA Observatory is operated by ESO, AUI/NRAO and NAOJ. A.F. and S.C acknowledge support from the ERC Advanced Grant INTERSTELLAR H2020/740120. This work reflects only the authors’ view and the European Research Commission is not responsible for information it contains. LV acknowledges funding from the European Union’s Horizon 2020 research and innovation program under the Marie Skłodowska-Curie Grant agreement No. 746119. M.T. has been supported by the DISCSIM project, grant agreement 341137 funded by the European Research Council under ERC-2013-ADG. RM acknowledges support from the ERC Advanced Grant 695671 ‘QUENCH’ and from the Science and Technology Facilities Council (STFC). CC and CF acknowledge support from the European Union Horizon 2020 research and innovation programme under the Marie Skłodowska-Curie grant agreement No 664931.
We are grateful to the anonymous referee for her/his comments. We finally acknowledge the contribution of Paolo Comaschi to the present work.
Appendix A Visibility analysis
In Section 4.1 we presented the analysis of the continuum emission. Here we report more details of the fit procedure.
To perform the fits we follow the quick start example reported in the documentation of GALARIO333https://mtazzari.github.io/galario/quickstart.html:
we extract the channel-averaged continuum visibilities from the ALMA Measurement set using the function export_uvtable included in the the publicly available uvplot package444https://github.com/mtazzari/uvplot. 2. 2.
we define our brightness model as the Sersic profile:
[TABLE]
where is the effective (half-light) radius, is the surface brightness at , and is such that and we fix the index (i.e. exponential profile). We compute the brightness profile on a radial grid ranging from to , with spacing . 3. 3.
we define the parameter ranges explored by the 40 walkers in the MCMC ensemble sampler. We use log-uniform priors for and , , and uniform priors for the other free parameters, , .
After the MCMC chain has converged, we assess the goodness of the fit by comparing the best-fitting model and the observations, directly in the plane of the measurements. An immediate way of checking whether a model fits the interferometric data is to produce a so called uv-plot, namely the azimuthal average of the visibilities as a function of deprojected baseline (uv-distance). Figure 3 in Section 4.1 and 7 here show the uvplot comparing the best-fitting models and the observed visibilities of J2310 and J1319.
Although the complex visibilities are defined on the uv-plane , it is often convenient to represent them in bins of deprojected uv-distance . It is worth noting that the fit performed with GALARIO allowed us to fit each single observed visibility point by computing the corresponding of a given model image; the azimuthally averaged view of the bestfit model and of the data given in the uv-plot serves as a benchmark of the goodness of the fit and is inevitably showing less data than it was actually used for the fit.
To produce the uv-plot we used the uvplot package following the instructions in the GALARIO quick start example (see link in the footnotes). To deproject the visibilities we assume inclination and position angle inferred from the fit.
Another way to assess the goodness of the fit is to produce synthesised images of the residual visibilities, namely to compute for the bestfit model and then obtaining the CLEANed image corresponding to . Figures 8 and 9 show the synthesised images of the model and of the residual visibilities. In both cases, the extremely low levels of the residuals (within the 3 noise levels) indicate that the models closely match the measurements.
Appendix B Optically-thin assumption for dust SED model
In the optically-thin assumption () equation 4 can be rewritten as:
[TABLE]
Similarly to the analysis performed in Section 4.2 we assume and fit the continuum measurements of the three AGN host galaxies. The best-fitting results (Table 41), which have been obtained from a MCMC analysis, are in agreement with those from previous studies (Wang et al., 2013; Leipski et al., 2013; Shao et al., 2019).
By comparing the results obtained from equation 4, in which dust opacity is accounted for, and those from the optical thin model (equation 6), we note that while the dust mass and emissivity index measurements are consistent within 3, the best-fitting dust temperature values strongly depend on the dust opacity assumptions.
Appendix C Local CO SLEDs
Table 5 shows the list of local AGN and starbursts galaxies that have been adopted to obtain the average local CO SLEDs. The intensity of CO lines of each galaxy are reported by Rosenberg et al. (2015), Mashian et al. (2015), and Mingozzi et al. (2018).
The reference list from the paper itself. Each links out to its DOI / PubMed record.
- 1Alton et al. (2004) Alton P. B., Xilouris E. M., Misiriotis A., Dasyra K. M., Dumke M., 2004, A&A , 425, 109 · doi ↗
- 2Aravena et al. (2016) Aravena M., et al., 2016, MNRAS , 457, 4406 · doi ↗
- 3Bañados et al. (2016) Bañados E., et al., 2016, Ap JS , 227, 11 · doi ↗
- 4Bañados et al. (2018) Bañados E., et al., 2018, Nature , 553, 473 · doi ↗
- 5Barai et al. (2018) Barai P., Gallerani S., Pallottini A., Ferrara A., Marconi A., Cicone C., Maiolino R., Carniani S., 2018, MNRAS , 473, 4003 · doi ↗
- 6Beelen et al. (2006) Beelen A., Cox P., Benford D. J., Dowell C. D., Kovács A., Bertoldi F., Omont A., Carilli C. L., 2006, Ap J , 642, 694 · doi ↗
- 7Bertoldi et al. (2003 a) Bertoldi F., Carilli C. L., Cox P., Fan X., Strauss M. A., Beelen A., Omont A., Zylka R., 2003 a, A&A , 406, L 55 · doi ↗
- 8Bertoldi et al. (2003 b) Bertoldi F., et al., 2003 b, A&A , 409, L 47 · doi ↗