A morphospace of functional configuration to assess configural breadth based on brain functional networks
Duy Duong-Tran, Kausar Abbas, Enrico Amico, Bernat Corominas-Murtra,, Mario Dzemidzic, David Kareken, Mario Ventresca, Joaqu\'in Go\~ni

TL;DR
This paper introduces a novel 2D morphospace framework using new metrics to quantify and differentiate brain network reconfigurations across tasks, predicting cognitive and behavioral measures.
Contribution
It proposes a mesoscopic framework with two novel metrics, Trapping Efficiency and Exit Entropy, to quantify brain network reconfigurations and relate them to cognitive functions.
Findings
Metrics differentiate functional networks, tasks, and subjects.
Network configural breadth predicts cognitive and behavioral measures.
Framework captures brain state transitions and individual differences.
Abstract
The best approach to quantify human brain functional reconfigurations in response to varying cognitive demands remains an unresolved topic in network neuroscience. We propose that such functional reconfigurations may be categorized into three different types: i) Network Configural Breadth, ii) Task-to-Task transitional reconfiguration, and iii) Within-Task reconfiguration. In order to quantify these reconfigurations, we propose a mesoscopic framework focused on functional networks (FNs) or communities. To do so, we introduce a 2D network morphospace that relies on two novel mesoscopic metrics, Trapping Efficiency (TE) and Exit Entropy (EE), which capture topology and integration of information within and between a reference set of FNs. In this study, we use this framework to quantify the Network Configural Breadth across different tasks. We show that the metrics defining this…
Click any figure to enlarge with its caption.
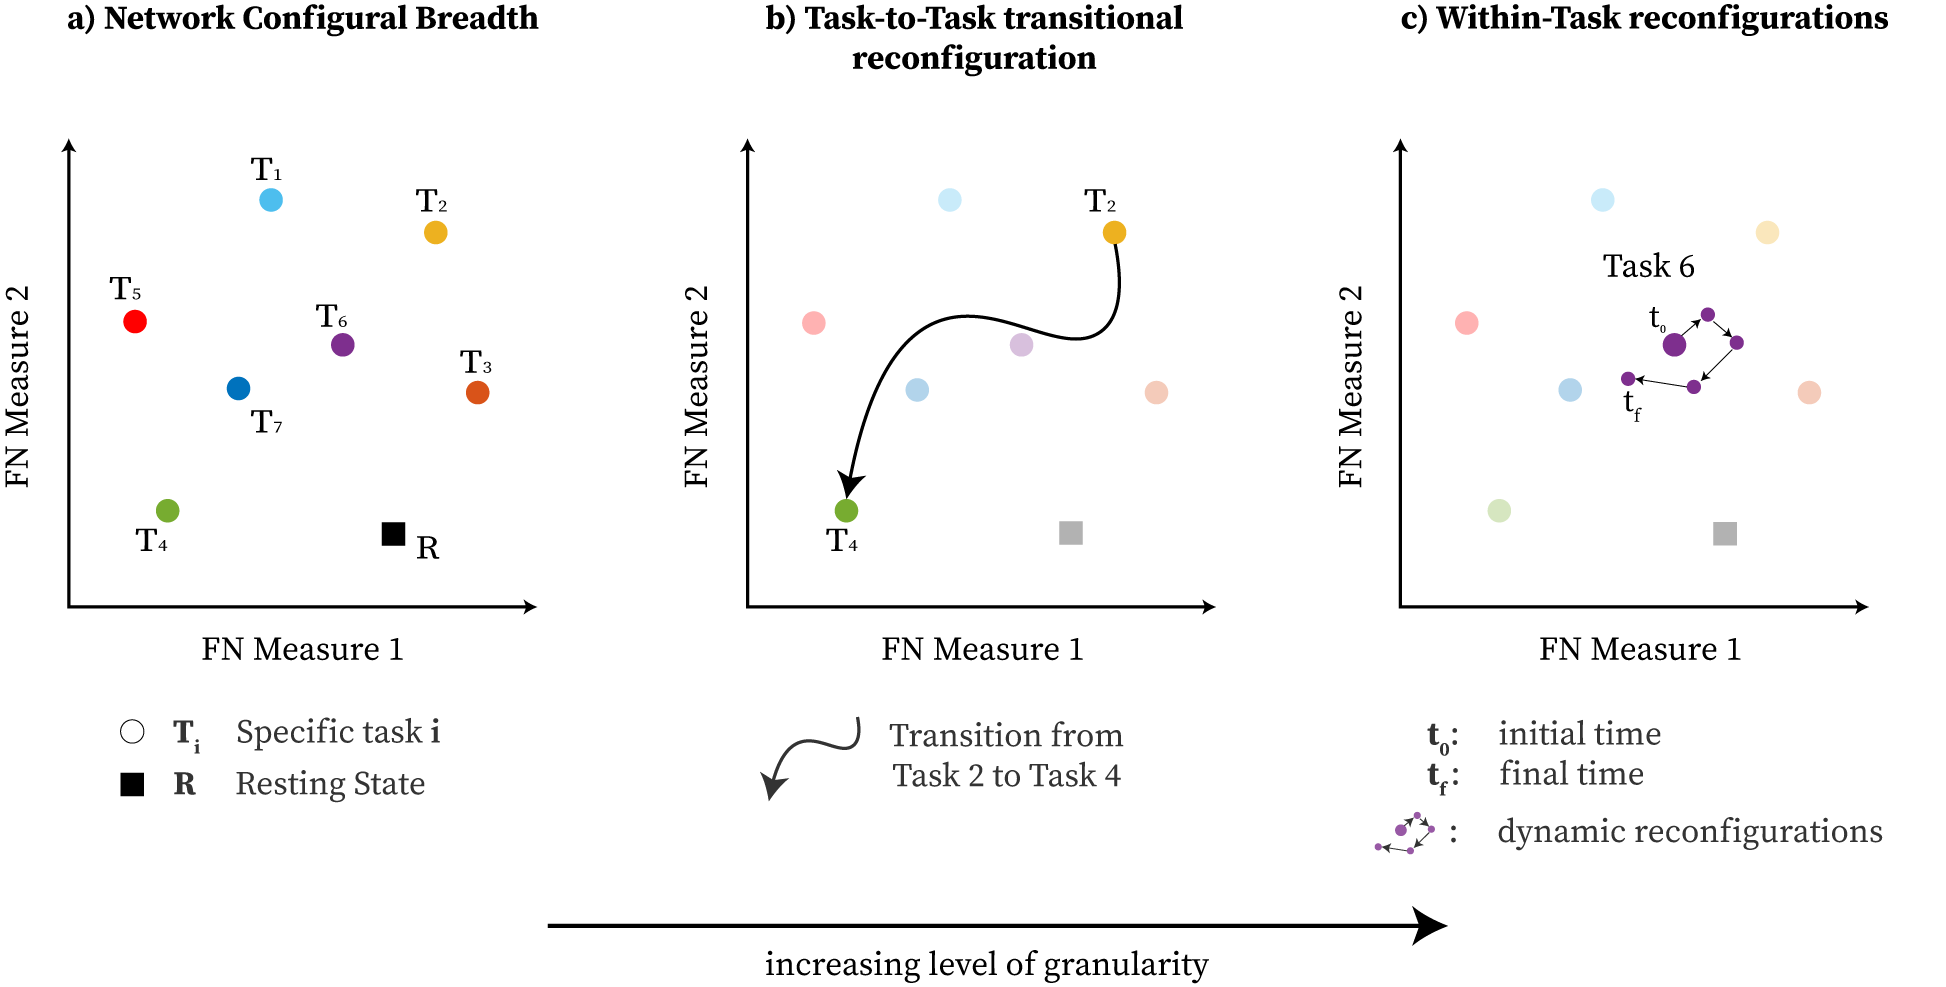 Figure 1
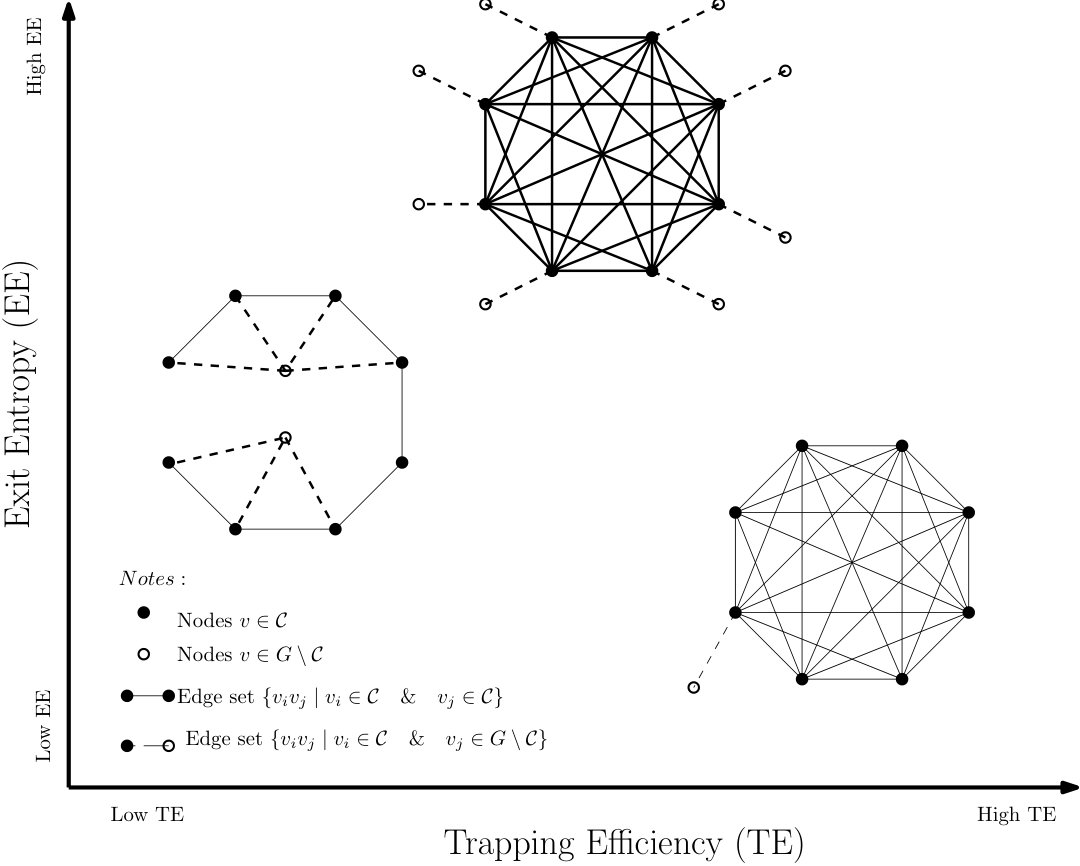 Figure 2
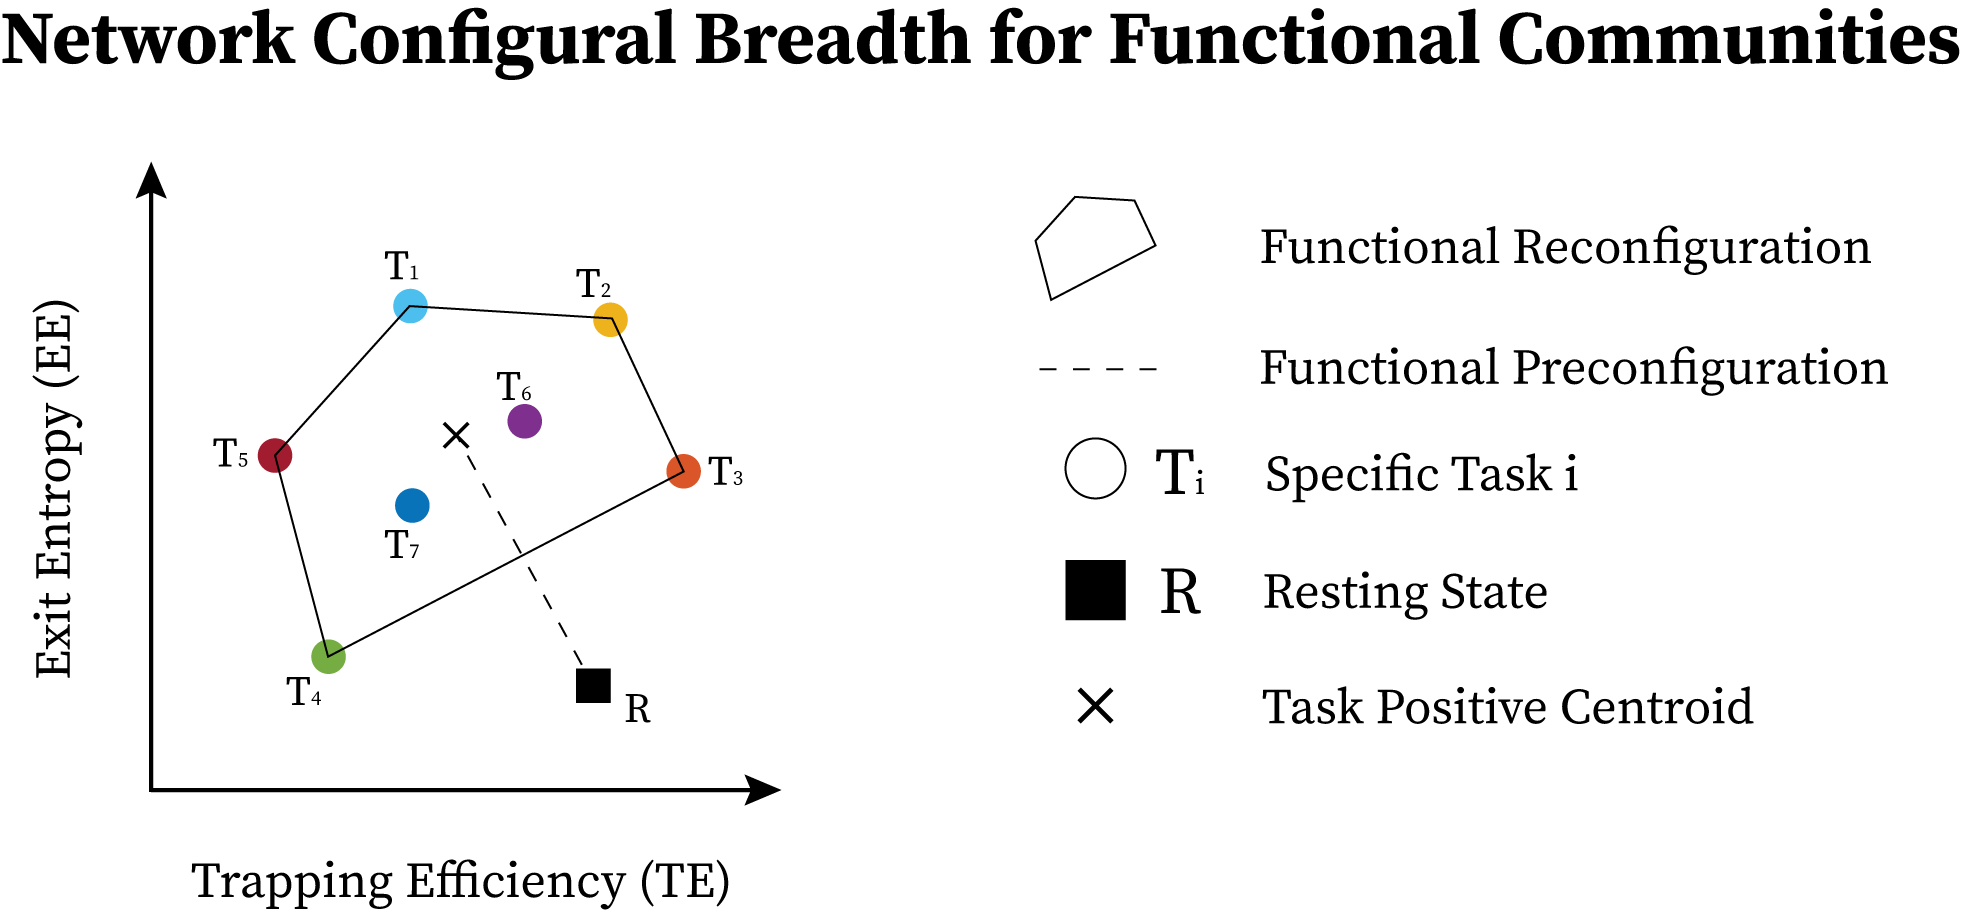 Figure 3
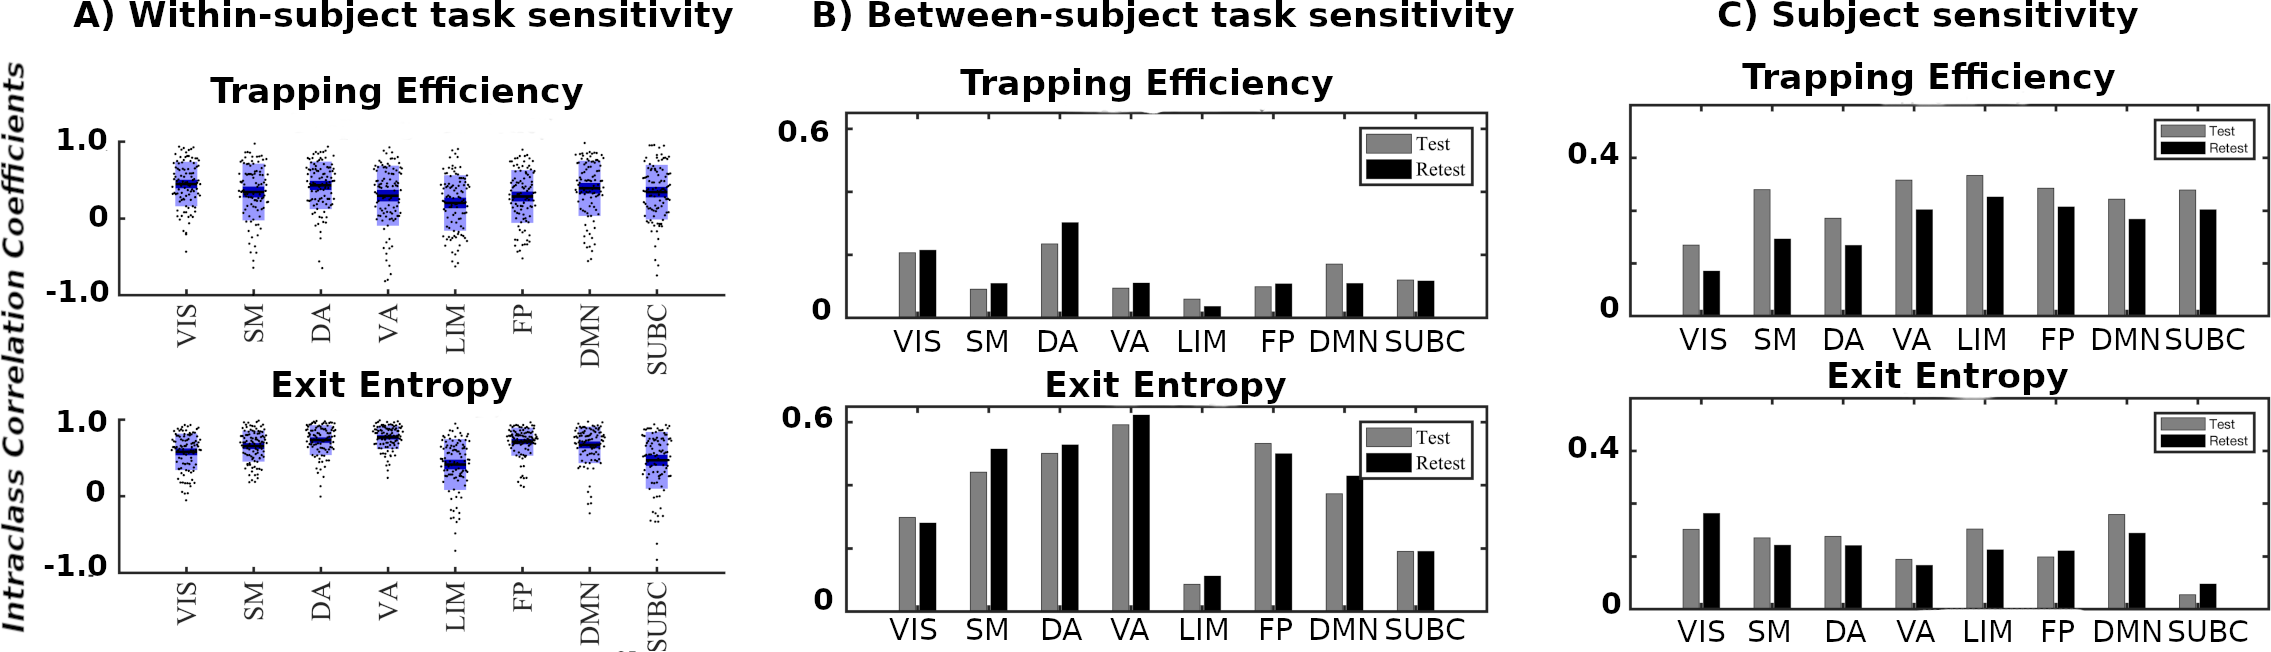 Figure 4
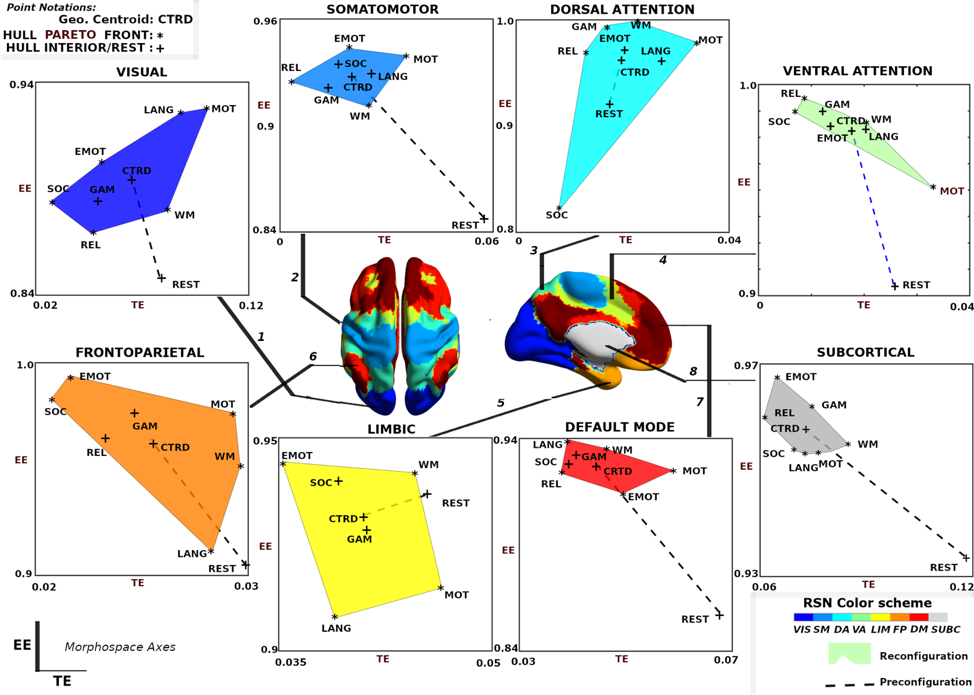 Figure 5
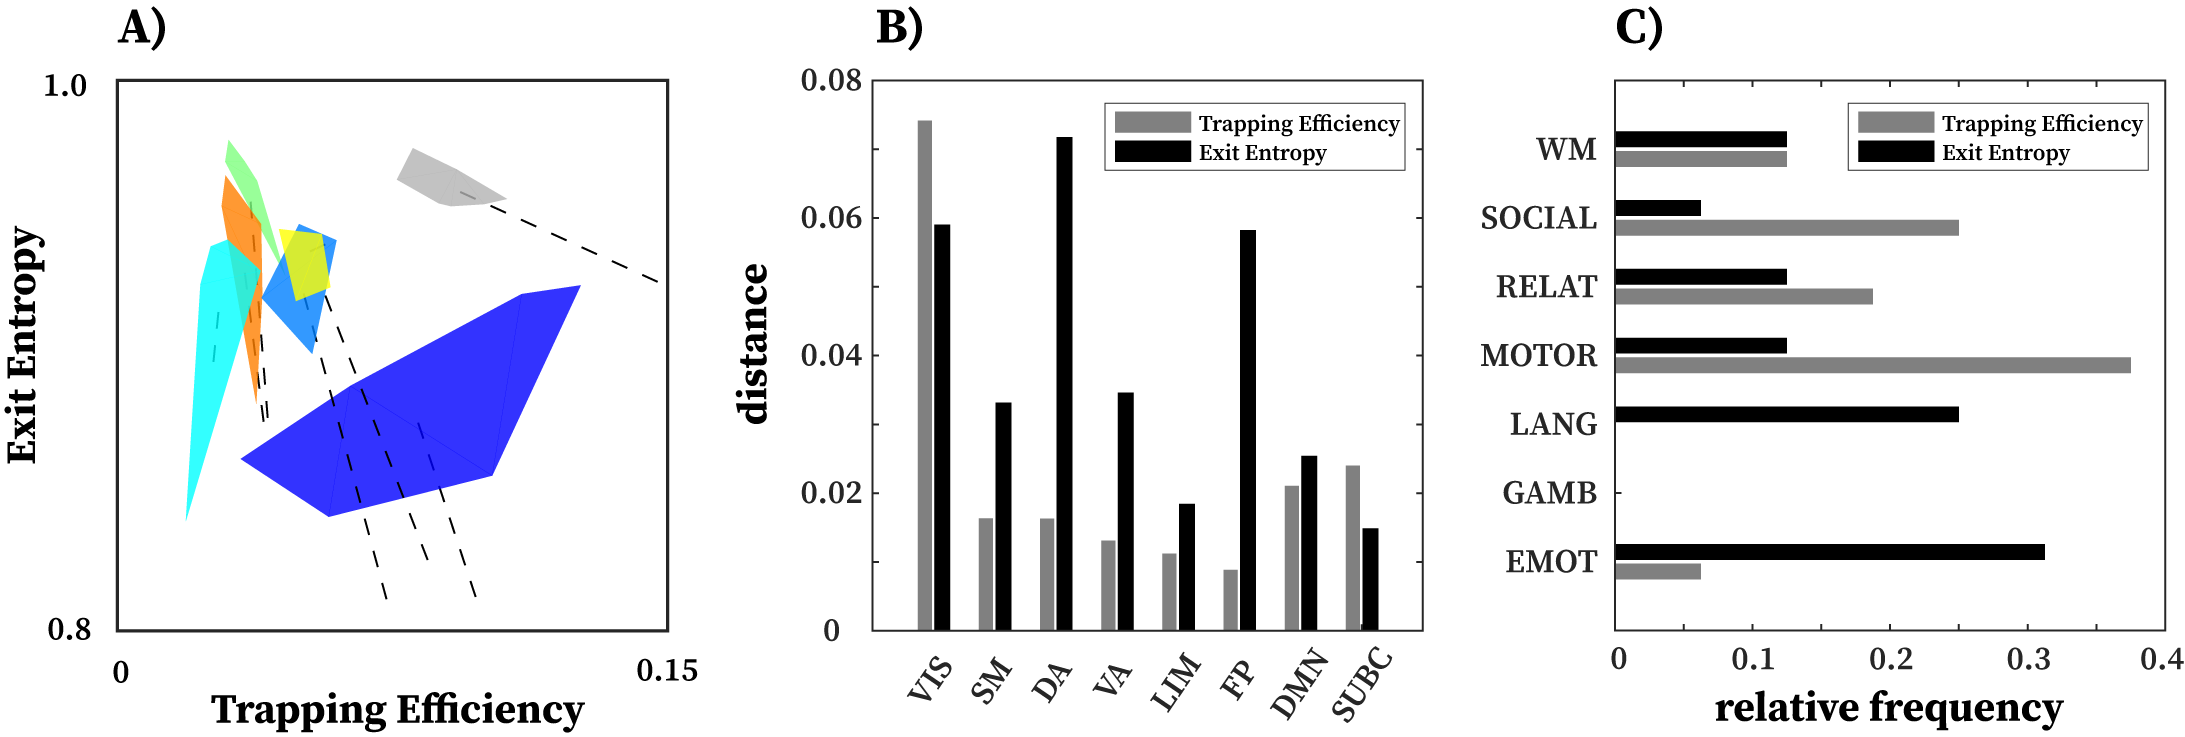 Figure 6
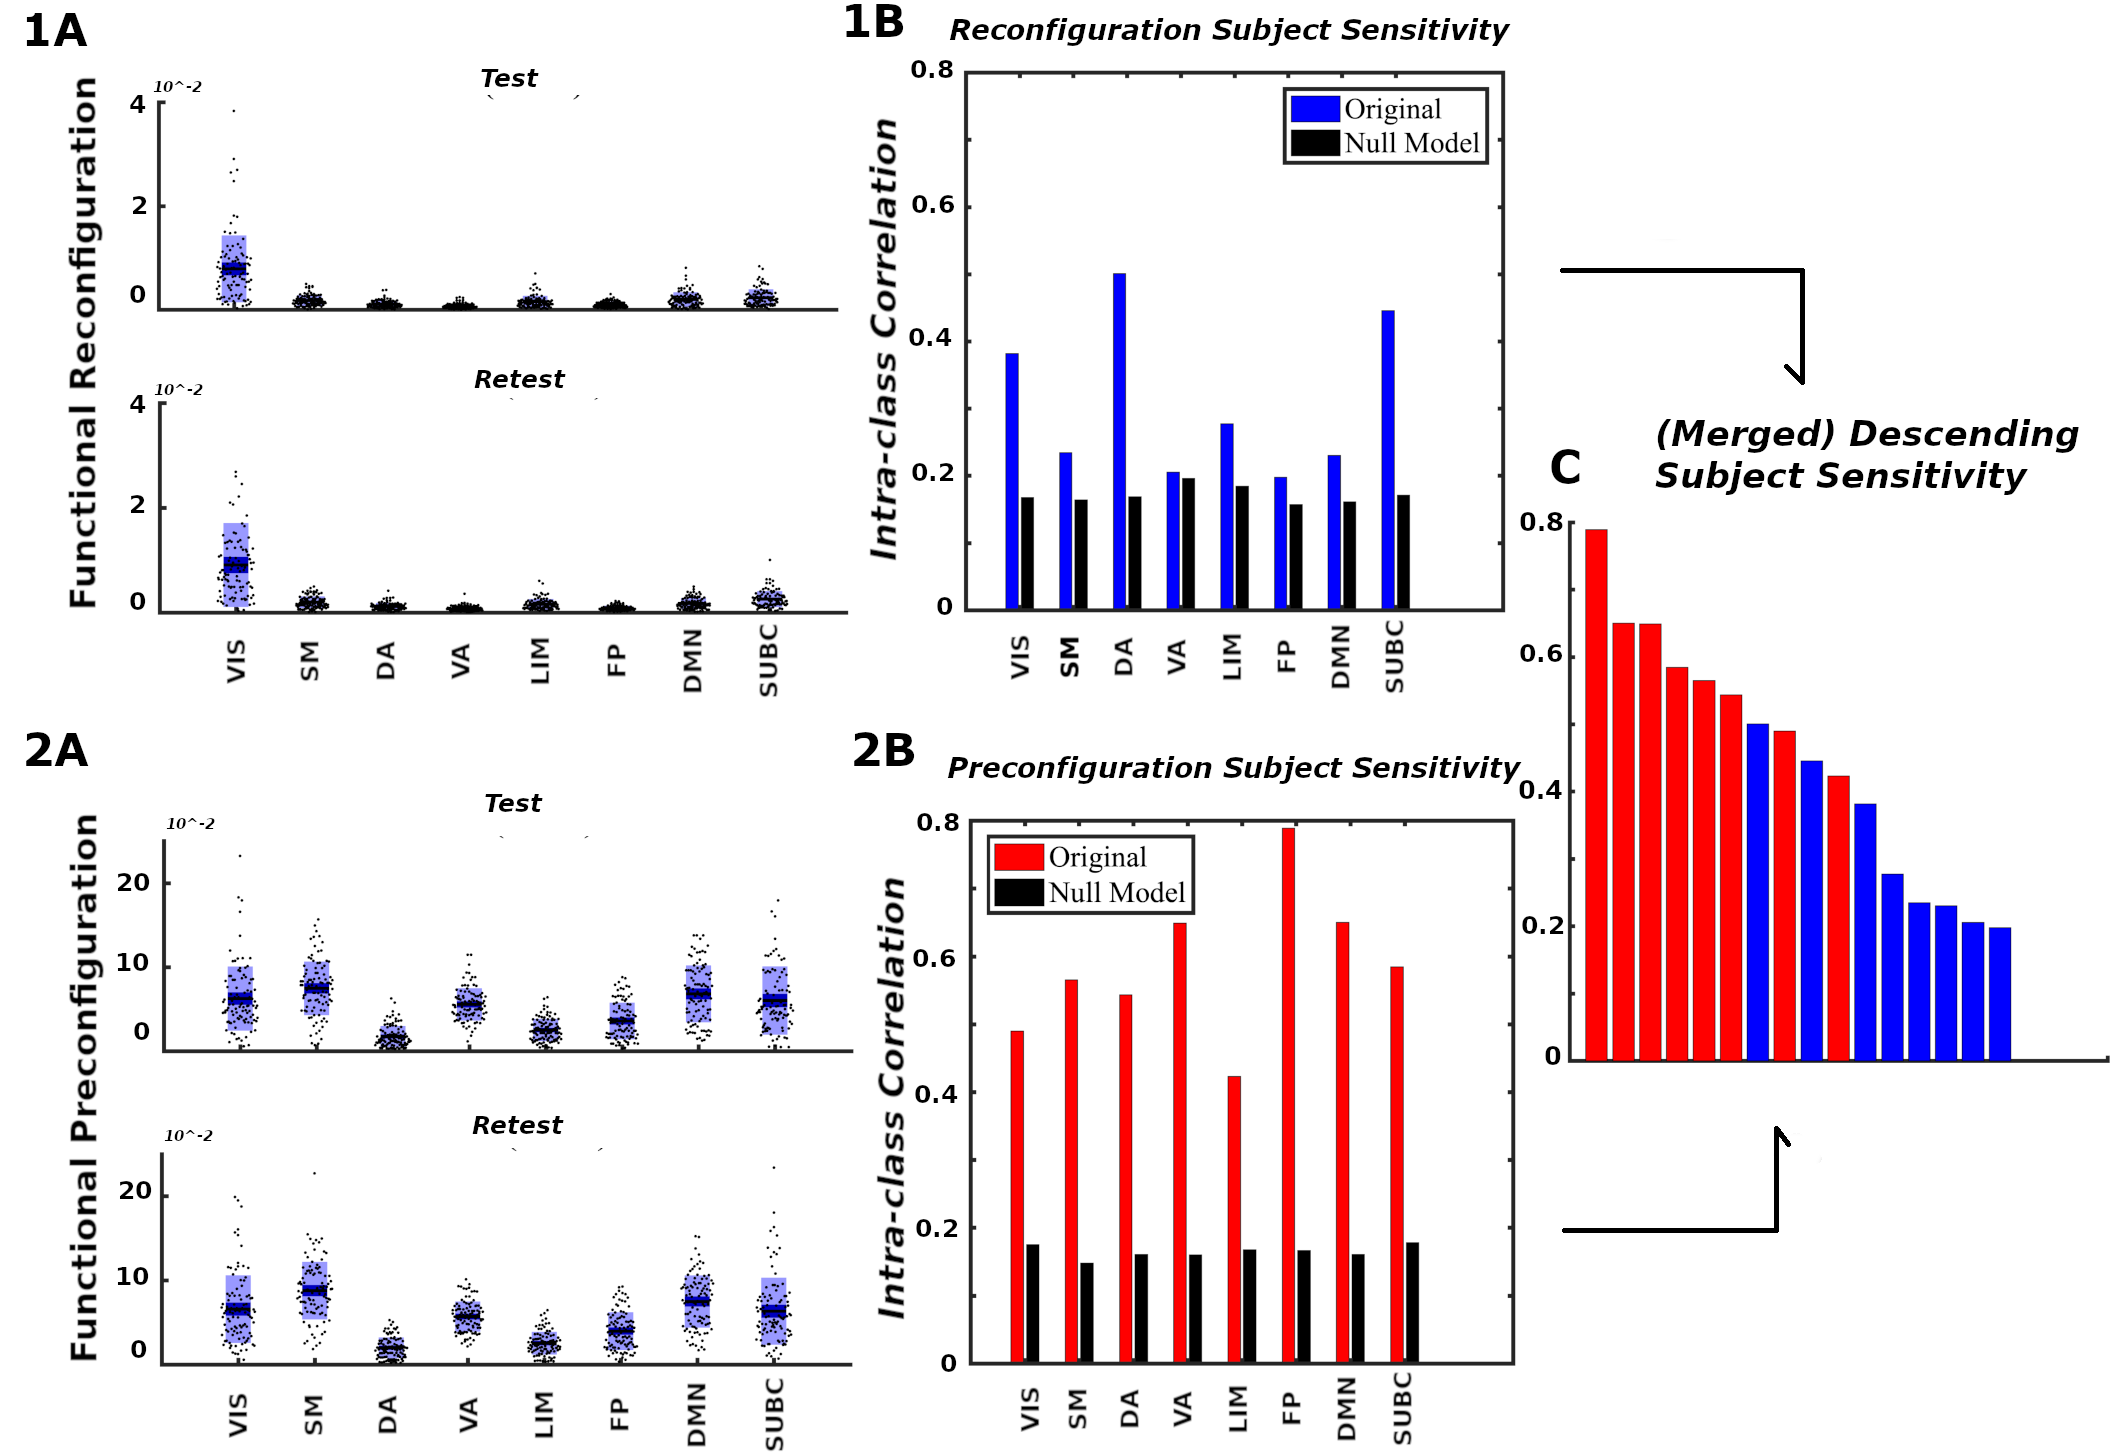 Figure 7
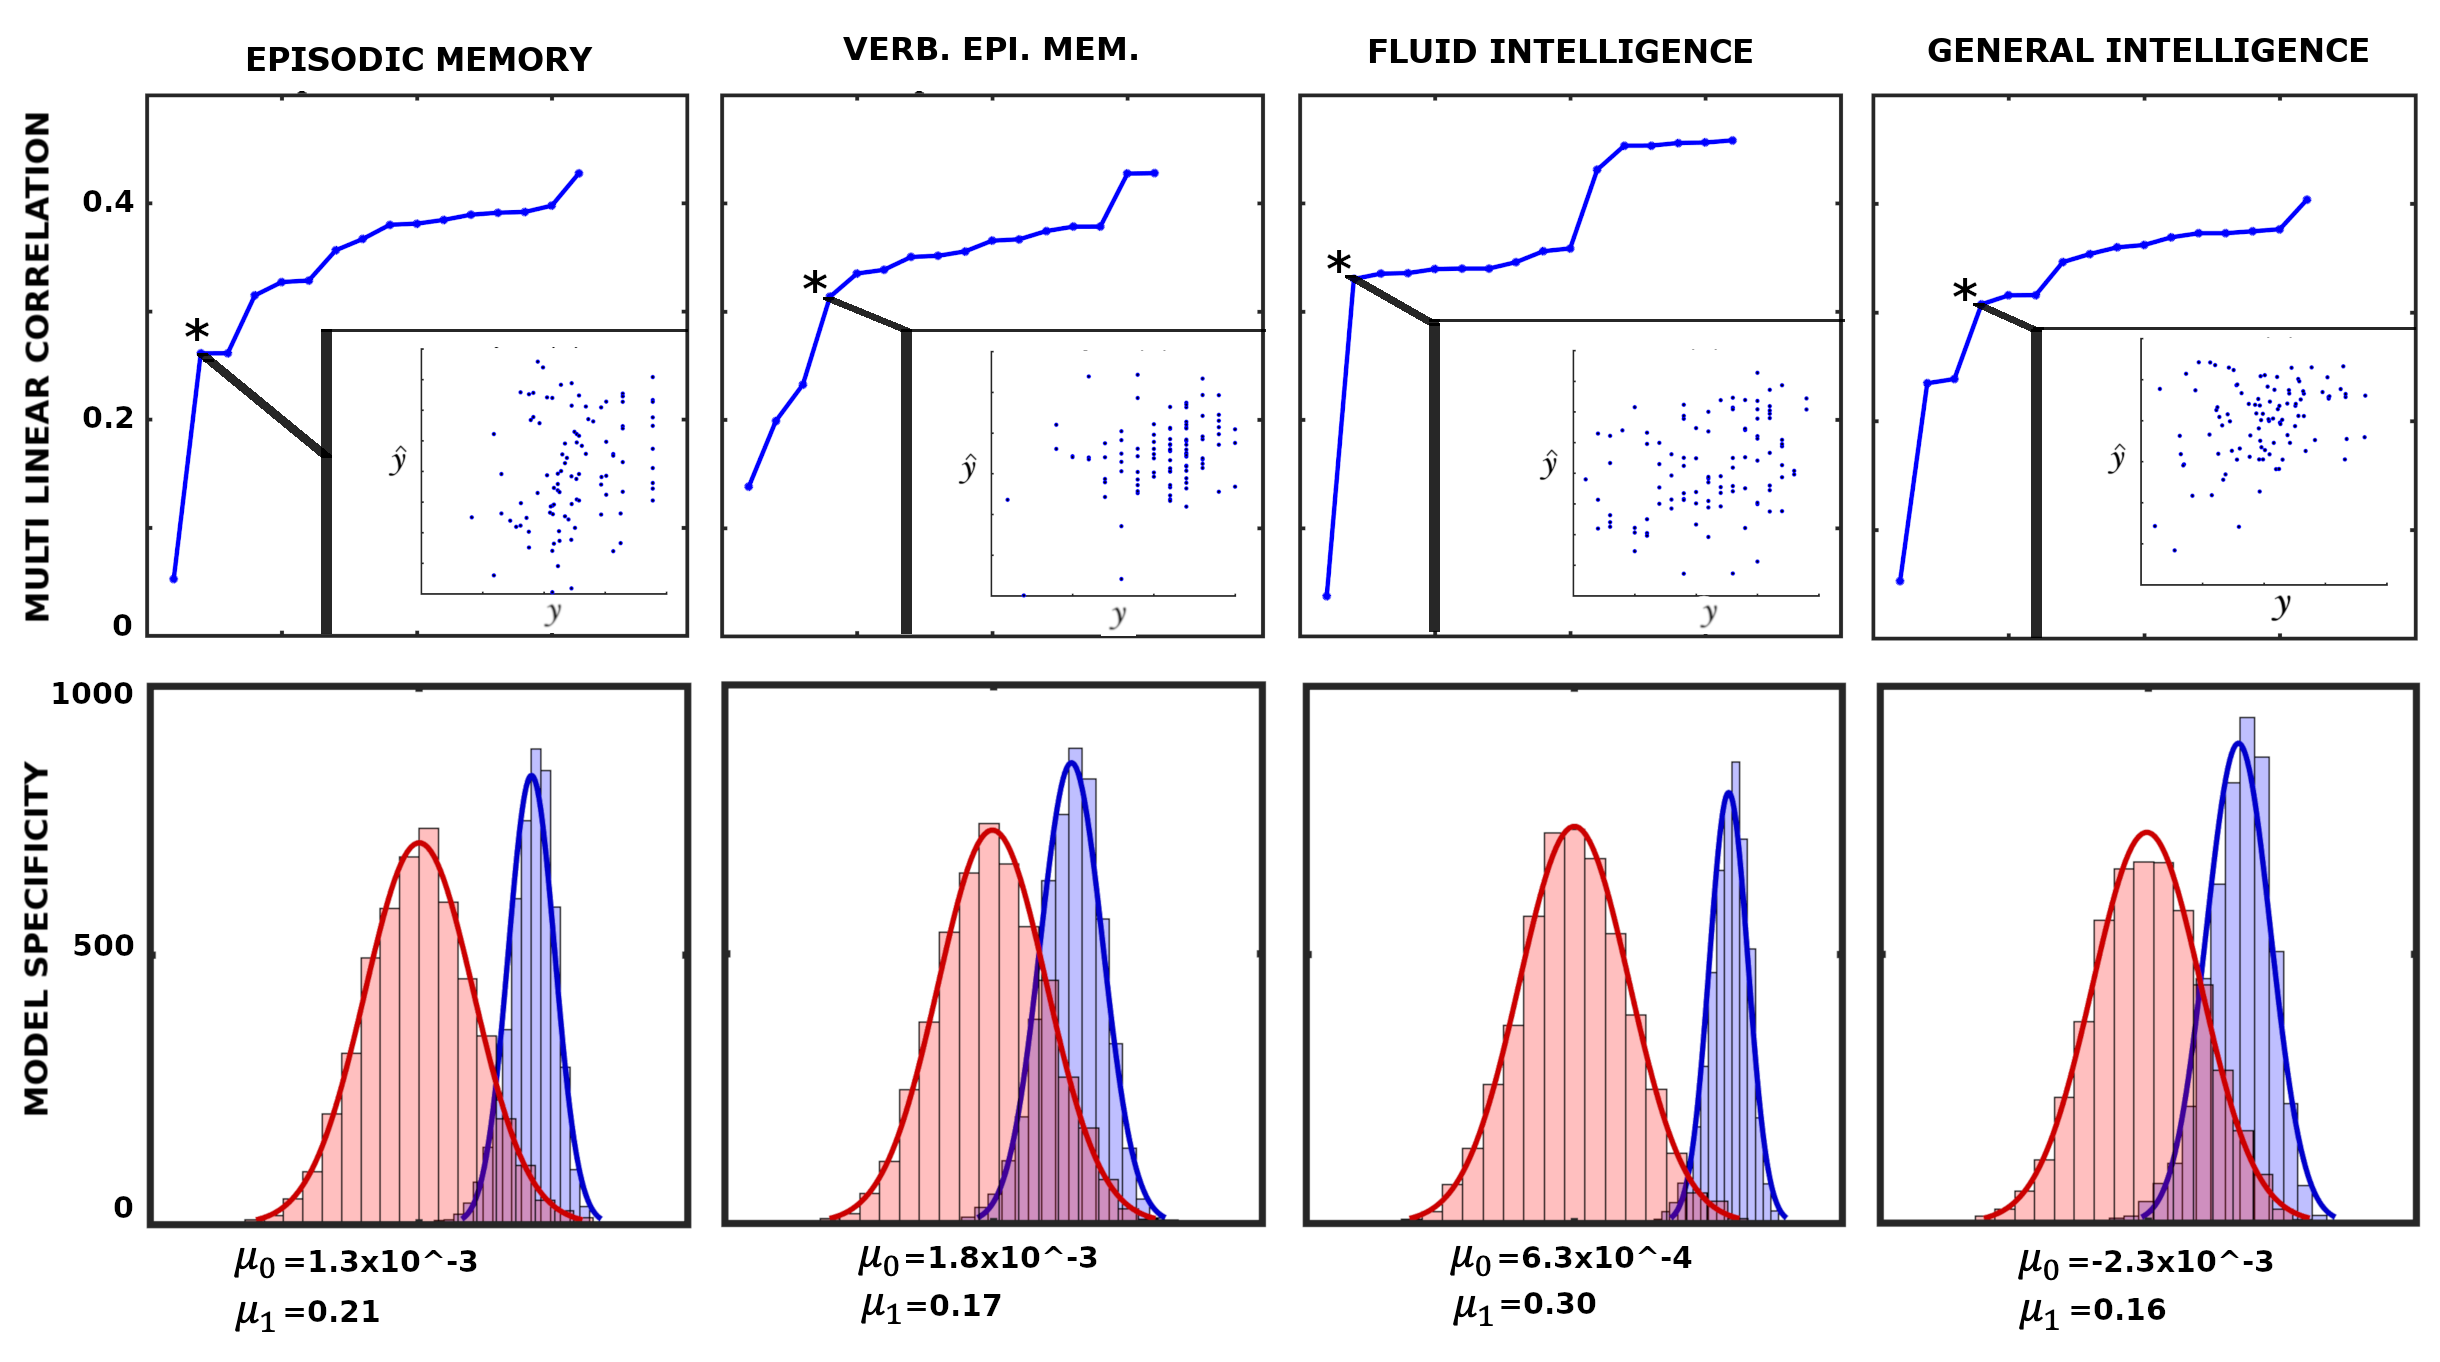 Figure 8
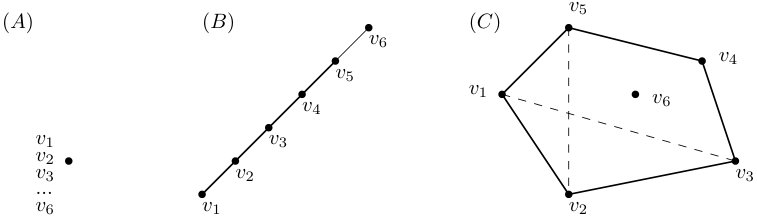 Figure 9
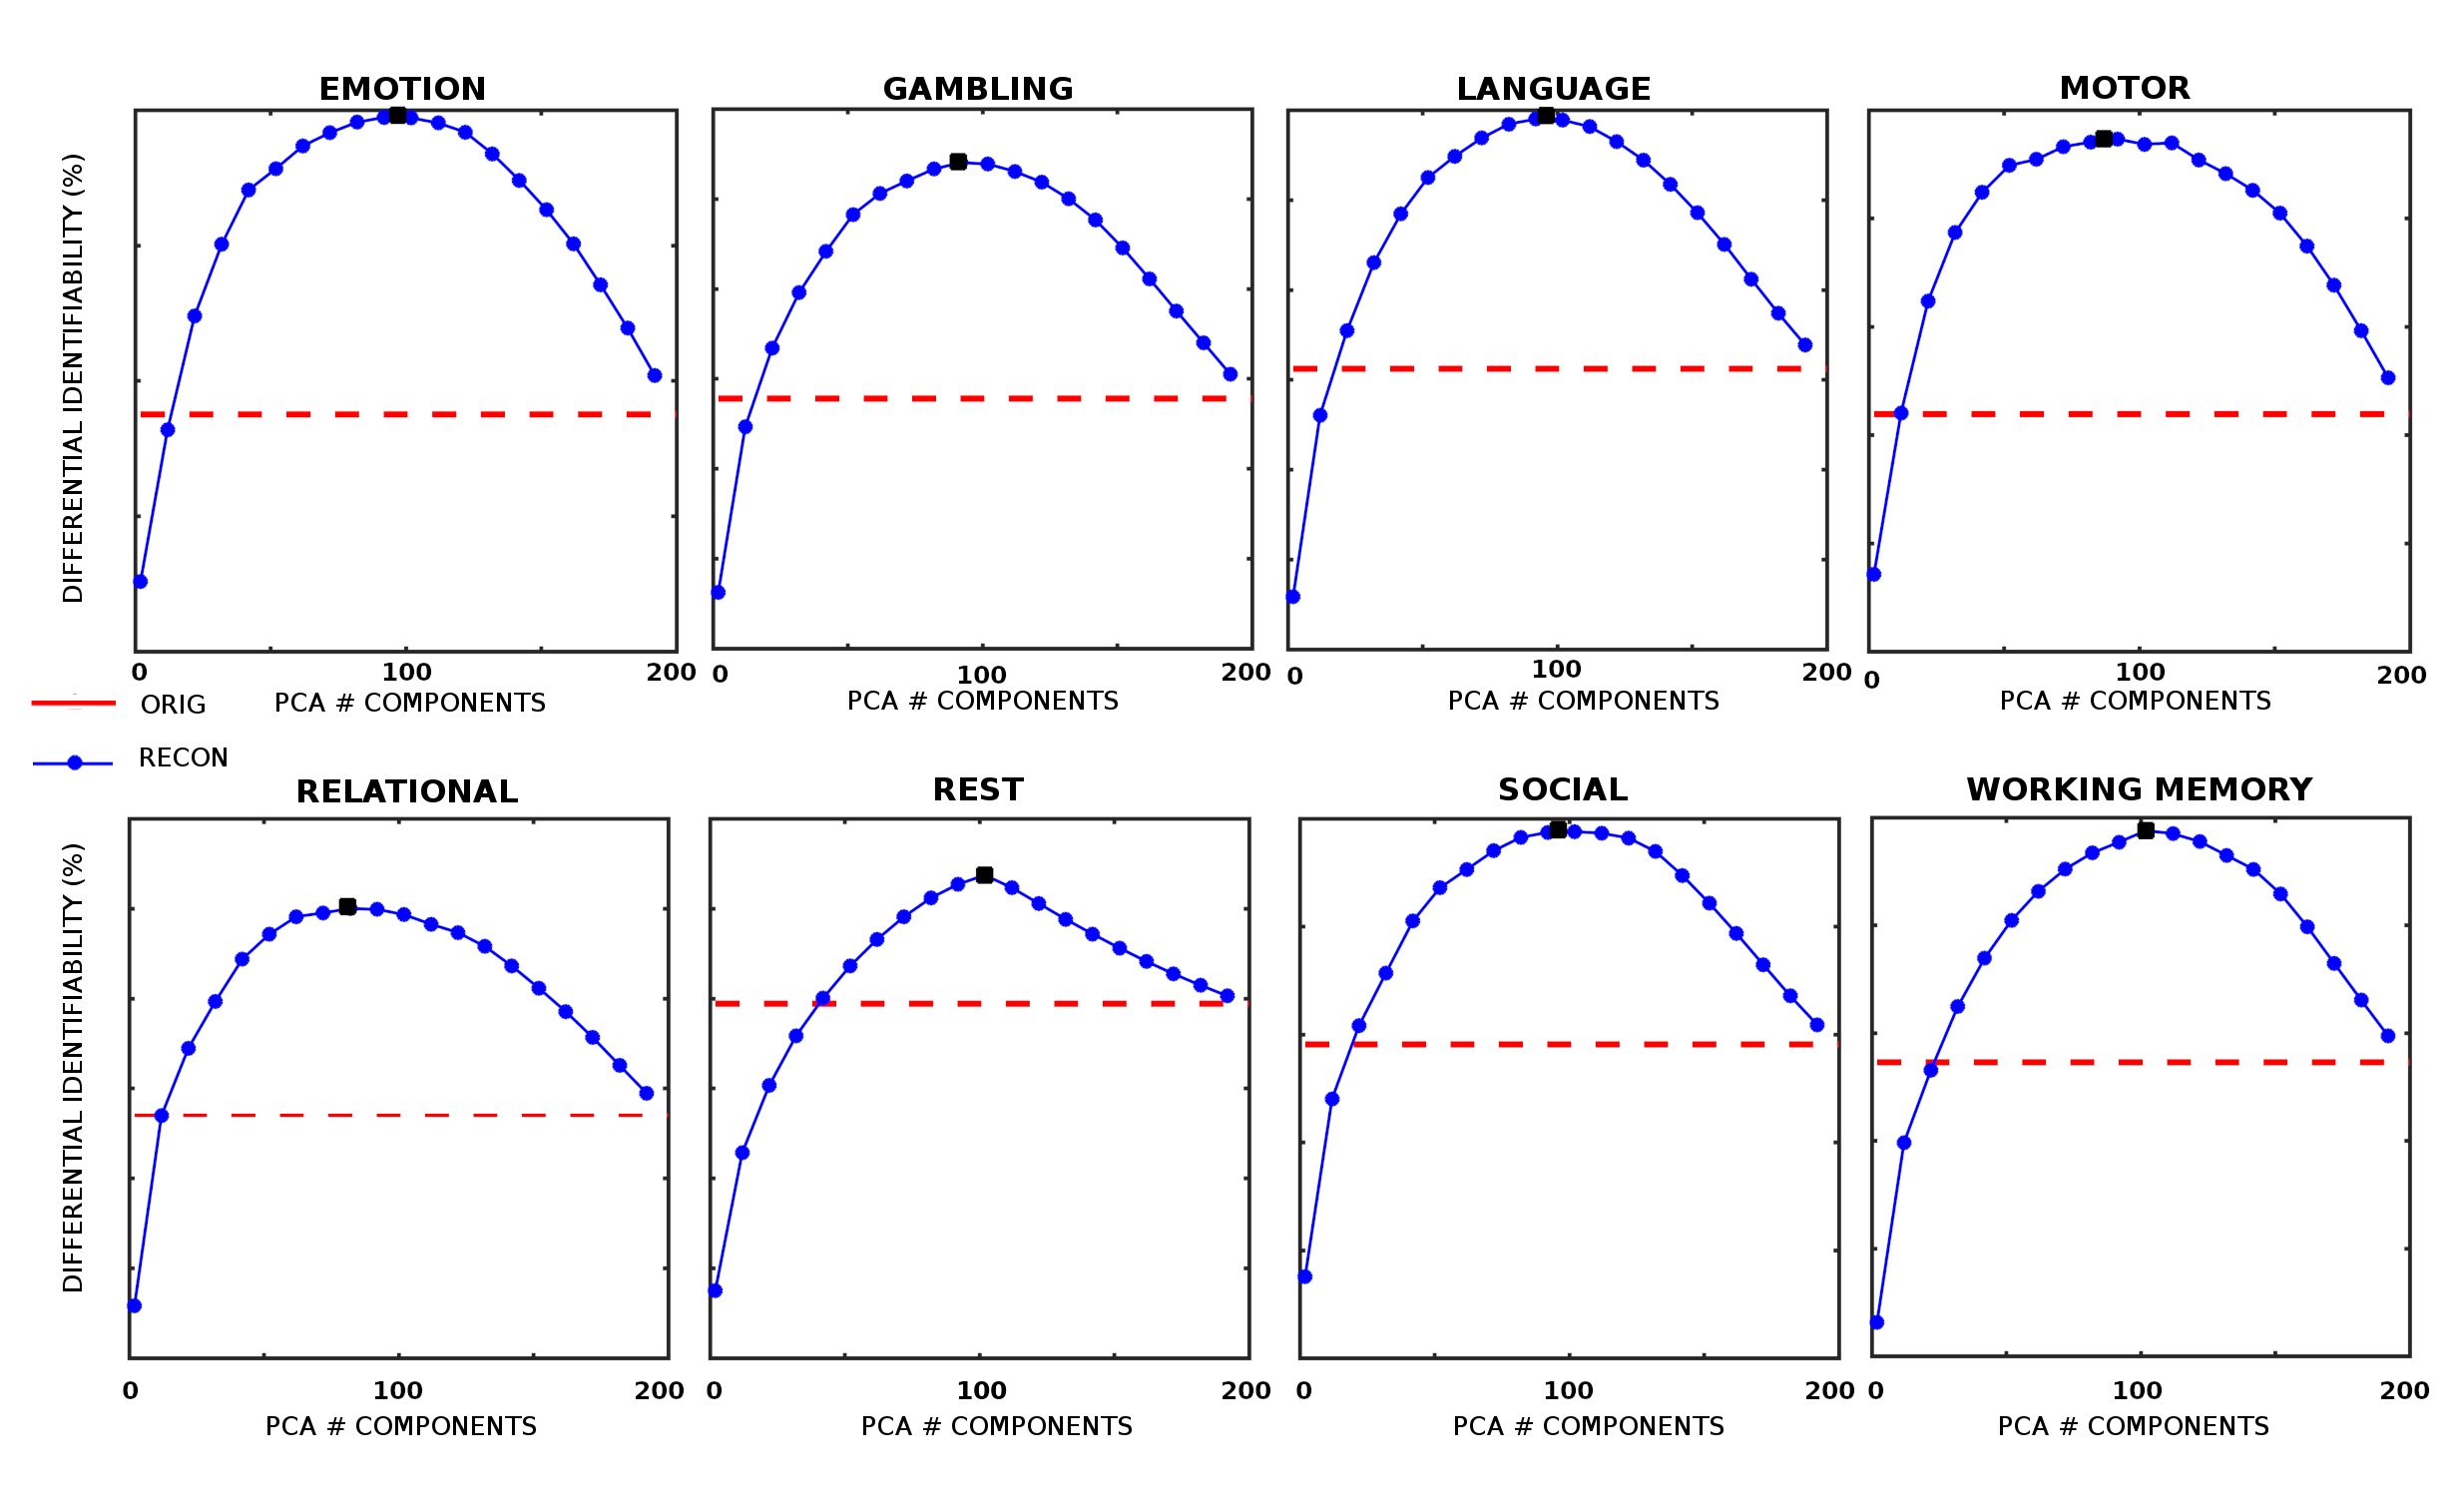 Figure 10
 Figure 11
 Figure 12
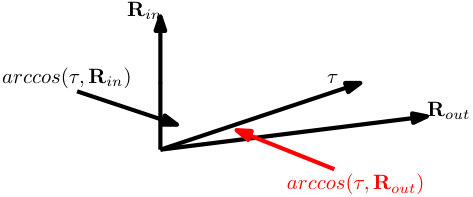 Figure 13
 Figure 14
 Figure 15
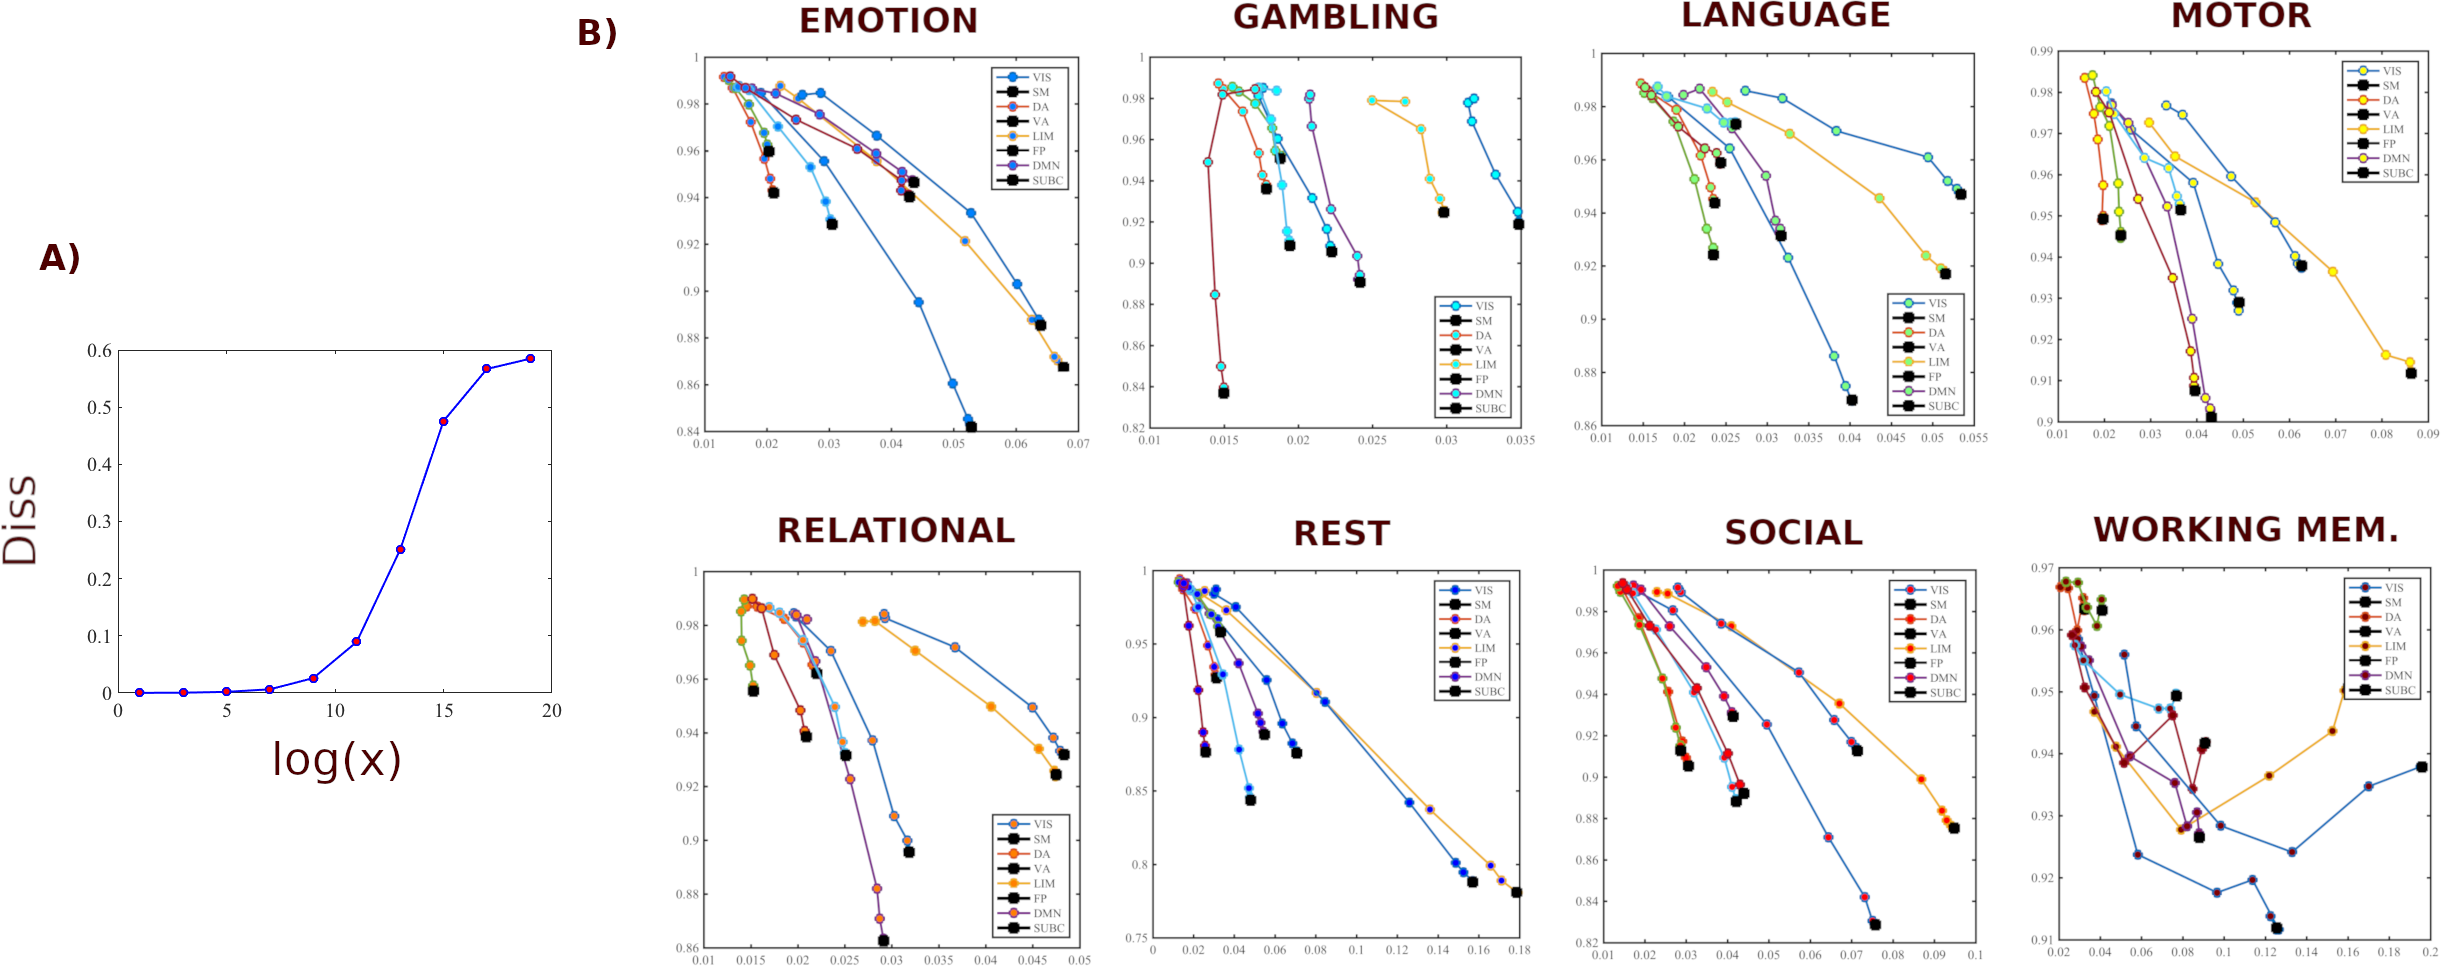 Figure 16
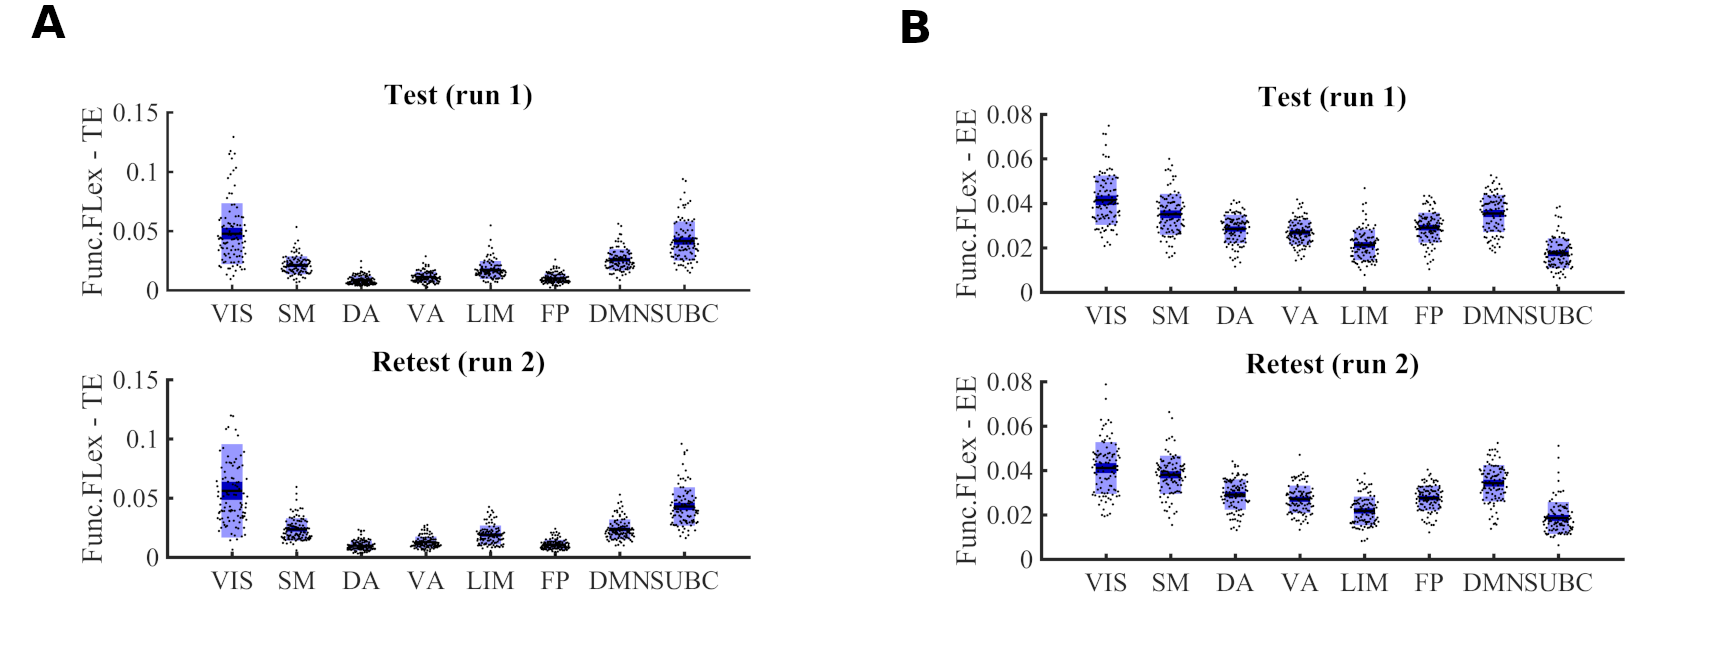 Figure 17
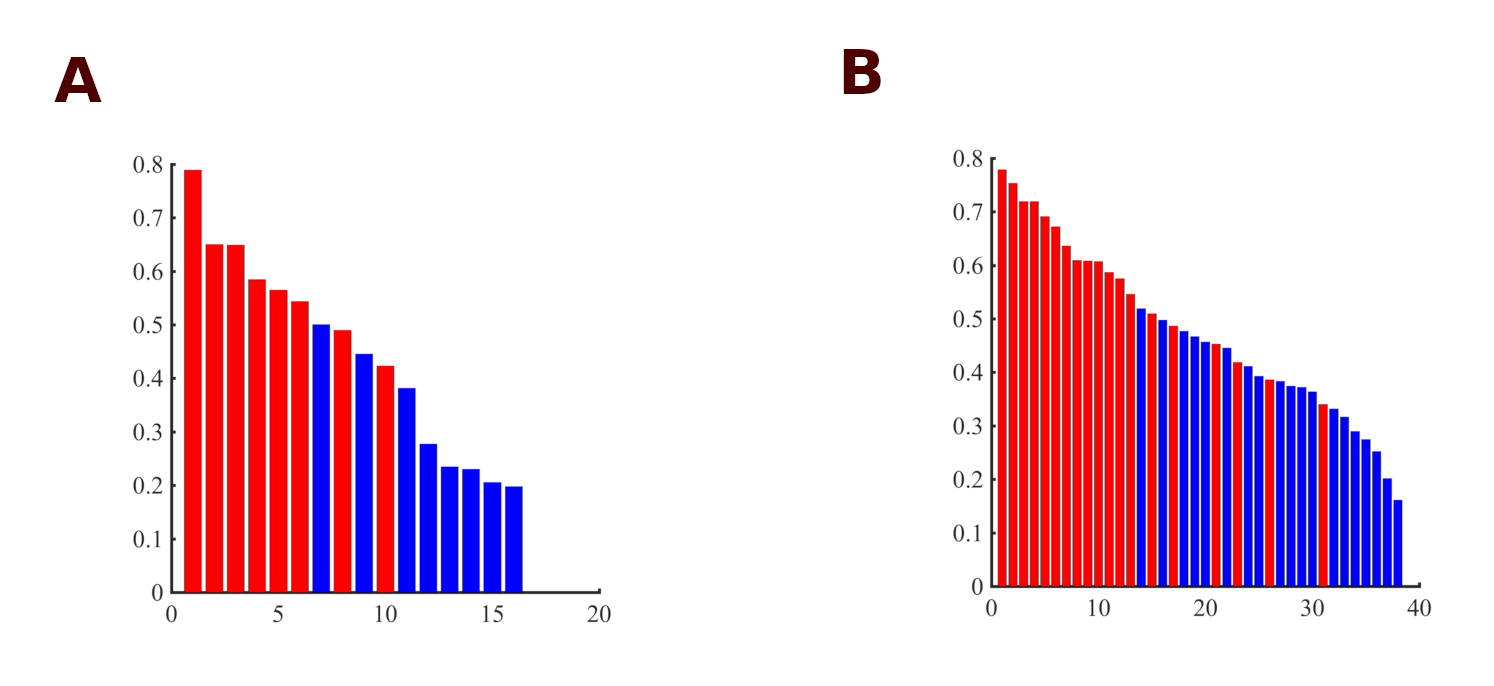 Figure 18
Peer Reviews
No public reviews on file for this paper yet. If you reviewed it on a platform where reviews are public (OpenReview, ICLR, NeurIPS, ICML), you can paste yours below so the community can read it here.
Videos
No videos yet. Explain this paper in a talk, walkthrough, or lecture? Add one.
**A morphospace of functional configuration to assess configural breadth based on brain functional networks **
Duy Duong-Tran 12, Kausar Abbas 12, Enrico Amico 12, Bernat Corominas-Murtra 3, Mario Dzemidzic 4, David Kareken 4, Mario Ventresca 15 and Joaquín Goñi 126*
1 School of Industrial Engineering, Purdue University, West-Lafayette, IN, USA
2 Purdue Institute for Integrative Neuroscience, Purdue University, West-Lafayette, IN, USA
3 Institute for Science and Technology, Am Campus 1, A-3400 Klosterneuburg, Austria
4 Department of Neurology, Indiana University School of Medicine, Indianapolis, IN, 46202
5 Purdue Institute of Inflammation, Immunology and Infectious Disease, Purdue University, West Lafayette, IN, USA
6 Weldon School of Biomedical Engineering, Purdue University, West Lafayette, IN, USA
- Corresponding email: [email protected]
\justify
Abstract
The best approach to quantify human brain functional reconfigurations in response to varying cognitive demands remains an unresolved topic in network neuroscience. We propose that such functional reconfigurations may be categorized into three different types: i) Network Configural Breadth, ii) Task-to-Task transitional reconfiguration, and iii) Within-Task reconfiguration. In order to quantify these reconfigurations, we propose a mesoscopic framework focused on functional networks (FNs) or communities. To do so, we introduce a 2D network morphospace that relies on two novel mesoscopic metrics, Trapping Efficiency (TE) and Exit Entropy (EE), which capture topology and integration of information within and between a reference set of FNs. In this study, we use this framework to quantify the Network Configural Breadth across different tasks. We show that the metrics defining this morphospace can differentiate FNs, cognitive tasks and subjects. We also show that network configural breadth significantly predicts behavioral measures, such as episodic memory, verbal episodic memory, fluid intelligence and general intelligence. In essence, we put forth a framework to explore the cognitive space in a comprehensive manner, for each individual separately, and at different levels of granularity. This tool that can also quantify the FN reconfigurations that result from the brain switching between mental states.
Author Summary
To understand and measure the ways in which human brain connectivity changes to accommodate a broad range of cognitive and behavioral goals, is an important question. We put forth a framework that captures such changes by tracking the topology and integration of information within and between FNs of the brain. Canonically, when FNs are characterized, they are separated from the rest of the brain network. The two metrics proposed in this work, Trapping Efficiency and Exit Entropy, quantify the topological and information integration characteristics of FNs while they are still embedded in the overall brain network. Trapping Efficiency measures the module’s ability to preserve an incoming signal from escaping its local topology, relative to its total exiting weights. Exit Entropy measures the module’s communication preferences with other modules/networks using information theory. When these two metrics are plotted in a 2D graph as a function of different brain states (i.e., cognitive/behavioral tasks), the resulting morphospace characterizes the extent of network reconfiguration between tasks (functional reconfiguration), and the change when moving from rest to an externally engaged “task-positive” state (functional preconfiguration), to collectively define network configural breadth. We also show that these metrics are sensitive to subject, task, and functional network identities. Overall, this method is a promising approach to quantify how human brains adapt to a range of tasks, and potentially to help improve precision clinical neuroscience.
1 Introduction
Human behavior arises out of a complex interplay of functional dynamics between different brain networks [10]. These interactions are reflected in functional network reconfigurations as subjects perform different tasks or are at rest [15, 1, 3]. One of the network neuroscience challenges is to develop a comprehensive framework to quantify the brain network (re-)configurations across different mental states and cognitive tasks. To that end, configurations across a collection of cognitive tasks can be conceptualized at three distinct levels of granularity:
- •
Network configural breadth reflects the range of network functional configurations required to represent a given individual’s total repertoire of cognitive and emotional states. In practice, how well the entire “cognitive space” [65, 66] is sampled depends on the number and choice of the tasks . This concept is inspired by Schultz et al. [49].
- •
Task-to-task transitional reconfiguration represents the specific shift in network functional configuration when a subject switches between cognitive/mental tasks [17, 30]. For instance, task transitions and accompanying reconfigurations will occur when a subject transitions from quiet reflection to engage in a spatial problem solving task, or from a lexical retrieval to a decision making paradigm.
- •
Within-task reconfiguration represents specific network functional configuration changes that may occur within a single task. This phenomenon has been assessed at the whole-brain level, showing the presence of distinct brain states within a task [11, 13, 51, 54, 53].
While brain network configural properties are task and subject dependent, [49], task-induced functional (re)configurations are rather subtle in whole-brain functional connectomes, even when comparing task to rest [15]. In addition, mesoscopic structures (e.g. functional networks of the brain) exhibit modular characteristics that adapt to cognitive demands without significantly affecting the rest of the system where higher levels of cognition emerge through the changing interactions of subsystems, instead of pairwise edge-level interactions [11]. Hence, a mesoscopic scale (as the one provided by functional networks (FNs) or communities/modules) may uncover differential patterns of (re-)configuration, [39], across functional sub-circuits, which might otherwise not be detectable at other scales. Traditionally, a mesoscopic assessment of functional brain networks would involve the detection of functional communities [59] either based on topology (density-based) [41, 42] or on the information flow (flow-based) [46, 45].These approaches, however, are not designed to track the dynamic behavior of a priori set of communities across time, tasks, and/or subjects.
The primary aim of this work is to clearly define and quantify different configurations that FNs can assume, as well as measure their nature of re-configurations switching between seemingly infinite number of cognitive states. From a graph-theoretical perspective, FNs and their corresponding reconfigurations are described by two attributes: topology and communication. From a system dynamic perspective, FNs can be characterized by segregation and integration [58] properties across which the human brain reconfigures across varied cognitive demands [51, 54, 50, 52, 53]. To formally capture these diverse characteristics of FNs, we constructed a mathematically well-defined and well-behaved 2D ”mesoscopic morphospace” based on two novel measures defined for non-negative, undirected, weighted functional connectomes: Trapping Efficiency (TE) and Exit Entropy (EE). Trapping Efficiency captures the level of segregation/integration of a functional network embedded in the rest of the functional connectome and quantifies the extent to which a particular FN ”traps” an incoming signal. Exit Entropy captures the specificity of integration of an FN with the rest of the functional connectome, and quantifies the uncertainty as to where (in terms of exit nodes) that same signal would exit the FN. In summary, this mesoscopic morphospace is a representation of the cognitive space as explored within and between cognitive states, as reflected by brain activity in fMRI. Such representation relies on FNs reconfigurations that can be tracked, at an individual level, and at different granularity levels in network (re-)configurations.
By using this 2D TE,EE-based morphospace, we formally study Network Configural Breadth (Figure 1(a)), the most global and coarse grain exploration of the cognitive space, and its subsequent functional configuration components. To that end, we formally define measures of (1) functional reconfiguration (capacity of an individual to reconfigure networks across widely differing cognitive operations) and (2) functional preconfiguration (efficiency of transition from resting-state to task-positive state [49], for potentially any community or FN. These measures are quantified for resting-state networks [67] on the 100 unrelated subjects from the Human Connectome Project (HCP) dataset. We then study how such quantification is related to measures of cognitive abilities such as, fluid intelligence.
2 A mesoscopic morphospace of functional reconfigurations
The mesoscopic morphospace proposed here is a two dimensional space built upon Trapping Efficiency and Exit Entropy measures for assessing functional networks or communities of functional connectomes. In this framework, functional connectomes must be undirected (symmetrical) weighted graphs, with non-negative functional couplings. This framework allows for any a-priori partition into functional communities. In this work, we assess the resting-state functional networks as proposed by Yeo et al. [67] as the a-priori FNs. Also, we use functional connectivity (without incorporating structural connectivity information), which is a quantification of statistical dependencies between BOLD time-series of brain regions, and it can be used as a proxy of communication dynamics in the brain [22]. Under this section, further technical details that are not mentioned in the main text will be directed to specific section(s) in the Supplemental Information (SI).
2.1 Computing mechanistic components for morphospace measures
Given a functional network (community or module) in a whole-brain functional connectome (denoted as ), a mesoscopic morphospace is constructed to assess functional network behaviors through two focal lenses: level of segregation/integration (using graph topology), and specificity of integration (using information theory). We first define all necessary components to compute TE and EE. Specifically, for each functional community , we
- (i)
Define the set of states (denoted as ) for a given functional community which contains the set of transient states (denoted as ), and absorbing states (denoted as ) such that ; 2. (ii)
Extract the induced (weighted) adjacency structure based on and :
[TABLE] 3. (iii)
Construct the Terminating Markov Chain based on and ; it is represented by
[TABLE] 4. (iv)
Compute the fundamental matrix (denoted as ) [34] which contains the mean number of steps a specific transient state in is visited, for any pair of transient states in :
[TABLE]
where is the identity matrix of dimension ; 5. (v)
Compute the mean time to absorption (denoted as ) which contains the mean number of steps that the random particle needs to be absorbed by one of the states in , given that it states in some state in :
[TABLE]
where is the vector all ones of size ; 6. (vi)
Compute the absorption probability matrix (denoted as ), which contains the likelihood of being absorbed by one of the absorbing state, given that the stochastic process starts in some transient state:
[TABLE]
where {\left.\kern-1.2pt\mathbf{P}\vphantom{\big{|}}\right|_{S_{trans},S_{abs}}} is the sub-transition probability matrix induced from (row) state and (column) state .
2.2 Module Trapping Efficiency
Module Trapping Efficiency, denoted as TE (unit: ), quantifies a module’s capacity to contain a random particle from leaving its local topology, i.e. . Specifically, through FN topology, we want to assess its level of segregation/integration, measured by the norm of (unit: ), i.e. the mean time to absorption of nodes in , normalized by its total exiting strength (unit: ), measured by . Mathematically, trapping efficiency is quantified as follows:
[TABLE]
We see that the mean time to absorption vector, , is dependent on both density-based [23, 42] and flow-based [46, 45, 36] modularity. The numerator () measures the difference (through Euclidean -norm) between the mean time to absorption of the functional module and its selected null module (the empty subgraph with the same number of nodes) in which . On the other hand, the denominator is a simple statistical summary of the module ”leakage” to the rest of the cortex; hence, -norm is chosen. The role of is to account for potential differences in trapping efficiency due to community size. Numerically, higher TE indicates that a module is more segregated (or equivalently, less integrated). This is because the FN topology traps the incoming signal efficiently, relatively to its exiting edges when embedded in the cortex. TE value ranges are given in Fig. 2.
2.3 Module Exit Entropy
Module Exit Entropy (denoted as EE, and in the range and unitless) assesses the normalized level of uncertainty in selecting an exiting node in of a random particle that starts in . The exit entropy, denoted as , measures the level of uncertainty exiting node (outside of the module) is preferred. Module exit entropy is mathematically formalized as:
[TABLE]
where preferential exit probability is the probability vector that contains entries that represents the likelihood of an exit signal selects a specific exiting state such that .
The numerator of , i.e. , measures the degree to which channels of communication between nodes in and are preferred for a fixed task/subject. It is noteworthy that is not influenced by the (cumulative) magnitudes (of functional connectivity values) that connect nodes from within the FN to outside (exiting) nodes. It is only affected by the distribution of such values. In particular, homogeneous distributions display high entropy levels and uneven distributions favoring certain exiting node(s) display low entropy. To demonstrate this point, an example is provided in SI under section C.3. The normalizer, , is the maximum entropy obtained from a module in which all exit nodes have the same absorption rate. Numerically, a high EE would denote the homogeneous integration within the rest of the system whereas a low EE would indicate a preferential communication or integration of the module with the rest of the system. In terms of functional brain networks, module exit entropy facilitates the understanding of collective behavior from to other FNs through its outreach channels (edges formed by nodes in and exiting nodes in ). This is because entropy measures the level of uncertainty in communication; hence, lower entropy means higher specificity in communication between the FN with the rest of the cortex. EE value ranges are given in Fig. 2.
2.4 The definition of the Mesoscopic Morphospace
The two distinct features of each FN in brain graphs are addressed by a point in as follows:
[TABLE]
where . for a given subject and task, a functional brain network is obtained with a pre-defined parcellation that results in induced subgraph , we can obtain points corresponding to FNs in network .
In general, trapping efficiency, is finitely bounded by construction (see more details in Section D.6 under SI). However, a better bound is possible for the HCP dataset. This is due to two driving factors: connectome sparsity and edge weights [6]. We address the upper bound for TE as: . In terms of , its numerical range . Hence, .
3 The network configural breadth formalism
Studying the manifold topology defined in this 2D mesoscopic morphospace theoretically requires an infinite amount of points. In finite domain with discrete sampling of the morphospace, polytope theory, a mathematical branch that studies object geometry, allows us to create a reasonable scaffold presentation with well-defined properties to formally define and quantify configural components of the functional networks.
Polytope theory is a branch of mathematics that studies the geometry of shapes in a dimensional Euclidean space, . Given a set of points in this space, , a convex hull formed by is represented by
[TABLE]
One can compute the notion of volume of the convex hull enclosed by , denoted as . Given that the morphospace is 2D, the manifold dimension can be from 0 up to 2. In the SI under Section D.1., further details on volume computation are defined.
The functional network configural breadth, for the subject, is compartmentalized into two components:
- •
FN (task) reconfiguration and
- •
FN rest-to-[task-positive] preconfiguration.
We then propose a mathematical relation between network configural breadth with FN reconfiguration and preconfiguration as follows:
[TABLE]
where represents configural breadth for subject . Here, we provide directly the measures that quantify (functional) reconfiguration and preconfiguration of FNs for subject’s configural breadth. Tasks are assigned the same level of importance and hence, no task is weighted more than others.
3.1 Functional Reconfiguration
Definition 1
Functional reconfiguration in this work is represented by a 2-dimensional spatial volume derived from given FN’s EE and TE coordinate values. As such, it represents an example of “cognitive space” [65, 66] within a functional domain that spans a variety of network states under various task-evoked conditions. We quantify this as
[TABLE]
where represents the set containing all investigated task coordinates of subject ’s FN; is the convex hull volume induced by points in .
For a given subject ’s FN, note that represents the broad span (breadth) of task configurations for a given functional community. Subsequently, represents the amount of breadth as measured by the volume of . Functional reconfiguration for a given subject’s FN, denoted as , is geometrically depicted in Fig. 3.
3.2 Functional Preconfiguration
Definition 2
Functional preconfiguration reflects the topologically distributed equipotentiality that is theoretically designed to enable an efficient switch from a resting state configuration to a task-positive state [49], and is quantified as follows
[TABLE]
where is the geometrical centroid of ; measures the distance between rest to task-general position (represented by ). It is defined with the selected metric space, in this case is the -norm in Euclidean space.
Note that functional preconfiguration can be viewed as where the convex hull is defined solely by two points: FN’s rest and FN’s geometrical centroid of task convex hull, i.e. . In such regards, the notion of is also suitable to describe the configural breadth between rest and task positive location. Functional preconfiguration is geometrically depicted in Fig. 3.
4 Results
The mesoscopic morphospace formalized in section 2 is used to assess network configural breadth in terms of functional preconfiguration and reconfiguration for the one hundred unrelated subjects (HCP, Q3 release). This dataset includes (test and retest) sessions for resting state and seven fMRI tasks: gambling (GAM), relational (REL), social (SOC), working memory (WM), language processing (LANG), emotion (EMOT), and motor (MOT). Whole-brain functional connectomes estimated from this fMRI dataset include 360 cortical brain regions [27] and 14 subcortical regions. The functional communities evaluated in the morphospace include seven cortical resting state FNs from [67]: visual (VIS), somatomotor (SM), dorsal attention (DA), ventral attention (VA), frontoparietal (FP), limbic (LIM), default mode (DMN) and one comprised of subcortical regions (SUBC). Additional details about the dataset are available in SI.
4.1 Task- and subject-sensitivity
4.1.1 Within- and between-subject task sensitivity
We first evaluate the capacity of module trapping efficiency and exit entropy to differentiate between tasks within subject Fig. 4A. For both test and retest sessions of each subject, we compute the TE and EE metrics for each FN. We compute these values for all 8 fMRI conditions. We compute the intraclass correlation coefficient (ICC), with test and retest (per subject) being the repeated measurements and task being the class variable (TE in Fig. 4A-top and EE in Fig. 4A-bottom, respectively, where each ICC is computed using a 2 (test, retest,) by 7(tasks) design, and the ICC reflects task within-subject sensitivity). For most subjects, ICC values in all FNs are high and positive values. EE displays a higher within-subject task sensitivity than TE. Specicifically, TE in VIS, DA and DMN most distinguished between the cognitive tasks, whereas EE in VA and FP was best at distinguishing the within-subject task-based configural changes. The ICC values for both coordinates were the lowest for LIM.
We then evaluate the degree to which morphospace metrics capture cohort-level configural changes. To test this, for each morphospace metrics (TE or EE), we compute ICC of each FN where subjects as the repeated measures and task the class variable (Fig. 4B). We performed the evaluation separately for test and retest sessions as denoted by gray and dark bars, respectively, for TE (Fig. 4B-top) and EE (Fig. 4B-bottom). EE captures cohort-level task-based signatures as ICC values are consistently higher than those of TE. Interestingly, LIM has the lowest cohort-level task-based sensitivity for both morphospace metrics.
4.1.2 Subject sensitivity across tasks
Here, we compute ICC considering the tasks (fMRI conditions) the repeated measurements and considering subjects the class variable (Fig. 4C). It is note-worthy that TE is superior in uncovering subject fingerprints, compared to EE, for the majority of FNs. This is complementary to EE being more task-sensitive.
4.1.3 TE and EE are disjoint features
Results in the sections 4.1.1. and 4.1.2. suggests that TE and EE have the differentiating capacity to highlight non-overlapping characteristics of objects under consideration, i.e. task- and subject- based FNs. First of all, for within-subject task differentiation (Fig. 4A), FNs with high ICC values in one measure do not necessarily show a similar tendency in the other. For instance, VA has the third lowest mean TE value in characterizing within-subject tasks differentiation but it has the highest mean EE score. Similarly, FP has second lowest average TE score while third highest EE score indicating that each of the two measure caputures unique aspects of a given FN. Secondly, evidence of disjoint features is shown through the ICC results in cohort-level task-sensitivity (Fig. 4B) and subject-sensitivity (Fig. 4C) configural changes. Indeed, TE is superior in detecting subject fingerprints while EE is better in unraveling task fingerprints. The idea is that, for a given studied object (i.e. task-based FNs), configurations are shown to “stretch” in exclusive/disjoint directions (subject-sensitive trapping efficiency and task-sensitive exit entropy).
4.2 Quantifying network configural breadth on functional networks
The mesoscopic morphospace allows the quantification of network configural breadth. For a given functional community, we compute functional reconfiguration (degree of configurations across tasks) and preconfiguration (distance from rest to task positive state), using formula (5,6), respectively.
4.2.1 Group-Average Results
The group average behavior of functional communities is shown in Fig. 5. Functional reconfiguration of FNs are shown as filled convex hulls whereas preconfiguration of FNs are shown as dashed lines from rest to the corresponding task hull geometric centroid.
To facilitate comparing network configural breadth across all functional networks, these same convex hulls are shown in Fig. 6A with the same and axis values. VIS network polytope, representing group-average behavior, is lower in EE relative to other FNs. With the exception of VIS and SUBC, all other FNs cluster in a similar, high EE/ low TE area of the morphospace (Fig. 6A). It should be noted that different tasks and subject populations (e.g., older or clinical groups) might cluster FNs differently. We also note that the subcortical polytope is relatively high in exit entropy. However, the subcortical parcellation might not optimally reflect the functional and/or structural makeup of various subcortical regions (e.g., role of the basal ganglia in the motor system) so these results should be interpreted cautiously.
One observation drawn from such a presentation is that the morphospace framework reconfirms, quantitatively, that functional dichotomy of the brain between task-positive and rest state [25]. Specifically, the default mode network acts more as a segregated module with high level of integration specificity at rest - as seen in the lower right regime with high TE, low EE values - as opposed to under task-evoked conditions - as seen in the top left corner with low TE, high EE values (Fig. 5 Default Mode) [32, 25].
Another observation is that in terms of segregation level measured by TE, the lower bound of subcortical convex hull is, approximately, the upper bound of other FNs, with the exception of the visual network. Figures 7.1A and 7.2A also summarize functional reconfiguration and preconfiguration respectively, for test and retest fMRI sessions in all subjects and FNs. Here, the VIS system displays the largest functional reconfiguration (see Fig. 7.1A). From Fig 7.2A, functional preconfigurations display a more comparable magnitude among all FNs.
Further evidence of disjoint feature is also displayed in Fig. 6B and 6C. In Fig. 6B, maximal distance is computed using pairwise distances for two given tasks for a specific FN. The result shows that for a given FN, the two measures complement each other and in many cases, stretch the cognitive space in one direction or the other. For instance, in case of DA and FP, the maximal distance in EE is very high but low for TE whereas in VIS and SUBC, TE maximal distance is higher than that of EE. Furthermore, in Fig. 6C, only specific tasks (e.g. Motor and Emotion) that push the cognitive space in particular direction (which is captured by maximal distance computation). Evidence of disjoint features is also illustrated by the relative frequency of Motor and Emotion tasks for which TE and EE are complimentary.
4.2.2 Subject specificity of pre- and reconfiguration of functional networks
The formulation of network configural breadth (in terms of preconfiguration and reconfiguration) enables us to assess these properties at the subject level. In Fig 7.1B and 7.2B, we use ICC to analyze the ability of morphospace measures (in the form or reconfiguration (panels Fig. 7.1) and preconfiguration (panels Fig. 7.2)) to reflect subject identity within each FN. For all FNs from Yeo et al. [67], the ICCs suggest that subjects can be differentiated from each other when contrasted against a corresponding null model (see SI Section D.4.1 for details). We see that subject sensitivity scores of all eight FNs for both pre- and re- configurations are higher than their corresponding null models. Finally, for a fixed FN, functional preconfigurations dominated the subject sensitivity ranking, as illustrated by Fig. 7C. Furthermore, FP, DMN and VA preconfigurations are among the FNs with highest subject fingerprints in overall subject sensitivity ranking.
4.3 Network configural breadth and behavior
Network configural breadth, compartmentalized into FN reconfiguration and preconfiguration , shows high level of subject sensitivity. This allows us to assume that is associated with an individual’s behavioral measures (denoted as for subject ). Serveral studies reported that FP and DMN networks are associated with memory and intelligence [31, 49, 62]. Therefore, we evaluated if the outlined framework reflects four widely studied cognitive/behavioral measures, related to memory and intelligence: episodic memory, verbal episodic memory (Verb. Epi. Mem.), fluid intelligence , and general intelligence . While fluid intelligence reflects subject capacity to solve novel problems, general intelligence, , reflects not only fluid intelligence, , traits but also crystallized (i.e. acquired) knowledge ([14] and typically denoted as ). The early notion of general intelligence is conceptualized by Spearman’s positive manifold [57] that cannot be fully described using a single task. Quantification of g can be accomplished using subspace extraction techniques such as explanatory factor analysis ([18]) or principal component analysis (PCA [49]). In this work, we quantified using the PCA approach described in Schultz and Cole [49].Mathematically, we propose the following composite relationship:
[TABLE]
Having established a plausible connection between behavioral measures and , , equation (7) can be viewed as a multi-linear model (MLM) using FN preconfiguration and reconfiguration as independent variables (or predictors). The MLM is constructed iteratively, starting with the descriptor with the highest individual fingerprints in Fig. 7C. In each iteration, the subsequently ranked descriptor (according to Fig. 7C) is appended to the existing ones. The best MLM (denoted with an asterisk in Fig. 8), which determines the number of linear descriptors included the model, is selected based on the model p-value.
To test the level of specificity in the model, we performed 2000 simulations of fold cross validation where between the selected MLM and the corresponding behavioral measure. Specifically, for each cross validation (per simulation), we obtain a correlation between the 20 left-out values (y) with the predicted values (). Hence, in each simulation we obtained five correlation and their mean value. It can be shown that those means follows a normal distribution (details shown in SI). Lastly, to provide the level of specificity of linear descriptors, we present a corresponding null model where the same descriptors are evaluated to predict random vectors of appropriate size. To test our model and its ability to predict the behavioral measures, we rely completely on network configural breadth predictors ranked in descending order of subject specificity.
The reference list from the paper itself. Each links out to its DOI / PubMed record.
- 11. E. Amico, K. Abbas, D. A. Duong-Tran, U. Tipnis, M. Rajapandian, E. Chumin, M. Ventresca, J. Harezlak, and J. Goñi. Towards a mathematical theory of communication for the human connectome. ar Xiv preprint ar Xiv:1911.02601 , 2019.
- 22. E. Amico, A. Arenas, and J. Goñi. Centralized and distributed cognitive task processing in the human connectome. Network Neuroscience , 3(2):455–474, 2019.
- 33. E. Amico, M. Dzemidzic, B. G. Oberlin, C. R. Carron, J. Harezlak, J. Goñi, and D. A. Kareken. The disengaging brain: Dynamic transitions from cognitive engagement and alcoholism risk. Neuro Image , 209:116515, 2020.
- 44. E. Amico and J. Goñi. Mapping hybrid functional-structural connectivity traits in the human connectome. Network Neuroscience , pages 1–17, 2018.
- 55. E. Amico and J. Goñi. The quest for identifiability in human functional connectomes. Scientific reports , 8(1):8254, 2018.
- 66. A. Avena-Koenigsberger, J. Goñi, R. Solé, and O. Sporns. Network morphospace. Journal of the Royal Society Interface , 12(103):20140881, 2015.
- 77. A. Avena-Koenigsberger, B. Misic, and O. Sporns. Communication dynamics in complex brain networks. Nature Reviews Neuroscience , 19(1):17, 2018.
- 88. D. M. Barch, G. C. Burgess, M. P. Harms, S. E. Petersen, B. L. Schlaggar, M. Corbetta, M. F. Glasser, S. Curtiss, S. Dixit, C. Feldt, et al. Function in the human connectome: task-fmri and individual differences in behavior. Neuroimage , 80:169–189, 2013.