Measurement of the ratio of cross sections for inclusive isolated-photon production in $pp$ collisions at $\sqrt s = 13$ and $8$ TeV with the ATLAS detector
ATLAS Collaboration

TL;DR
This paper measures the ratio of inclusive isolated-photon production cross sections at 13 and 8 TeV in proton-proton collisions using ATLAS data, compares it with QCD predictions, and explores related Z boson production ratios.
Contribution
It provides the first detailed measurement of the photon cross section ratio at different energies and compares it with theoretical models, reducing uncertainties through correlated analysis.
Findings
Predictions agree with measured ratios within uncertainties.
Uncertainty reduction achieved by considering correlations between energies.
Double ratio with Z boson production further reduces experimental uncertainties.
Abstract
The ratio of the cross sections for inclusive isolated-photon production in collisions at centre-of-mass energies of 13 and 8 TeV is measured using the ATLAS detector at the LHC. The integrated luminosities of the 13 TeV and 8 TeV datasets are 3.2 fb and 20.2 fb, respectively. The ratio is measured as a function of the photon transverse energy in different regions of the photon pseudorapidity. The predictions from next-to-leading-order perturbative QCD calculations are compared with the measured ratio. The experimental systematic uncertainties as well as the uncertainties affecting the predictions are evaluated taking into account the correlations between the two centre-of-mass energies, resulting in a reduction of up to a factor of () in the experimental (theoretical) systematic uncertainties. The predictions based on several parameterisations of the proton…
Click any figure to enlarge with its caption.
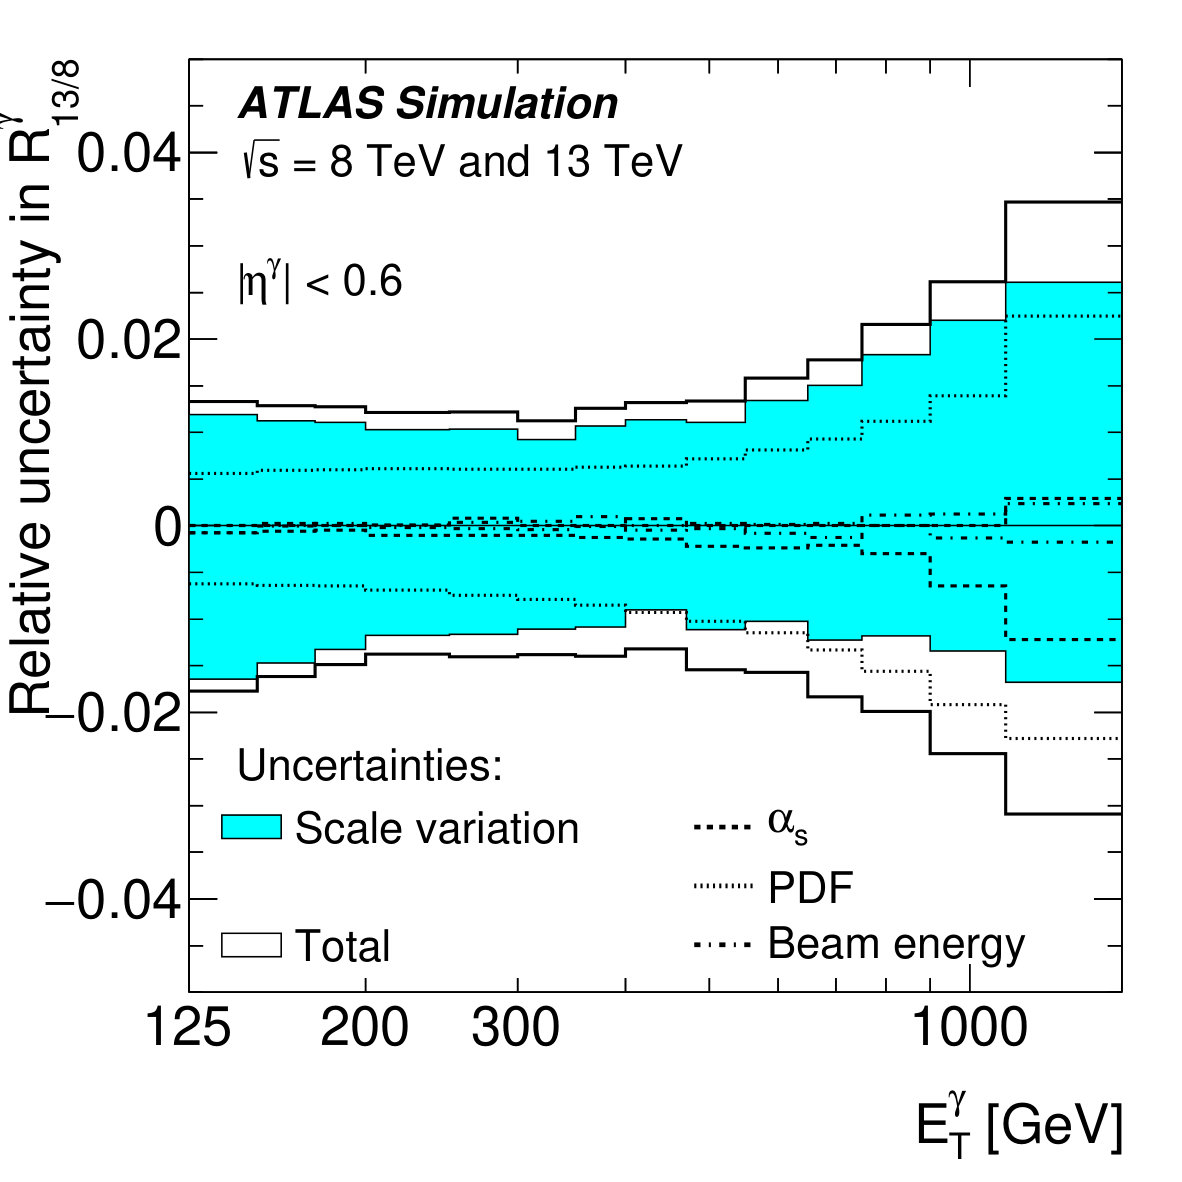 Figure 1
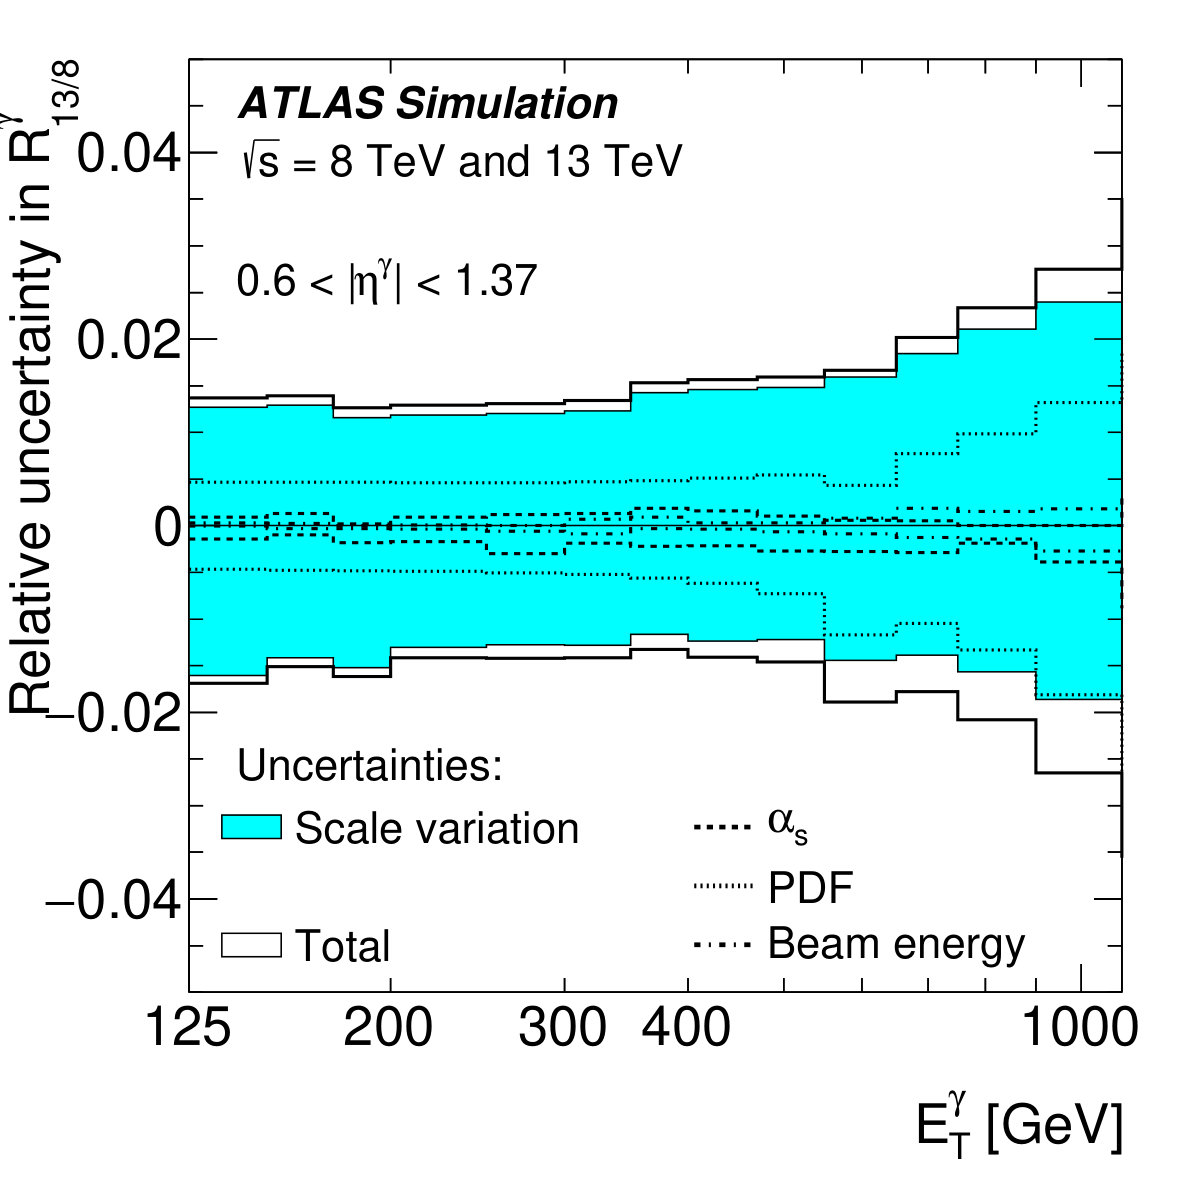 Figure 1
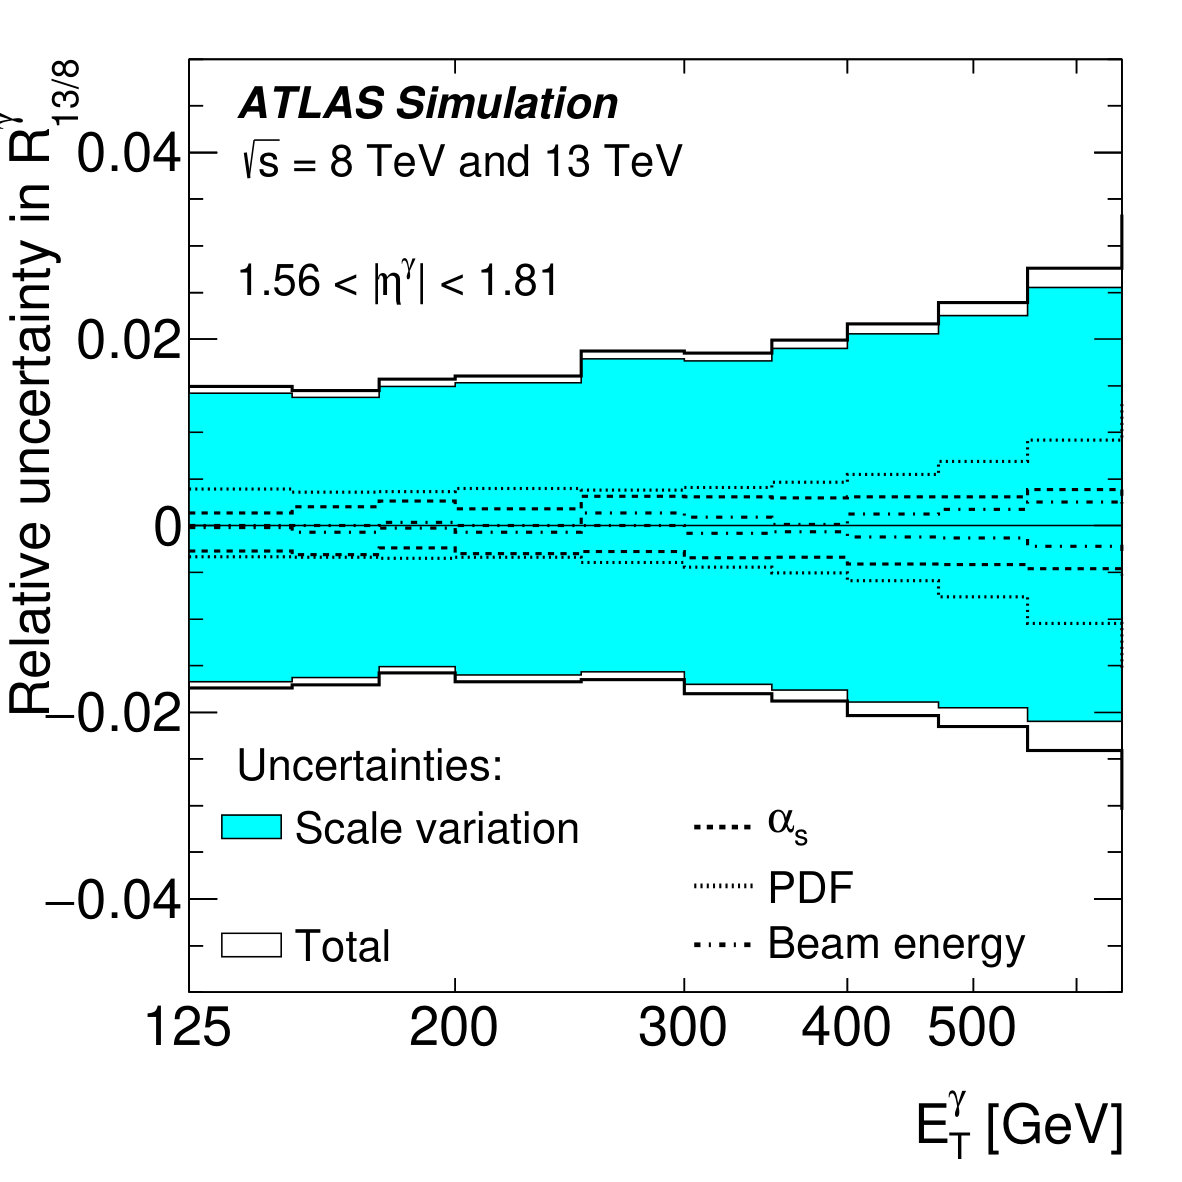 Figure 1
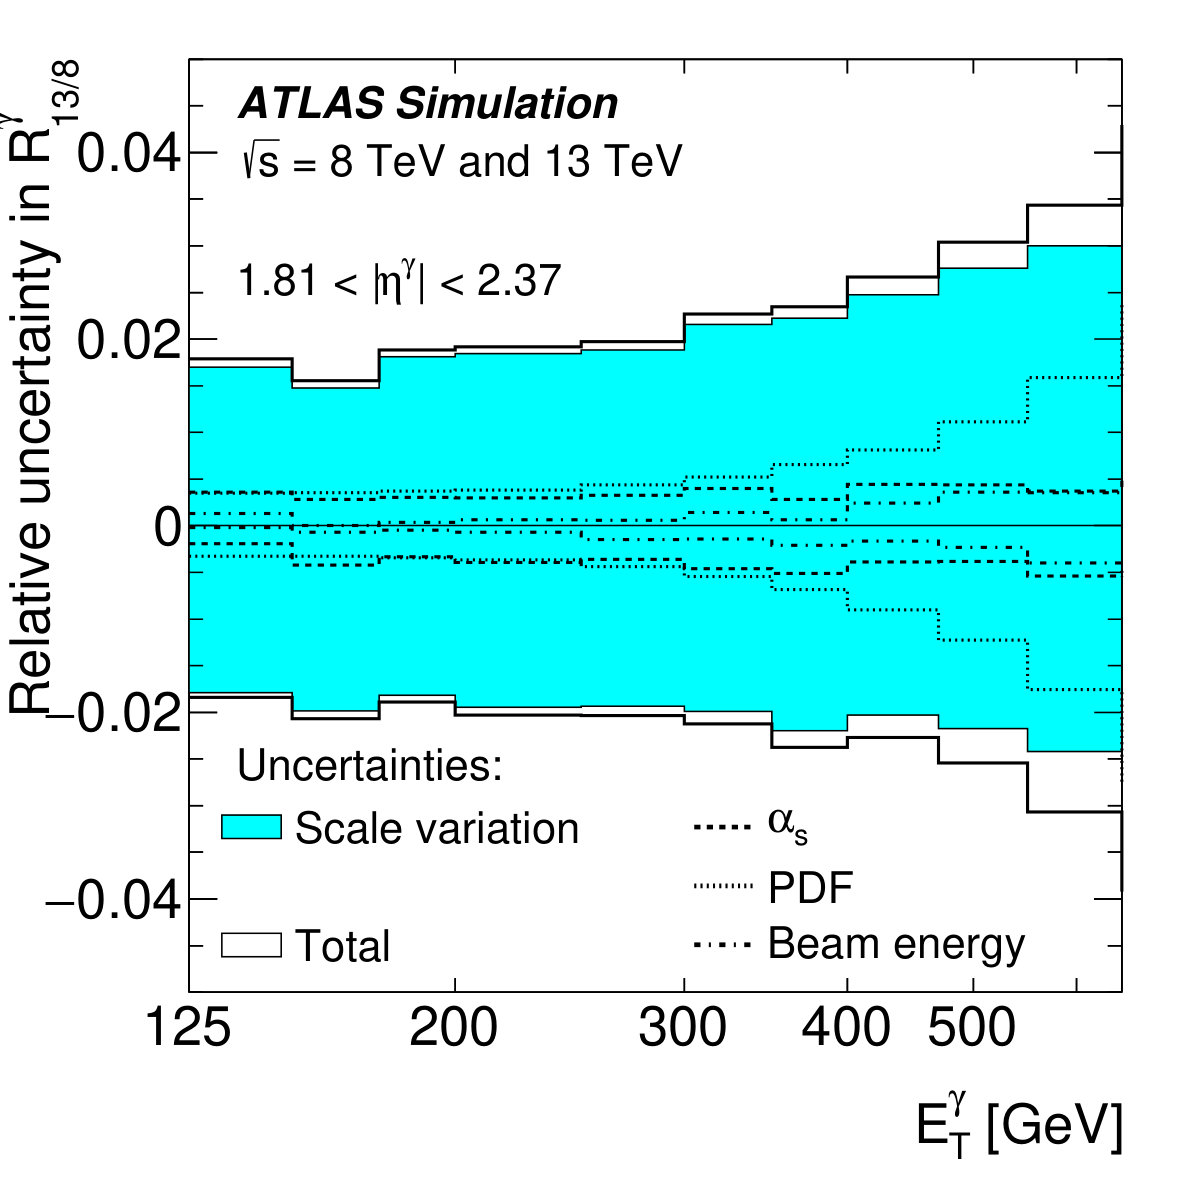 Figure 1
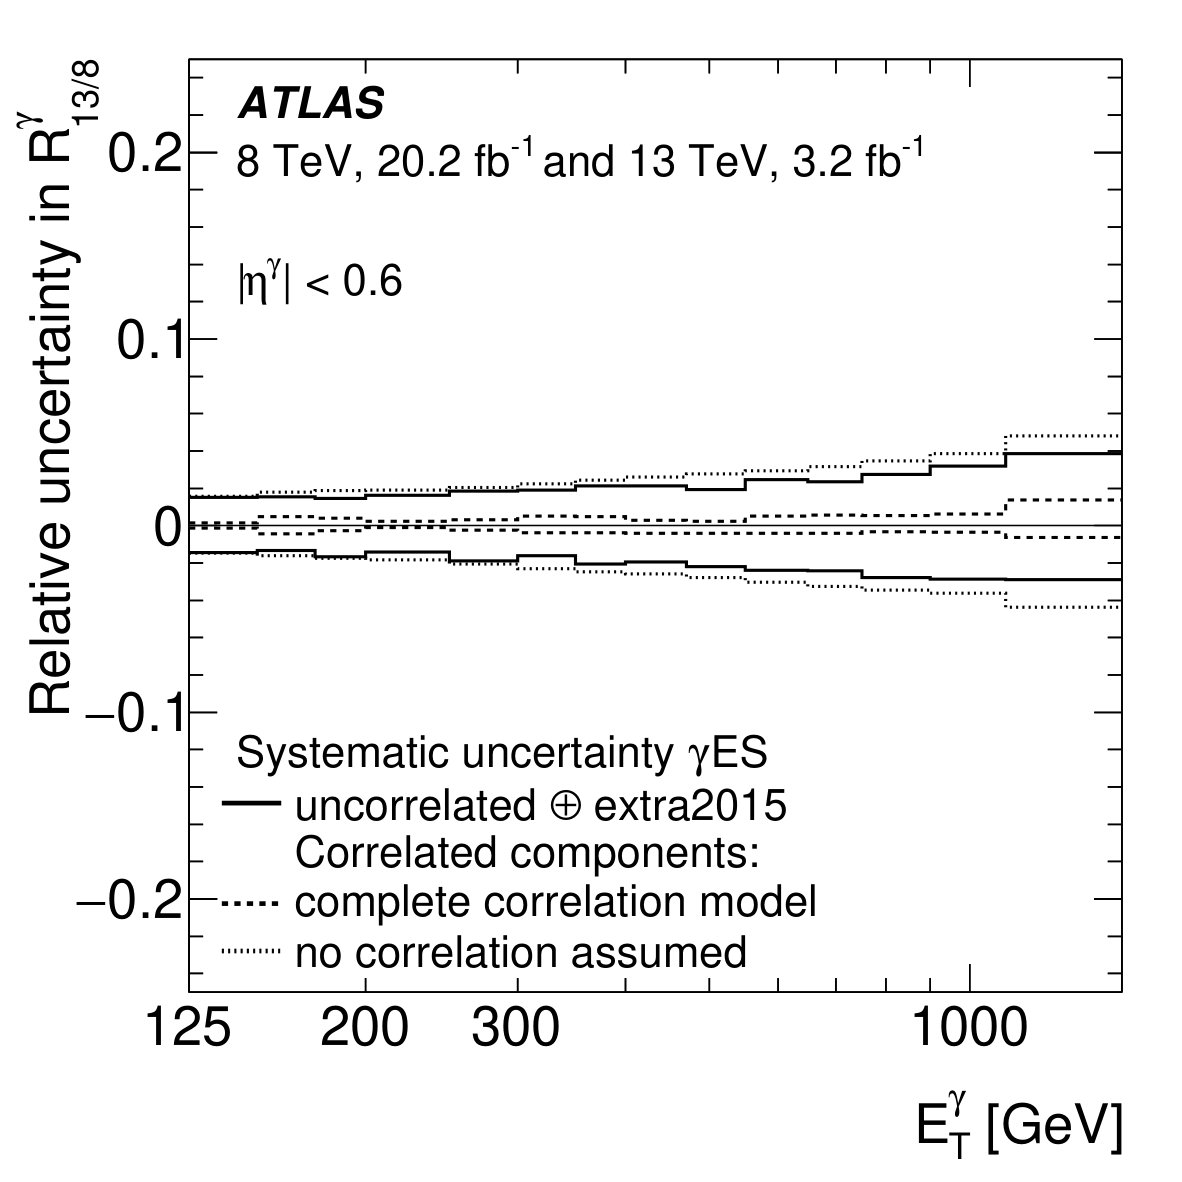 Figure 2
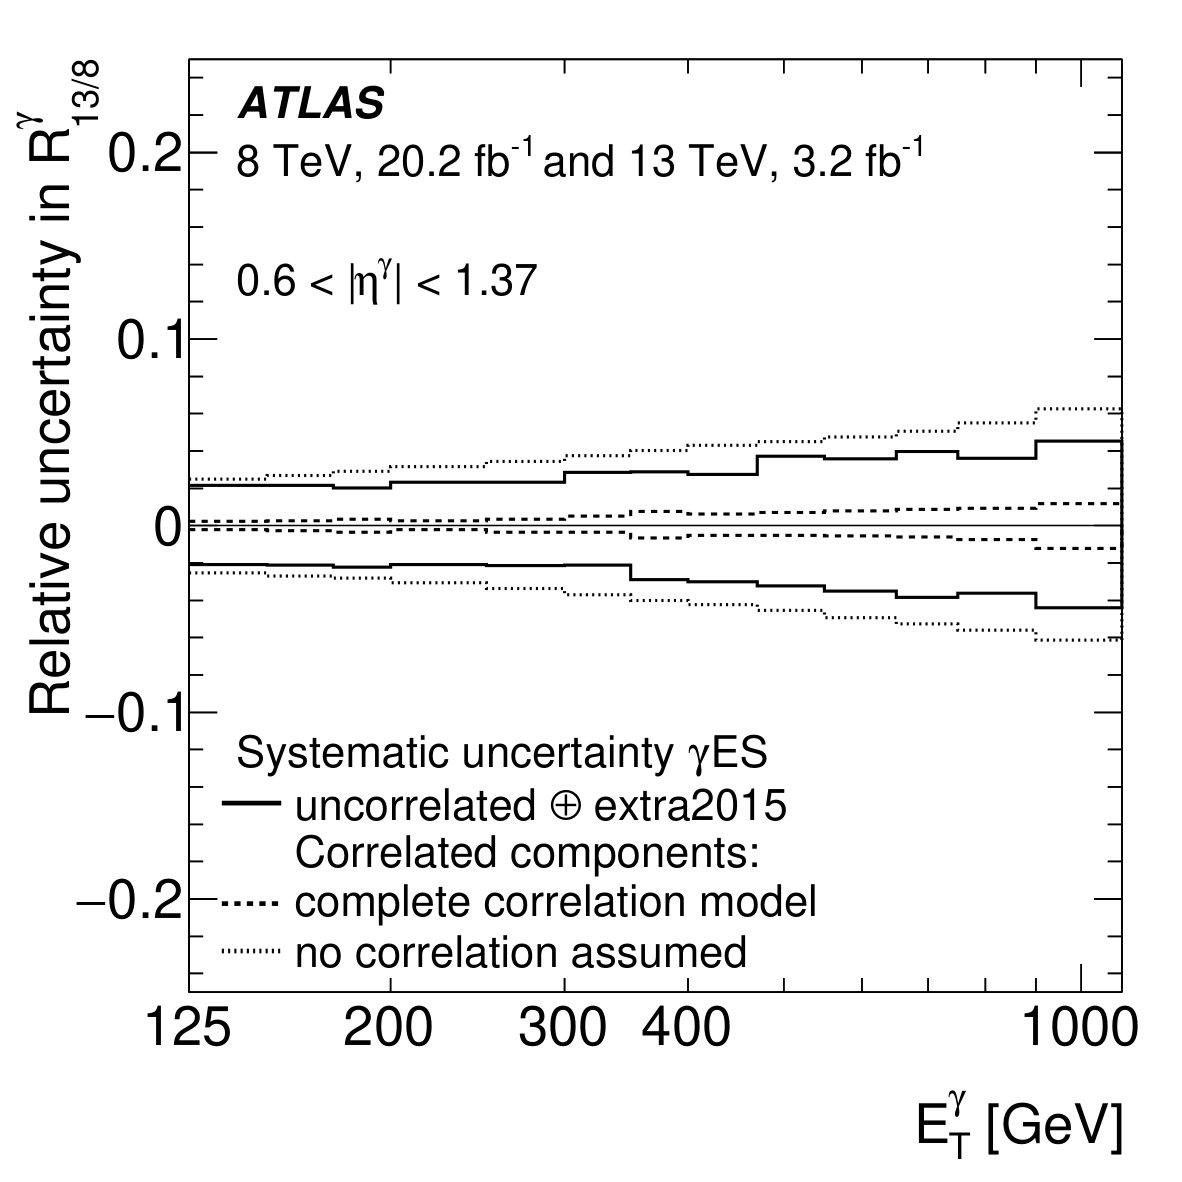 Figure 2
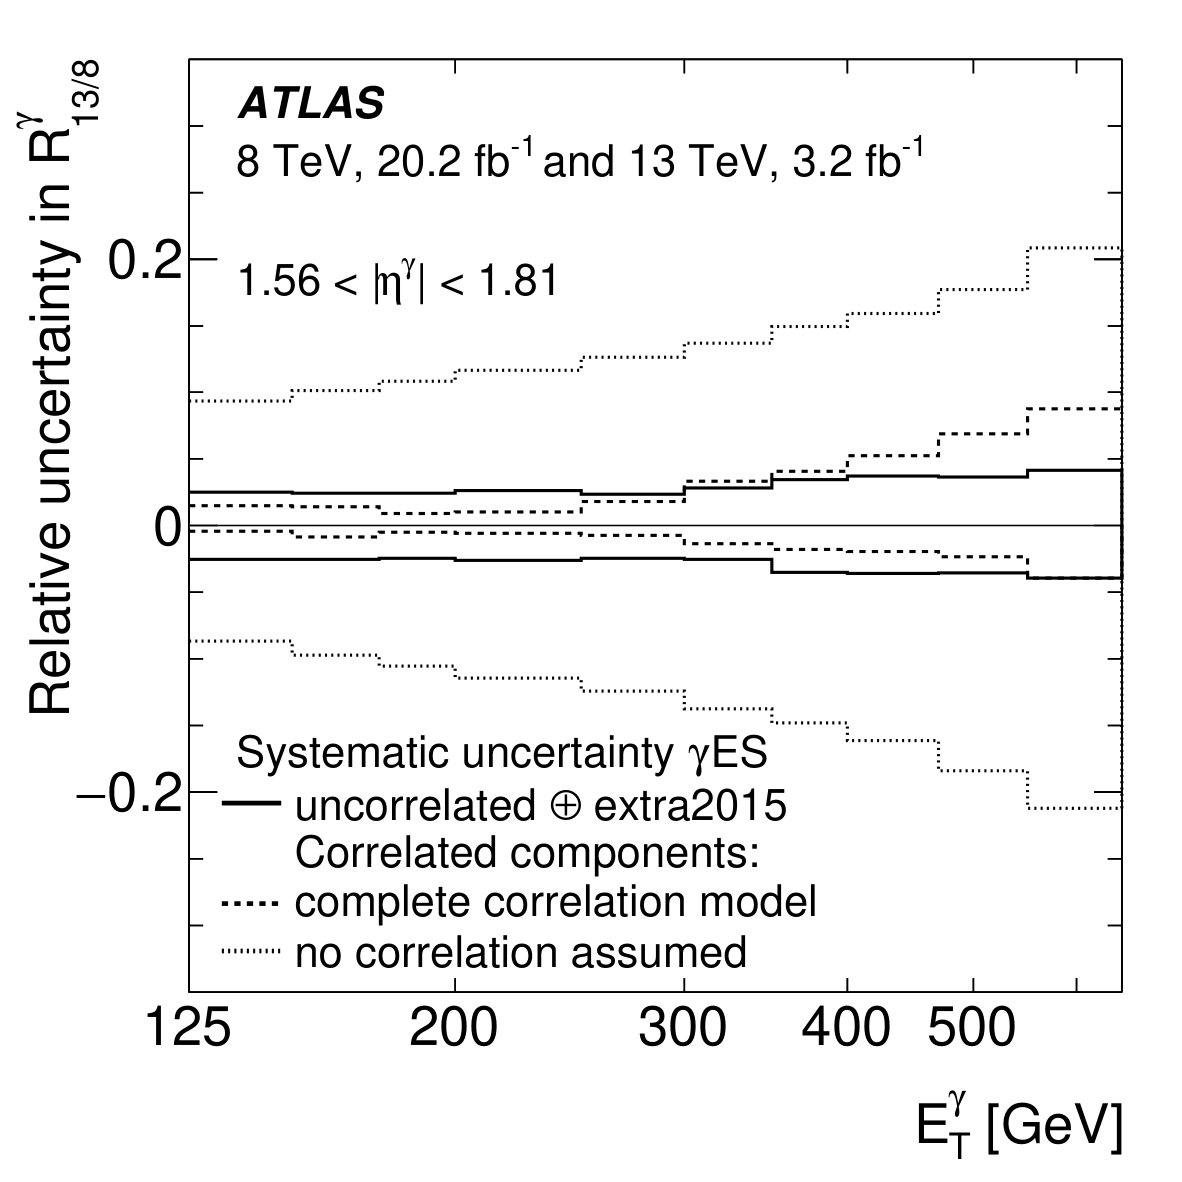 Figure 2
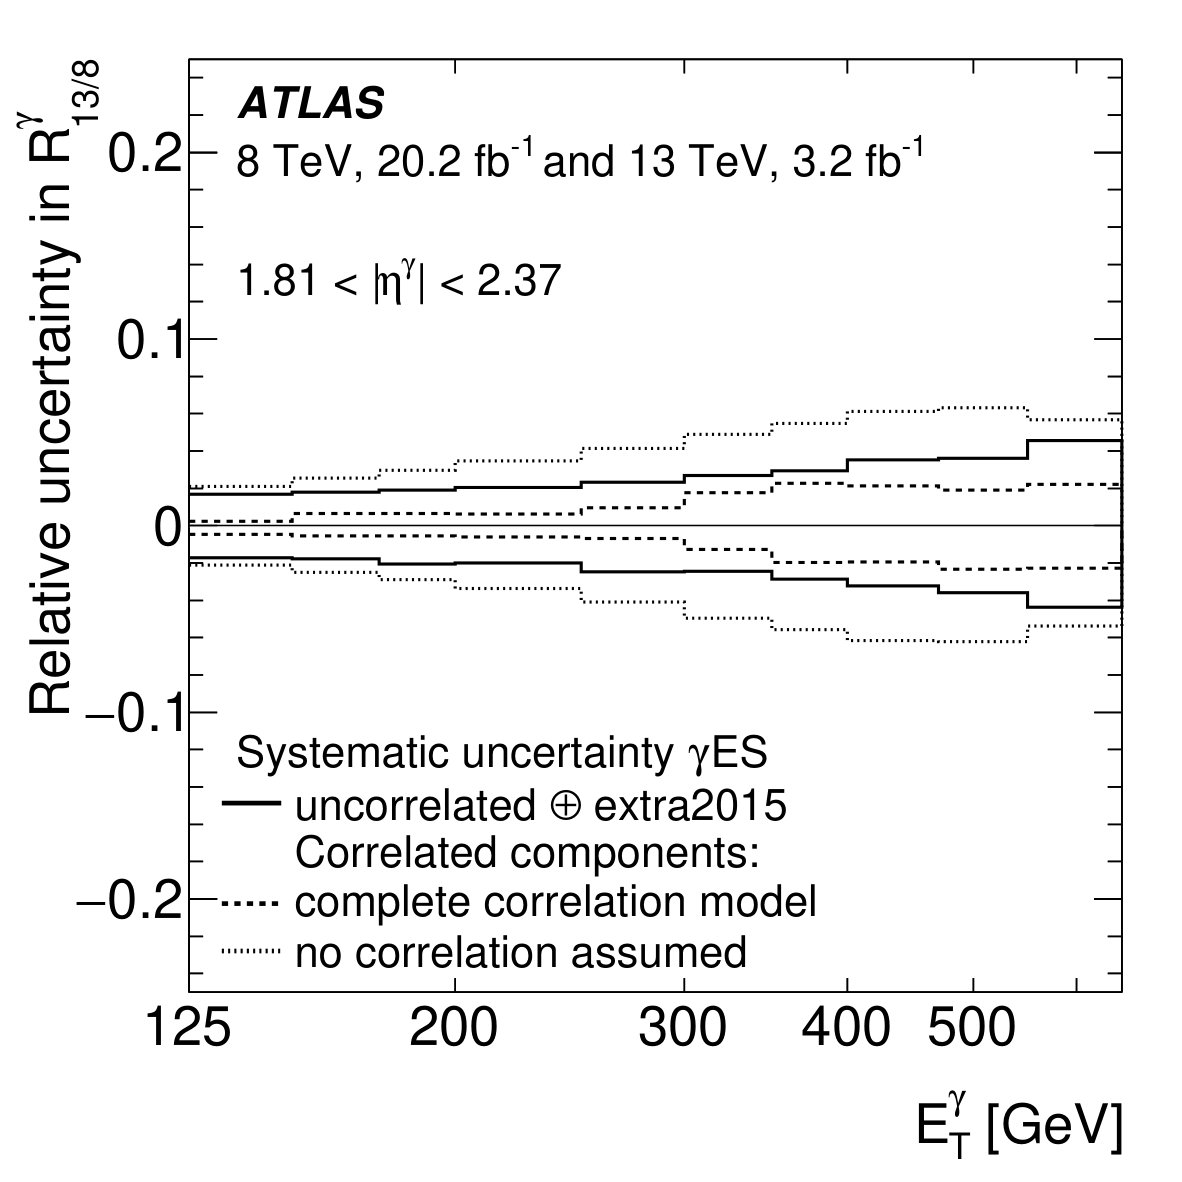 Figure 2
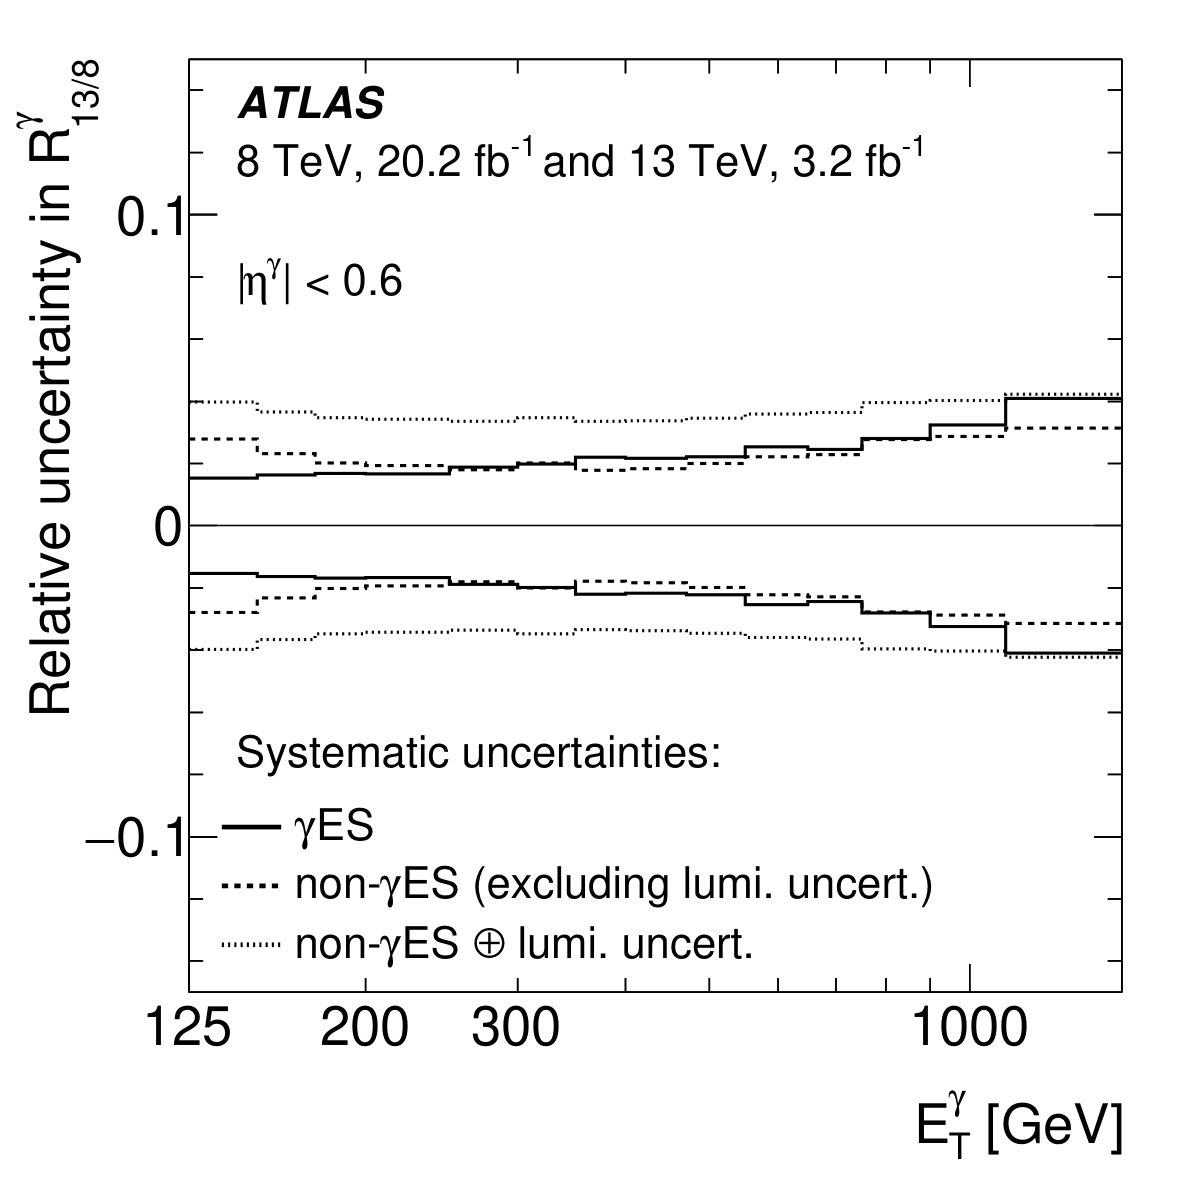 Figure 3
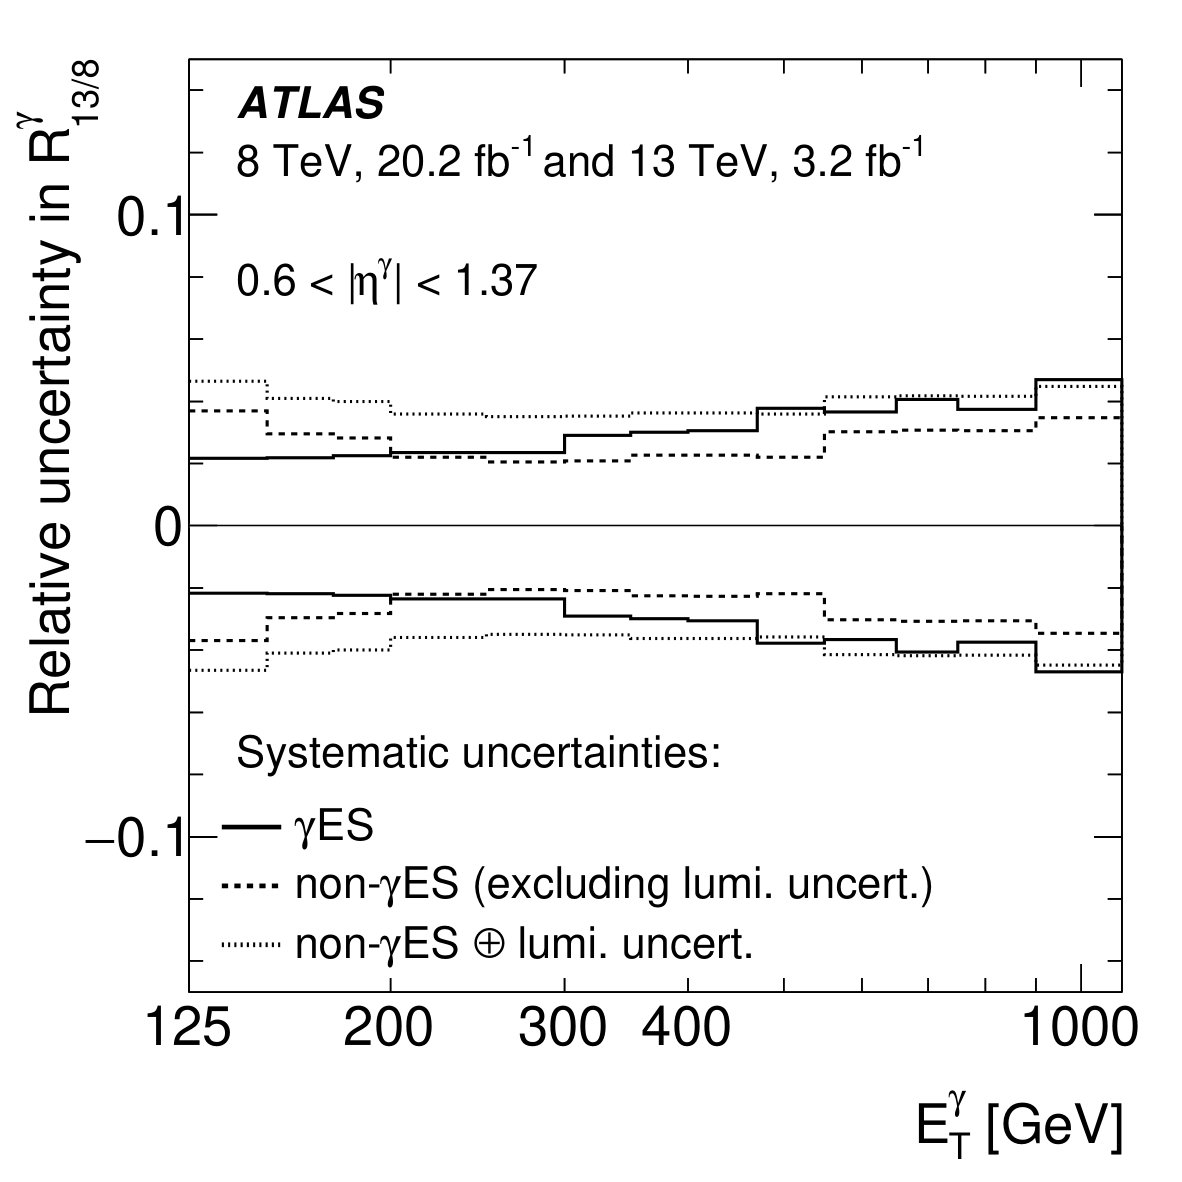 Figure 3
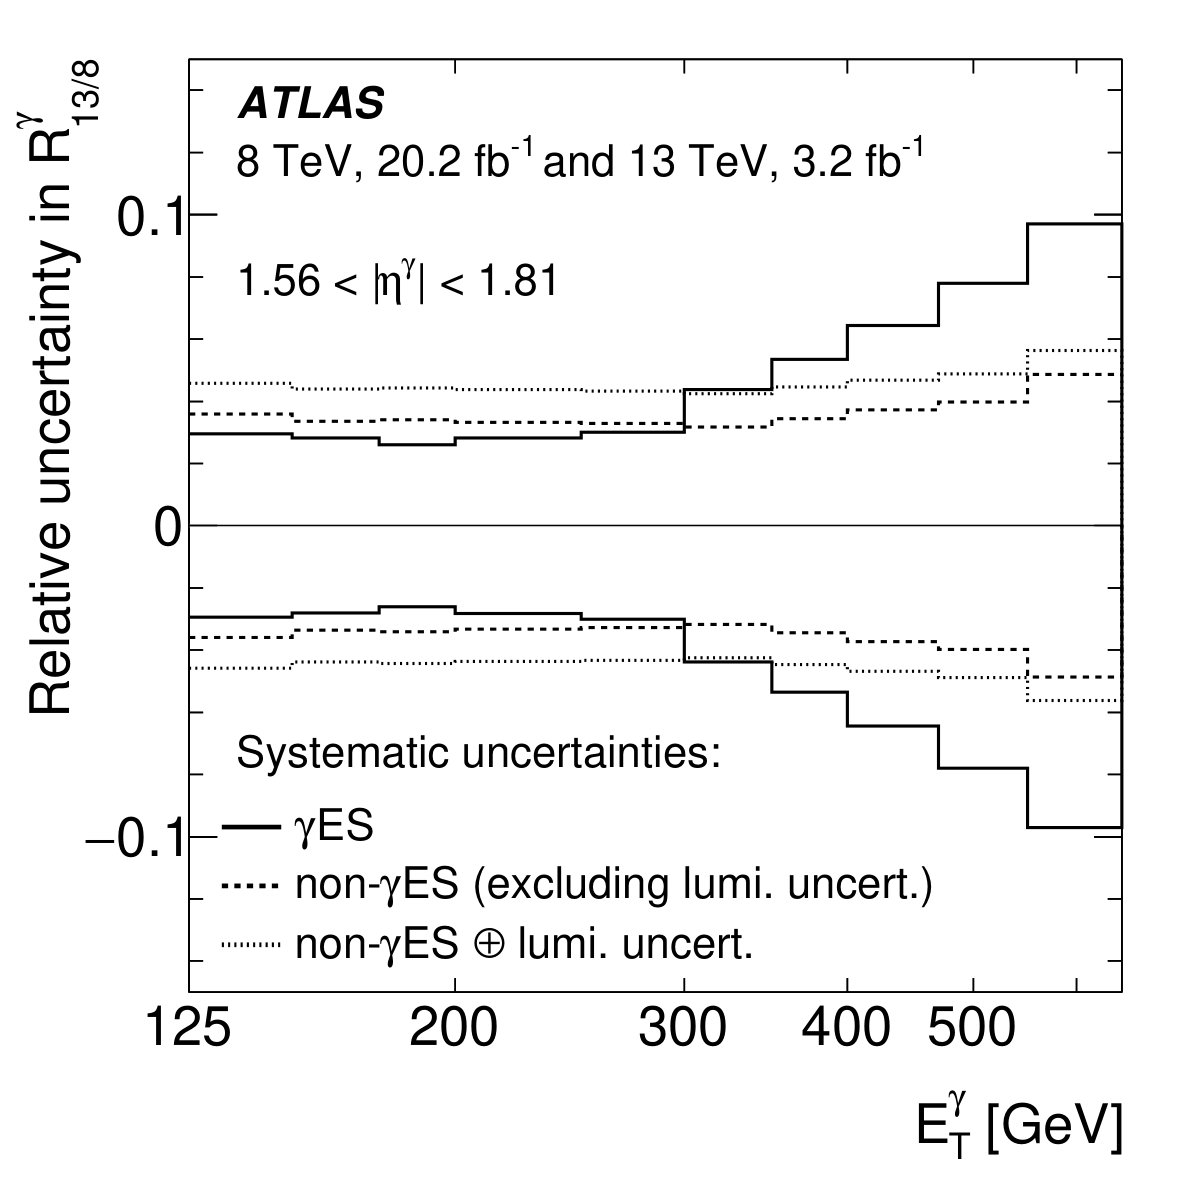 Figure 3
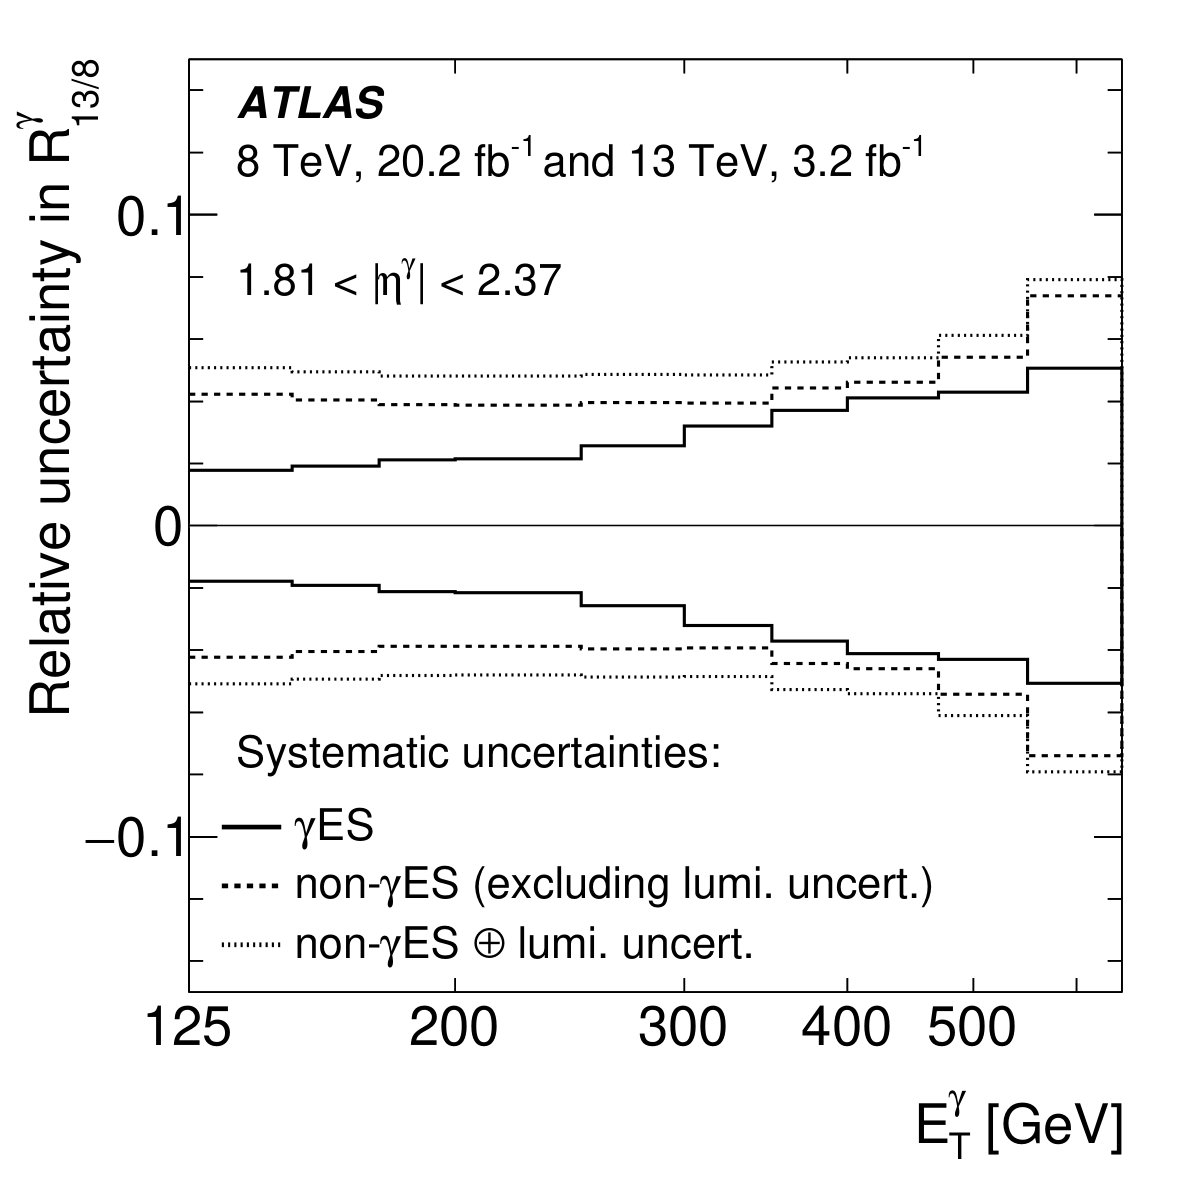 Figure 3
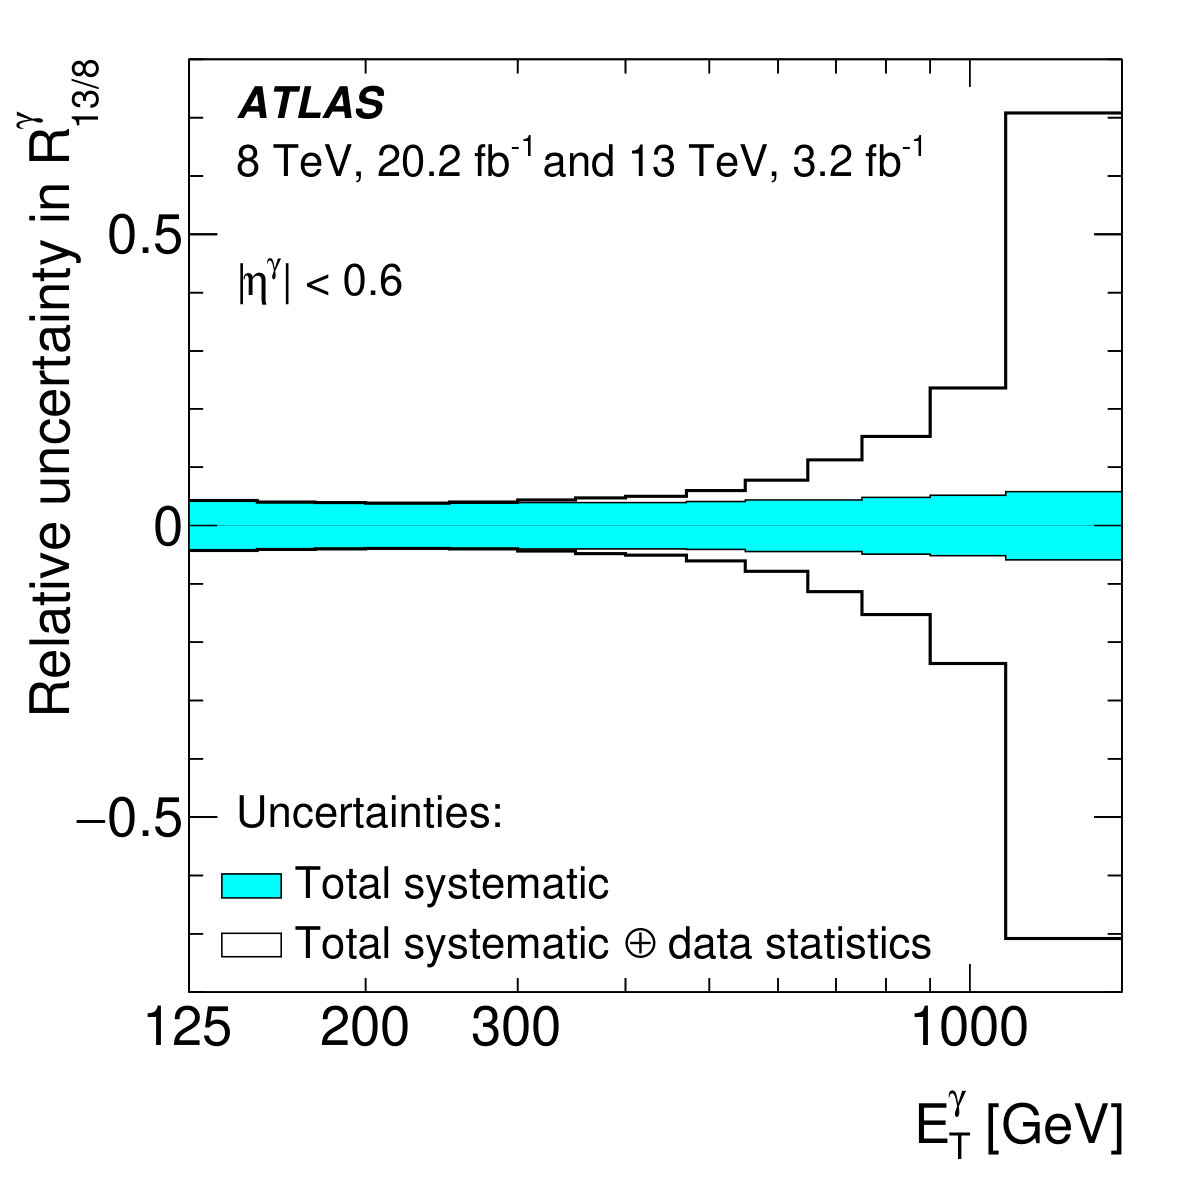 Figure 4
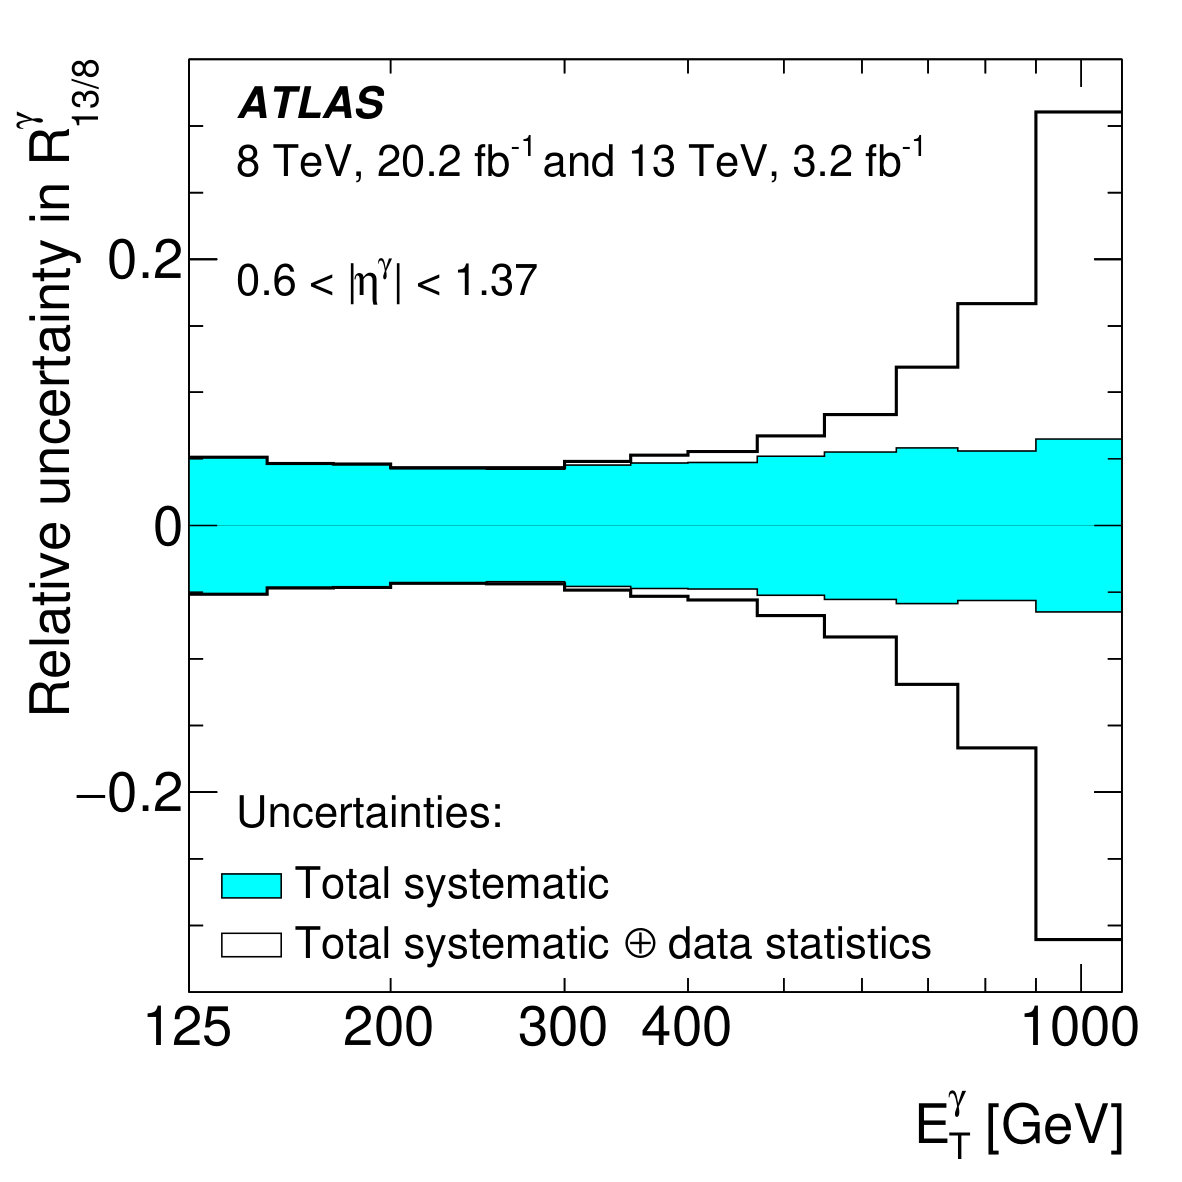 Figure 4
 Figure 4
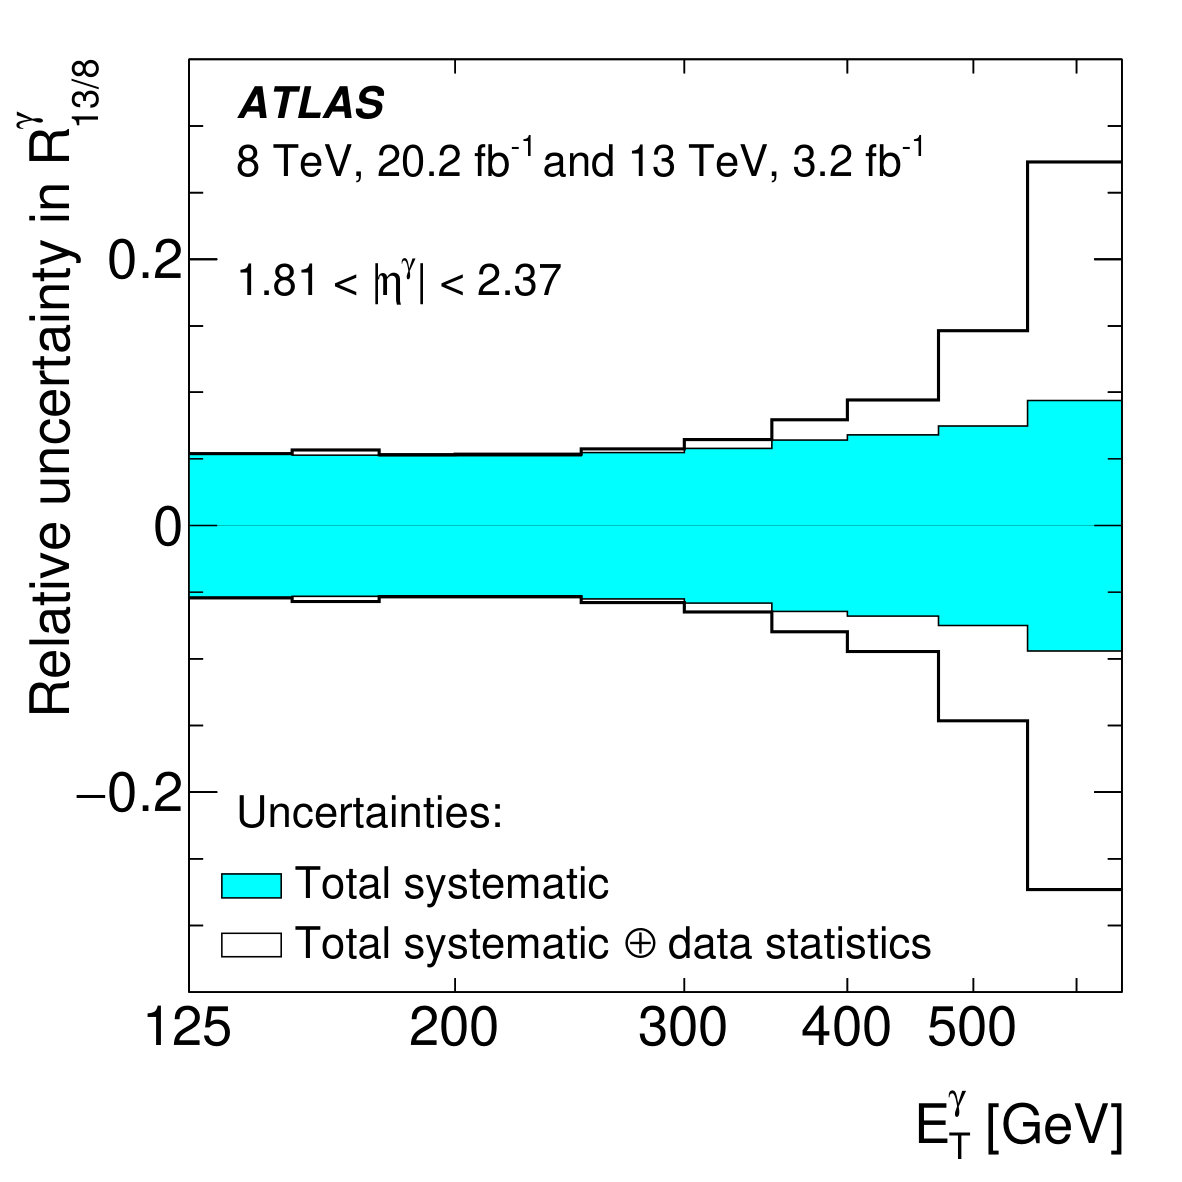 Figure 4
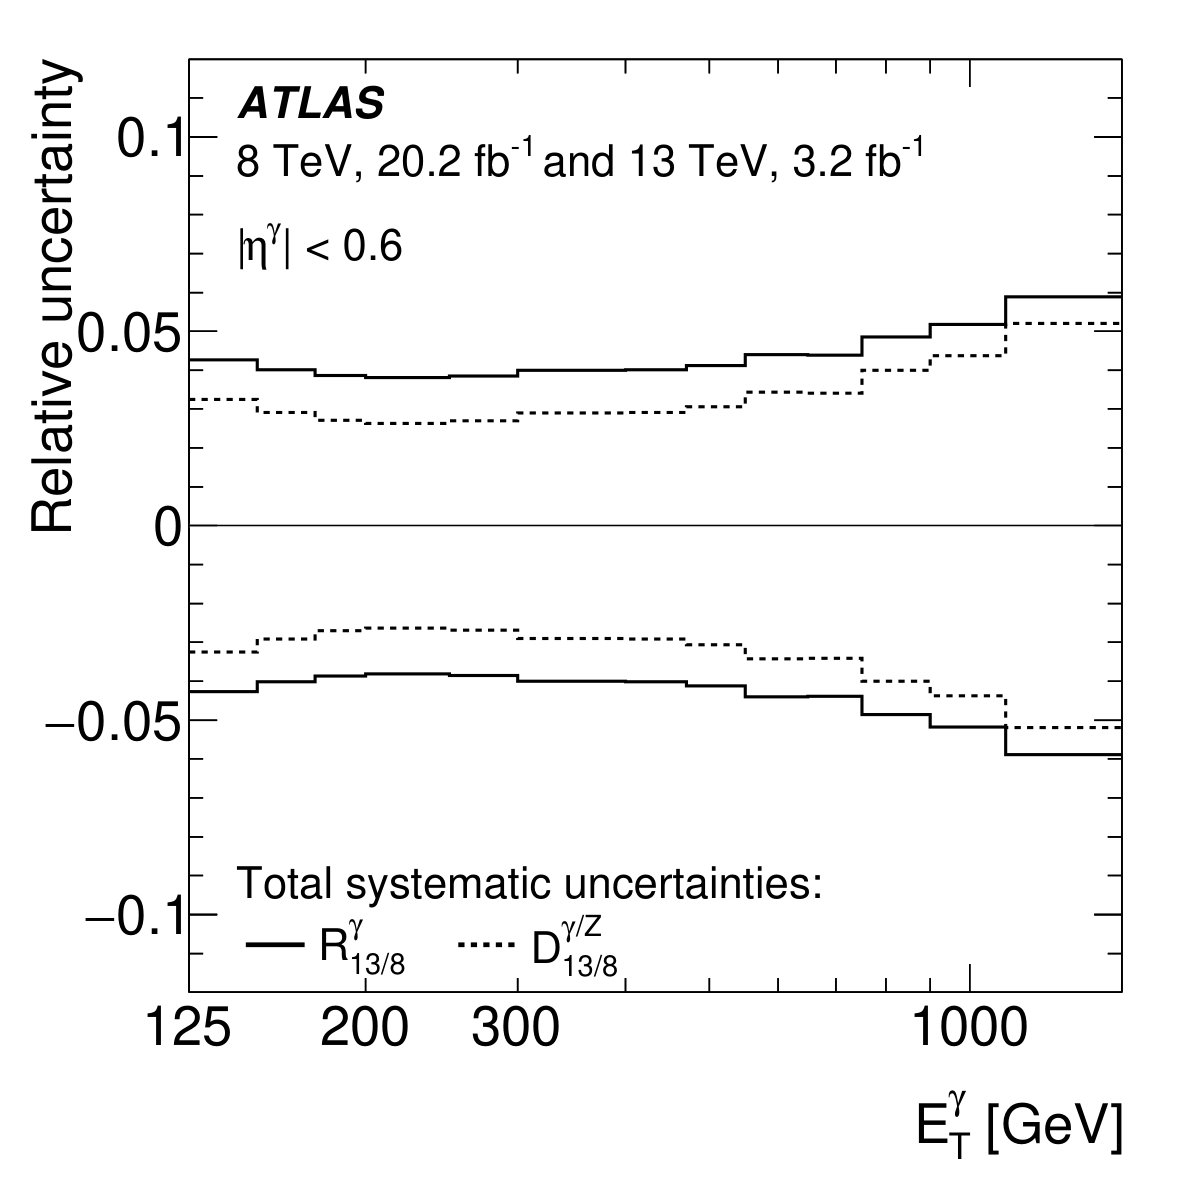 Figure 5
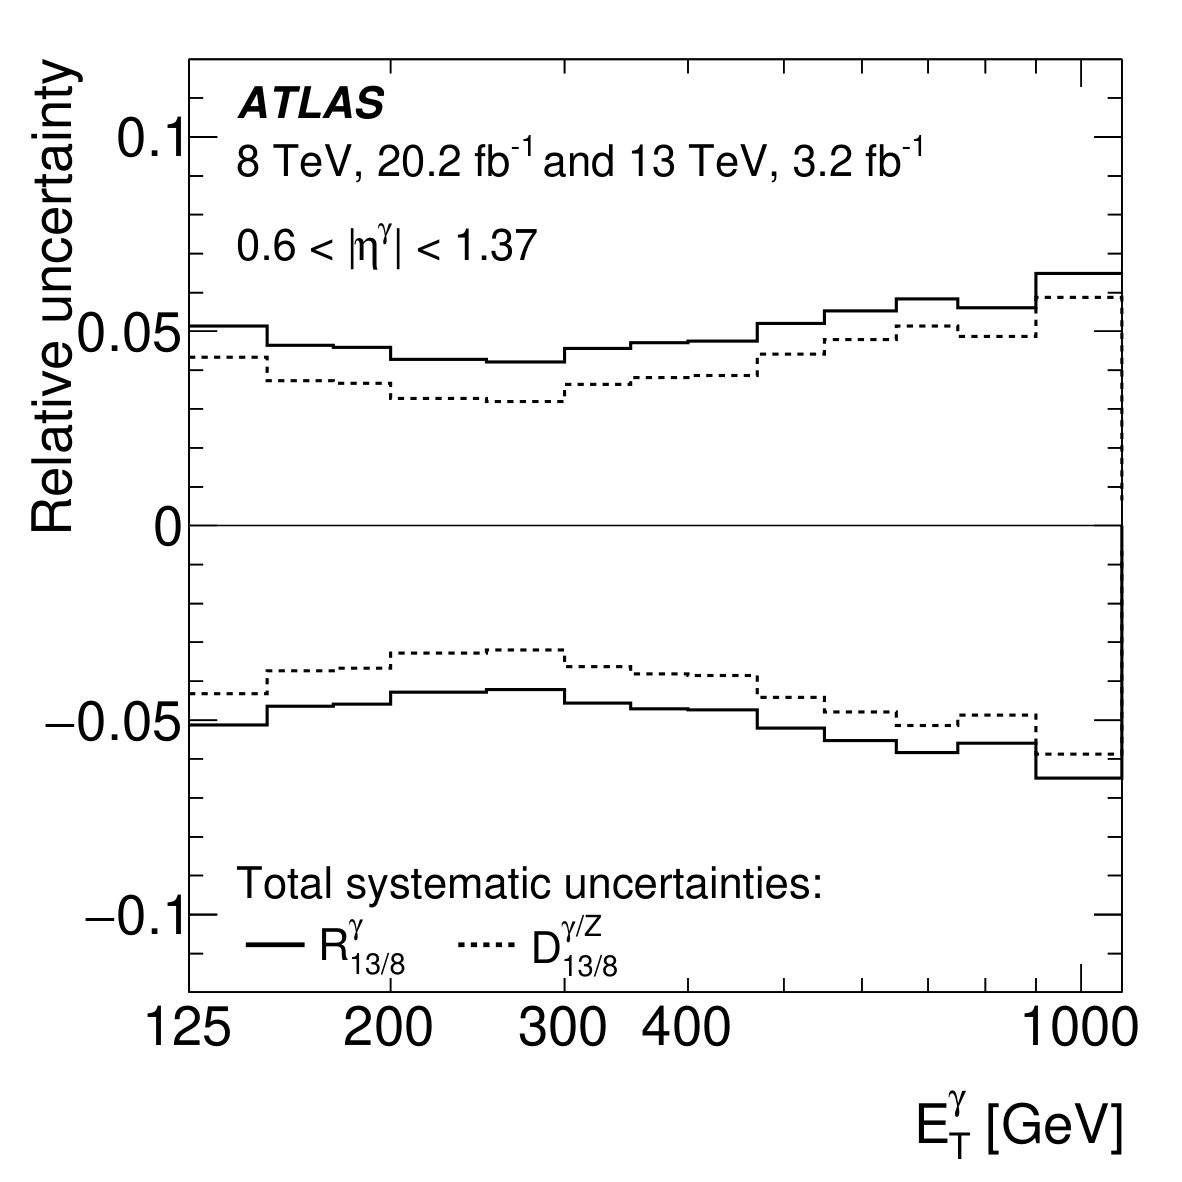 Figure 5
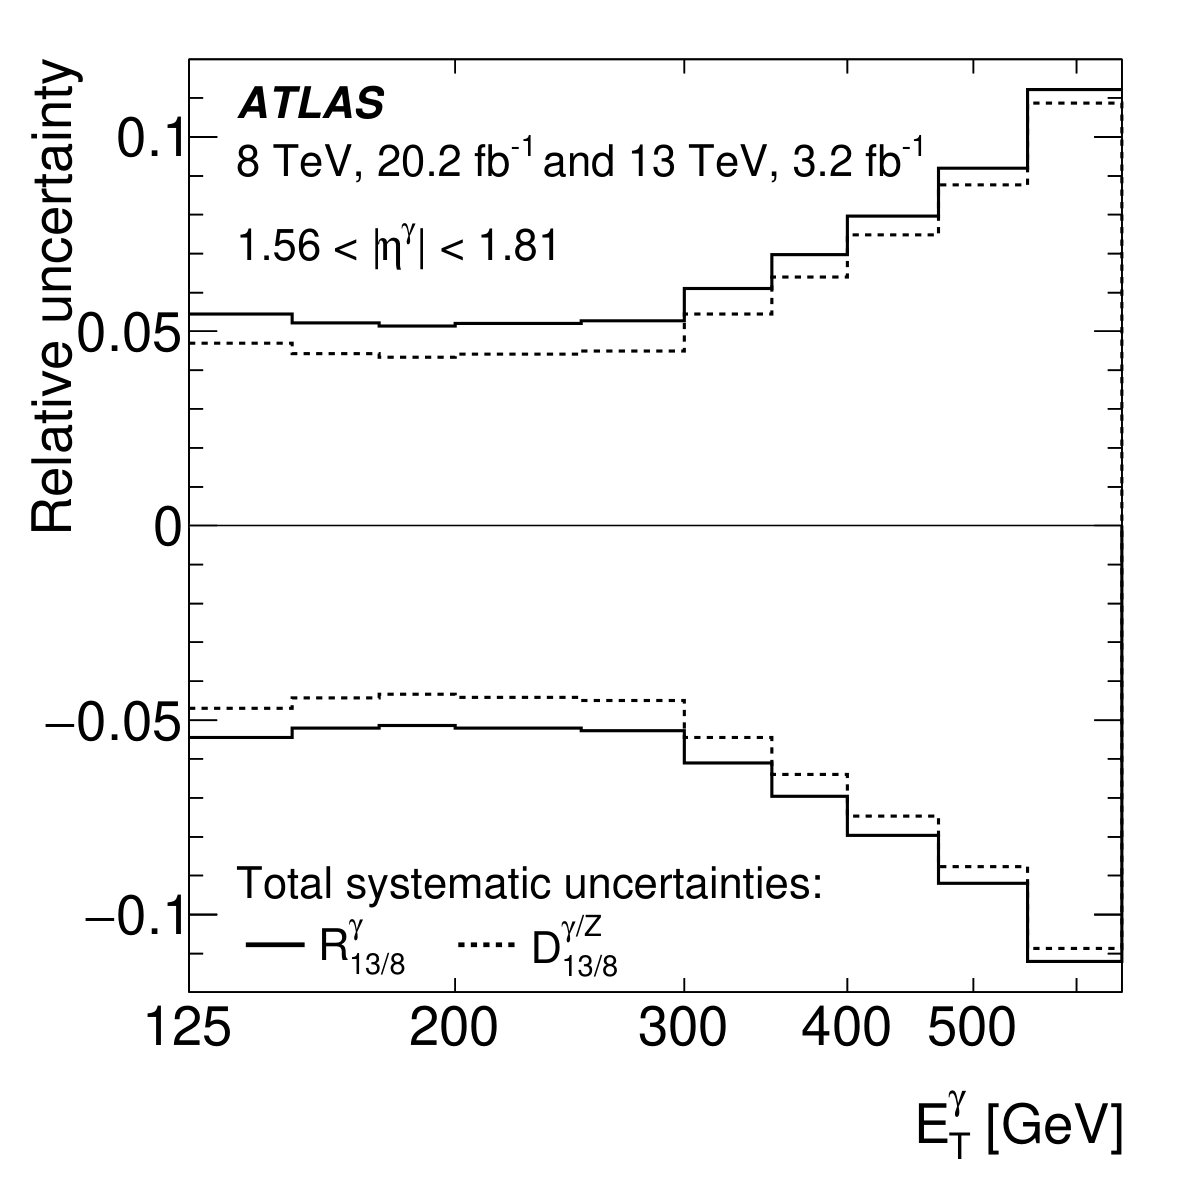 Figure 5
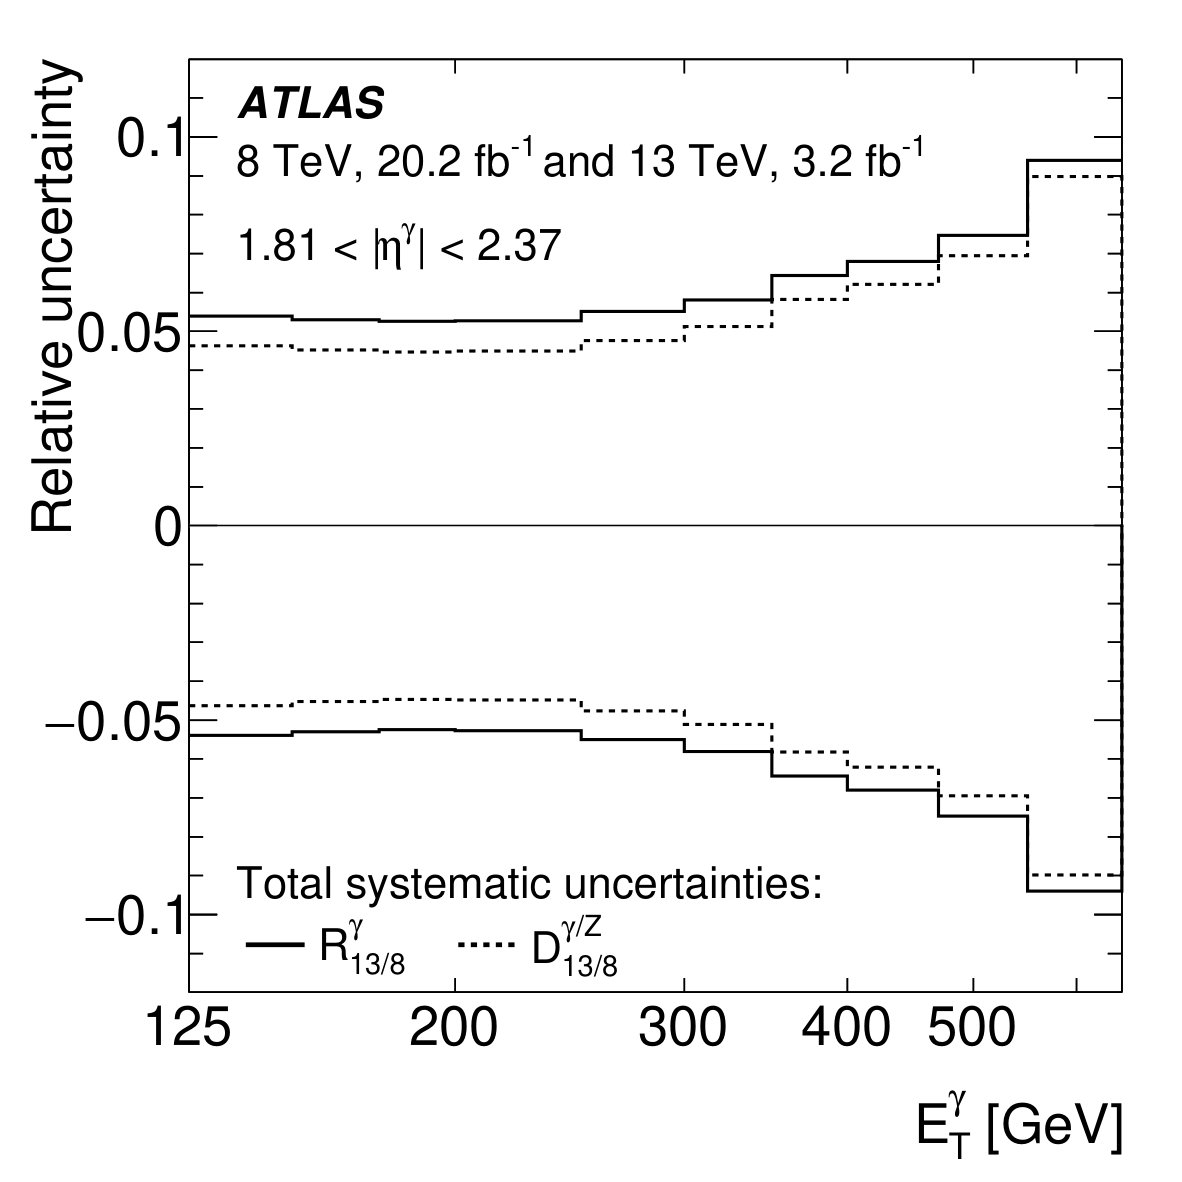 Figure 5
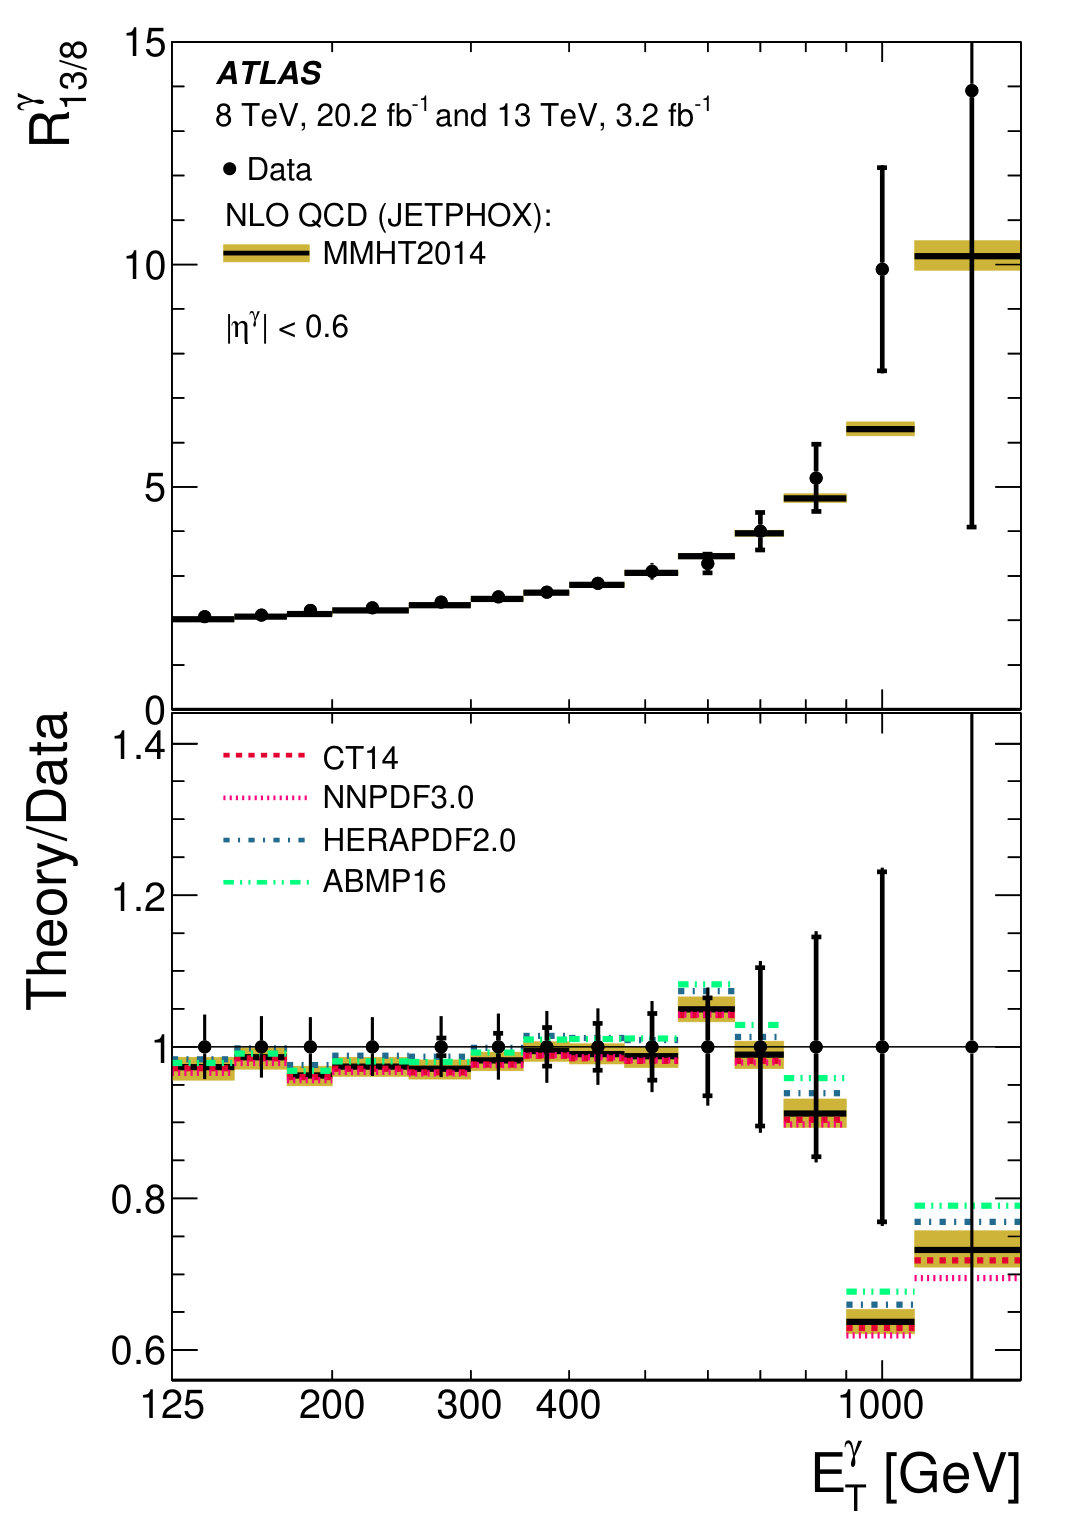 Figure 6
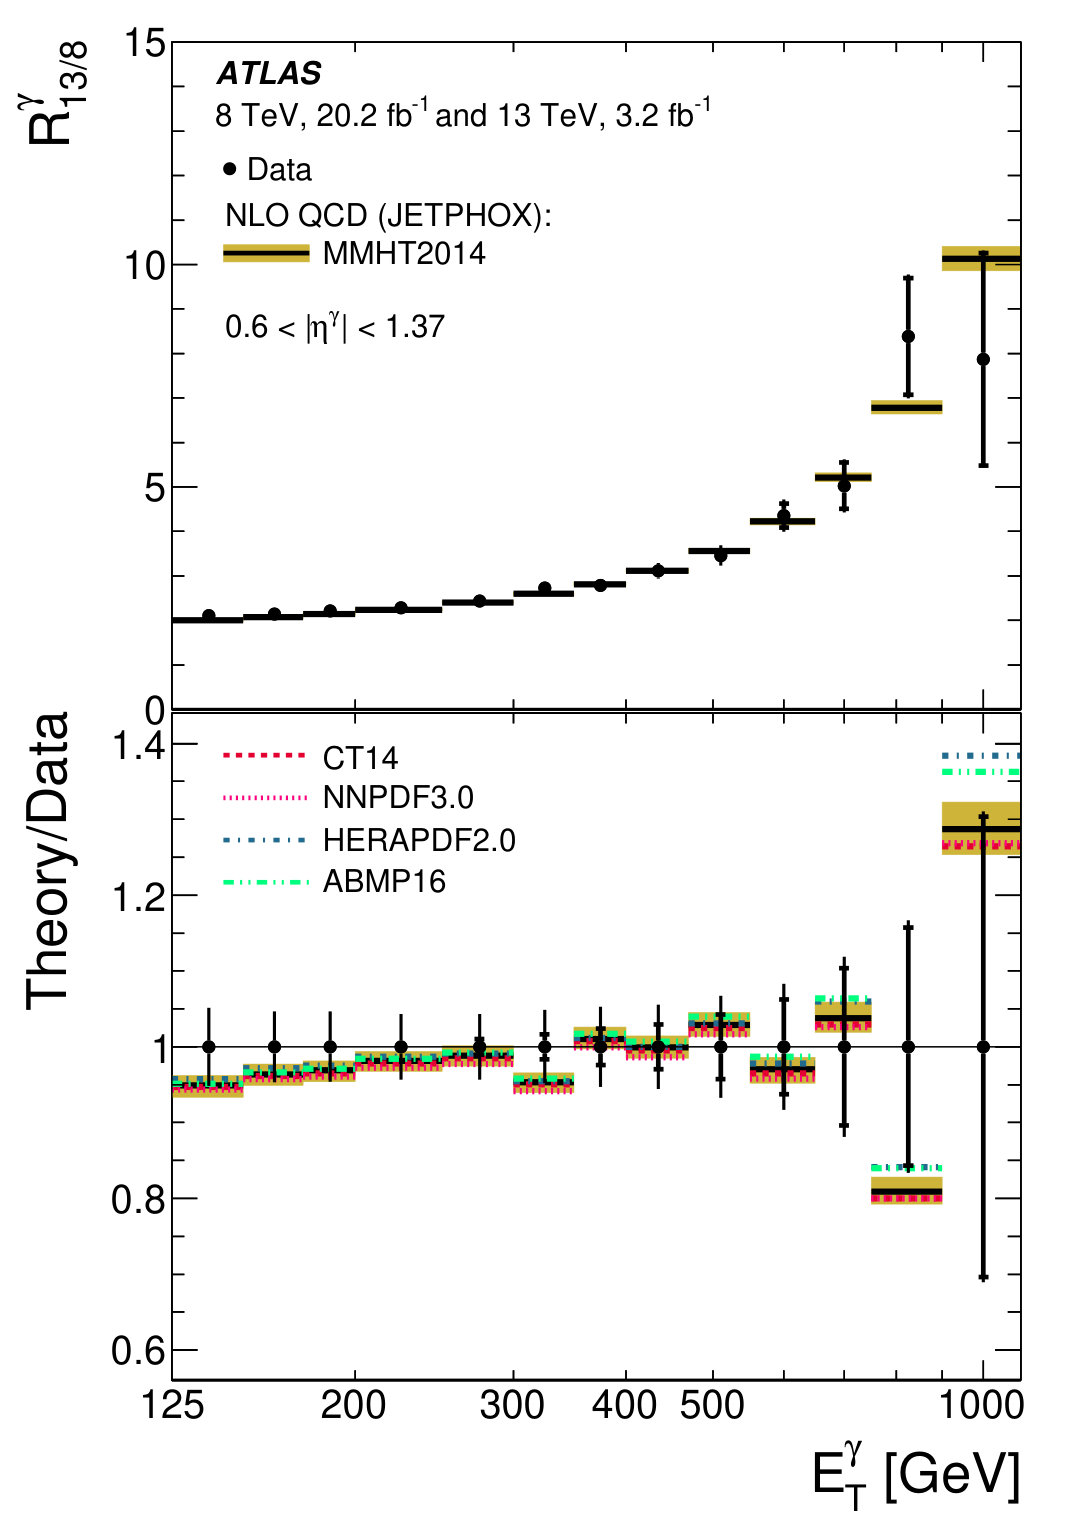 Figure 6
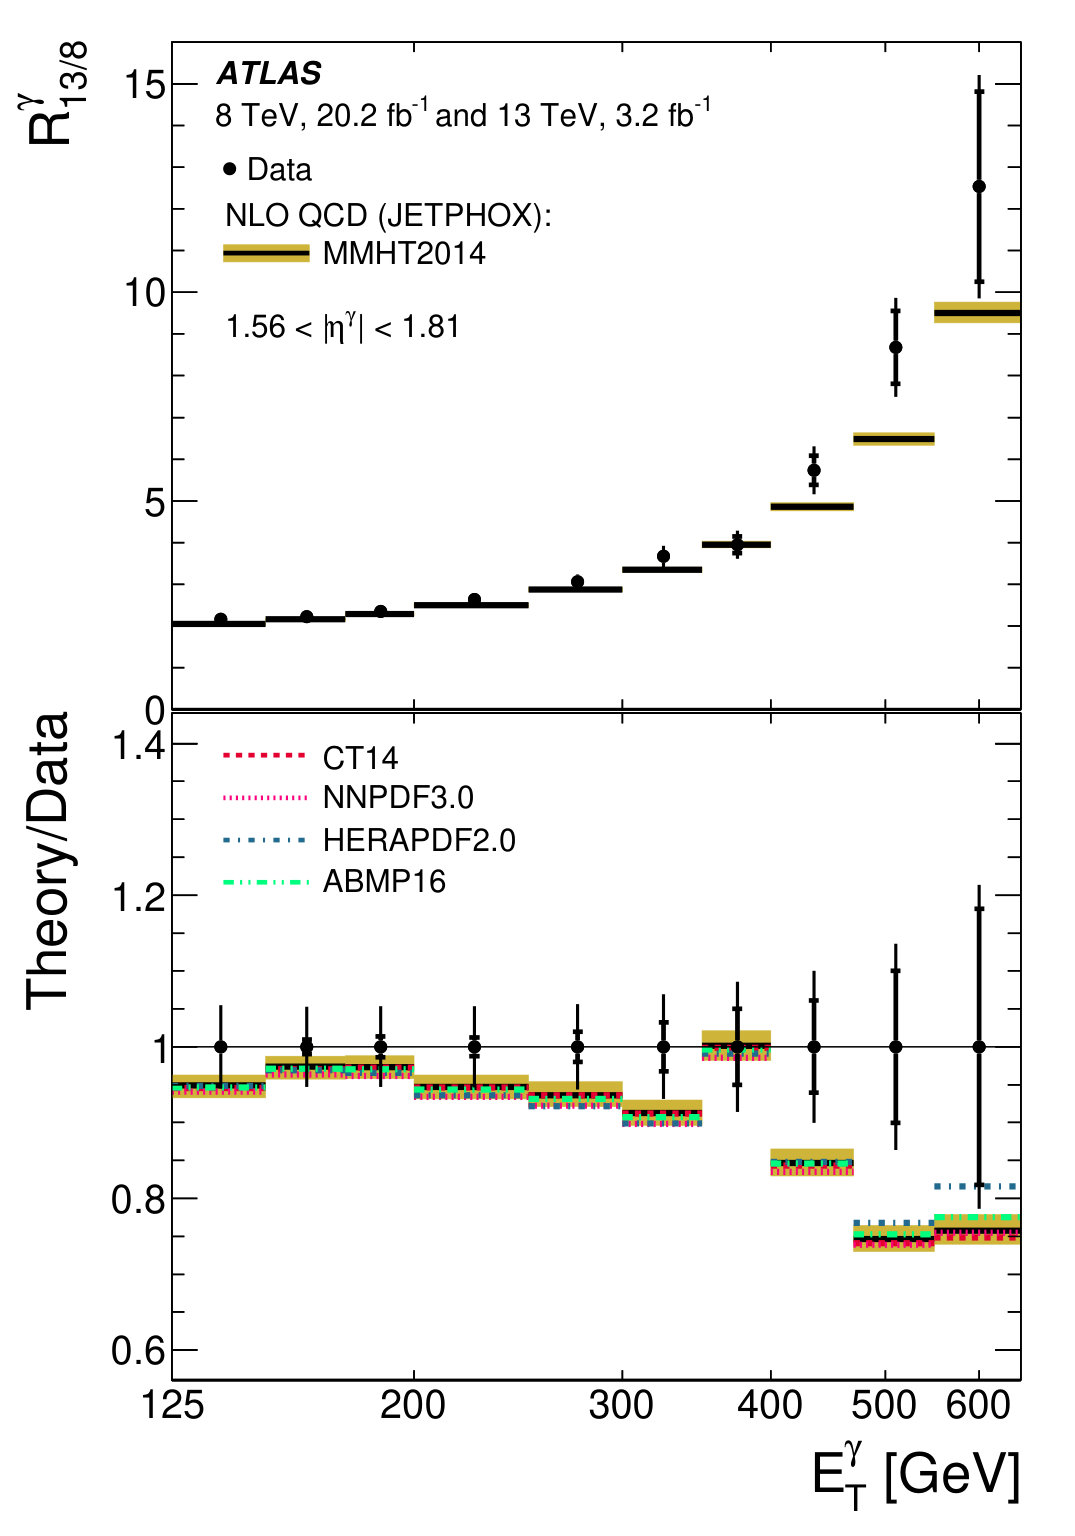 Figure 7
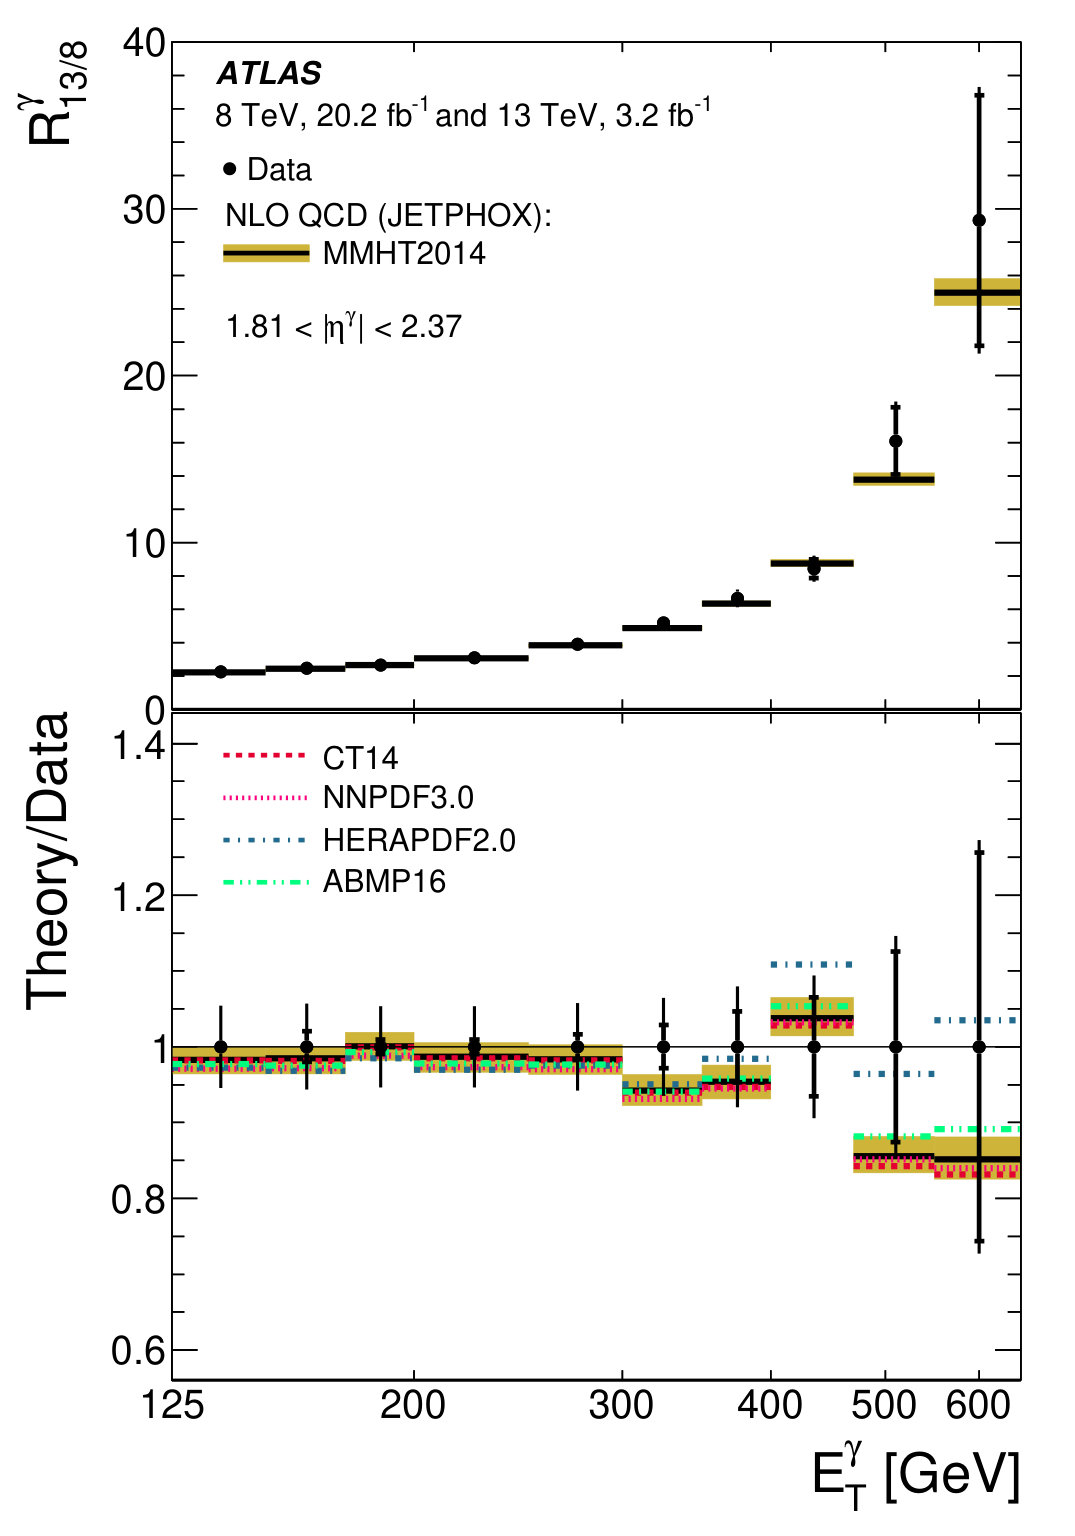 Figure 7
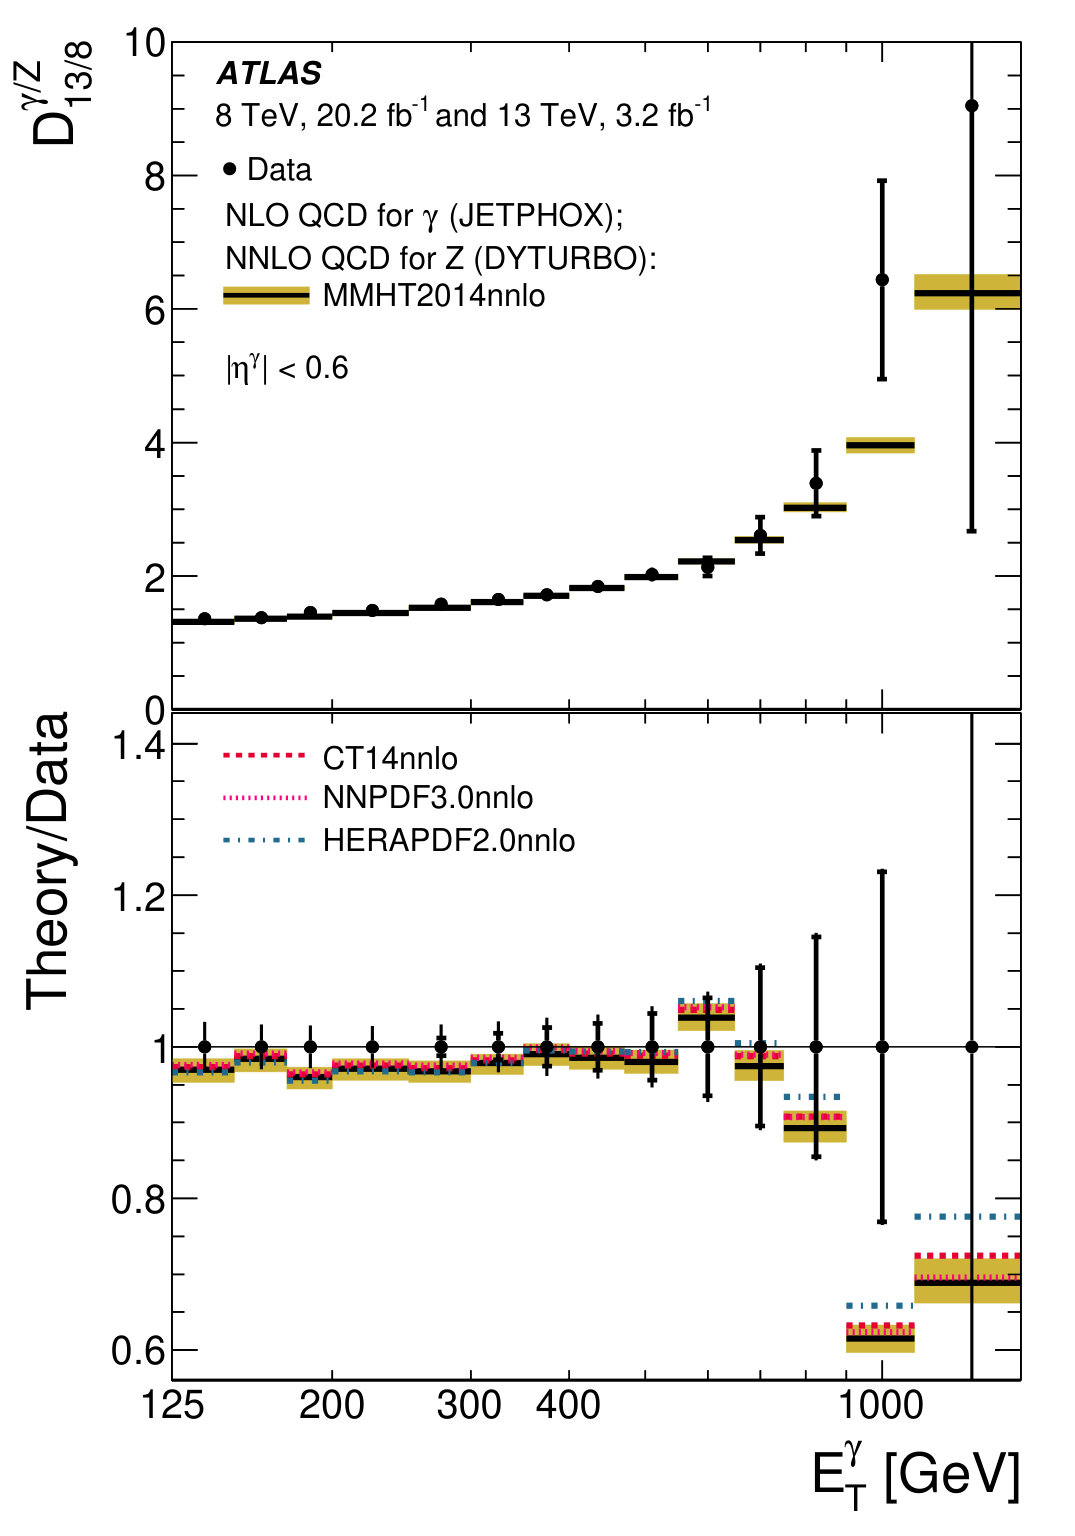 Figure 8
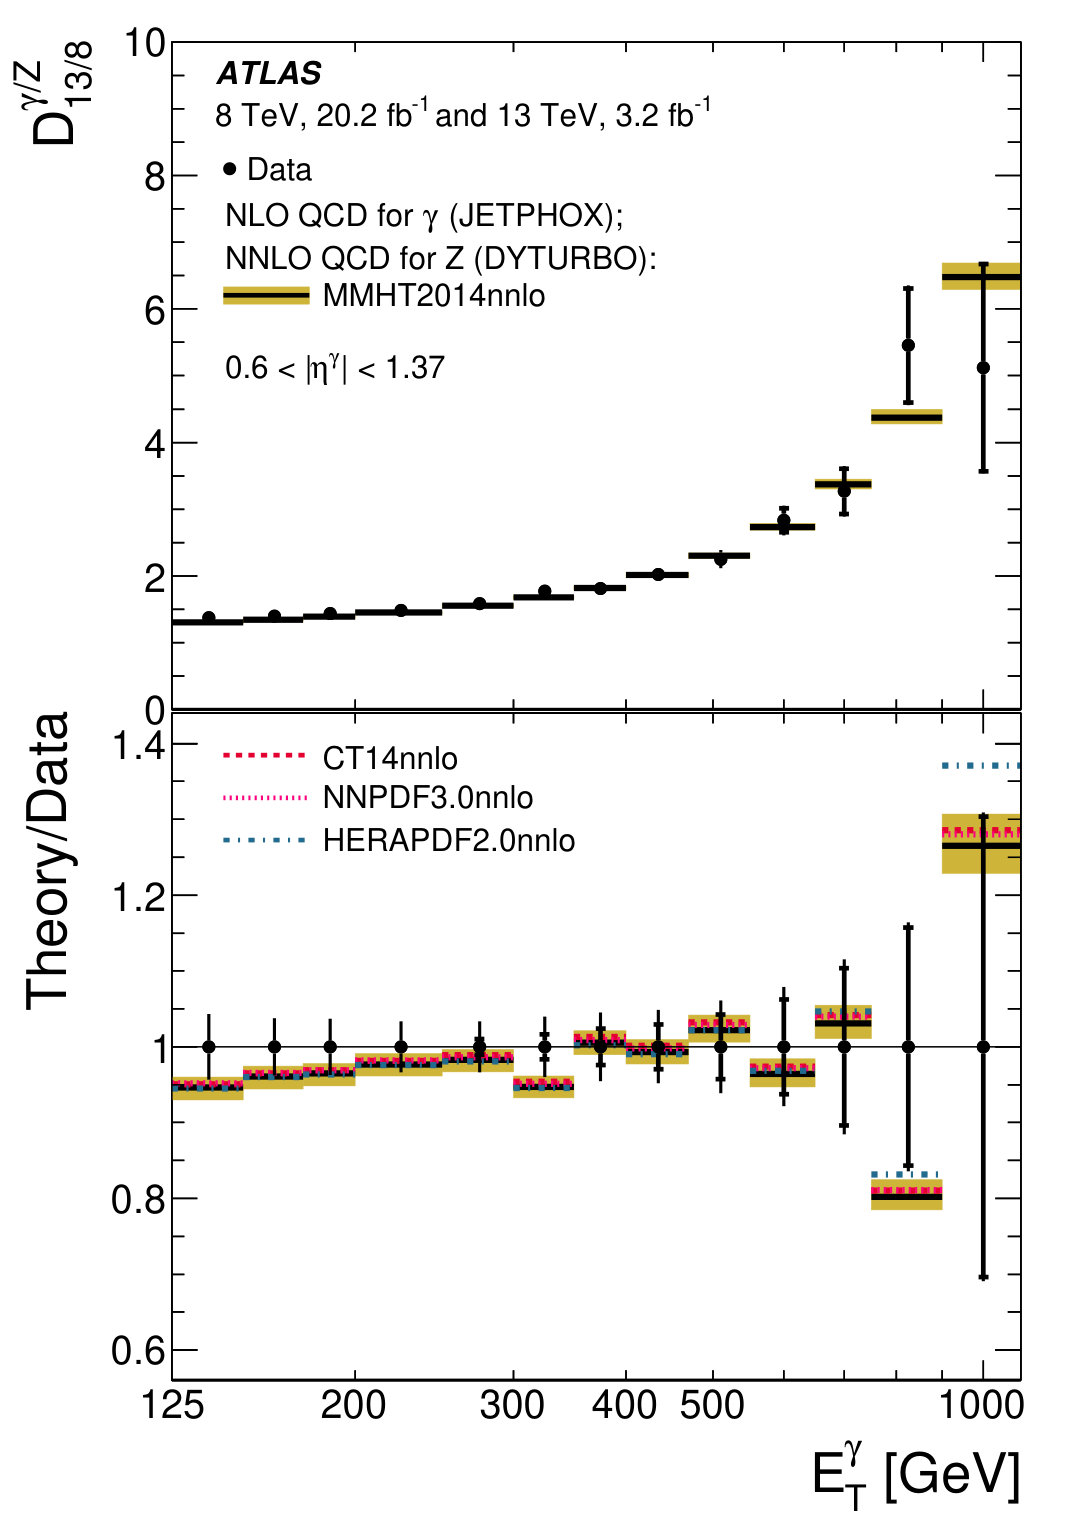 Figure 8
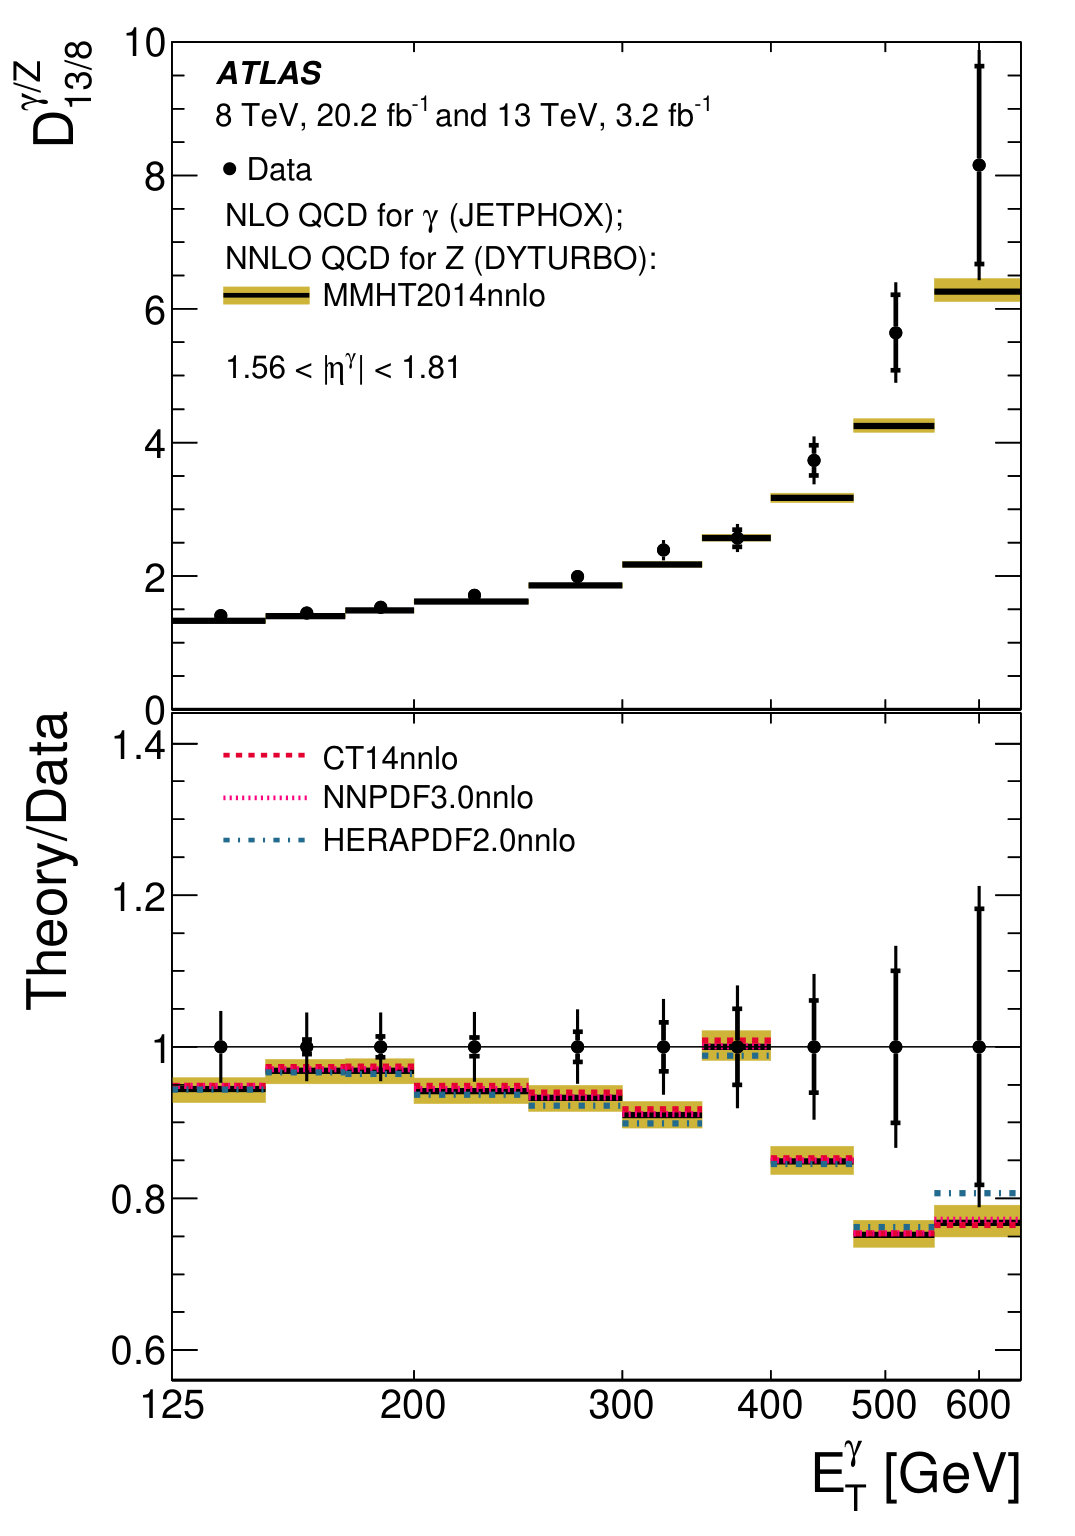 Figure 9
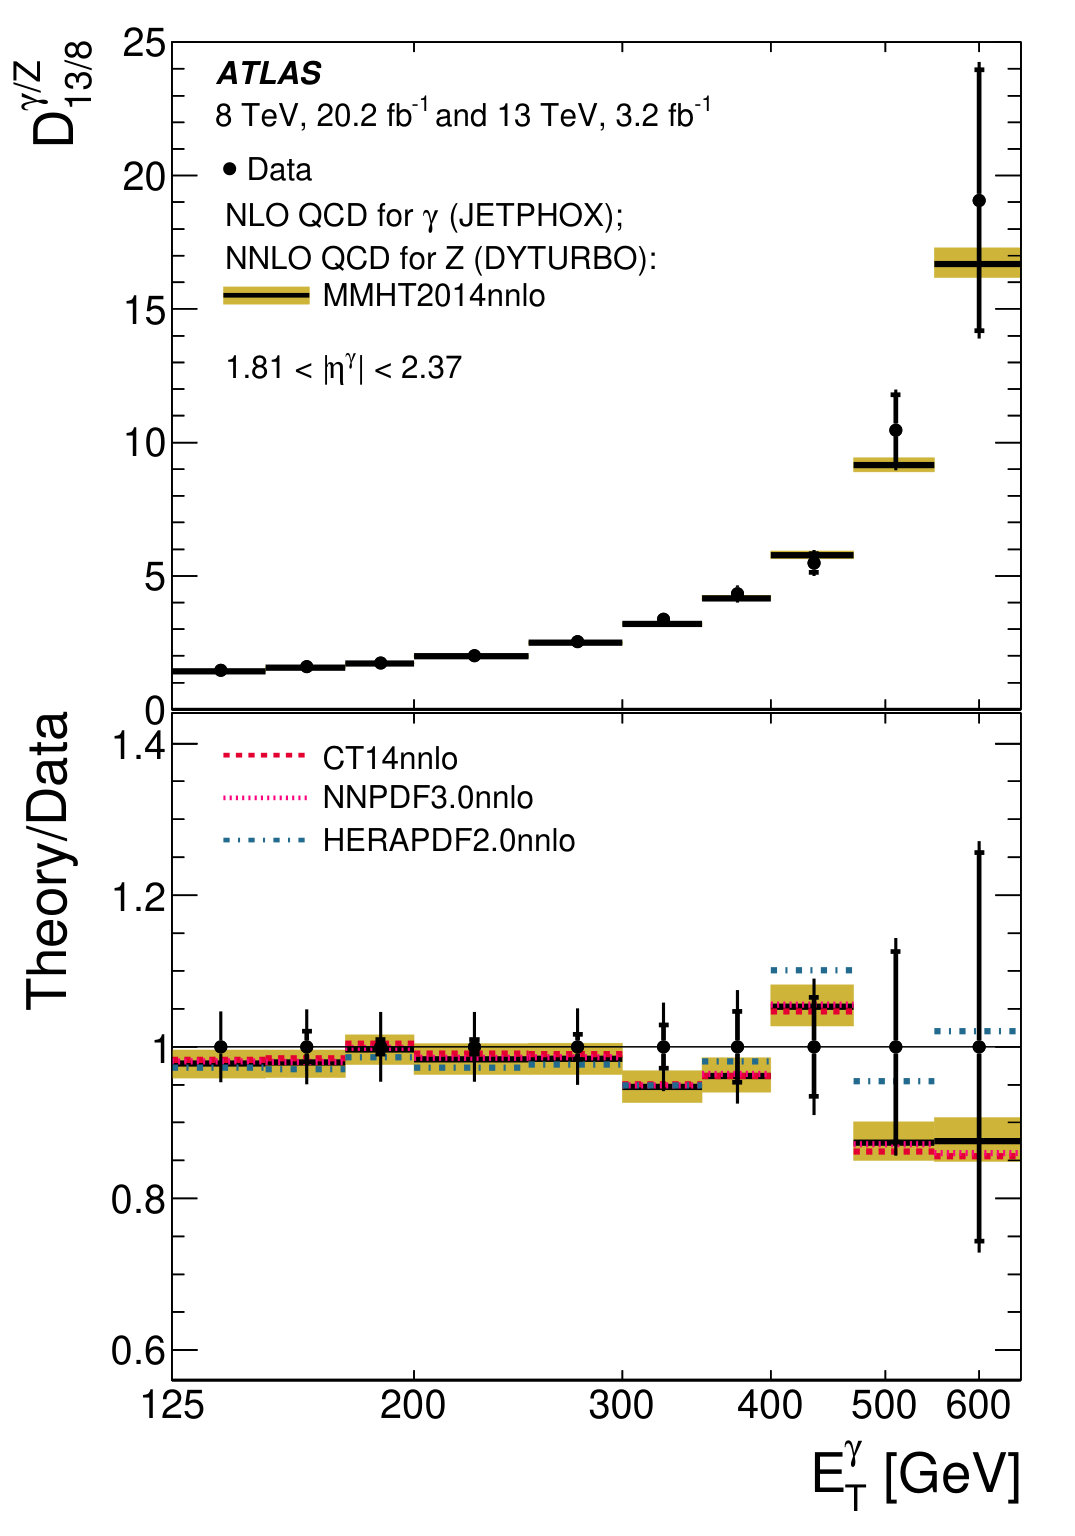 Figure 9
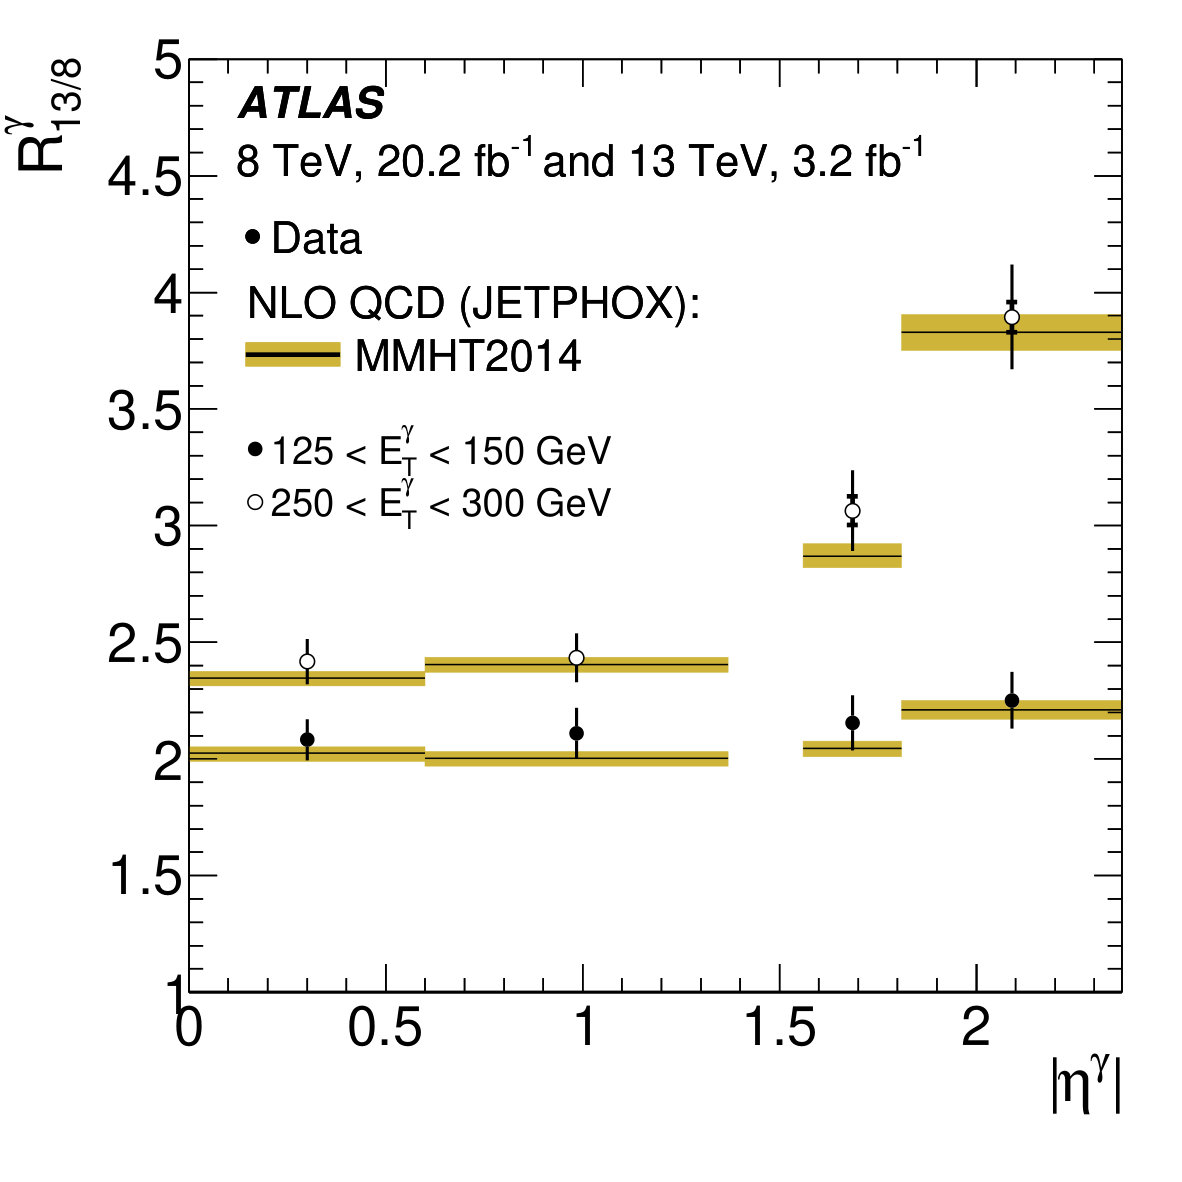 Figure 29
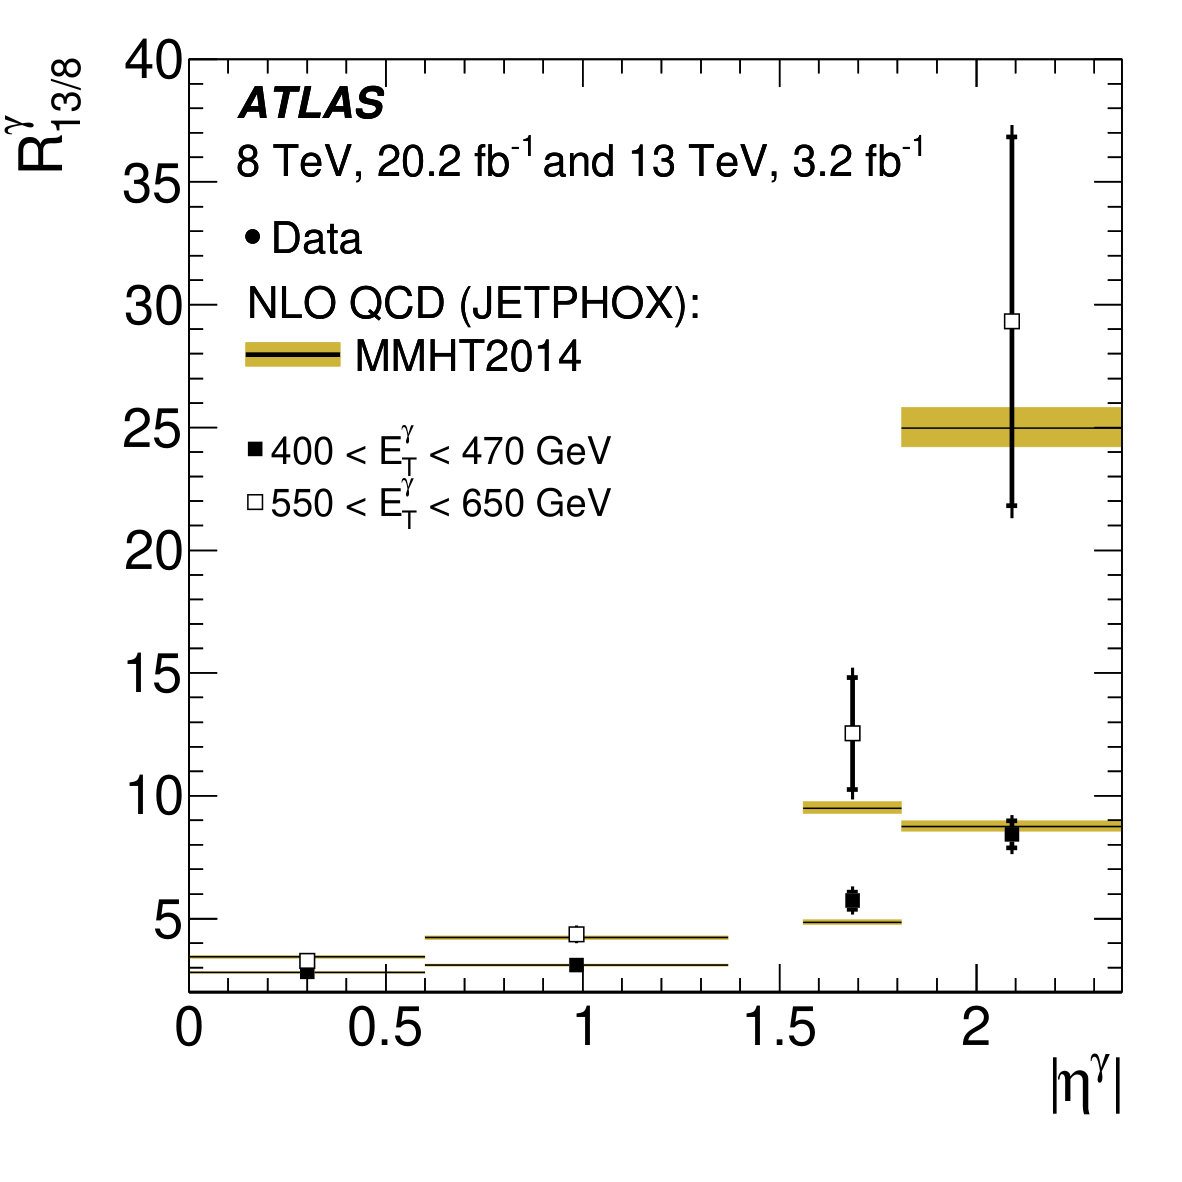 Figure 30
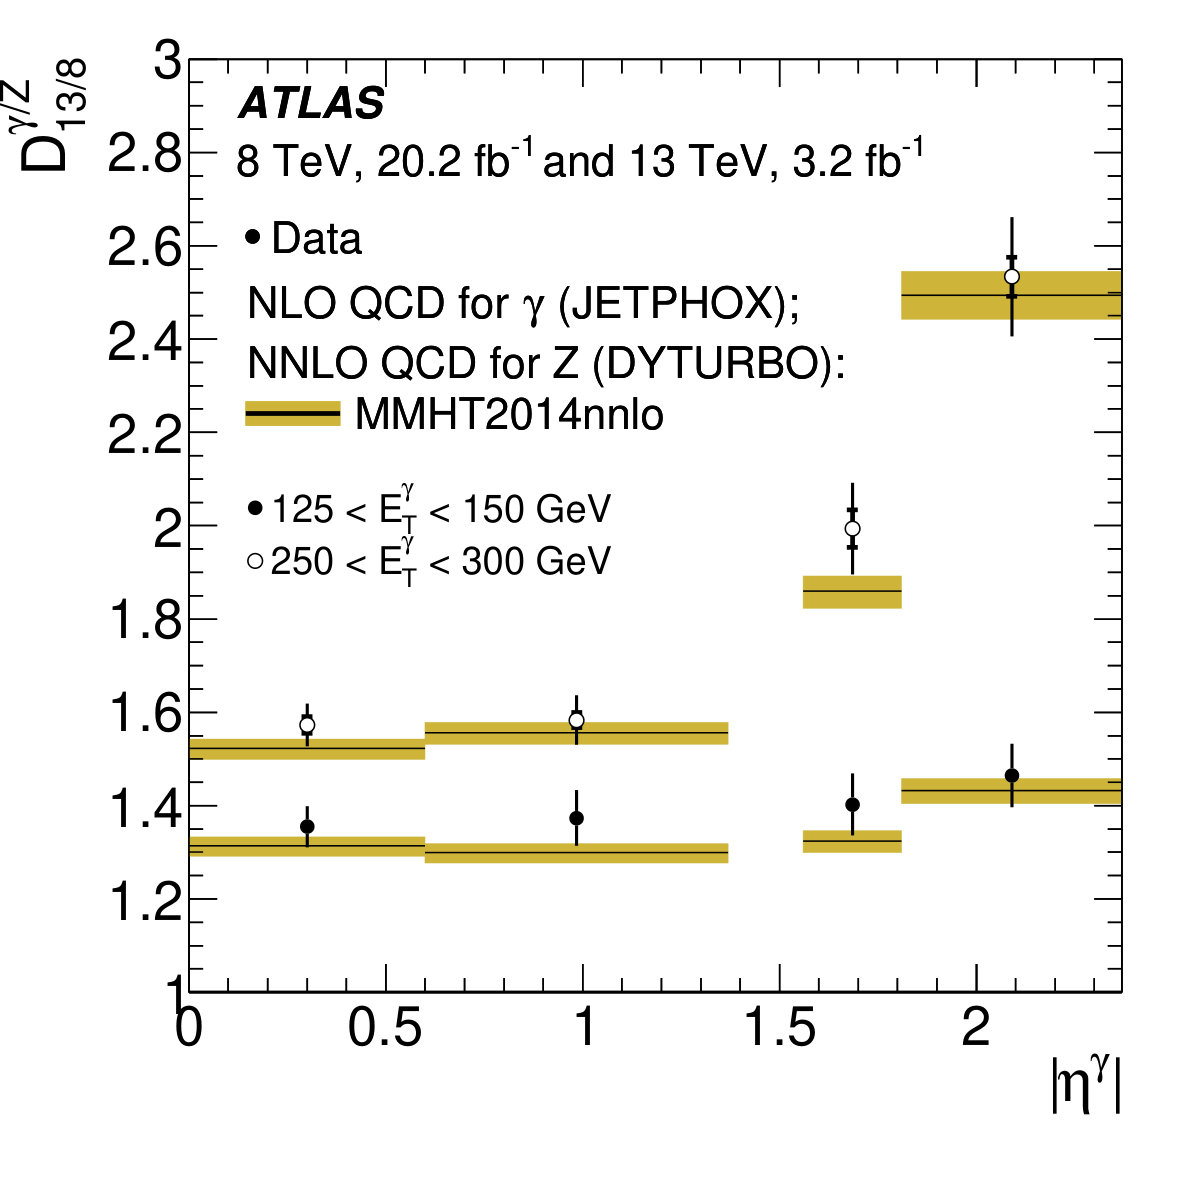 Figure 31
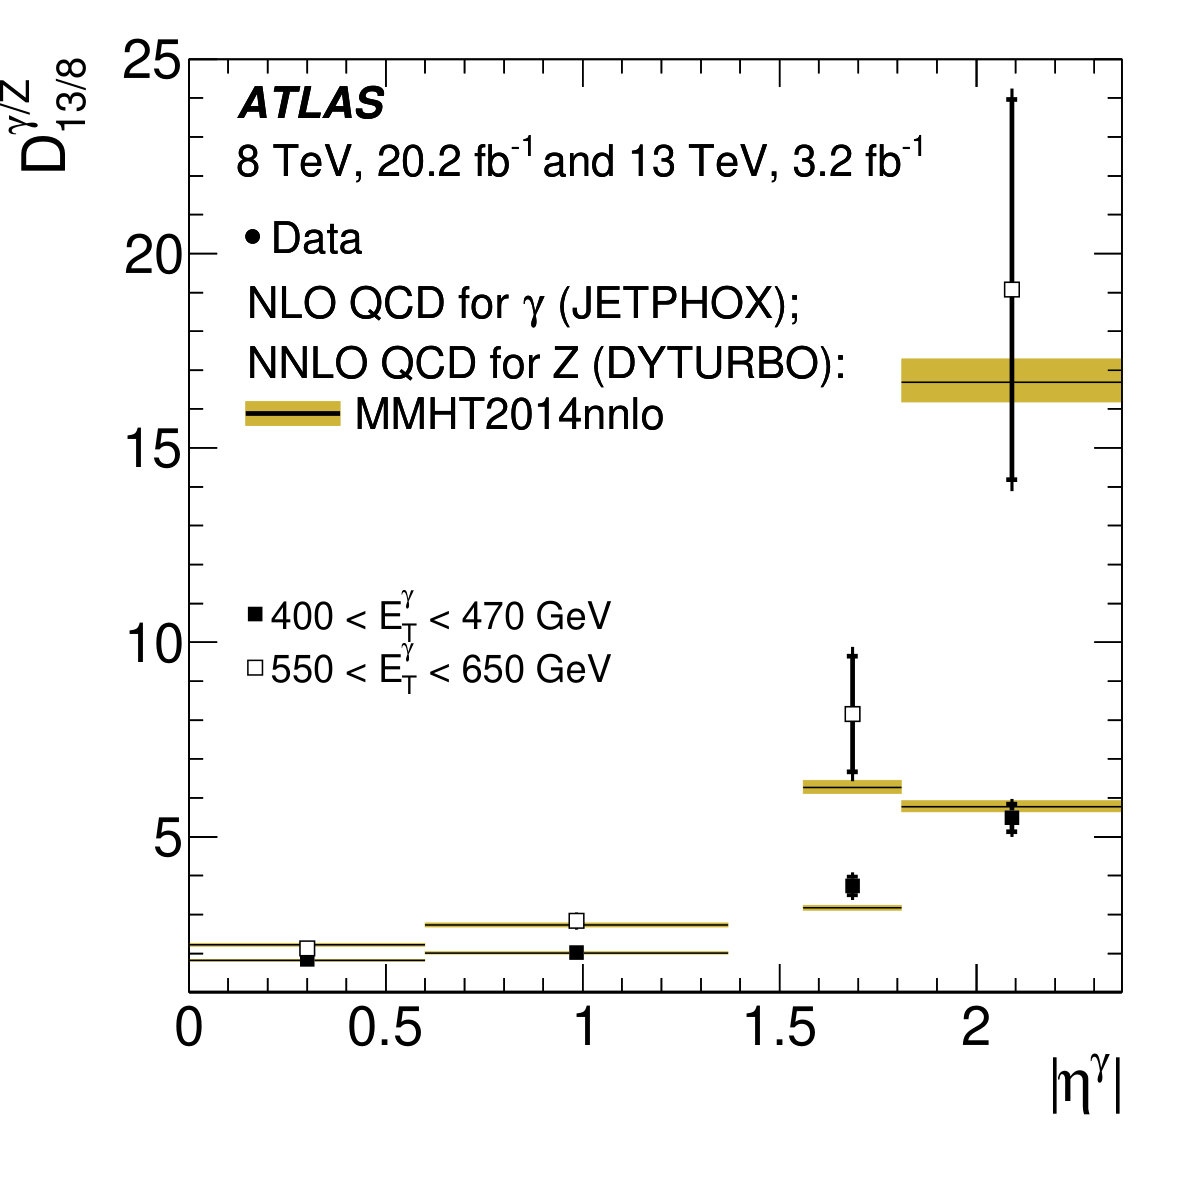 Figure 32
 Figure 33
 Figure 34
| [GeV] | ||||||||||||
|---|---|---|---|---|---|---|---|---|---|---|---|---|
| – | ||||||||||||
| – | ||||||||||||
| – | ||||||||||||
| – | ||||||||||||
| – | ||||||||||||
| – | ||||||||||||
| – | ||||||||||||
| – | ||||||||||||
| – | ||||||||||||
| – | ||||||||||||
| – | ||||||||||||
| – | ||||||||||||
| – | ||||||||||||
| – | ||||||||||||
Peer Reviews
No public reviews on file for this paper yet. If you reviewed it on a platform where reviews are public (OpenReview, ICLR, NeurIPS, ICML), you can paste yours below so the community can read it here.
Videos
No videos yet. Explain this paper in a talk, walkthrough, or lecture? Add one.
\AtlasTitle
Measurement of the ratio of cross sections for inclusive isolated-photon production in collisions at and TeV with the ATLAS detector
\AtlasJournalRefJHEP 04 (2019) 093 \AtlasDOI10.1007/JHEP04(2019)093 \PreprintIdNumberCERN-EP-2018-340 \AtlasAbstract The ratio of the cross sections for inclusive isolated-photon production in collisions at centre-of-mass energies of 13 and 8 TeV is measured using the ATLAS detector at the LHC. The integrated luminosities of the 13 TeV and 8 TeV datasets are 3.2 fb*-1* and 20.2 fb*-1*, respectively. The ratio is measured as a function of the photon transverse energy in different regions of the photon pseudorapidity. The predictions from next-to-leading-order perturbative QCD calculations are compared with the measured ratio. The experimental systematic uncertainties as well as the uncertainties affecting the predictions are evaluated taking into account the correlations between the two centre-of-mass energies, resulting in a reduction of up to a factor of () in the experimental (theoretical) systematic uncertainties. The predictions based on several parameterisations of the proton parton distribution functions agree with the data within the reduced experimental and theoretical uncertainties. In addition, this ratio to that of the fiducial cross sections for boson production at 13 and 8 TeV using the decay channels and is made and compared with the theoretical predictions. In this double ratio, a further reduction of the experimental uncertainty is obtained because the uncertainties arising from the luminosity measurement cancel out. The predictions describe the measurements of the double ratio within the theoretical and experimental uncertainties.
\size@chapter\sectfont
Contents
@afterheading@starttoc
toc
1 Introduction
The production of prompt photons in proton–proton collisions, , provides a means of testing perturbative QCD (pQCD) with a hard colourless probe. Since the dominant production mechanism in collisions at the LHC proceeds via the process, measurements of prompt-photon111All photons produced in collisions that are not secondaries from hadron decays are considered to be “prompt”. production are sensitive to the gluon density in the proton [1, 2]. These measurements can also be used to tune Monte Carlo (MC) models to improve our understanding of prompt-photon production and aid those analyses for which events containing photons are an important background.
At leading order (LO) in pQCD, two processes contribute to prompt-photon production: the direct-photon process, in which the photon originates directly from the hard interaction, and the fragmentation-photon process, in which the photon is emitted in the fragmentation of a high transverse momentum () parton [3, 4].
Measurements of prompt-photon production at a hadron collider necessitate an isolation requirement to reduce the large contribution of photons from hadron decays and the fragmentation component in which the emitted photon is close to a jet. The production of isolated photons in collisions has been measured previously by the ATLAS [5, 6, 7, 8, 9] and CMS [10, 11] collaborations at centre-of-mass energies () of , and TeV.
Comparisons of measurements of prompt-photon production and pQCD predictions are usually limited by the theoretical uncertainties associated with the missing higher-order terms in the perturbative expansion. The measurements of inclusive isolated-photon cross sections performed by ATLAS at TeV [9] and TeV [8] were compared with the predictions of pQCD at next-to-leading order (NLO) [12, 13]. At both centre-of-mass energies, the uncertainties affecting the predictions are dominated by terms beyond NLO and are larger than those of experimental nature, preventing a more precise test of the theory. An avenue to reach a more stringent test is the inclusion of next-to-next-to-leading-order (NNLO) QCD corrections in the calculations [14]. Another avenue is to make measurements of the ratio of cross sections for inclusive isolated-photon production at and TeV () and compare them with the predictions [15, 16]. The impact of the experimental systematic uncertainties and theoretical uncertainties on the ratio of the cross sections is reduced, allowing a more precise comparison between data and theory. This is achieved by accounting for inter- correlations in the experimental systematic uncertainties affecting the measurements and in the uncertainties of the theory predictions.
A further reduction of the experimental uncertainty can be achieved by measuring a double ratio: the ratio of to the ratio of the fiducial cross sections for boson production at TeV and TeV () presented in Ref. [17]. The measurements of the fiducial cross sections for boson production use the decay channels and . This observable, , can be viewed as the increase of the cross section for isolated-photon production as a function of normalised to the increase for boson production as a function of . Measuring is beneficial because the uncertainties from the luminosity measurement cancel out, and has only a slightly larger theory uncertainty than .
This paper presents measurements of the ratio of cross sections for isolated-photon production in collisions at TeV and TeV with the ATLAS detector at the LHC. The phase-space region is given by the overlap of the ATLAS measurements at and TeV, defined by the photon transverse energy222 ATLAS uses a right-handed coordinate system with its origin at the nominal interaction point (IP) in the centre of the detector and the -axis along the beam pipe. The -axis points from the IP to the centre of the LHC ring, and the -axis points upwards. Cylindrical coordinates are used in the transverse plane, being the azimuthal angle around the -axis. The pseudorapidity is defined in terms of the polar angle as . () in the range GeV and the photon pseudorapidity () in the region , excluding the region . The photon is isolated by requiring that the transverse energy inside a cone of size in the plane around the photon direction, , is smaller than [8, 9]. Non-isolated prompt photons are not considered as signal. The measurements of the ratios are based on the ATLAS measurements at TeV [9] and TeV [8] and a detailed study of the correlations of the experimental systematic uncertainties between the two centre-of-mass energies is presented here. The measurement of the ratios is presented as a function of in different regions of , namely , , and . Next-to-leading-order pQCD predictions for the ratio are compared with the measurements. In addition, measurements of are presented using the ATLAS results for [17]; the measurements are compared with available theory predictions.
The paper is organised as follows: the ATLAS detector is described in Section 2. The analysis strategy is summarised in Section 3. Fixed-order QCD predictions and their uncertainties are discussed in Section 4. Section 5 is devoted to the description of the experimental uncertainties. The results are reported in Section 6. A summary is given in Section 7.
2 ATLAS detector
The ATLAS experiment [18] at the LHC uses a multipurpose particle detector with a forward–backward symmetric cylindrical geometry and a near coverage in solid angle. It consists of an inner tracking detector, electromagnetic (EM) and hadronic calorimeters, and a muon spectrometer. The inner detector is surrounded by a thin superconducting solenoid and includes silicon detectors, which provide precision tracking in the pseudorapidity range , and a transition-radiation tracker providing additional tracking and electron identification information for . For the TeV data-taking period, the inner detector also includes a silicon-pixel insertable B-layer [19, 20], providing an additional layer of tracking information close to the interaction point. The calorimeter system covers the range . Within the region , EM calorimetry is provided by barrel and endcap high-granularity lead/liquid-argon (LAr) EM calorimeters, with an additional thin LAr presampler covering to correct for energy loss in material upstream of the calorimeters; for the LAr calorimeters are divided into three layers in depth. Hadronic calorimetry is provided by a steel/scintillator-tile calorimeter for and two copper/LAr hadronic endcap calorimeters for . The forward region is covered by additional coarser-granularity LAr calorimeters up to . The muon spectrometer consists of three large superconducting toroidal magnets, one barrel and two endcaps, each containing eight coils, precision tracking chambers covering the region , and separate trigger chambers up to . For the data taken at TeV, a three-level trigger system was used. The first-level trigger was implemented in hardware and used a subset of the detector information. This was followed by two software-based trigger levels that together reduce the accepted event rate to approximately Hz. For the data taken at TeV, the trigger was changed [21] to a two-level system, using custom hardware followed by a software-based level which runs offline reconstruction software, reducing the event rate to approximately kHz.
3 Analysis strategy
The measurements of ratios of cross sections presented in this paper are based on the measurements presented in previous ATLAS publications [8, 9, 17], where details of the analyses are given. The strategies followed for the measurement of the ratios and for the theoretical predictions are described below.
3.1 Analysis strategy for
The measurements of at TeV ( TeV) used in the measurement of are based on an integrated luminosity of fb*-1* ( fb*-1*). The measurement of the ratio covers the range GeV and is performed separately in the four regions of defined in Section 1. A summary of the analyses leading to the measurements of the differential cross sections for inclusive isolated-photon production at and TeV is given below.
Photon candidates are reconstructed from clusters of energy deposited in the EM calorimeter. Candidates without a matching track or reconstructed conversion vertex in the inner detector are classified as unconverted photons, while those with a matching reconstructed conversion vertex or a matching track consistent with originating from a photon conversion are classified as converted photons [22]. The photon identification is based primarily on shower shapes in the calorimeter [22]. It uses information from the hadronic calorimeter, the lateral shower shape in the second layer of the EM calorimeter and the shower shapes in the finely segmented first EM calorimeter layer to ensure the compatibility of the measured shower profile with that originating from a single photon impacting the calorimeter. The photon energy measurement is made using calorimeter and, when available, tracking information. An energy calibration [23] is applied to the candidates to account for upstream energy loss and both lateral and longitudinal leakage. Events with at least one photon candidate with calibrated GeV and excluding the region are selected. The isolation transverse energy is corrected for leakage of the photon energy into the isolation cone and the estimated contributions from the underlying event (UE) and additional inelastic interactions (pile-up). The latter two corrections are computed simultaneously on an event-by-event basis using the jet-area method [24, 25]. After these corrections, isolated photons are selected by requiring to be lower than . A small background contribution still remains after imposing the photon identification and isolation requirements and is subtracted using a data-driven method based on background control regions [9, 8]. The selected samples of events are used to unfold the distribution in for each region to a phase-space region close to that used for event selection.
The phase-space region at particle level uses particles with a decay length 10 mm; these particles are referred to as “stable”. The particle-level isolation requirement for the photon is built by summing the transverse energy of all stable particles, except for muons and neutrinos, in a cone of size around the photon direction after the contribution from the UE is subtracted; the same subtraction procedure and isolation requirement used on data are applied at the particle level.
An important part of this analysis is the evaluation of the experimental systematic uncertainties in the ratio of the cross sections at and TeV taking into account correlations. This study is described in Section 5. Given the dominance of the systematic uncertainty arising from the photon energy scale when measuring the cross sections, it is necessary to carefully study this source of uncertainty. This source of systematic uncertainty is decomposed into independent components [23] and the treatment of the correlations of these components between the measurements at and TeV results in a reduction of the systematic uncertainty of the ratio.
The measurements of the ratio of cross sections are compared with NLO pQCD predictions for which a proper evaluation of the theoretical uncertainties is also of importance. The theoretical uncertainties in the predictions for the cross sections are (10–15%) for both centre-of-mass energies and are dominated by contributions from terms beyond NLO. These uncertainties are much larger than those of experimental nature and limit how precisely the predictions can be tested. The study of the theoretical uncertainties in the ratio is described in Section 4. As is the case for the experimental systematic uncertainties, it is imperative that for each source of theoretical uncertainty the degree of correlation between the two centre-of-mass energies is taken into account. As a result, the theoretical uncertainty is reduced in the ratio, thus allowing a more stringent test of the predictions.
3.2 Analysis strategy for
The measurement of the double ratio is based on the measurement of described above as well as on the measurement of . It should be noted that is measured as a function of in different ranges of , while is a single number. The measurement of used here is the one reported in Ref. [17]. The fiducial cross section at a given , , is defined as the production cross section of a boson times the branching ratio of the decay into a lepton pair of flavour or within the following phase space: the lepton transverse momentum GeV, the lepton pseudorapidity and the dilepton invariant mass GeV. The measurement at TeV was performed in the aforementioned phase space while the measurement at TeV was extrapolated to the same phase space as described in Ref. [17]. Measurements of the fiducial cross sections were made using the decay channels and , and combined for the final result. The measured is [17], where “stat.” denotes the statistical uncertainty, “syst.” denotes the systematic uncertainty and “lumi.” denotes the uncertainty due to the ratio of the integrated luminosities. The evaluation of the systematic uncertainty in the ratio takes into account correlations of systematic uncertainties across channels and as described in Ref. [17].
The predictions for are obtained from NLO pQCD calculations for [12, 13] and NNLO pQCD calculations for [26, 27]. The evaluation of the uncertainties affecting the predictions for requires considerations that account for the correlations arising from the parton distribution functions (PDFs) and the strong coupling constant, .
4 Fixed-order QCD predictions
The theoretical predictions for the ratios of cross sections are obtained using fixed-order QCD calculations. Details of the generators and of the estimations of the theoretical uncertainties are given below, especially emphasising the correlations between the two centre-of-mass energies.
4.1 Theoretical predictions for
The theoretical predictions for presented here are based on NLO QCD calculations computed using the program Jetphox 1.3.1_2 [12, 13]. This program includes a full NLO QCD treatment of both the direct- and fragmentation-photon contributions to the cross section for the reaction. The number of quark flavours is set to five. The renormalisation (), factorisation () and fragmentation () scales are chosen to be . The calculations are performed using various parameterisations of the proton PDFs and the BFG set II of parton-to-photon fragmentation functions at NLO [28]. The nominal calculation is based on the MMHT2014 PDF set [29]. Predictions are also obtained with other PDFs, namely CT14 [30], HERAPDF2.0 [31], NNPDF3.0 [32] and ABMP16 [33]. For MMHT2014, CT14, HERAPDF2.0 and NNPDF3.0 parameterisations of the PDFs, the sets determined at NLO are used. For ABMP16, the set at NNLO is used. The strong coupling constant is set to the value assumed in the fit to determine the PDFs; as an example, in the case of MMHT2014 PDFs, is set to the value .
The calculations are performed using a parton-level isolation criterion for the photon, which requires a total transverse energy of the partons inside a cone of radius around the photon direction below . The predictions from Jetphox are at parton level,333The parton level in Jetphox consists of the generated photon and the few partons simulated with the matrix elements, while in Pythia it includes the partons after the parton shower. while the measurements are at particle level. Corrections for the non-perturbative (NP) effects of hadronisation and the UE are estimated using samples from Pythia 8.186 [34] as described below. First, a correction factor () is derived for the isolated-photon cross section at each centre-of-mass energy as the ratio of the cross section at particle level for a Pythia sample with UE effects to the Pythia cross section at parton level without UE effects. Second, the ratio of the correction factor for TeV to that for TeV, , is evaluated. The ratio of correction factors is obtained using the ATLAS set of tuned parameters A14 [35] with the LO NNPDF2.3 PDF set [36]. The ratio of correction factors for non-perturbative effects applied to the ratio predictions from Jetphox is .
The following sources of uncertainty in the theoretical predictions are considered:
- •
The uncertainty in the NLO QCD predictions due to terms beyond NLO is estimated by repeating the calculations using values of , and scaled by the factors and . The three scales are either varied simultaneously or individually; in addition, configurations in which one scale is fixed and the other two are varied simultaneously are also considered. In all cases, the condition is imposed, where . The final uncertainty is taken as the largest deviation from the nominal value among the possible variations.
- •
The uncertainty in the NLO QCD predictions related to the proton PDFs is estimated by repeating the calculations using the additional sets from the MMHT2014 error analysis.
- •
The uncertainty in the NLO QCD predictions related to the value of is estimated by repeating the calculations using two additional sets of proton PDFs from the MMHT2014 analysis for which different values of were assumed in the fits, namely and [37].
- •
The impact of the beam energy uncertainty is estimated by repeating the calculations with varied by its uncertainty of [38].
- •
The uncertainty in the corrections for non-perturbative effects is estimated by comparing the results of using variations of the A14 tune in which the parameter settings related to the modelling of the UE are changed [35].
For the individual differential cross sections and for both centre-of-mass energies, the dominant theoretical uncertainty arises from the estimate of contributions from terms beyond NLO [8, 9].
The predictions for are obtained by calculating the ratio of the individual differential cross sections at each centre-of-mass energy. To estimate the theoretical uncertainty in , the correlation between the two centre-of-mass energies for each source listed above needs to be considered. The uncertainties due to the PDFs, , beam energy and non-perturbative effects are fully correlated between the two centre-of-mass energies. The relative uncertainties in due to the uncertainties in , the PDFs and the beam energy exhibit a significant degree of cancellation with respect to the individual predictions. However, for the scale uncertainties, the correlation is a priori unknown. In the standard approach, varying the scales coherently or incoherently at both centre-of-mass energies leads to very different theoretical uncertainties:
- •
In the coherent case, there are large cancellations in the uncertainties in the predictions for , particularly in the variation of , which is for the individual predictions and below for . The envelope of the scale variations for shrinks in comparison with the envelopes for the individual predictions: from for the individual predictions to below for across most of the range in .
- •
In the incoherent case, the envelope of the scale variations for is in all regions of phase space.
A second approach is also investigated, which is free from ambiguity in the correlation. It consists of considering the difference between the LO and NLO predictions for . The LO predictions are obtained with Jetphox using the same parameter settings and PDF set as the baseline NLO predictions. The LO and NLO predictions for are compared and the differences are up to , which are similar to the estimates based on the standard approach with coherent variations at the two centre-of-mass energies. Thus, the results of this second approach support the use of the standard approach with a coherent variation of the scales; an incoherent variation of the scales clearly leads to an overestimation of the theoretical uncertainty.
Figure 1 shows an overview of the theoretical uncertainties in . The total relative uncertainty is below () at low (high) in all regions of . The uncertainty due to the variation of the scales is dominant everywhere. At high for and , the uncertainty due to the PDFs can be as large as the contribution from the scale variations.
The NLO pQCD predictions of Jetphox for based on the MMHT2014 parameterisations of the proton PDFs are about at GeV and increase as increases, to about for GeV for (). For (), the predicted increases from about at GeV to around () at GeV. The increase is greater for the forward regions than for the central regions. Predictions based on different parameterisations of the proton PDFs are compared. Those based on MMHT2014, NNPDF3.0 and CT14 are found to be similar in all and regions. The predictions of based on HERAPDF2.0 and ABMP16 show some differences from the predictions based on the other PDFs in some regions of phase space, especially at high (see Section 6).
4.2 Theoretical predictions for
The theoretical predictions for presented here are based on NNLO QCD calculations for the predictions of computed using the program Dyturbo, which is an optimised version of the Dynnlo program [26, 27], and NLO QCD calculations for the predictions of using Jetphox with the procedure described in Section 4.1.
The calculations using Dyturbo are based on sets of PDFs extracted using NNLO QCD fits, namely MMHT2014nnlo, CT14nnlo, HERAPDF2.0nnlo and NNPDF3.0nnlo. The strong coupling constant is set to the value assumed in the fit to determine the PDFs. In the case of MMHT2014nnlo PDFs, is set to the value .
For consistency, and to properly take into account the correlations in the PDF uncertainties, the calculations of Jetphox for are repeated using the NNLO PDF sets mentioned above. It is consistent to use NLO matrix elements convolved with PDF sets determined at NNLO. The resulting predictions include partially NNLO corrections and, therefore, are understood to still have NLO accuracy. For these additional calculations, the same parameter settings for the number of flavours, scales and fragmentation functions mentioned in Section 4.1 are used. The change in the predictions for based on MMHT2014nnlo relative to those using MMHT2014nlo is at low . At high the change depends on the region: for the change is below for GeV and increases to in the highest- measured point; for () the change is below () for the entire measured range; for the change is below for GeV and increases to in the highest- measured point.
The sources of uncertainty in the theoretical predictions based on MMHT2014nnlo are the same as those described in Section 4.1. The uncertainty related to the beam energy is neglected, due to the small size of its effect on . The uncertainties in the prediction of due to the scale variations, the PDFs and are , and , respectively. For the predictions of , the uncertainties have been estimated as follows:
- •
The scale variations are considered uncorrelated between boson production and isolated-photon production since they are different processes.
- •
The PDF uncertainties are considered fully correlated between boson production and isolated-photon production.
- •
The uncertainties are considered fully correlated between boson production and isolated-photon production. The uncertainty in the predictions due to that in is estimated by using PDF sets in which was fixed at or .
In what follows, the resulting uncertainties in the predictions of are described. In the region (), the total relative uncertainty is below for GeV and it rises to for GeV. In both regions, the total uncertainty is mostly dominated by the variation of the scales. For and GeV, the uncertainties in the PDFs are dominant, and for and GeV, the contributions from the scale variations and the PDFs are equally large. In the region (), the total relative uncertainty is below for GeV and it rises to for GeV. For , the uncertainty due to the variation of the scales is dominant, but for and GeV, the contributions from the scale variations and the PDFs are equally important.
The theoretical predictions based on the MMHT2014nnlo parameterisations of the proton PDFs for are about at GeV and increase as increases, to – at the high end of the spectrum, depending on the region. The increase is larger for the forward regions than for the central regions. Predictions based on different parameterisations of the proton PDFs are compared; those based on MMHT2014nnlo, NNPDF3.0nnlo and CT14nnlo are found to be similar in all and regions. The predictions of based on HERAPDF2.0nnlo show some differences from the predictions based on the other PDFs in some regions of phase space, especially at high (see Section 6).
5 Experimental uncertainties
The sources of systematic uncertainties that affect the measurements of the photon differential cross sections at and TeV are detailed in Refs. [8] and [9], respectively. A proper estimation of the systematic uncertainties in this measurement of cross-section ratios requires taking into account inter- correlations for each source of systematic uncertainty. Assuming no correlation provides a conservative estimate and full correlation is used only when justified. The estimation of the systematic uncertainties in the ratio has to take into account the changes in the data-taking conditions as well as changes in the detector conditions. The measurements at () TeV are based on data taken when the LHC operated with a bunch spacing of () ns. During the data-taking period at () TeV there were on average () proton–proton interactions per bunch crossing. Furthermore, the addition of the silicon-pixel insertable B-layer leads to extra material upstream of the calorimeters for data-taking at TeV. The procedures used to account for the impact of each source of systematic uncertainty on the ratio are described below.
5.1 Photon energy scale
The systematic uncertainties associated with the photon energy scale and resolution represent the dominant experimental uncertainties in the measurements of the differential cross sections for inclusive isolated-photon production at both centre-of-mass energies. The uncertainty arising from the photon energy scale (ES) in is estimated by decomposing it into uncorrelated sources for both the TeV and TeV measurements. A total of individual components [23] influencing the energy scale and resolution of the photon are considered. Twenty of these components are common to both centre-of-mass energies. For some of the components the uncertainty is separated into a part which is correlated between the two centre-of-mass energies and another part which is specific to TeV data and which is treated as uncorrelated (see below). These components include the uncertainties in: the overall energy scale adjustment using events; the non-linearity of the energy measurement at the cell level; the relative calibration of the different calorimeter layers; the amount of material in front of the calorimeter; the modelling of the reconstruction of photon conversions; the modelling of the lateral shower shape; the modelling of the sampling term;444The relative energy resolution is parameterised as , where is the sampling term and is the constant term. and the measurement of the constant term in boson decays. The uncertainties depend on as well as on and are larger in the region due to the presence of more material than in other regions. The remaining two components are specific to the TeV measurement and take into account the differences in the configuration of the ATLAS detector between 2012 and 2015, namely changes in the LAr temperature, in the stability of the layer intercalibration and in the material in front of the calorimeters between Run 1 and Run 2 [39].
The procedure used to estimate the systematic uncertainty in is as follows: all the uncertainty components described above are taken as fully correlated except for the uncertainty in the overall energy scale adjustment using events, which for 2015 includes the effects of the changes in the configuration of the ATLAS detector mentioned above, and the uncertainties specific to the TeV measurement. Calibration differences due to a change of optimal filtering coefficients and LAr timing samples between Run 1 and Run 2 are considered as a source of uncertainty in . The uncertainties in the photon energy scale due to pile-up are small enough compared to other uncertainties that the specific treatment of the correlation does not impact the results. The uncertainties due the photon energy resolution are treated as uncorrelated between TeV and TeV since they include the effects of pile-up, which was different in the 2012 and 2015 data-taking periods.
The relative uncertainty due to the correlated components of the photon energy scale in as a function of is shown in Figure 2 for each region in . For illustration purposes, the result of estimating that part of the systematic uncertainty assuming no correlation is also shown in this figure: the results obtained using the complete correlation model exhibit a large reduction in comparison with those in which the correlations are ignored. This demonstrates that a proper treatment of the inter- correlations in the systematic uncertainties associated with the photon energy scale is important. In addition, the relative uncertainty due to the uncorrelated components of the photon energy scale and the components specific to 2015 is also shown in Figure 2.
5.2 Other sources of experimental uncertainty
The other sources of experimental uncertainty affecting the measurements are treated as listed below. For several of these sources, the uncertainties in the measurements at TeV and TeV are treated conservatively as uncorrelated since their impact is small.
- •
Statistical uncertainties. The statistical uncertainties in both the data and the Monte Carlo simulations at and TeV are treated as uncorrelated.
- •
Luminosity uncertainty. The luminosity uncertainties associated to the measurements of the photon cross sections at TeV and TeV are dominated by effects that are uncorrelated between different centre-of-mass energies and data-taking periods. The resulting relative uncertainty in amounts to .
- •
Trigger uncertainty. The uncertainties in the trigger efficiency are treated as uncorrelated for data at different . Different trigger requirements were used during 2012 and 2015. In addition, during 2012 a three-level trigger system was used to select events while in 2015 a two-level system was employed.
- •
Photon-identification uncertainty. In both measurements, the photon identification is based primarily on shower shapes in the EM calorimeter. These uncertainties are treated as uncorrelated since different methods are used at TeV [40] and TeV [22] to estimate the uncertainties; in addition, the photon identification criteria are re-optimised for data taken at TeV.
- •
Modelling of the photon isolation in Monte Carlo. In both measurements, the photon candidate is required to be isolated. The in-time (out-of-time) pile-up, which is due to additional collisions in the same (earlier or later than) bunch crossing as the event of interest, was different in 2012 and 2015 due to the different LHC conditions, namely the instantaneous luminosity and the bunch spacing. For simulated events, data-driven corrections to are applied such that the peak position in the distribution coincides in data and simulation. These uncertainties are treated as uncorrelated since different methods are used at and TeV for the corrections and uncertainties.
- •
Choice of background control regions. The background subtraction is performed using a data-driven two-dimensional sideband technique based on background control regions. A plane is formed by the variable and a binary variable that encapsulates the photon identification (“tight” vs. “non-tight”). A photon candidate is classified as “non-tight” if it fails at least one of four requirements on the shower-shape variables computed from the energy deposits in the first layer of the EM calorimeter, but satisfies the tight requirement on the total lateral shower width in the first layer and all the other tight identification criteria in other layers [22]. The plane is divided into four regions: region A for tight isolated photons, region B for tight non-isolated photons, region C for non-tight isolated photons and region D for non-tight non-isolated photons. The background control regions B, C and D are specified by lower and upper limits on as well as by the definition of “non-tight” photon candidates. Variations of the limits and alternative definitions of the “non-tight” condition are used to estimate the uncertainties due to the choice of background control regions. These uncertainties are treated as uncorrelated since, as mentioned above, the photon-identification requirements are re-optimised for data-taking at TeV.
- •
Photon identification and isolation correlation in the background. In the background subtraction method described above, the photon isolation and identification variables are assumed to be uncorrelated for background events. Uncertainties due to this assumption are estimated by using validation regions, which are dominated by background. These uncertainties are treated as uncorrelated since, as mentioned above, the photon-identification requirements are re-optimised for data-taking at TeV.
- •
Signal modelling. MC simulations of signal processes are used to estimate the signal leakage fractions in the background control regions and to compute the unfolding corrections. For both measurements, at and TeV, the Pythia [34] generator is used for the nominal results and the Sherpa [41] generator for studies of systematic uncertainties related to the model dependence. The uncertainty due to the mixture of direct and fragmentation processes in the simulations is estimated using the MC simulations of Pythia. These uncertainties are treated as uncorrelated since different methods and versions of the generators are used at TeV and TeV to estimate the uncertainties. For () TeV, Pythia 8.186 with the A14 tune (Pythia 8.165 with the AU2 tune) and Sherpa 2.1.1 (Sherpa 1.4.0) with the CT10 tune are used. For the TeV analysis the results of using the default admixture of direct and fragmentation contributions in Pythia are compared with those using an optimal admixture obtained by fitting the two components to the data; for the TeV analysis the results of enhancing the fragmentation contribution by a factor of two or removing it completely are compared with those using the default admixture.
- •
QCD-cascade and hadronisation model dependence. These uncertainties are treated as uncorrelated since different versions and tunes of the Monte Carlo generators Pythia and Sherpa are used at and TeV.
- •
Pile-up uncertainties. The in-time and out-of-time pile-up in the 2012 and 2015 data-taking periods were different. Conservatively and given the fact that the impact is rather small, these uncertainties are treated as uncorrelated.
5.3 Total experimental uncertainties in
Using the prescription for the treatment of the correlations between the measurements described in the previous sections, the systematic uncertainties in are evaluated. Figure 3 shows the relative uncertainties in due to (i) the photon energy scale, which includes the correlated and uncorrelated contributions as well as the additional ones associated with 2015 data, (ii) the remaining sources of systematic uncertainty excluding that in the luminosity measurements and (iii) the sum in quadrature of the non-ES uncertainties and the uncertainty due to the luminosity determination. The uncertainty due to the photon energy scale increases as increases and is larger for the region due to more material in front of the calorimeters than in the other regions. From Figure 3 it is concluded that the relative uncertainty in due to the photon energy scale is no longer the dominant uncertainty, except for GeV in the regions and .
The total relative experimental systematic uncertainty in is shown in Figure 4, as is its sum in quadrature with the relative statistical uncertainty. In all pseudo-rapidity regions, the systematic uncertainty is dominant compared to the statistical uncertainty up to GeV, while the measurement becomes statistically limited for GeV. There are significant correlations in the systematic uncertainties across bins in ; the uncertainty in the luminosity measurement is one of the major contributions and is fully correlated for all bins in and all regions.
5.4 Total experimental uncertainties in
The total relative experimental uncertainty in is obtained as follows:
- •
The uncertainty in as presented in Section 5.2, not including the contribution from the luminosity, is used. The uncertainty in the luminosity measurement cancels out in since the measurements of and are performed using data taken during the same periods of 2012 and 2015.
- •
The statistical () and systematic () uncertainties in are added in quadrature to the total uncertainty in (see Section 5.3). The systematic uncertainty in is dominated by the uncertainty in the lepton reconstruction and efficiency; the correlation between the small contribution due to the electron energy scale and the photon energy scale in can be safely neglected.
The relative total systematic uncertainty in the measured as a function of is shown for each region in Figure 5. For comparison, the relative total systematic uncertainty in is also shown. Since the total systematic uncertainty in is at least a factor of three smaller than the total systematic uncertainty in , the effect of adding in quadrature such a contribution has a small impact. On the other hand, the luminosity uncertainty, which amounts to for , cancels out in and this has a significant impact except at high , where the statistical uncertainty dominates.
6 Results
The measurements of the ratios of cross sections are presented and the main features exhibited by the data are described. The theoretical predictions are compared with the experimental results for both and .
6.1 Results for
The measured as a function of in different regions of is shown in Figures 6 and 7 and Table 1. The measured increases with from approximately at GeV to approximately – at the high end of the spectrum. In the forward regions the increase of with is larger than in the central regions. At a fixed value of , the measured ratio increases as increases.
The NLO QCD predictions based on the MMHT2014 PDFs are compared with the measured in Figures 6 and 7. Even though there is a tendency for the predictions to underestimate the data, the measurements and the theory are consistent within the uncertainties; in particular, the increase as increases and the dependence on are reproduced by the predictions. To study in more detail the description of the measured by the NLO QCD predictions, the ratio of the predictions to the data is shown in Figures 6 and 7. In these figures, the predictions based on different PDFs, namely MMHT2014, CT14, NNPDF3.0, HERAPDF2.0 and ABMP16 are included to ascertain the sensitivity of to the proton PDFs. The predictions generally agree with the measured within the experimental and theoretical uncertainties for all PDFs considered within the measured range.
The comparison of the NLO QCD predictions for and the measured differential cross sections in the ATLAS analyses at and TeV is limited by the theoretical uncertainties, which are larger than those of experimental nature and dominated by the uncertainties due to the terms beyond NLO. The theoretical uncertainties in are –; in contrast, the theoretical uncertainties for are below for most of the phase space considered and smaller than the experimental uncertainties. The experimental uncertainties in also benefit from a significant reduction since the systematic uncertainties partially cancel out, in particular those related to the photon energy scale, which is dominant in the measurement of . The total systematic uncertainty in is below for most of the phase space considered. Thus, the significant reduction of the experimental and theoretical uncertainties in allows a more stringent test of NLO QCD. The overall level of agreement between data and the NLO QCD predictions based on several parameterisations of the proton PDFs within these reduced uncertainties validates the description of the evolution of isolated-photon production in collisions with the centre-of-mass energy.
6.2 Results for
The measurements of as a function of in different regions of are shown in Figures 8 and 9 and Table 2. The measured increases with from approximately at GeV to approximately – at the high end of the spectrum. At a fixed value of , the measured ratio increases as increases.
The theoretical predictions based on the MMHT2014nnlo PDFs are compared with the measured in Figures 8 and 9. The predictions are in agreement with the measured ; in particular, the increase as increases and the dependence on are reproduced by the predictions. As an example, the measured value of at the lowest- point for is while the prediction using MMHT2014 is . The tendency of the predictions to underestimate the data observed in is also present in ; nevertheless, they are still consistent with each other within the uncertainties. To study in more detail the description of the measured by the theoretical predictions, the ratio of the predictions to the data is shown in Figures 8 and 9. In these figures, the predictions based on different PDFs, namely MMHT2014nnlo, CT14nnlo, NNPDF3.0nnlo and HERAPDF2.0nnlo are included to estimate the sensitivity of to the proton PDFs. The predictions generally agree with the measured within the experimental and theoretical uncertainties for all PDFs considered within the measured range.
7 Summary and conclusions
The ratio of cross sections for inclusive isolated-photon production in collisions at and TeV () is measured using the ATLAS detector at the LHC. The integrated luminosities of the 13 TeV and 8 TeV datasets are 3.2 fb*-1* and 20.2 fb*-1*, respectively. The ratio of differential cross sections as a function of is measured in different regions of for photons with GeV and , excluding the region . In the estimation of the experimental systematic uncertainties for , the correlations between the measurements at the two centre-of-mass energies are taken into account. The systematic uncertainty arising from the photon energy scale, which is dominant for the individual cross sections, is reduced significantly in and no longer the dominant uncertainty. The total systematic uncertainty for is below in most of the phase space of the measurement. The measurements can be useful for tuning models of prompt-photon production in collisions.
The predictions from NLO QCD calculations are compared with the measured . The theoretical uncertainties affecting these predictions are also evaluated taking into account the correlations between the two centre-of-mass energies, resulting in a significant reduction in the uncertainty of the predicted . The theoretical uncertainties in are below for most of the phase space of the measurement, in contrast with those in the individual cross-section predictions, which have approximately – uncertainties. Thus, the comparison of the predictions with the measured represents a stringent test of the pQCD calculations. Within these reduced experimental and theoretical uncertainties, the NLO QCD predictions based on several parameterisations of the proton PDFs agree with the data. Even though there is a tendency of the predictions to underestimate the data, the measurements and the theory are consistent within the uncertainties. The level of agreement achieved validates the description of the evolution of isolated-photon production in collisions from to TeV.
A double ratio of cross sections is also measured: the ratio of to the ratio of the fiducial cross sections for boson production at and TeV (). In , the uncertainty due to the luminosity cancels out at the expense of a small increase in the systematic uncertainty from all other sources, leading to a more precise measurement of the evolution of the inclusive-photon cross section with the centre-of-mass energy normalised to the evolution of the boson cross section. The theoretical prediction, based on NNLO (NLO) QCD calculations for boson (inclusive-photon) production, describes the measurements within the theoretical uncertainties and the reduced experimental uncertainties.
Acknowledgements
We thank CERN for the very successful operation of the LHC, as well as the support staff from our institutions without whom ATLAS could not be operated efficiently.
We acknowledge the support of ANPCyT, Argentina; YerPhI, Armenia; ARC, Australia; BMWFW and FWF, Austria; ANAS, Azerbaijan; SSTC, Belarus; CNPq and FAPESP, Brazil; NSERC, NRC and CFI, Canada; CERN; CONICYT, Chile; CAS, MOST and NSFC, China; COLCIENCIAS, Colombia; MSMT CR, MPO CR and VSC CR, Czech Republic; DNRF and DNSRC, Denmark; IN2P3-CNRS, CEA-DRF/IRFU, France; SRNSFG, Georgia; BMBF, HGF, and MPG, Germany; GSRT, Greece; RGC, Hong Kong SAR, China; ISF and Benoziyo Center, Israel; INFN, Italy; MEXT and JSPS, Japan; CNRST, Morocco; NWO, Netherlands; RCN, Norway; MNiSW and NCN, Poland; FCT, Portugal; MNE/IFA, Romania; MES of Russia and NRC KI, Russian Federation; JINR; MESTD, Serbia; MSSR, Slovakia; ARRS and MIZŠ, Slovenia; DST/NRF, South Africa; MINECO, Spain; SRC and Wallenberg Foundation, Sweden; SERI, SNSF and Cantons of Bern and Geneva, Switzerland; MOST, Taiwan; TAEK, Turkey; STFC, United Kingdom; DOE and NSF, United States of America. In addition, individual groups and members have received support from BCKDF, CANARIE, CRC and Compute Canada, Canada; COST, ERC, ERDF, Horizon 2020, and Marie Skłodowska-Curie Actions, European Union; Investissements d’ Avenir Labex and Idex, ANR, France; DFG and AvH Foundation, Germany; Herakleitos, Thales and Aristeia programmes co-financed by EU-ESF and the Greek NSRF, Greece; BSF-NSF and GIF, Israel; CERCA Programme Generalitat de Catalunya, Spain; The Royal Society and Leverhulme Trust, United Kingdom.
The crucial computing support from all WLCG partners is acknowledged gratefully, in particular from CERN, the ATLAS Tier-1 facilities at TRIUMF (Canada), NDGF (Denmark, Norway, Sweden), CC-IN2P3 (France), KIT/GridKA (Germany), INFN-CNAF (Italy), NL-T1 (Netherlands), PIC (Spain), ASGC (Taiwan), RAL (UK) and BNL (USA), the Tier-2 facilities worldwide and large non-WLCG resource providers. Major contributors of computing resources are listed in Ref. [42].
The reference list from the paper itself. Each links out to its DOI / PubMed record.
- 1[1] D. d’Enterria and J. Rojo “Quantitative constraints on the gluon distribution function in the proton from collider isolated-photon data” and references therein In Nucl. Phys. B 860 , 2012, pp. 311 DOI: 10.1016/j.nuclphysb.2012.03.003 · doi ↗
- 2[2] L. Carminati et al. “Sensitivity of the LHC isolated- γ + limit-from 𝛾 \gamma+ jet data to the parton distribution functions of the proton” In Europhys. Lett. 101 , 2013, pp. 61002 DOI: 10.1209/0295-5075/101/61002 · doi ↗
- 3[3] T. Pietrycki and A. Szczurek “Photon-jet correlations in p p 𝑝 𝑝 pp and p p ¯ 𝑝 ¯ 𝑝 p\bar{p} collisions” In Phys. Rev. D 76 , 2007, pp. 034003 DOI: 10.1103/Phys Rev D.76.034003 · doi ↗
- 4[4] Z. Belghobsi et al. “Photon-jet correlations and constraints on fragmentation functions” In Phys. Rev. D 79 , 2009, pp. 114024 DOI: 10.1103/Phys Rev D.79.114024 · doi ↗
- 5[5] ATLAS Collaboration “Measurement of the inclusive isolated prompt photon cross section in p p 𝑝 𝑝 pp collisions at s = 7 𝑠 7 \sqrt{s}=7 Te V with the ATLAS detector” In Phys. Rev. D 83 , 2011, pp. 052005 DOI: 10.1103/Phys Rev D.83.052005 · doi ↗
- 6[6] ATLAS Collaboration “Measurement of the inclusive isolated prompt photon cross-section in p p 𝑝 𝑝 pp collisions at s = 7 𝑠 7 \sqrt{s}=7 Te V using 35 pb -1 of ATLAS data” In Phys. Lett. B 706 , 2011, pp. 150 DOI: 10.1016/j.physletb.2011.11.010 · doi ↗
- 7[7] ATLAS Collaboration “Measurement of the inclusive isolated prompt photons cross section in p p 𝑝 𝑝 pp collisions at s = 7 𝑠 7 \sqrt{s}=7 Te V with the ATLAS detector using 4.6 4.6 4.6 fb -1 ” In Phys. Rev. D 89 , 2014, pp. 052004 DOI: 10.1103/Phys Rev D.89.052004 · doi ↗
- 8[8] ATLAS Collaboration “Measurement of the inclusive isolated prompt photon cross section in p p 𝑝 𝑝 pp collisions at s = 8 𝑠 8 \sqrt{s}=8 Te V with the ATLAS detector” In JHEP 08 , 2016, pp. 005 DOI: 10.1007/JHEP 08(2016)005 · doi ↗