Strong FUV fields drive the [CII]/FIR deficit in z~3 dusty, star-forming galaxies
Matus Rybak, G. Calistro Rivera, J. A. Hodge, Ian Smail, F. Walter, P., van der Werf, E. da Cunha, Chian-Chou Chen, H. Dannerbauer, R. J. Ivison, A., Karim, J. M. Simpson, A. M. Swinbank, J. L. Wardlow

TL;DR
This study uses high-resolution ALMA observations to analyze the [CII] and continuum emission in two z~3 dusty star-forming galaxies, revealing compact [CII] cores, a [CII]/FIR deficit driven by intense FUV radiation, and baryonic disk kinematics.
Contribution
It provides detailed spatially resolved analysis of [CII], FIR, and CO emissions in high-redshift galaxies, linking the [CII]/FIR deficit to strong FUV fields and thermal saturation effects.
Findings
[CII] emission is more compact than CO(3-2) in both galaxies.
Both galaxies show a strong [CII]/FIR deficit on 1-kpc scales.
High FUV radiation fields and gas densities are inferred in central regions.
Abstract
We present 0.15-arcsec (1 kpc) resolution ALMA observations of the [CII] 157.74 um line and rest-frame 160-um continuum emission in two z~3 dusty, star-forming galaxies - ALESS 49.1 and ALESS 57.1, combined with resolved CO(3-2) observations. In both sources, the [CII] surface brightness distribution is dominated by a compact core 1 kpc in radius, a factor of 2-3 smaller than the extent of the CO(3-2) emission. In ALESS 49.1, we find an additional extended (8-kpc radius), low surface-brightness [CII] component. Based on an analysis of mock ALMA observations, the [CII] and 160-um continuum surface brightness distributions are inconsistent with a single-Gaussian surface brightness distribution with the same size as the CO(3-2) emission. The [CII] rotation curves flatten at 2 kpc radius, suggesting the kinematics of the central regions are dominated by a baryonic disc. Both…
Click any figure to enlarge with its caption.
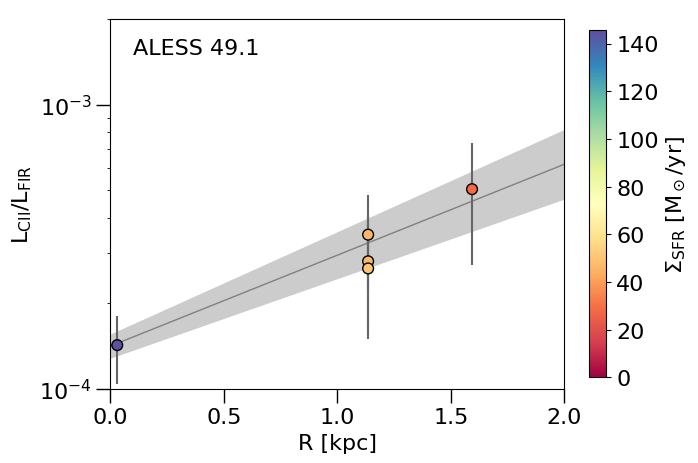 Figure 1
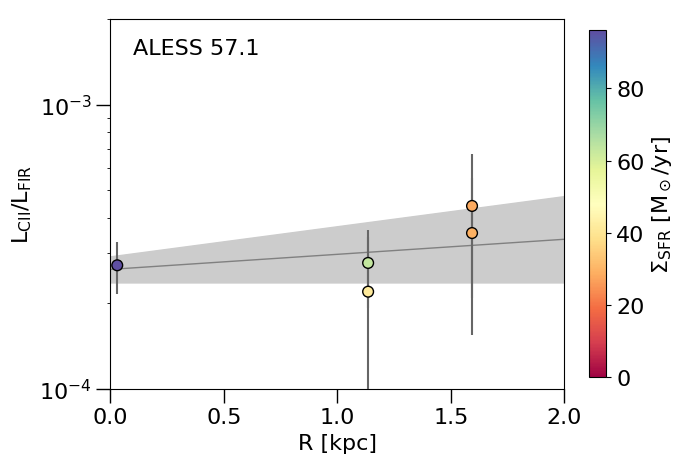 Figure 2
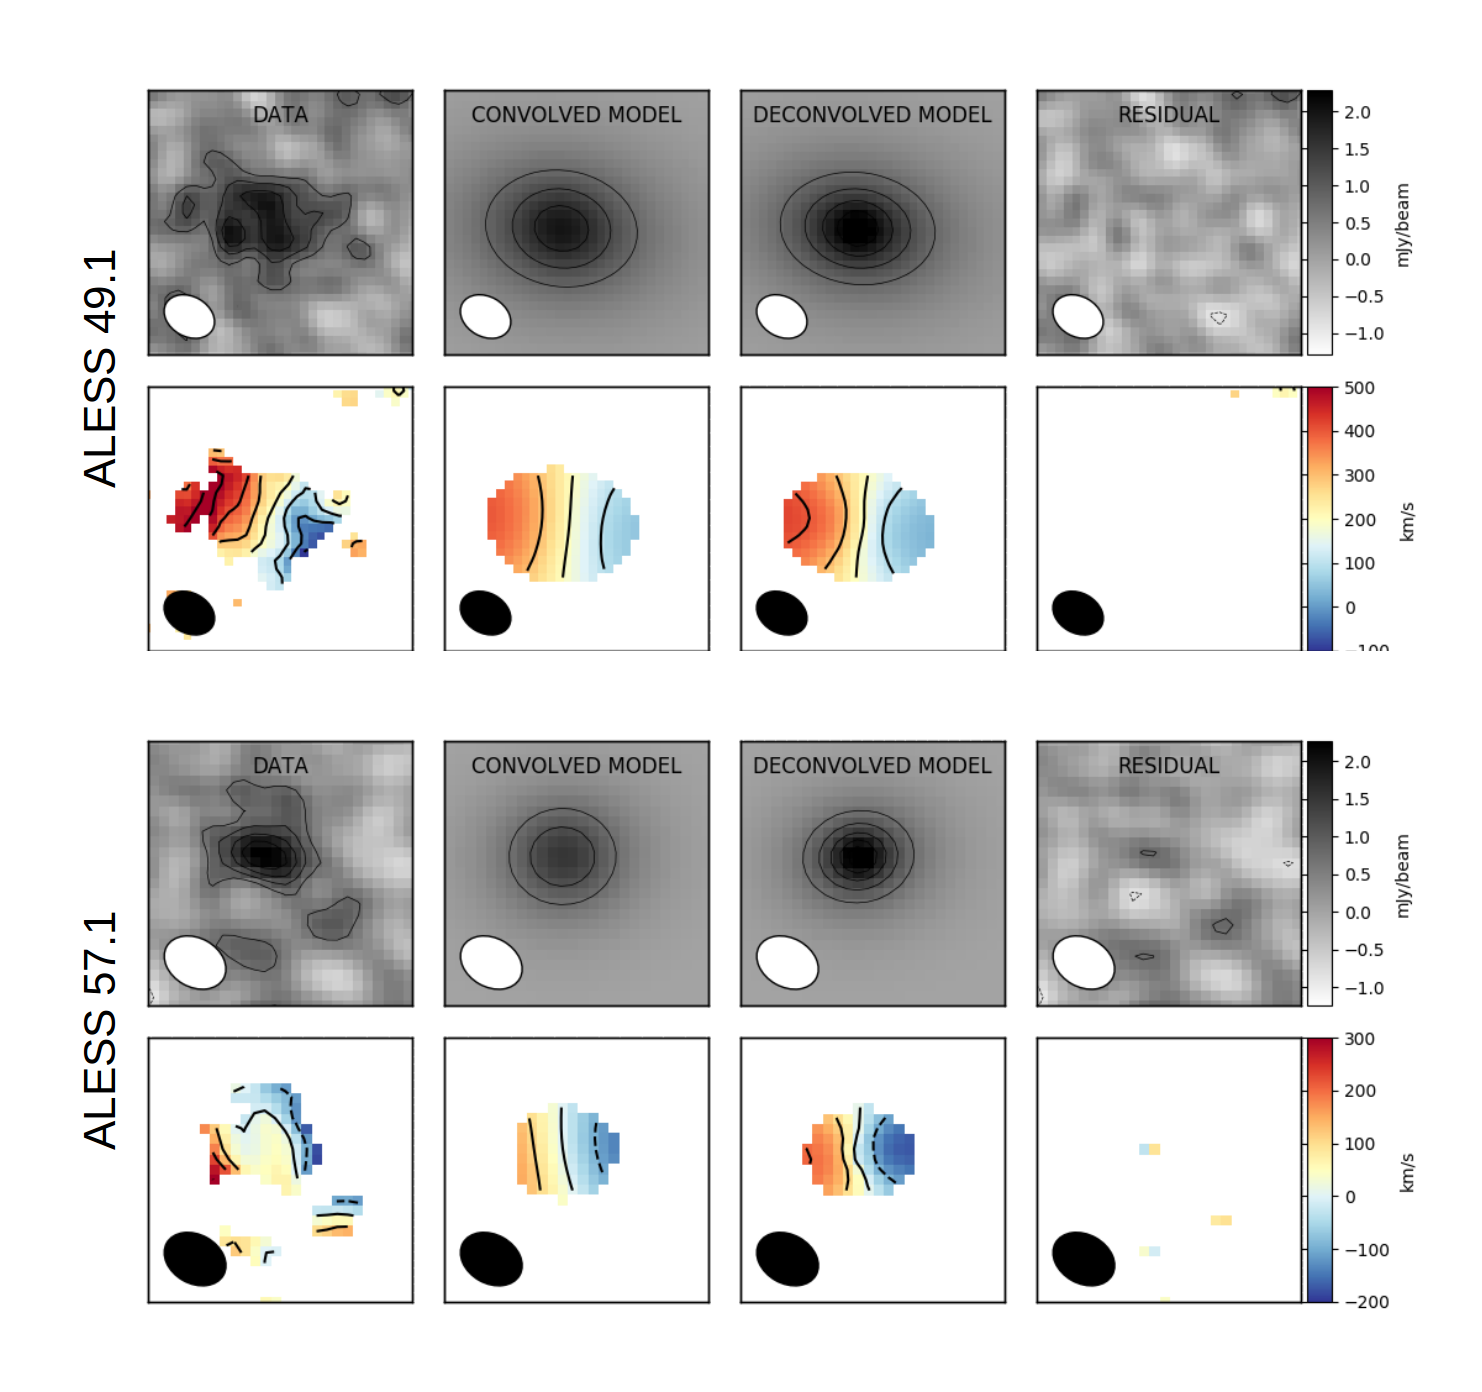 Figure 3
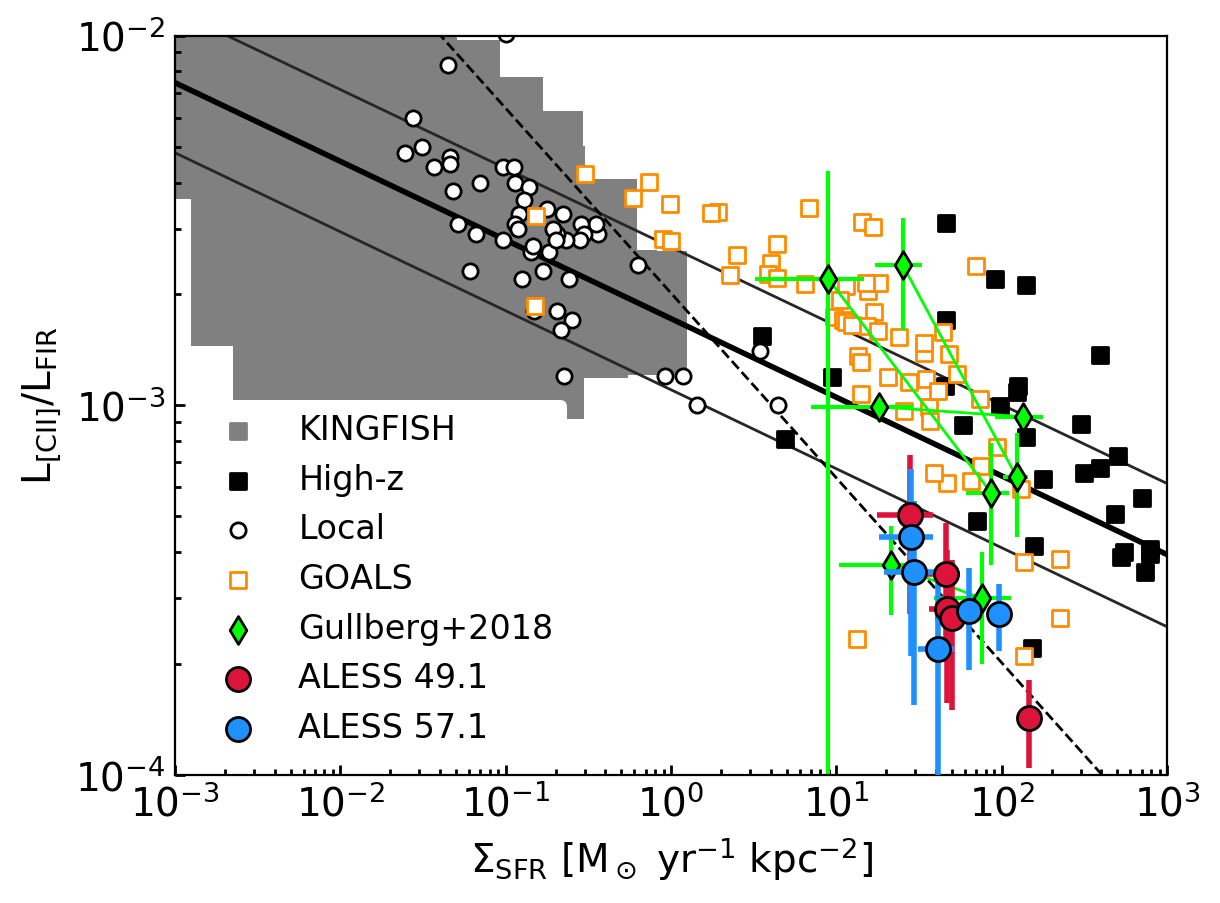 Figure 4
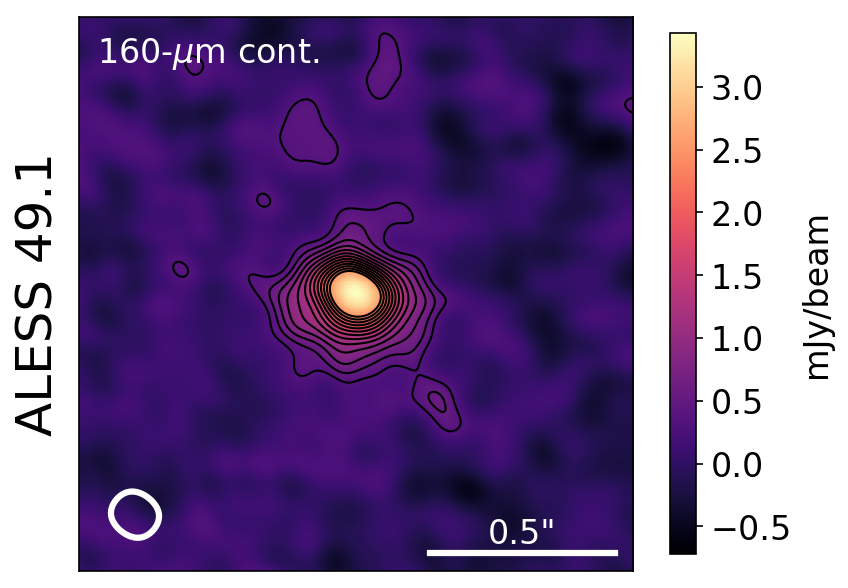 Figure 5
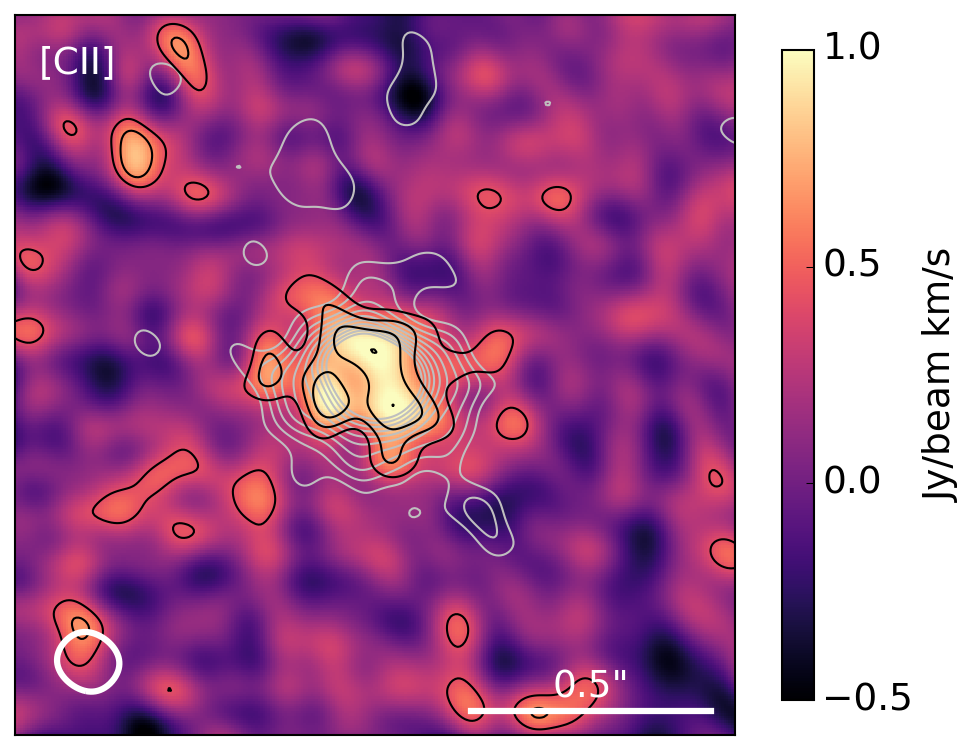 Figure 6
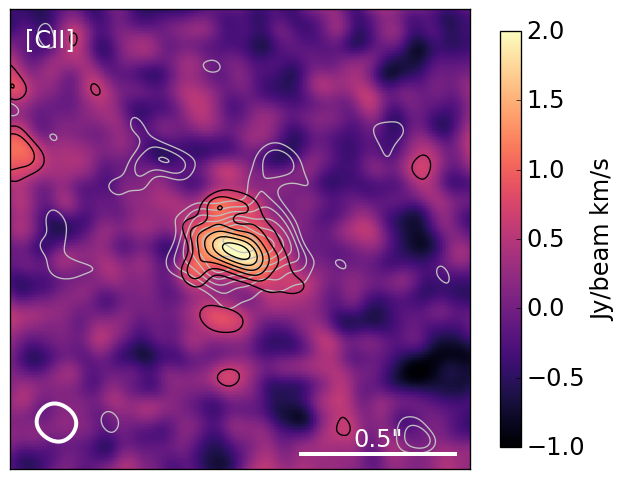 Figure 7
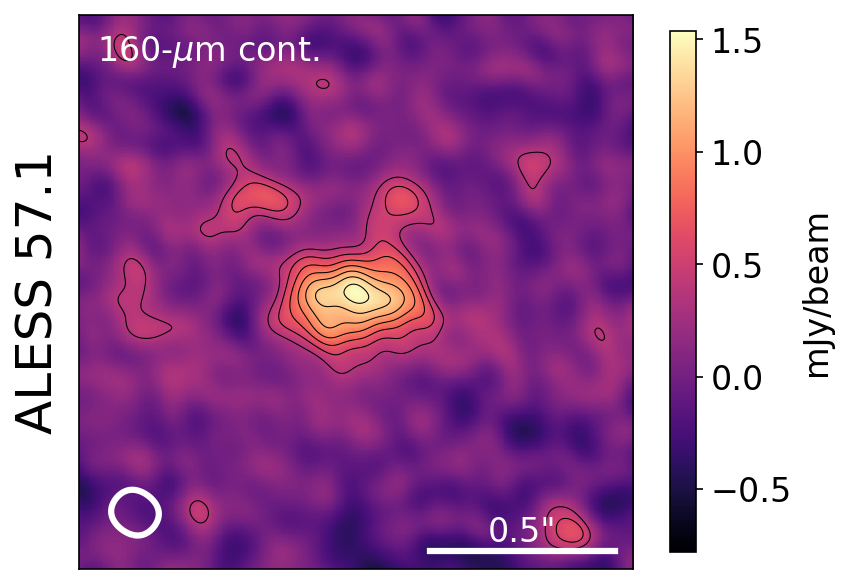 Figure 8
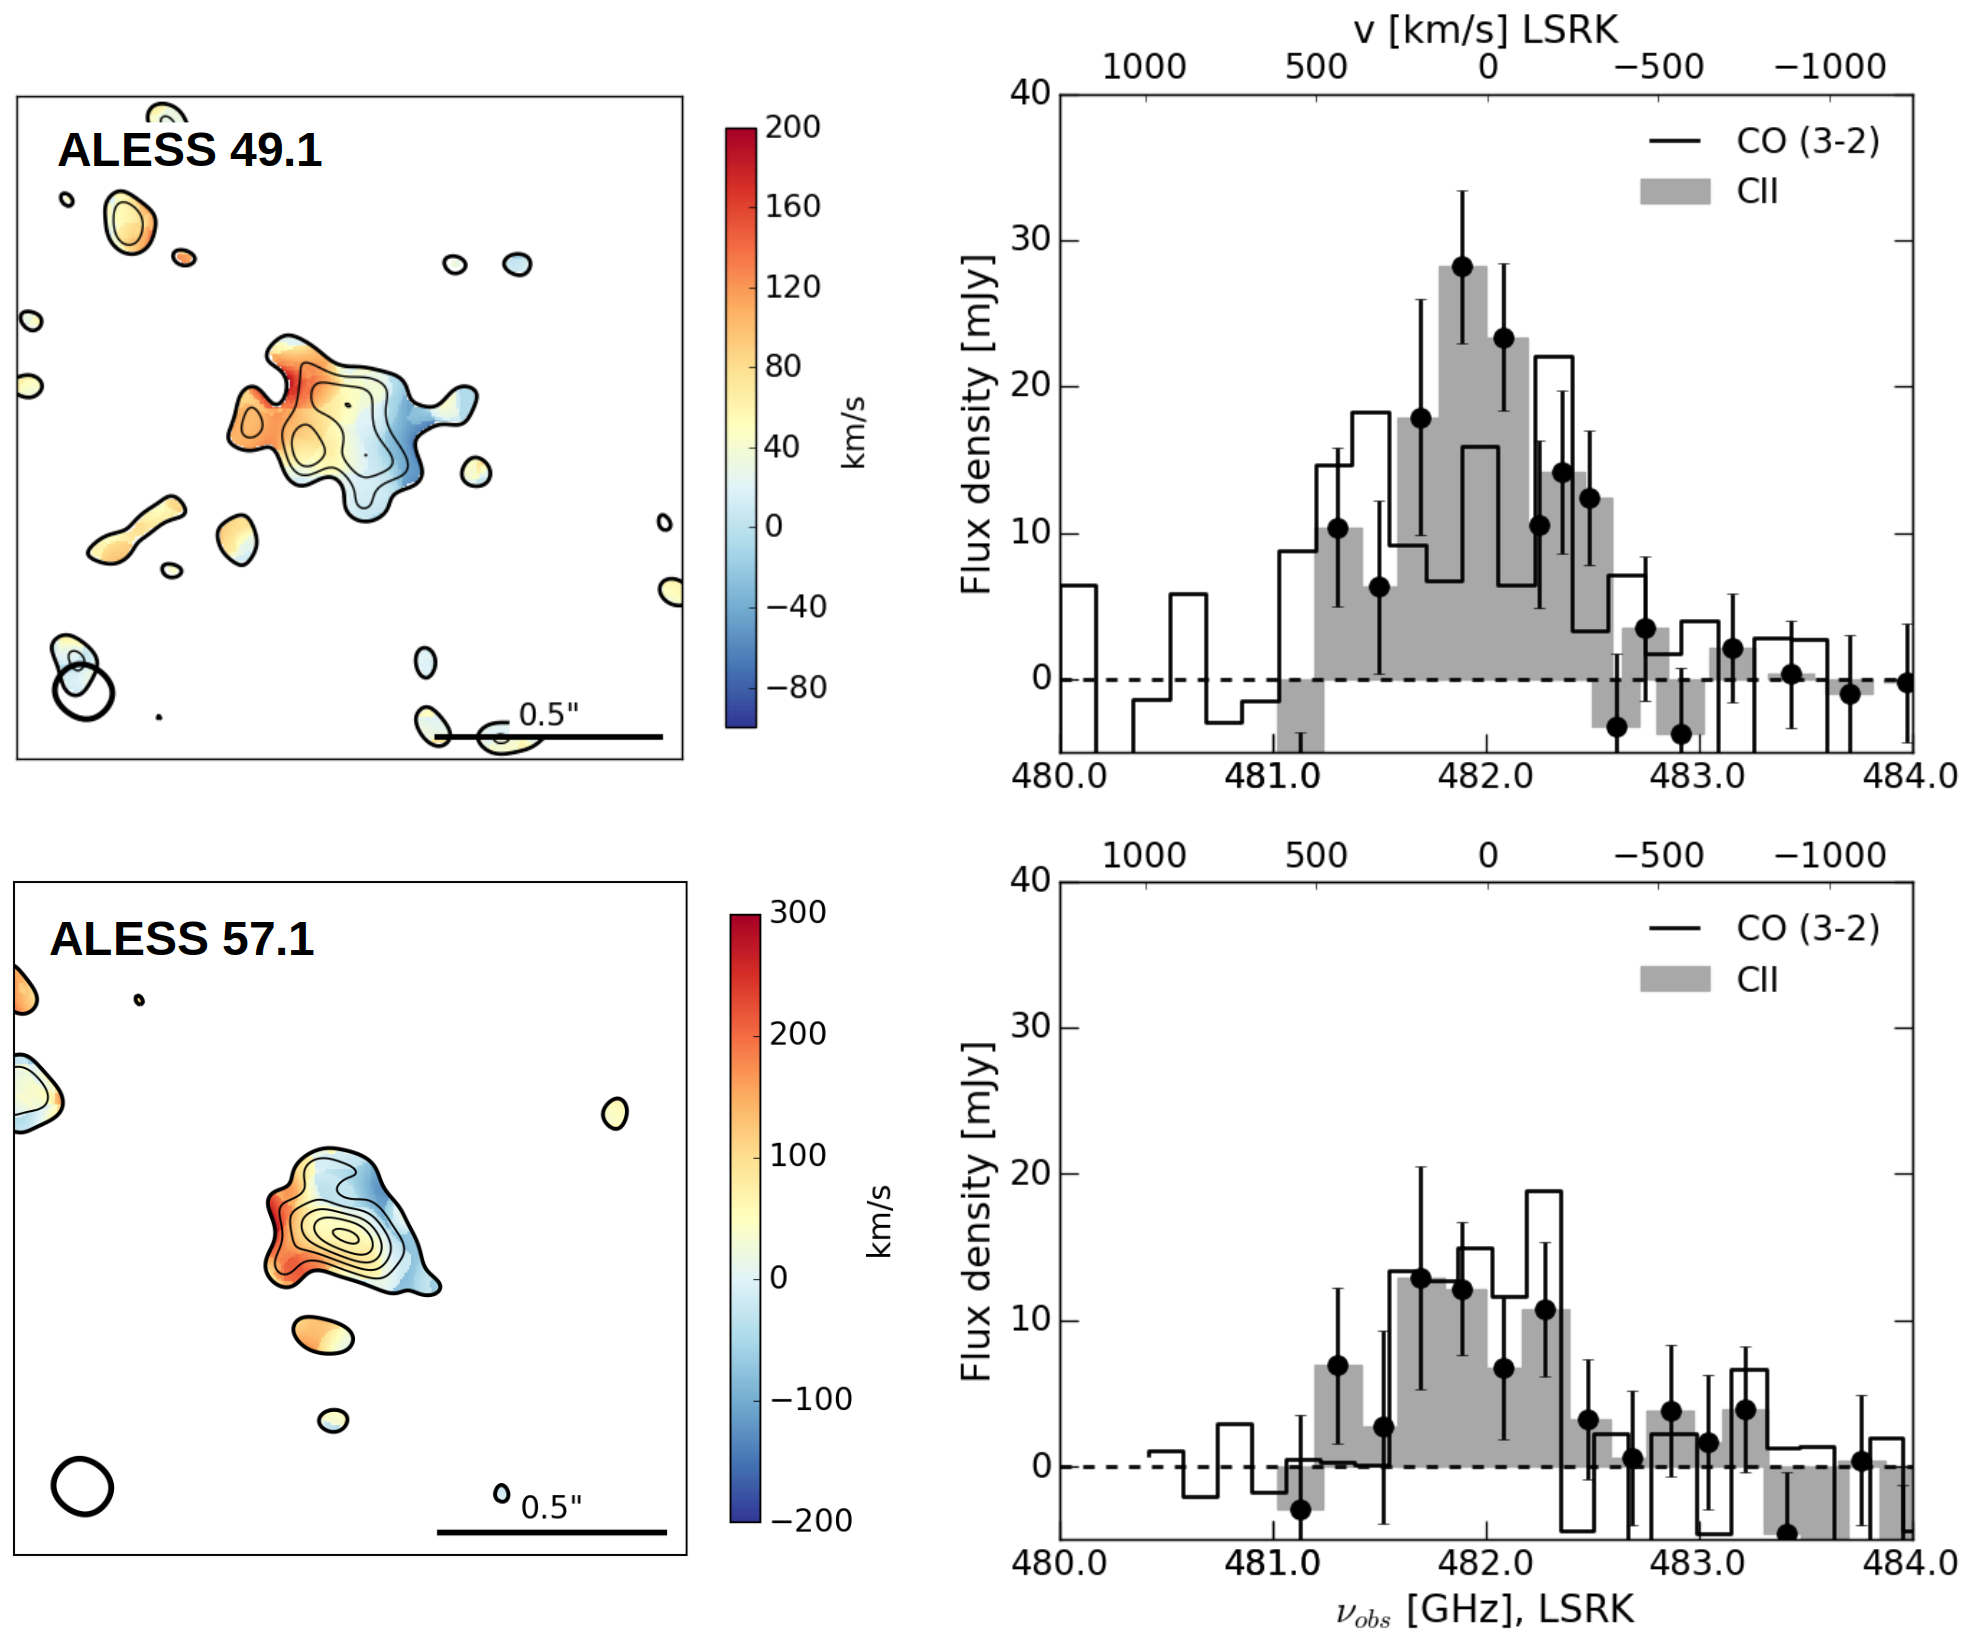 Figure 9
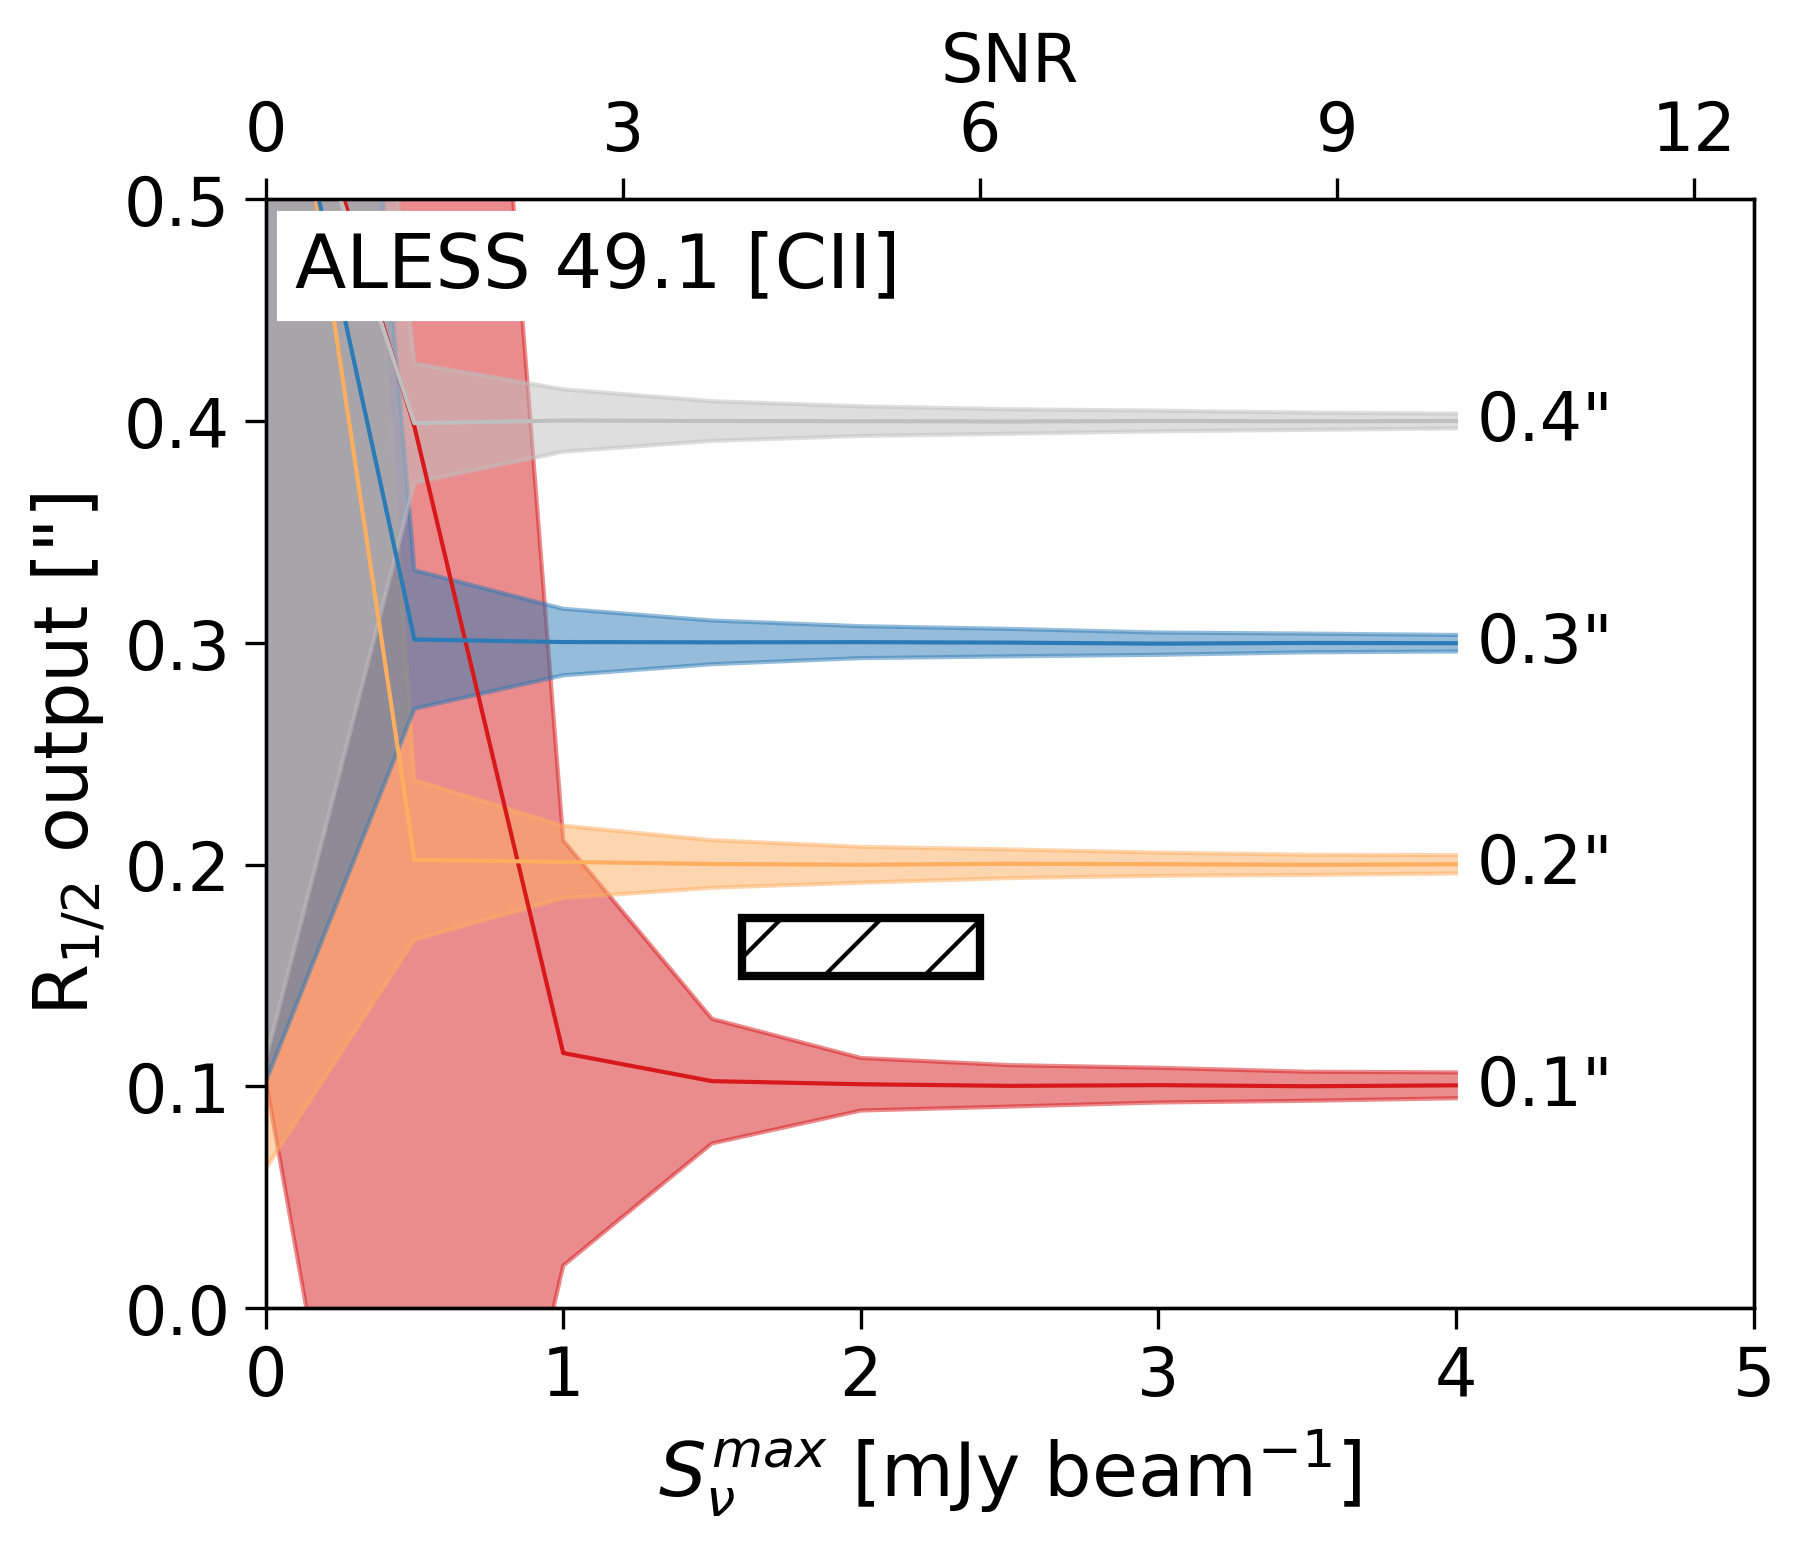 Figure 10
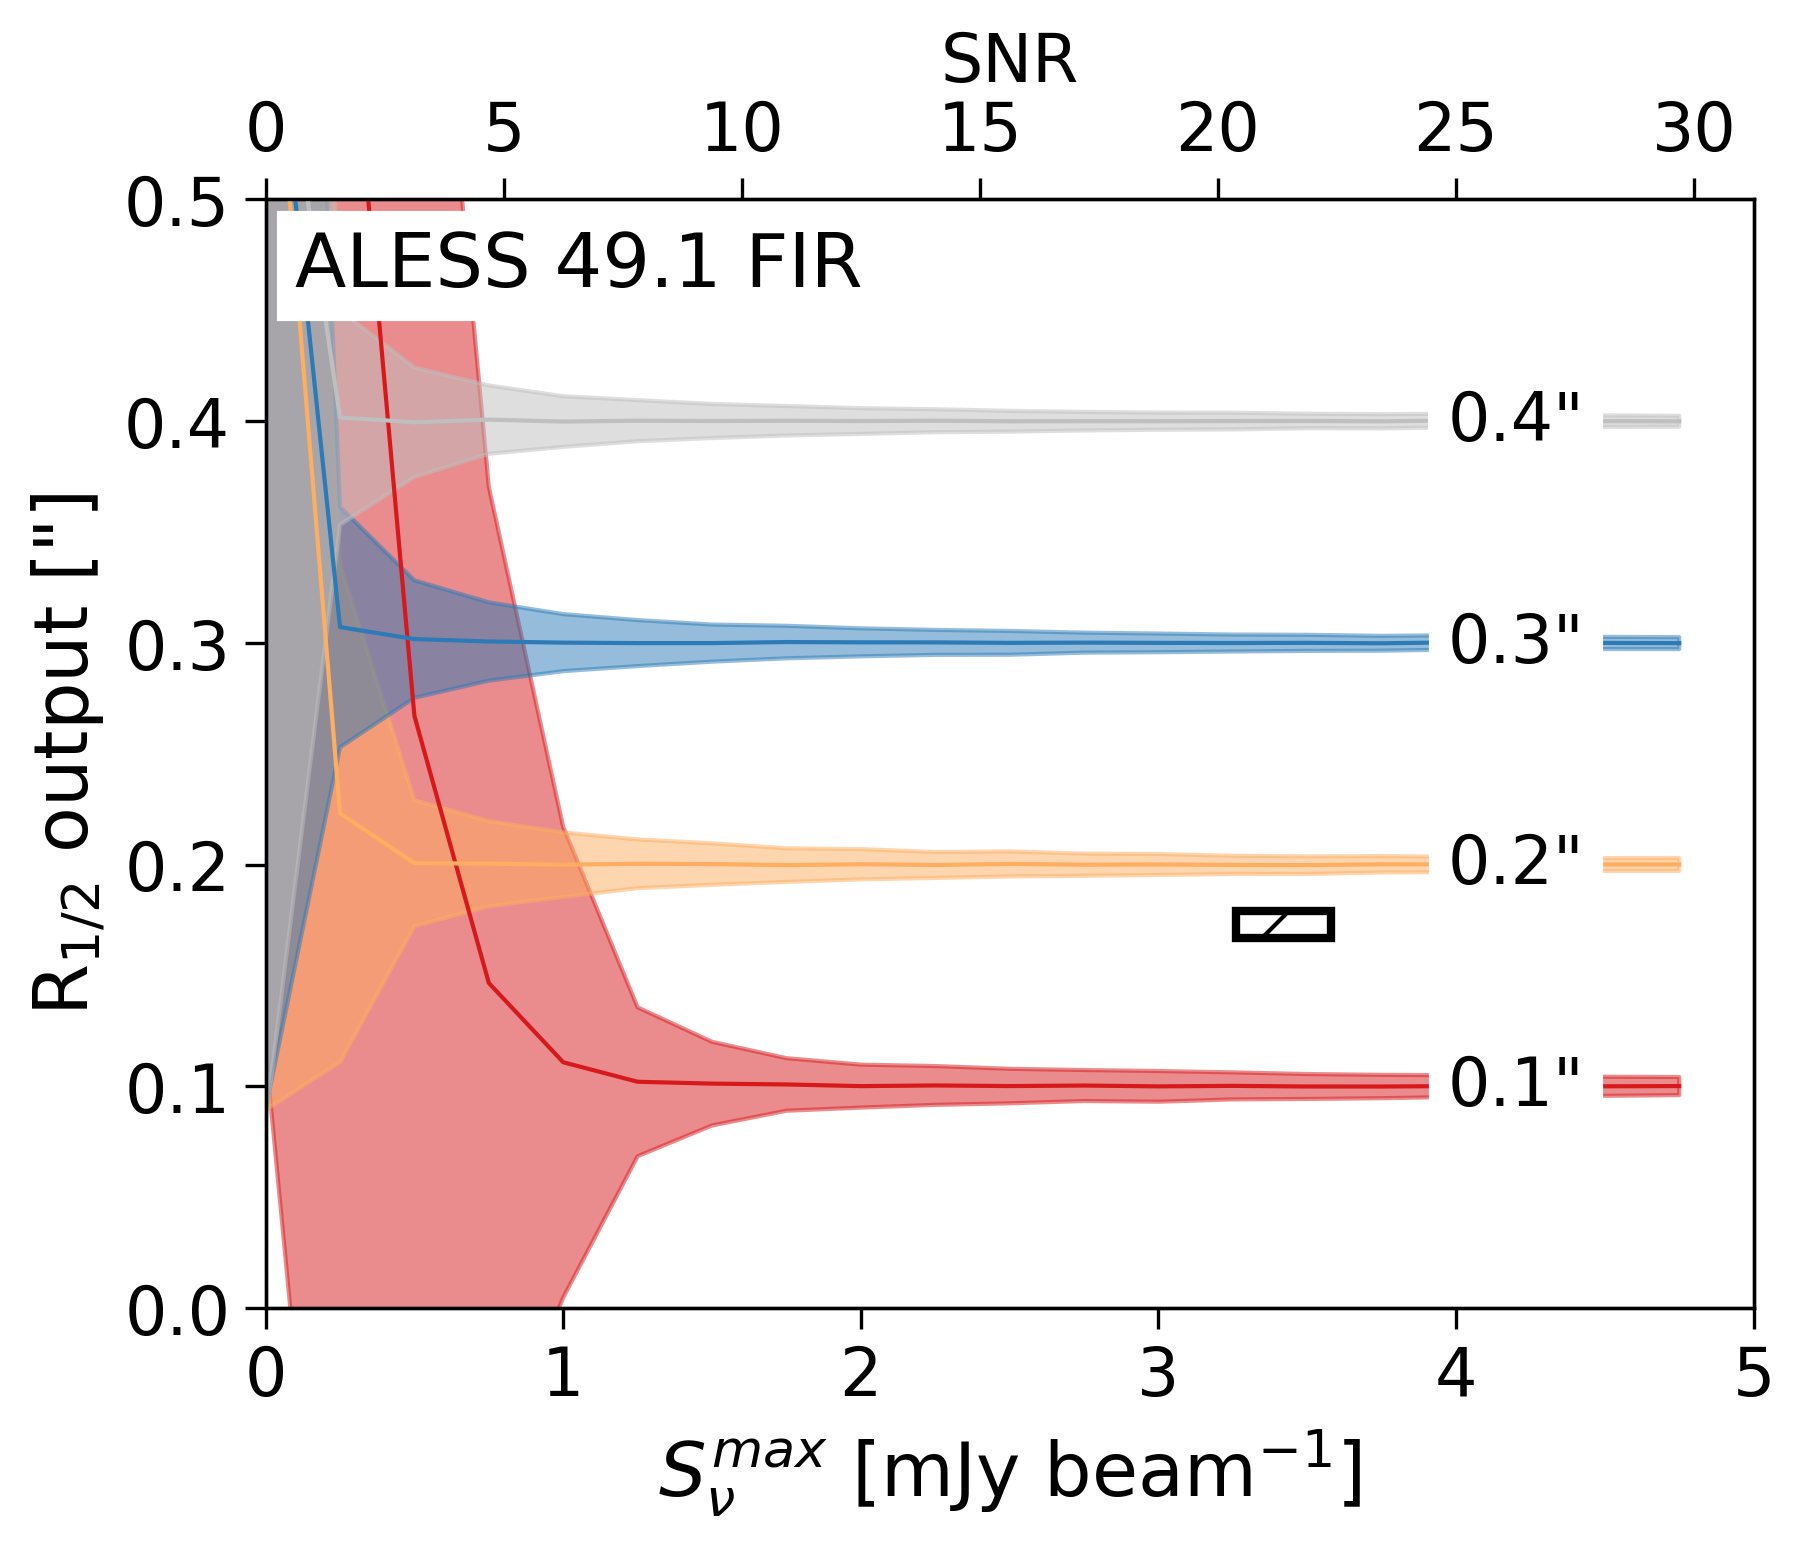 Figure 11
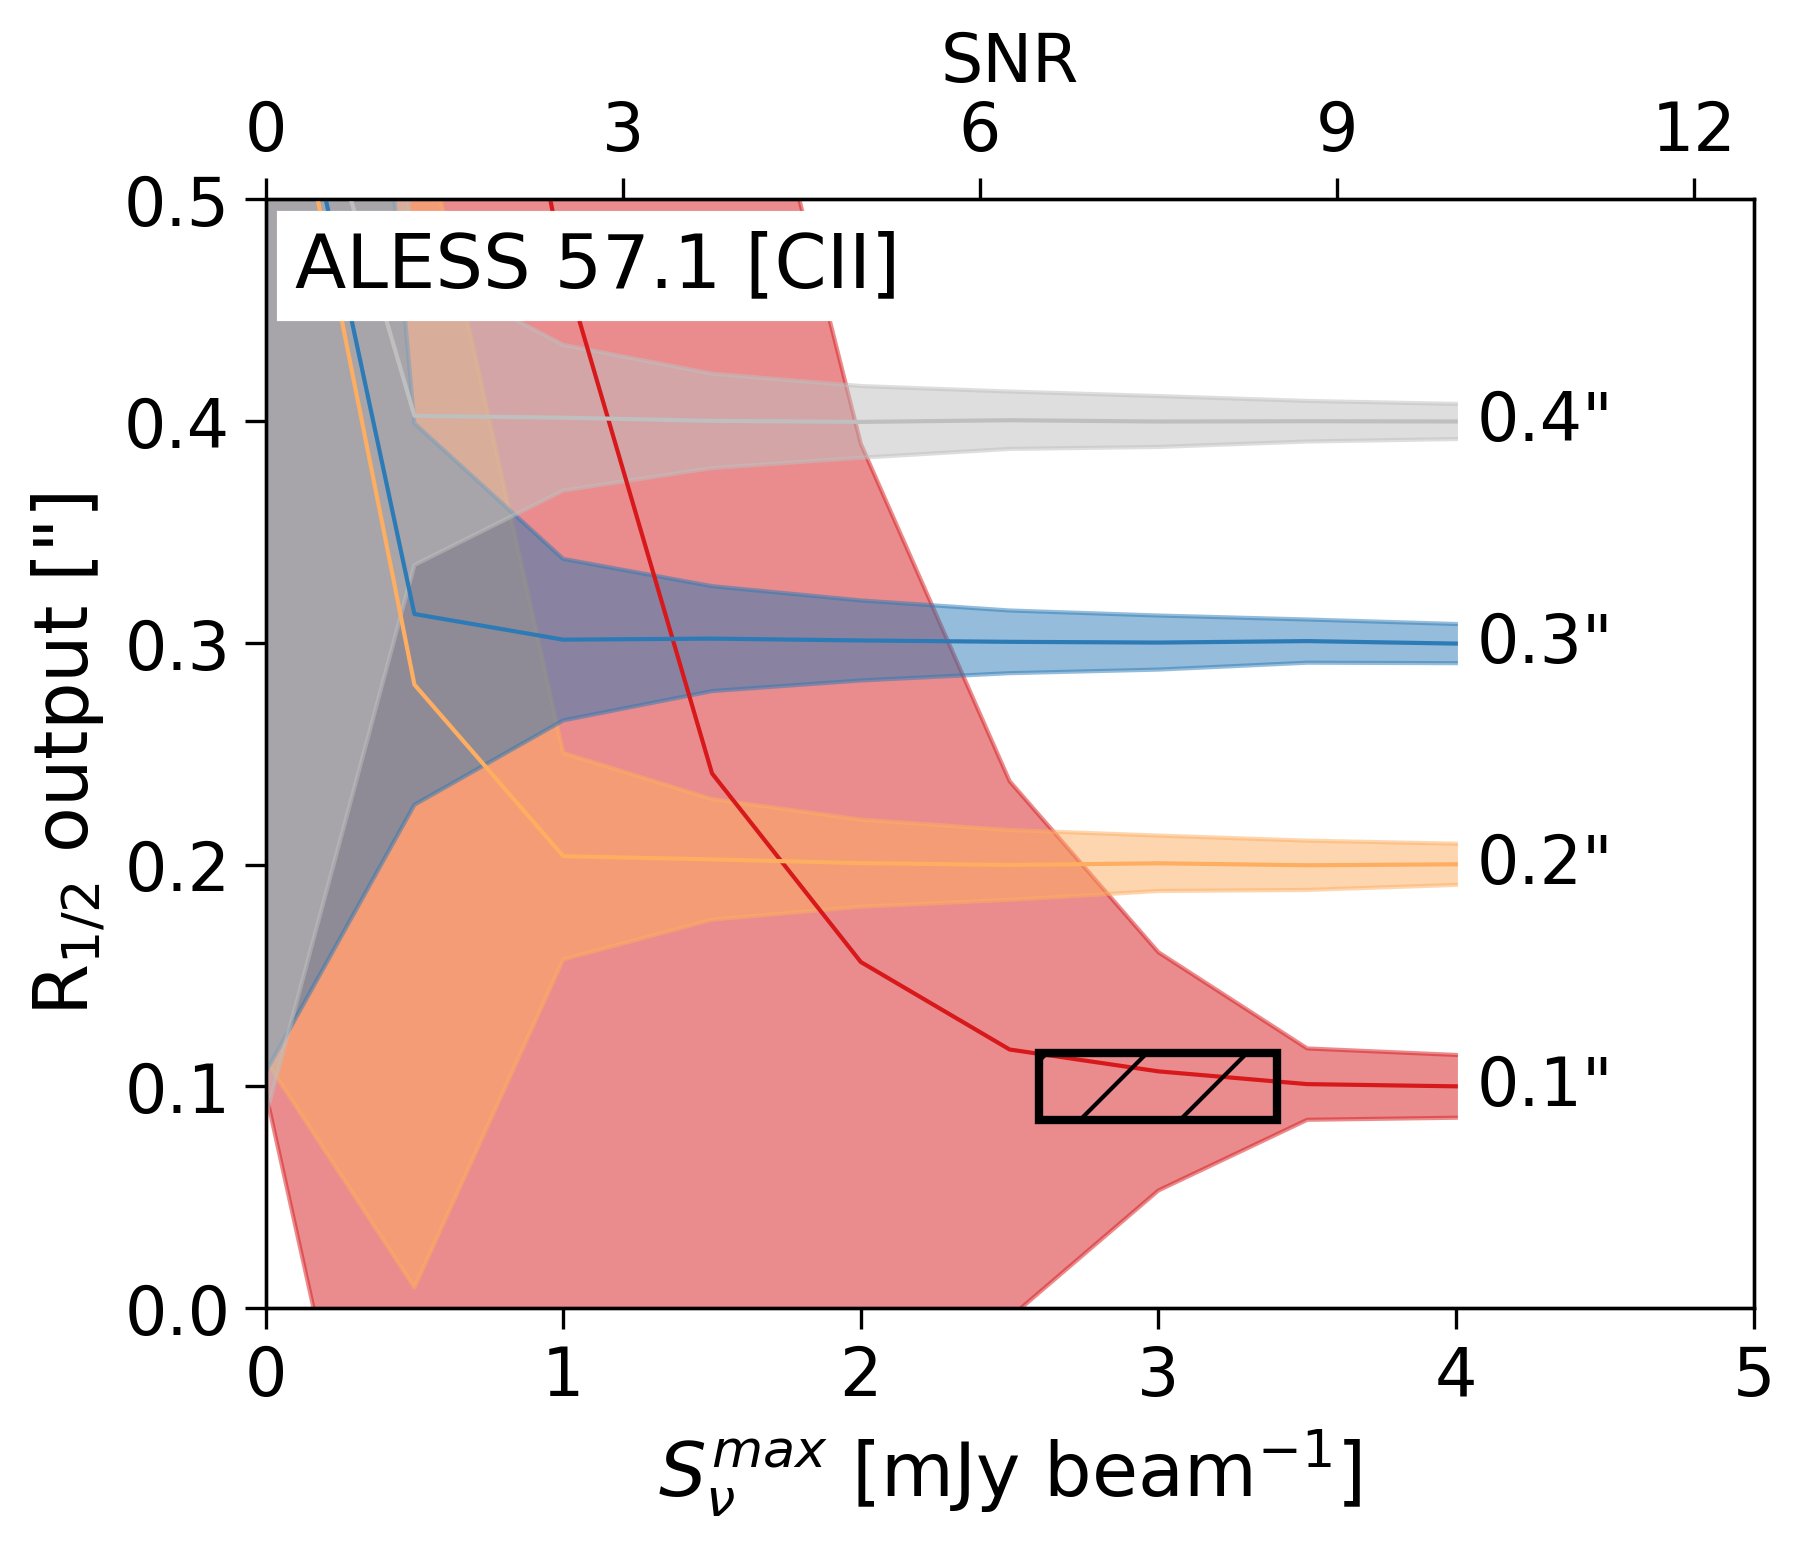 Figure 12
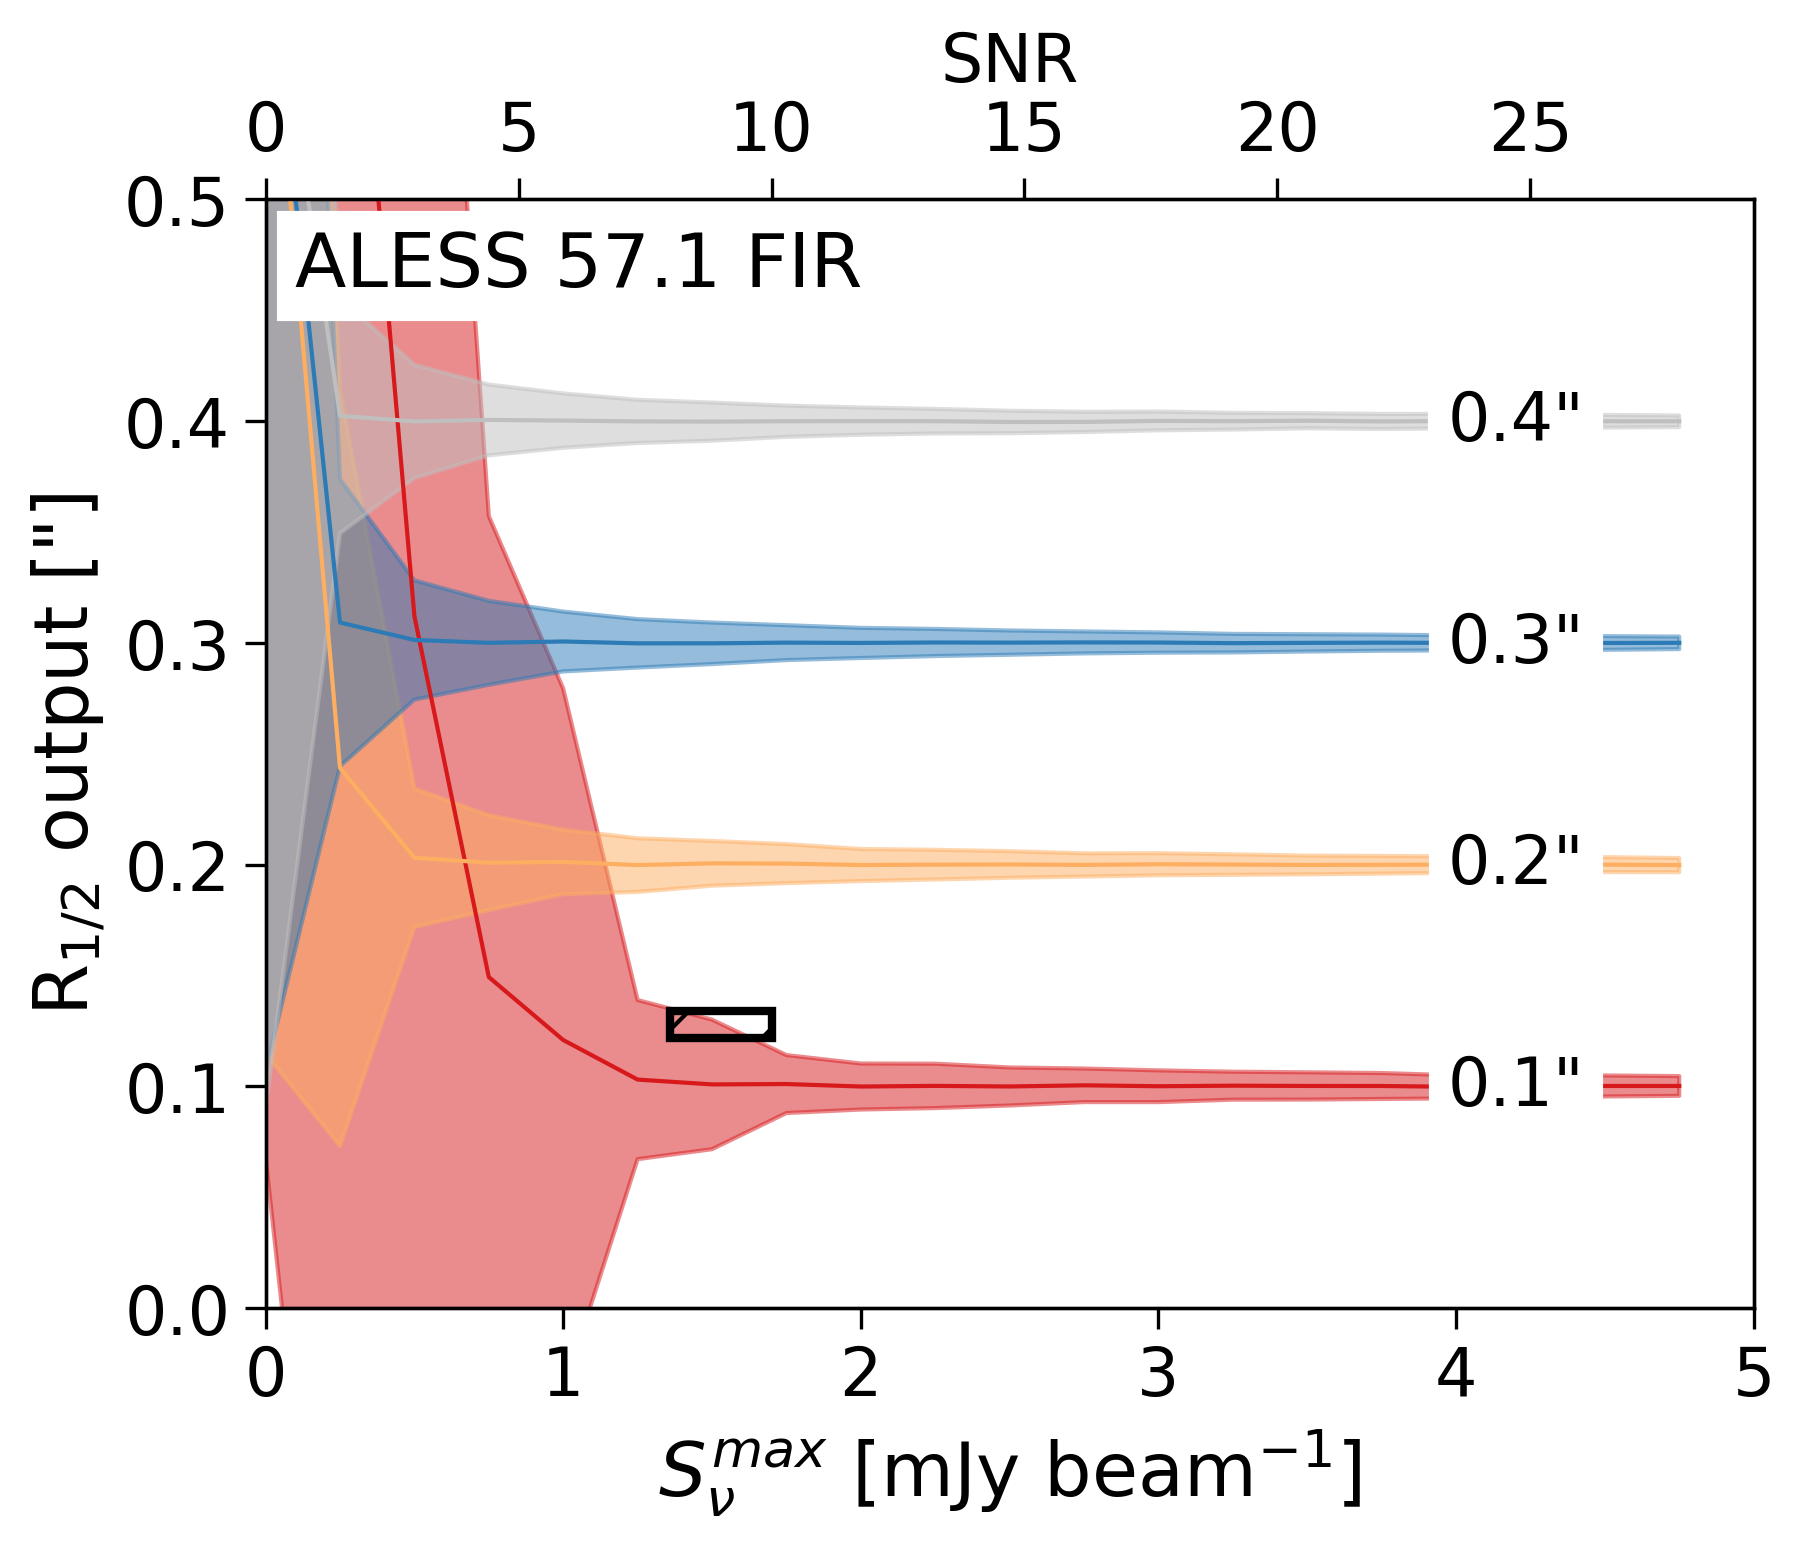 Figure 13
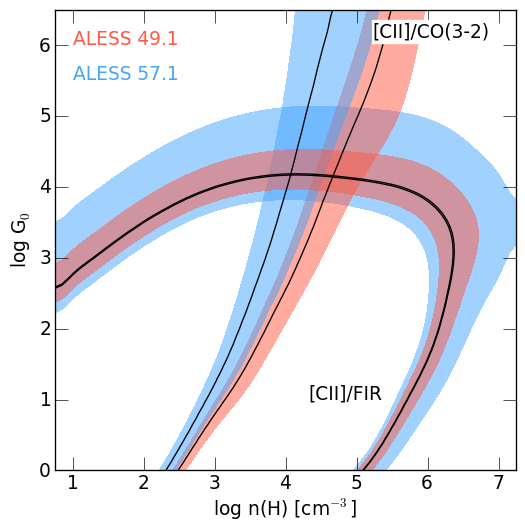 Figure 14
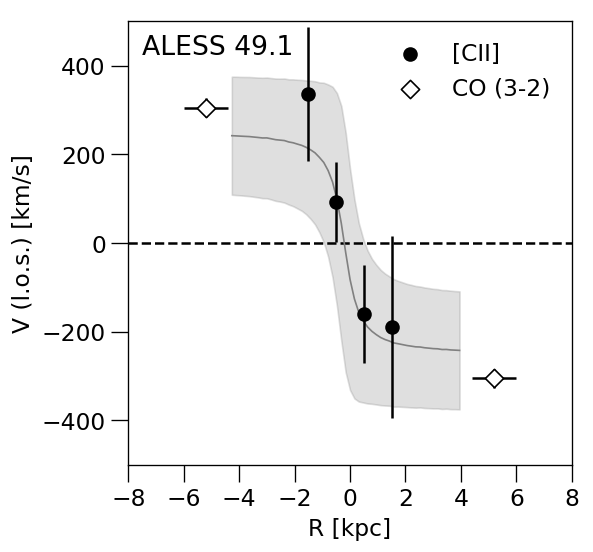 Figure 15
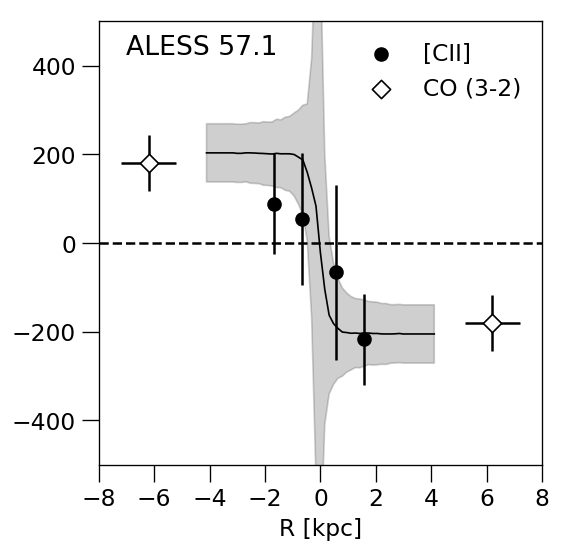 Figure 16
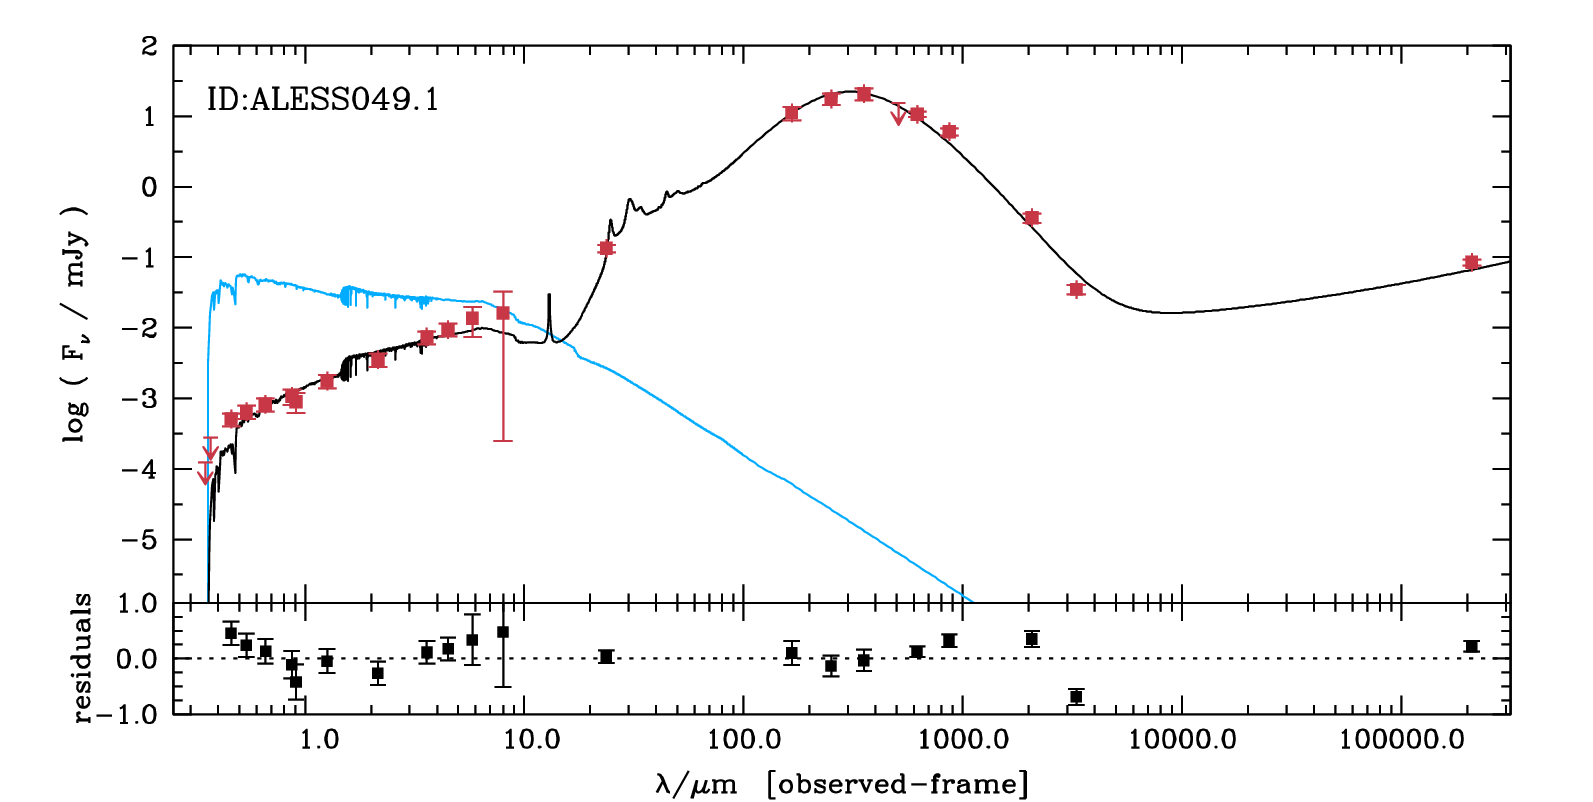 Figure 17
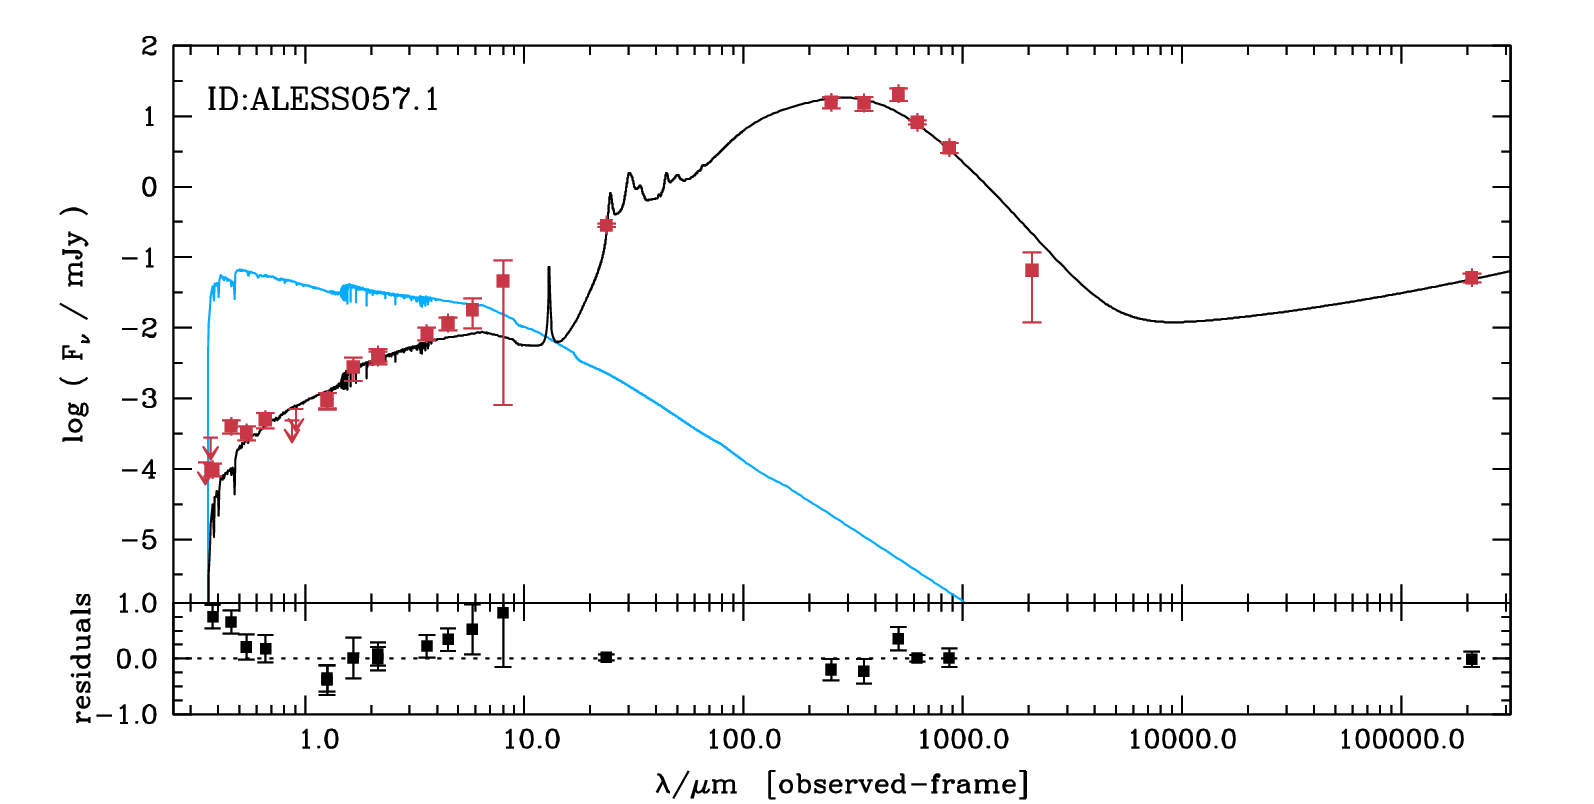 Figure 18
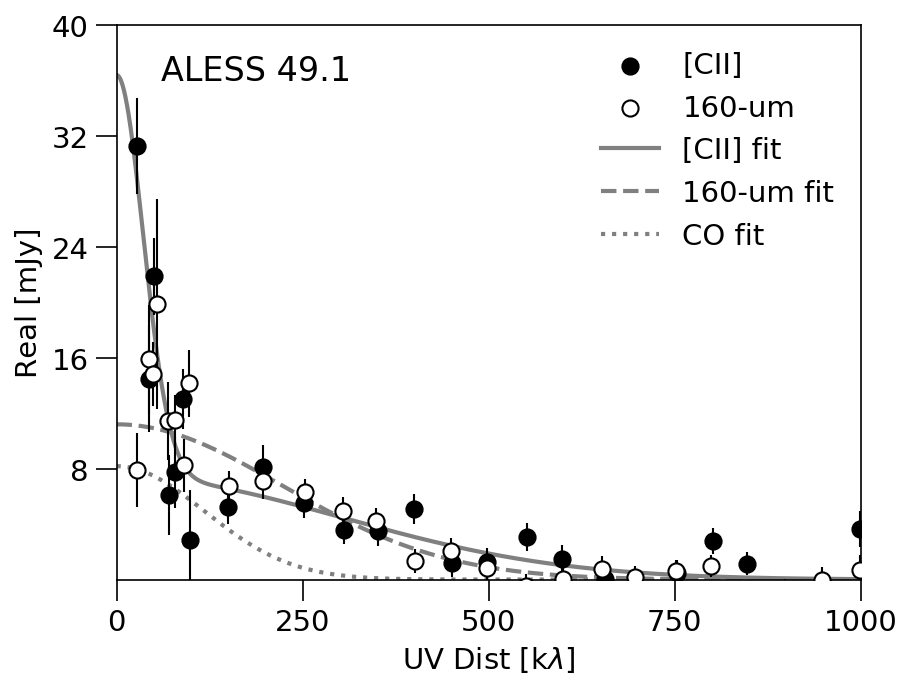 Figure 19
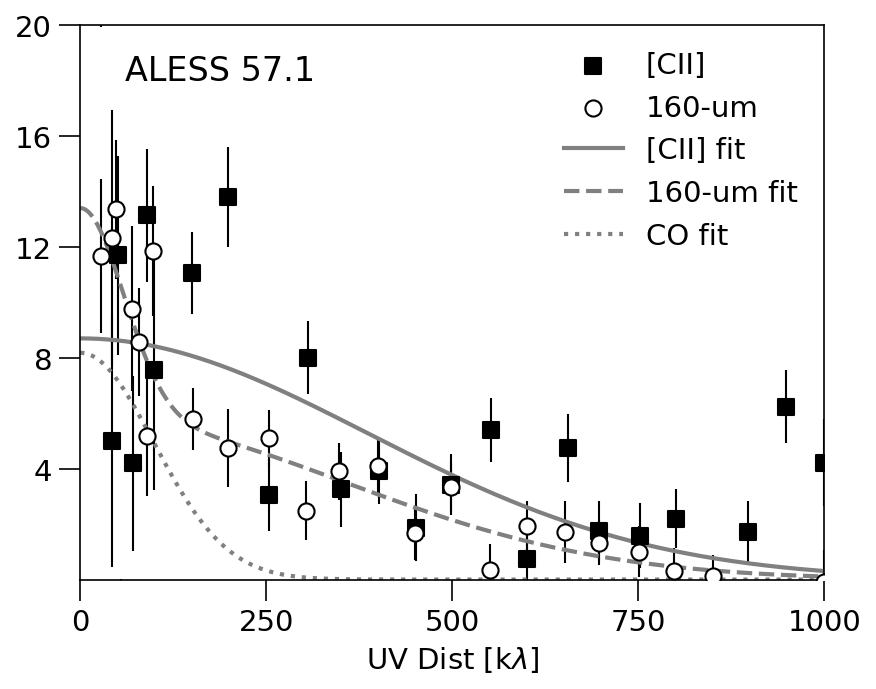 Figure 20
| Source | ALESS 49.1 | ALESS 57.1 | |
|---|---|---|---|
| RA (J2000) | 3:31:24.71 | 3:31:51.94 | |
| DEC (J2000) | 27:50:46.9 | 27:53:27.0 | |
| 2.9430.001 | 2.9430.002 | ||
| Beam FWHM | [arcsec] | 0.160.12 | 0.160.12 |
| Beam PA | [deg] | 53 | 56 |
| [mJy] | 10.71.0 | 8.20.5 | |
| [mJy beam-1] | 3.420.16 | 1.530.17 | |
| [mJy] | 15.42.8 | 8.82.5 | |
| [mJy beam-1] | 2.00.4 | 3.00.4 | |
| FWHM[CII] | [km s-1] | 600130 | 39070 |
| FWHM | [km s-1] | 61030 | 36090 |
| a adopted from Calistro Rivera et al. (2018). | |||
| b integrated over 800 and 710km s-1 for ALESS 49.1 and 57.1, respectively. | |||
| Source | ALESS 49.1 | ALESS 57.1 | |
|---|---|---|---|
| SED fitting | |||
| [ L⊙] | |||
| SFR | [M⊙ yr-1] | ||
| [K] | |||
| [ M⊙] | |||
| [ M⊙] | |||
| [ M⊙] | |||
| Line Luminosities | |||
| [ L⊙] | 3.00.8 | 1.10.4 | |
| [ K km s-1 pc2] | 144 | 5.11.7 | |
| [ L⊙] | 0.0700.005 | 0.0620.016 | |
| [ K km s-1 pc2] | 0.510.04 | 0.050.01 | |
| [ L⊙] | 2.10.2 | 2.60.7 | |
| Source sizes - single Gaussian | |||
| [arcsec] | 0.1630.013 | 0.1010.010 | |
| [mJy] | 10.90.9 | 8.60.9 | |
| [arcsec] | 0.1730.009 | 0.1280.006 | |
| [mJy] | 11.20.4 | 7.60.4 | |
| [arcsec] | 0.330.5 | 0.390.06 | |
| Source sizes - two Gaussians | |||
| (compact) | [arcsec] | 0.1280.015 | – |
| (extended) | [arcsec] | 1.10.3 | – |
| (compact) | [mJy] | 7.41.1 | – |
| (extended) | [mJy] | 298 | – |
| (compact) | [arcsec] | – | 0.1090.007 |
| (extended) | [arcsec] | – | 0.670.11 |
| (compact) | [mJy] | – | 5.80.5 |
| (extended) | [mJy] | – | 7.61.4 |
| [C II] and CO(3–2) kinematics | |||
| [deg] | 395 | 585 | |
| (2 kpc) | [ M⊙] | ||
| [M⊙] | |||
| a Calistro Rivera et al. (2018): integrated over the entire line width | |||
| as opposed to integrating only over FWHM as in Calistro Rivera et al. (2018) | |||
| b Calistro Rivera et al. (2018). estimated assuming = 1.0. | |||
| Source | ALESS 49.1 | ALESS 57.1 | |
|---|---|---|---|
| [C II]/FIR | |||
| [C II]/CO(3–2) | |||
| [C II] optically thin | |||
| (H) | [cm | ||
| [K] | |||
| [C II] optically thick | |||
| (H) | [cm | ||
| [K] | |||
Peer Reviews
No public reviews on file for this paper yet. If you reviewed it on a platform where reviews are public (OpenReview, ICLR, NeurIPS, ICML), you can paste yours below so the community can read it here.
Videos
No videos yet. Explain this paper in a talk, walkthrough, or lecture? Add one.
Strong FUV fields drive the [CII]/FIR deficit in dusty, star-forming galaxies
Matus Rybak
Leiden Observatory, Leiden University, PO Box 9513, NL-2300 RA Leiden, the Netherlands
G. Calistro Rivera
Leiden Observatory, Leiden University, PO Box 9513, NL-2300 RA Leiden, the Netherlands
J. A. Hodge
Leiden Observatory, Leiden University, PO Box 9513, NL-2300 RA Leiden, the Netherlands
Ian Smail
Centre for Extragalactic Astronomy, Department of Physics, Durham University, South Road, Durham DH1 3LE, United Kingdom
F. Walter
Max Planck Institute for Astronomy, Königstuhl 17, 69117 Heidelberg, Germany
P. van der Werf
Leiden Observatory, Leiden University, PO Box 9513, NL-2300 RA Leiden, the Netherlands
E. da Cunha
The Australian National University, Mt Stromlo Observatory, Cotter Rd, Weston Creek, ACT 2611, Australia
Chian-Chou Chen
European Southern Observatory, Karl-Schwarzschild-Strasse 2, 85748 Garching bei München, Germany
H. Dannerbauer
Dpto. Astrofísica, Universidad de La Laguna, E-38206 La Laguna, Tenerife, Spain
R. J. Ivison
Institute of Astronomy, University of Edinburgh, Royal Observatory, Blackford Hill, Edinburgh EH9 3HJ, United Kingdom
European Southern Observatory, Karl-Schwarzschild-Strasse 2, 85748 Garching bei München, Germany
A. Karim
Max-Planck-Institut für Radioastronomie, Auf dem Hügel 69, D-53121 Bonn, Germany
J. M. Simpson
Academia Sinica Institute of Astronomy and Astrophysics, No. 1, Sec. 4, Roosevelt Road, Taipei 10617, Taiwan
A. M. Swinbank
Centre for Extragalactic Astronomy,Department of Physics,Durham University, South Road, Durham DH1 3LE, United Kingdom
J. L. Wardlow
Physics Department, Lancaster University, Bailrigg, Lancaster LA1 4YB, United Kingdom
(Received October 6, 2018)
Abstract
We present 0.15-arcsec (1 kpc) resolution ALMA observations of the [C II] 157.74 m line and rest-frame 160-m continuum emission in two dusty, star-forming galaxies - ALESS 49.1 and ALESS 57.1, combined with resolved CO(3–2) observations. In both sources, the [C II] surface brightness distribution is dominated by a compact core 1 kpc in radius, a factor of 2–3 smaller than the extent of the CO (3–2) emission. In ALESS 49.1, we find an additional extended (8-kpc radius), low surface-brightness [C II] component. Based on an analysis of mock ALMA observations, the [C II] and 160-m continuum surface brightness distributions are inconsistent with a single-Gaussian surface brightness distribution with the same size as the CO(3–2) emission. The [C II] rotation curves flatten at kpc radius, suggesting the kinematics of the central regions are dominated by a baryonic disc. Both galaxies exhibit a strong [C II]/FIR deficit on 1-kpc scales, with FIR-surface-brightness to [C II]/FIR slope steeper than in local star-forming galaxies. A comparison of the [C II]/CO(3–2) observations with PDR models suggests a strong FUV radiation field () and high gas density ( cm*-3*) in the central regions of ALESS 49.1 and 57.1. The most direct interpretation of the pronounced [C II]/FIR deficit is a thermal saturation of the C+ fine-structure levels at temperatures K, driven by the strong FUV field.
submillimeter: galaxies – galaxies: high-redshift – galaxies: star formation
††journal: ApJ
1 Introduction
Dusty, star-forming, submillimeter galaxies (DSFGs, SMGs) are a major contributor to the global star-formation rate between redshifts , at an epoch when the star-forming activity of the Universe was at its peak (e.g., Casey et al. 2014). Although few in numbers, thanks to their high star-formation rates (SFR 100 M⊙ yr*-1*), up to 20% of all the star formation at takes place in SMGs (Swinbank et al., 2014).
The massive dust reservoirs in SMGs absorb the UV/optical radiation from the newborn stars, mostly re-radiating it thermally as a rest-frame FIR/sub-mm continuum111Following (Casey et al., 2014), we consider SMGs to comprise high-redshift galaxies with a continuum flux 1 mJy between 250 m and 2 mm.. Therefore, studying the structure and physical properties in these extreme sources requires relying on sub-mm/mm bright tracers – the dust continuum (which directly traces the obscured star formation) and low- CO rotational transitions222In this work, we use the term “low-” transitions for the rotational transitions with . (which trace the cold, molecular gas that fuels the star formation, Carilli & Walter 2013).
Besides the FIR continuum and CO emission, the third bright rest-frame FIR tracer of the star-forming interstellar medium (ISM) is the [C II] 157.74 m line, a fine-structure transition of C+ ions. Due to its low ionization energy (11.3 eV) and a relatively low critical density, [C II] traces of a wide range of ISM phases – from the ionized H II regions to warm molecular clouds to diffuse gas. Depending on the environmental conditions, the upper fine-structure level is populated predominantly by collisions with H, H2 or electrons (Goldsmith et al., 2012).
Starting in the early 1990’s, systematic studies of [C II] emission in local galaxies were enabled by the Infrared Space Observatory and the Kuiper Airborne Observatory. These observations revealed a tight correlation between the [C II] line and FIR continuum emission from the heated dust at low SFR surface densities (e.g., Stacey et al. 1991). However, this correlation breaks at larger FIR surface brightness – the so-called “[CII]/FIR deficit” (e.g., Malhotra et al. 1997; Luhman et al. 1998; Malhotra et al. 2001; Luhman et al. 2003) – with the [C II]/FIR ratio decreasing with increasing .
In the last decade, the study of [C II] emission in the nearby Universe was revolutionized by Herschel. The largest sample of [C II] observations in nearby starburst galaxies was presented by Díaz-Santos et al. (2013), who obtained PACS spectroscopic observations of the 241 galaxies from the Great Observatories All-sky LIRG Survey (GOALS, Armus et al. 2009). Further systematic studies of the [C II] emission in local galaxies have confirmed strong correlation of the [C II]/FIR deficit with down to 200-pc scales, in a wide range of environments from normal galaxies (Smith et al., 2017; Herrera-Camus et al., 2018) to starbursts (Díaz-Santos et al., 2017) and AGN hosts (Herrera-Camus et al., 2018).
At the highest redshifts (), the importance of the [C II] line increases dramatically, as the raised CMB temperature renders the low- CO emission undetectable, while the [C II] line remains relatively unaffected (da Cunha et al., 2013; Vallini et al., 2015; Lagache et al., 2018). Indeed, with the advent of Atacama Large Millimeter/submillimeter Array (ALMA), [C II] observations are now increasingly used to determine redshifts and dynamical masses of high-redshift galaxies, including some of the most distant systems (Walter et al., 2009; Brisbin et al., 2015; Gullberg et al., 2015; Oteo et al., 2016; Carniani et al., 2018; Decarli et al., 2018; Smit et al., 2018). Most recently, Gullberg et al. (2018) presented deep, 30-mas resolution (200 pc physical scale) ALMA observations of the [C II] line in four (unlensed) =4.4–4.8 galaxies. Although their observation suffered from a very sparse -plane coverage, they found the resolved [C II]-FIR deficit at 4.5 to follow the trend seen in local galaxies. Similarly, high-resolution ALMA observations of [C II]/FIR deficit in two strongly lensed galaxies at =1.7 and 5.6 were recently presented by Lamarche et al. (2018) and Litke et al. (2018), respectively, showing a pronounced [C II]/FIR deficit () on (sub)kpc scales.
Despite the recent progress, it is still unclear how well the results and relations derived from local observations hold for the high-redshift population, especially the intensely star-forming high-redshift SMGs, with two to three orders of magnitude higher than the local star-forming galaxies ( M⊙ yr*-1* kpc*-2*, e.g., Smith et al. 2017). To directly compare the [C II] emission in high-redshift SMGs to the local galaxies and study its connection to the star-formation, high-resolution (kpc-scale) observations of the [C II] emission, alongside the rest-frame FIR continuum (tracing the obscured star formation) and the low- CO emission tracing the molecular gas are necessary.
At high redshift, such resolved, multi-tracer studies are limited by the angular extent of the source (few arcseconds at most) and the need for robust redshifts to ensure that both [C II] and low- CO emission are observable from the ground. For example, Stacey et al. (2010) compared unresolved [C II]/FIR/CO() observations of a heterogeneous sample of galaxies. Gullberg et al. (2015) compared [C II], FIR and CO(2–1)/(1–0) observations in 20 strongly lensed SMGs (=2.1–5.7); they found the [C II] and CO line profiles to be very similar, suggesting that they originate from the same source-plane regions. However, the limited spatial resolution of these observations prevented a robust source-plane reconstruction of the CO/[C II] emission; the differential magnification bias (e.g., Serjeant 2012) therefore could not be eliminated. In addition, several individual sources at have been studied in both [C II] and low- CO emission (e.g., Walter et al. 2009; Huynh et al. 2014; Cicone et al. 2015), though these tend to be extreme sources in terms of FIR brightness and AGN activity.
Finally, the [C II] line has been proposed as an alternative to CO emission as a molecular gas tracer (e.g., Zanella et al. 2018). However, in SMGs, the spatial extent of CO emission has been shown to vary strongly with (e.g., Ivison et al. 2011; Riechers et al. 2011). If [C II] emission traces only a subset of the molecular gas reservoir, [C II]-based mass estimates might be severely biased.
In this paper, we explore a new regime in resolved, multi-tracer studies by investigating resolved [C II], FIR continuum and CO(3–2) emission on kpc-scales in two (unlensed) sources. This allows us to address the following questions:
- •
How does the resolved [C II]/FIR ratio at 3 compare to that seen in local and high-redshift star-forming galaxies?
- •
What physical mechanism drives the [C II]/FIR deficit in SMGs?
- •
How well does the [C II] emission trace the molecular gas reservoir in SMGs?
Compared to the high-redshift, high-resolution [C II]-only studies (e.g., Gullberg et al. 2018; Zanella et al. 2018), resolved emission line maps of two different species (C+ and 12CO) allow us to study the relation between [C II] emission and the colder molecular gas.
This paper is structured as follows: in Section 2, we give the details of ALMA observations. Section 3 details the processing of the data in both the image- and -plane, the assessment of the systematic errors and kinematic modelling. Section 4 presents the spatial and kinematic comparison of the interpretation of the [C II]/CO(3–2)/FIR observations, results of PDR modelling and a discussion of the physical processes driving the [C II]/FIR deficit. Finally, Section 5 summarizes the conclusions of this paper.
Throughout this paper we use a flat CDM cosmology from Planck Collaboration et al. (2016). We adopt the CO(3–2) spectroscopic redshifts from Calistro Rivera et al. (2018): =2.9430.001 and =2.9430.002 for ALESS 49.1 and 57.1. Consequently, 1 arcsec corresponds to 7.9 kpc for both ALESS 49.1 and ALESS 57.1; the luminosity distance to both sources is 25445 Mpc (Wright, 2006).
2 Observations and data reduction
2.1 Sample selection
The two galaxies analyzed in this paper were identified by Hodge et al. (2013) as a part of the ALESS survey. The ALESS survey was an ALMA Cycle 0 870 m imaging campaign targeting all 126 sources discovered in the LABOCA Extended Chandra Deep Field South Submillimeter Survey (LESS, Weiß et al. 2009). With ALMA Cycle 0 observations providing a significant improvement over the LABOCA map in both resolution (beam area reduced by a factor of 200) and sensitivity (increased by a factor of 3), the ALESS survey identified 99 distinct sub-mm bright galaxies in its primary sample (Hodge et al., 2013). Out of these, at the time of the proposal (2015 April) only four – ALESS 49.1, 57.1, 67.1 and 122.1 – had robust redshifts that allowed for ALMA observations of both the low- CO and [C II] lines. The spectroscopic redshifts were acquired using VLT-FORS2/VIMOS and Keck-DEIMOS, and are based on multiple line detections (Danielson et al., 2017).
In this paper, we present the ALMA Band 8 observations targeting the [C II] line and rest-frame 160-m continuum. The corresponding Band 3 observations, targeting the CO (3-2) (=345.795 GHz) emission, were recently presented by Calistro Rivera et al. (2018).
2.2 ALMA Band 8 observations
The observations were carried out as part of the ALMA Cycle 3 Project #2015.1.00019.S (PI: J. Hodge) on 2016 August 12. Only ALESS 49.1 and ALESS 57.1 ([C II] line in ALMA Band 8) were observed; ALESS 67.1 () and ALESS 122.1 () have the [C II] line in ALMA Band 9, and were not observed. The total time including calibration and overheads was 72 mins, with an on-source time of 11 mins per target. The array configuration consisted of 38 12-m antennas, with baselines extending up to 1400 m. The largest angular scale333The largest angular scale is estimated as 0.983/, where is the 5-th percentile -distance (ALMA Cycle 5 Technical Handbook). of the observations is 1.9 arcsec for both sources. The primary beam FWHM is 14.1 arcsec. Synthesized beam sizes and for the 160-m continuum and the [C II] emission are listed in Table 1. The target elevation range was 66–73 deg for ALESS 49.1 and 67–76 deg for ALESS 57.1.
The frequency setup was configured in four spectral windows (SPWs) in Band 8. The individual SPWs were centered at 481.953, 483.183, 493.506, 495.386 GHz. Each SPW was split into 480 frequency channels 3.906 MHz wide, giving a total bandwidth of 1.875 GHz per SPW. The radio-velocity resolution was 2.42 km s*-1*. Both the Stokes and parameters were observed.
The data were calibrated using the standard ALMA pipeline, with additional flagging necessary to remove atmospheric features (see Section 3.1). All the visibility data processing apart from imaging was performed using Casa versions 4.7 and 5.0 (McMullin et al., 2007).
The spectral structure of the [C II] line overlaps with atmospheric absorption features at 481.2 and 481.6 GHz. Consequently, the noise level in the affected channels is raised by a factor of 2. This issue is particularly severe for ALESS 49.1. Another atmospheric feature is located in a line-free SPW at 496.35 GHz; here, the affected channels were flagged to improve the continuum SNR. As will be outlined in Section 3.1, we use a channel-dependent threshold for the deconvolution process to avoid introducing noise features from the affected channels.
To increase the signal-to-noise ratio, each line was split into frequency bins 120 km s*-1* wide. Additionally, we time-averaged the data using a 30-second bin; this corresponds to an average intensity loss of 0.5 per cent at 5 arcsec from the phase-tracking centre, which we consider negligible444Taylor et al. (1999), equation (18–42).. The time-bin size was chosen so as to prevent significant time-averaging smearing. The two linear polarizations were combined into the Stokes intensity .
2.3 ALMA Band 3 observations
ALMA Band 3 observations of the CO(3–2) and rest-frame 1.0-mm continuum in ALESS 49.1 and 57.1 were presented by Calistro Rivera et al. (2018). These consisted of Cycle 2 observations of ALESS 49.1 and 57.1 (Project #2013.1.00470.S; PI: J. Hodge) at 0.34-0.67 arcsec resolution, and additional Cycle 4 observations of ALESS 49.1 (Project #2016.1.00754.S; PI: J. Wardlow) at 1.1-arcsec resolution. The naturally-weighted Band 3 synthesized beam size is 0.690.63 arcsec for ALESS 49.1 (after concatenating the Cycles 2 and 4 data) and 0.670.60 arcsec for ALESS 57.1, with a continuum of 17.6 and 19.5 Jy beam*-1*, respectively. For a detailed description of the data and the resulting analysis, we refer the reader to Calistro Rivera et al. (2018).
3 Results
3.1 Image analysis
3.1.1 Imaging
We perform synthesis imaging of the visibility data using the Ws-Clean algorithm introduced by Offringa et al. (2014), specifically its multi-scale version (Offringa & Smirnov, 2017). The multi-scale Ws-Clean is an advanced deconvolution algorithm with a multi-scale, multi-frequency capability (Offringa & Smirnov, 2017). Another advantage of the Ws-Clean as opposed to the Casa implementation is the channel-dependent deconvolution threshold. As the noise level changes appreciably with frequency due to atmospheric lines, this prevents us from introducing noise-peaks from the affected channels into the reconstructed images.
For the line imaging, we first subtract the continuum by linearly interpolating the line-free channels in SPWs 1, 2, and 3 and subtract the continuum slope from the line-containing channels. The continuum channels overlapping with the atmospheric lines were flagged before the continuum subtraction. For the continuum imaging, we discard the entire SPW 0 and the line-containing channels in SPW1, as well as the channels affected by the atmospheric feature around 496.35 GHz.
The data were deconvolved on a sky-plane grid of 1024 1024 5-mas pixels (total FoV size = 5.1155.115 arcsec), using natural weighting. We use the automatic SNR-based masking, with auto-mask SNR threshold of 2.
For consistency, we re-image the CO(3–2) data of Calistro Rivera et al. (2018) using the exactly same procedure as for the [C II] data; these result in minor (10%) changes in the rms noise and the inferred CO(3–2) luminosity. We use these re-imaged data only for the spectral comparison in Section 4; the CO(3–2) source size and hence the bulk of our analysis in Section 4 is based on the -plane analysis and hence is unaffected by the imaging procedure. We adopt Calistro Rivera et al. (2018) CO(3–2) luminosity and gas mass estimates for the remainder of this paper.
3.1.2 ALMA 160-m continuum
The rest-frame 160-m continuum is detected in both sources at 10 -confidence (Figure 1). In both sources, the continuum emission shows only a single brightness peak at 0.15-arcsec resolution. In ALESS 49.1, the continuum emission is almost circularly symmetric, with a minor extension in the east-west direction. In ALESS 57.1, the continuum is noticeably extended in the east-west direction (axis ratio 2:1). The spatially-integrated 160-m continuum flux-density for ALESS 49.1 and 57.1 is given in Table 1. The 160-m flux-density is calculated from an aperture with a 1.0 arcsec diameter, centered on the 160-m continuum surface brightness maximum. The aperture size was chosen based on the FIR continuum and [C I] sizes determined from the -plane fitting (Section 3.2 as we do not expect significant surface brightness contribution 0.5 arcsec from the centre of the source.
3.1.3 [CII] emission
The velocity-integrated maps of the [C II] emission are presented in Figure 1. The [C II] emission is detected at 5- and 8 significance in ALESS 49.1 and 57.1, respectively. The [C II] emission is relatively compact (0.5 arcsec diameter) in both ALESS 49.1 and 57.1, similar in extent to the 160-m continuum. The [C II] emission in ALESS 57.1 is highly elliptical (axis ratio 2:1) and elongated in the east-west direction; the [C II] does not show any significant offset from the 160-m peak. Note that the low-significance clumpy substructure such as that seen in ALESS 49.1 [C II] maps is often an artifact of low SNR (e.g., Hodge et al. 2016; Gullberg et al. 2018), rather than a real physical feature.
3.2 uv-plane analysis
We estimate the size of the continuum and [C II] emission regions by directly fitting the observed visibility function. Given the relatively low SNR of the data, we assume the surface brightness distribution to follow a circularly symmetric Gaussian profile.
The size is measured using the spectrally-averaged continuum and line datasets. To correct the offset between the phase-tracking centre and the centroid of the surface brightness distribution given in Table 1, each dataset is phase-shifted to center the field-of-view on the centroid of the source. The data are then radially binned into bins of equal width. To test the robustness of the -plane fitting against the -bin size, we vary the -bin size from 5 to 50 k.
We fit each -plane dataset with (1) a single Gaussian profile, (2) two Gaussian components to investigate the possibility of having compact, bright [C II] emission embedded in an extended, low surface-brightness component; (3) a combination of a single Gaussian profile and a constant term, corresponding to a point-source in the image plane. To determine whether the two-component model significantly improves the goodness-of-fit compared to the one-component model, we compare the two models using the F-test (Bevington, 1969). The single-component model is preferred for the continuum emission in ALESS 49.1 and [C II] emission in ALESS 57.1, independently of the -bin size. We will address the robustness of the inferred in Section 3.2.1. The two-component model is strongly () preferred for the [C II] emission in ALESS 49.1 and the continuum emission in ALESS 57.1. We do not find the Gaussian constant-term (point-source) model to be preferred over the single-Gaussian model for any dataset considered. The best-fitting values for the two-component model are listed in Table 2. Figure 2 shows the visibility function for the [C II] and 160-m continuum, as well as the CO(3–2) observations from Calistro Rivera et al. (2018), and the corresponding best-fitting profiles.
In physical units, for the single-Gaussian models, the [C II] and 160-m emission are rather compact (0.8–1.4 kpc) in both sources. The [C II] and 160-m continuum sizes from the single-Gaussian fitting agree within 1–2 uncertainty. For the two-Gaussian models, the compact and extended [C II] components in ALESS 49.1 have half-light radii of 1.010.12 kpc and 8.71.6 kpc, respectively. The compact and extended 160-m components in ALESS 57.1 have half-light radii of 0.860.07 and 5.31 kpc, respectively.
For the two-component [C II] model in ALESS 49.1, the extended [C II] components accounts for up to 80% of the total [C II] luminosity. Note that the systematic uncertainty on this estimate might be significant, as it is unclear how much does the extended component depart from the assumption of a circular Gaussian profile. For the [C II] emission in ALESS 57.1, the single-Gaussian model is preferred. However, if we speculate that ALESS 57.1 has an extended [C II] component with the same size as in ALESS 49.1 ( arcsec), the 3 upper limit on the total flux-density contributed by this hypothetical component is 80%. Similarly, if we speculate that the 160-m continuum in ALESS 49.1 has an extended component identical in size to that in ALESS 57.1 ( arcsec), the 3 upper limit on the flux contained in this hypothetical component is 50%.
How will the extended components in ALESS 49.1 [C II] emission and ALESS 57.1 160-m continuum contribute to the observed [C II]/160-m surface brightness distribution? The half-light radius of the ALESS 57.1 160-m extended component is well below the maximum recoverable scale (1.9 arcsec) and therefore should be fully accounted for in the synthesized images. This is supported by the results from the spectral energy distribution modeling (Section 3.4), which indicate that the 160-m continuum is not significantly resolved out. For the [C II] emission, the half-light radius of the extended component in ALESS 49.1 is comparable to the maximum recoverable scale and some emission is likely resolved out in the synthesized images. However, while the extended [C II] component in ALESS 49.1 dominates the total [C II] luminosity, it contributes only between 5–20% of the surface brightness across the inner kpc region. It is for this reason that our analysis in Sections 4.2, 4.3 and 4.4 focuses on the central regions ( kpc) of ALESS 49.1 and 57.1, including the uncertainty from the extended components in further analysis.
3.2.1 How robust are the source sizes determined from the uv-plane fitting?
Before analyzing our resolved [C II] and 160-m continuum observations, we assess the reliability of the inferred source sizes. In particular, we investigate a possibility that the [C II]/160-m emissions follow CO(3–2) surface distribution, and that the source sizes inferred in Section 3.2 are an artifact of the limited short-spacing coverage of our Band 8 observations. We estimate this uncertainty using simulated ALMA observations.
The mock observations are created as follows. First, we calculate the mean and rms scatter for the [C II] and 160-m continuum visibilities within a given -bin. We then subtract the mean signal from the data, which gives us a -plane coverage corresponding exactly to a given observation, along with a realistic noise measurement for each baseline. We choose this approach to account for the different noise levels for each dataset, and the effect of the atmospheric lines on our [C II] data. We then inject an artificial source into the data, generating 1000 datasets with different noise realizations for each source. We consider sources with a half-light radius of 0.1–1.0 arcsec and peak surface brightness of 0.05 – 4.0 mJy beam*-1*. Finally, we bin the mock visibilities in the -plane using exactly the same procedure as applied to real data in Section 3.2.
Figure 3 shows the inferred radius as a function of the surface brightness maximum alongside the 1 uncertainty from the -plane fitting. The measured [C II] and 160-m continuum sizes in ALESS 49.1 and 57.1 are all smaller than sizes inferred for input sources with arcsec in the relevant peak surface brightness range. In other words, given the observed peak surface brightness, 0.2 arcsec source sizes would be recovered within 10% uncertainty for both ALESS 49.1 and 57.1. For comparison, the CO(3–2) half-light radii in ALESS 49.1 and 57.1 are =0.330.06 and 0.390.06 arcsec, respectively.
Therefore, we consider it unlikely that the [C II]/160-m continuum follow a single-Gaussian surface brightness distribution with the same size as CO(3–2) emission (0.330.05 and 0.390.06 arcsec for ALESS 49.1 and 57.1, respectively). However, we can not exclude a combination of a bright compact and faint extended [C II] and continuum components. In the following analysis, we will focus on the center of the sources where the extended [C II] component is not expected to contribute significantly.
3.3 [CII] spectra and kinematics
Figure 4 presents the [C II] moment-one (intensity-weighted velocity) maps and the comparison of [C II]/CO(3-2) line profiles in ALESS 49.1 and 57.1. The moment-one maps reveal a clear velocity gradient across both ALESS 49.1 and 57.1. The spectra were extracted from the naturally-weighted channel maps, using an aperture 1 arcsec (8 kpc) in radius for CO(3–2) and 0.5 arcsec (4 kpc) in radius for [C II], given the compact size of the [C II] emission.
The [C II] line profile in ALESS 49.1 largely traces the CO (3–2) profile, exhibiting an increased brightness in the blue channels. In ALESS 49.1, we find a tentative (2.5–3) increase in the [C II]/CO(3–2) ratio between the centre (200 km s*-1*) and the wings () km s*-1*) of the lines. This might be due to: (1) a significant fraction of the [C II] emission in the reddest and bluest channels being very extended and thus resolved out by our Band 8 imaging, or (2) a spatial variation in the gas conditions. The [C II/CO(3–2) ratio in ALESS 57.1 is consistent with being constant across the full velocity range.
We model the velocity-fields using the GalPak3D software (Bouché et al., 2015). GalPak3D uses a Monte-Carlo approach to extract the kinematic and morphological parameters from three-dimensional image cubes, accounting for both the spatial and spectral response of the instrument, assuming a parametric model for a rotating disc. For our simulations, we assume an exponential disc profile - an appropriate choice for ALESS SMGs, which show a mean Sérsic index of (Hodge et al. 2016, corresponds to an exponential profile.). To improve the SNR and the speed of the calculations, we re-sampled our data onto cubes with a pixel size of 25 mas, using natural weighting.
Figure 5 shows the input and reconstructed moment-0 and moment-1 maps for ALESS 49.1 and 57.1. At the SNR of our Band 8 observations, velocity fields in both sources are consistent with an ordered, disc-like rotation. The deconvolved [C II] rotational curves are shown in Figure 6, which also lists the FWHM velocity measurements obtained from the fitting of the spatially-integrated CO(3–2) spectra (Calistro Rivera et al., 2018). The source inclinations are inferred by fitting the moment-0 map and agree with those derived from CO(3–2) imaging by Calistro Rivera et al. (2018) within 1–2 uncertainty.
3.4 Spectral energy distribution modelling
We infer the global stellar and interstellar medium properties of ALESS 49.1 and 57.1 from the spatially-integrated spectral energy distributions (SEDs) using the MagPhys package (da Cunha et al., 2008), specifically its high-redshift extension (da Cunha et al., 2015). These differ from the previously published SEDs (da Cunha et al., 2015) by using the CO(3–2)-derived spectroscopic redshifts compared to the photometric ones from da Cunha et al. (2015), and inclusion of ALMA Bands 3/4/8 continuum flux-densities. Namely, in addition to the Band 8 continuum measurements from Table 1, we include Band 4 continuum measurements ( = 380100 Jy and 6550 Jy for ALESS 49.1 and 57.1; da Cunha et al., in prep.), as well as the ALMA Band 3 continuum measurement for ALESS 49.1, Jy (Wardlow et al., 2018).
The MagPhys-inferred source properties are listed in Table 2, the observed multi-wavelength photometry and MagPhys spectral energy distribution models are provided in Appendix B. The estimated dust temperatures K and K in ALESS 49.1 and 57.1 are warmer than the median =422 K of the ALESS SMGs inferred from MagPhys modelling (da Cunha et al., 2015). The more precise spectroscopic redshifts and additional ALMA photometry result in a temperature increase compared to values reported by da Cunha et al. (2015) K and K, respectively. Elevated in intensely star-forming galaxies was reported by Cooke et al. (2018), who interpret the inferred median K as evidence for high at high redshift. Note that the da Cunha et al. (2015) and Cooke et al. (2018) models use Herschel SPIRE and ALMA Band 7 photometry, while our models include ALMA Bands 3, 4 and 8 observations, thus better sampling the Rayleigh-Jeans tail of dust thermal spectrum. Compared to the MagPhys models of the entire ALESS sample (da Cunha et al., 2015), ALESS 49.1 and 57.1 have SFR higher by a factor of 2 (da Cunha et al. 2015: median SFR = 28070 M⊙ yr*-1*) and stellar mass factor of 2 lower (da Cunha et al. 2015: M⊙ yr*-1*); the dust mass is consistent with the median da Cunha et al. (2015) value ( M⊙). The gas depletion timescale /SFR is 10040 Myr in both ALESS 49.1 and 57.1, in line with SMGs (Huynh et al., 2017; Bothwell et al., 2013), and a few times lower than claimed for massive main-sequence galaxies from the PHIBBS survey ( Myr, Tacconi et al. 2018).
Using the SED models, we can estimate the fraction of the 160-m continuum that is resolved out by comparing the observed rest-frame 160-m continuum fluxes with SED modeling predictions, assuming constant and optical depth across the source. Namely, we use MagPhys to perform SED modeling using all the photometry points apart from the rest-frame 160-m continuum. The predicted 160-m flux-densities are 11.8 and 7.6 mJy for ALESS 49.1 and 57.1, respectively; the observed flux densities match the predicted ones within 10%. Therefore, we conclude that our observations recover the bulk of the 160-m emission, in line with the compact continuum sizes inferred in Section 3.2.
4 Discussion
4.1 Comparison with CO(3–2) emission
Based on the -plane analysis in Section 3.2 which was tested on mock ALMA data in Section 3.2.1, we found the [C II]/160-m continuum surface brightness distribution to be dominated by a compact component, embedded within a low-surface-brightness, extended emission. We now compare these morphologies to the CO(3–2) surface brightness profiles, and other low- and high-redshift observations and simulations.
4.1.1 160-m continuum size
Comparing the 160-m continuum emission sizes with the CO(3–2) sizes (Table 2), the 160-m continuum is 1.90.3 (ALESS 49.1) and 3.10.7 (ALESS 57.1) more compact than the CO(3–2) emission.
Compact dust continuum emission embedded in a larger molecular gas reservoir has been observed in a number of high-resolution studies of SMGs. For example, PdBI/VLA imaging of GN20 () revealed a compact dusty, star-forming region within a large disc as traced by the CO(2–1) emission (Hodge et al., 2012, 2015). At very high spatial resolutions ( pc), similar morphology has been seen in the strongly-lensed SMG SDP.81 (ALMA Partnership et al., 2015), which shows a compact (3 kpc across), dusty star-forming disc (Rybak et al., 2015a), embedded in a large ( kpc) molecular gas reservoir, as traced by the CO(1–0) emission (Valtchanov et al., 2011; Rybak et al., 2015b). Similarly, Spilker et al. (2015) observed compact ALMA Band 7 continuum and extended CO(3–2)/(1–0) emission in two strongly lensed galaxies from the South Pole Telescope sample; note that in SMGs, the CO(3–2) is typically significantly less extended than the CO(1–0) line (e.g., Ivison et al. 2011; Riechers et al. 2011). Using ALMA 860-m continuum, VLA CO(3–2) and SINFONI H observations of ALESS 67.1 (=2.1), Chen et al. (2017) found the ALMA continuum to be a factor of 5 more compact than CO (3–2) and H emission (which are similar in size). Finally, Calistro Rivera et al. (2018) compared stacked CO(3–2) and Hodge et al. (2016) 860-m ALMA observations of a sample of 4/18 SMGs from the ALESS sample, showing the FIR continuum to be more compact by a factor of 2. Based on a radiative transfer modelling, Calistro Rivera et al. (2018) found that the compact FIR and extended CO(3–2) sizes are consistent with a decrease in dust temperature and optical depth towards the outskirts of the source. The compact continuum sizes in ALESS 49.1 and 57.1 thus add to the growing evidence for variations ISM conditions in SMGs on scales of few kpc.
4.1.2 [CII] emission size
Based on the source sizes inferred from -plane fitting, the [C II] emission is (ALESS 49.1) and (ALESS 57.1) times more compact than CO(3–2). The compact size of the high surface-brightness [C II] component contrasts with a relatively similar extent of the [C II] and low- CO emission in local galaxies, as presented by de Blok et al. (2016), who found the [C II] to be “slightly less compact than the CO” (scale radius % larger). Note that the de Blok et al. (2016) galaxies have M⊙ yr*-1* kpc*-2*, dex lower than ALESS 49.1 and 57.1.
The [C II] morphologies consisting of a high surface-brightness compact, and a low surface-brightness extended component have been observed in several local star-forming galaxies. For example, Kuiper Airborne Observatory imaging of the [C II] emission in NGC 6946 (Madden et al., 1993) resolved three distinct components: (1) a bright, compact nucleus ( pc); (2) a faint, diffuse component at least 12 kpc in radius, contributing 40% of the total [C II] flux (Contursi et al., 2002) and (3) local enhancements corresponding to the spiral arms.
Similarly, one of the best-studied sources with resolved [C II]/low- CO observations – a 6.42 quasar SDSS J1148+5251 (Walter et al., 2004, 2009) – has a compact ( kpc) [C II] emission embedded within a much more extended ( kpc) CO(3–2) reservoir (Walter et al., 2009; Stefan et al., 2015). Using sensitive PdBI observations, Cicone et al. (2015) found an extremely extended (out to 30 kpc) [C II] emission associated with powerful outflows likely driven by the central engine in J1148+5251.
Apart from observational evidence, a compact, high surface-brightness [C II] component in star-forming galaxies has been predicted by simulations. In particular, using zoom-in cosmological SPH simulations of several mildly star-forming galaxies (SFR=5–60 M⊙ yr*-1*), Olsen et al. (2015) predicted that the [C II] emission is concentrated into a compact central region ( kpc), with a much fainter (by up to 1 dex) extended component – similar to our double-component model of [C II] emission in ALESS 49.1. In the Olsen et al. (2015) simulations, the compact size of the [C II] emission is due to gas inflows into the central star-forming regions, and the [C II] emission is dominated by the dense, molecular phase of the ISM. This contrasts with low-SFR galaxies, where the bulk of the star-formation takes place in the spiral arms at large galactocentric radii (e.g., Herschel survey of the Milky Way [C II] emission, Pineda et al. 2013).
4.1.3 Inferring FIR source sizes using the Stacey et al., 2010, relation
Given the limited angular resolution of many high-redshift [C II] detections, the source size can not be inferred directly from unresolved/marginally resolved data. However, parallel [C II]/CO/FIR continuum observations have been used to constrain the source size, assuming the bulk of the line and continuum emission originates in PDR regions.
This technique, introduced by Stacey et al. (2010), compares the observed [C II]/CO/FIR fluxes with predictions from the PDR models of (Kaufman et al. 1999, see Section 4.4) to infer the FUV field strength and the density . The observed and inferred are then used to infer the FIR size using the Wolfire et al. (1990) relations. In particular, Wolfire et al. (1990) distinguish two main regimes:
[TABLE] 2. 2.
[TABLE]
where is given in the units of the Habing field ( erg cm*-2* s*-1*) and and the FUV photon mean free path are in pc. Stacey et al. (2010) assume that in star-forming galaxies is the same as in a nearby starburst M82. For M82, Stacey et al. (2010) assume L⊙, , pc.
With high-resolution [C II], CO(3–2) and FIR observations and robust source sizes in hand, we now investigate the applicability of the Stacey et al. (2010) relations to high-redshift SMGs. Assuming that is smaller than (an appropriate choice given the heavily obscured, dusty environment), we infer and pc for ALESS 49.1 and 57.1, respectively; a factor of 2.5–3.5 smaller than the actual FIR half-light radii measured from the -plane fitting (Section 3.2). We note that the , and estimates for M82 from the literature show a considerable scatter; alternatively, the in SMGs might be somewhat longer from that in the central region of M82. Crucially, if the FIR sizes of high-redshift SMGs are systematically underestimated by similar factors, the star-formation rate surface density will be overestimated by 0.5–1.0 dex - a shift that might affect a number of unresolved observations in e.g., the [C II]/FIR – plane (Figure 7).
4.2 Molecular gas kinematics
The [C II] and CO(3–2) lines provide two independent measurements of the molecular gas velocity structure. Due to their different spatial extents (Section 3.2), the [C II] and CO(3–2) emission trace the velocity field at different radii. Figure 6 shows the line-of-sight velocity as traced by the [C II] and CO(3–2) emission, and the GalPak3D model of the [C II] disc. In particular, the [C II] emission probes the velocity field within the inner 2-kpc region. Typically, rotational curves of disc-like galaxies are decomposed into contributions from the dark matter halo, and baryons in the form of a galactic bulge and disc. Given the baryonic mass (Table 2) is comparable to the dynamical mass enclosed within twice the CO(3–2) half-light radius (5.2 and 6.0 kpc in ALESS 49.1 and 57.1, respectively; Table 2), we conclude that the inner rotation curves are baryon-dominated.
In both ALESS 49.1 and 57.1, the line-of-sight velocity flattens at 2–4 kpc radius. As a dominant bulge would cause the to flatten rapidly on scales of few hundred pc (e.g., Sofue et al. 1999) whereas the profiles in ALESS 49.1 and 57.1 are still rising at kpc, we speculate that the inner ( kpc) rotational curves in ALESS 49.1 and 57.1 do not yet have a significant bulge component and hence are disc-dominated. However, higher-SNR data are necessary to confirm this hypothesis.
The rotation curves have been studied at a comparable resolution in only a handful of SMGs. In this respect, ALESS 49.1 and 57.1 velocity fields are most directly comparable to those in twin hyperluminous SMGs H-ATLAS J084933 (Ivison et al., 2013) and strongly lensed SMGs SMM J2135-0102 (, Swinbank et al. 2011) and SDP.81 (, Dye et al. 2015; Rybak et al. 2015b), which flatten out at 200 km s*-1* within the inner 2-kpc radius. The dynamical mass enclosed within the central 2-kpc radius region of ALESS 49.1 and 57.1 is (2 kpc) = and M, respectively; although CO(3–2) observations provide mass estimates at 5–6 kpc radius, the large uncertainties prevent us from investigating the mass profiles of the two sources. The limited extent of the bright [C II] component and the possibility that an extended [C II] emission in ALESS 49.1 is resolved out highlight the difficulties of using very high-angular-resolution observations to trace the kinematics of the cold gas reservoir.
4.3 The resolved [CII]-FIR ratio
The high resolution of ALMA Band 8 data allows us to investigate the ratio at on 1-kpc scales. Here, we focus on the central region (2 kpc), in which the contribution of any extended [C II] component is below 20%. This discussion does not include the global tracer ratios, as the Band 8 observations might resolve out significant fraction of the total [C II] flux from an extended component.
The star-formation rate surface density is estimated by adopting the global SFR from our SED fits 3.4, assuming (1) a linear mapping between the rest-frame 160-m emission and SFR; (2) no AGN contribution to the rest-frame FIR luminosity; (3) universal IMF (c.f Zhang et al. 2018a). The linear mapping between the FIR continuum and SFR density assumes a constant dust temperature and opacity across the source. Further high-resolution, multi-band observations of the dust continuum and spatially-resolved SED modelling would be required for a more precise estimate for different parts of the source. The [C II]/FIR ratio was extracted by binning the [C II] and 160-m continuum maps (Fig. 1) into pixels 1 beamwidth large; only pixels for which both the [C II] and 160-m continuum have SNR2 are considered.
Figure 7 shows the resolved for ALESS 49.1 and 57.1 as a function of the SFR surface density , compared to resolved and unresolved measurements from both local and high-redshift sources (Smith et al. 2017; Díaz-Santos et al. 2017; Gullberg et al. 2018 and references therein). In both ALESS 49.1 and 57.1, the resolved ratio decreases sharply with , confirming the [C II]/FIR deficit on 1-kpc scales.
Comparing our measurements with an empirical relation between [C II]/FIR ratio and proposed by Smith et al. (2017),
[TABLE]
we find that the bulk of the ALESS 49.1 and 57.1 [C II]/FIR measurements are below the 1 scatter of the Smith et al. (2017) relation, with almost 1–2 dex lower than those predicted by the Smith et al. (2017) relation. This suggests that the Smith et al. (2017) – might not be directly applicable in the high- regime in ALESS 49.1 and 57.1.
We note that the ALESS 49.1 and 57.1 [C II]/FIR measurements fall below the redshift resolved measurements of Gullberg et al. (2018). This can be attributed to several factors: (1) different source selection; (2) aperture-averaging effects in Gullberg et al. (2018), as the [C II]/FIR ratio is calculated for apertures several kpc wide; (3) systematic uncertainties such as Gullberg et al. (2018) assuming K for all their sources. Regarding source selection, ALESS 49.1 and 57.1 have more than 2 higher than Gullberg et al. (2018) sources, while being more compact in the rest-frame FIR continuum; consequently, our measurements might probe a higher regime, which would correspond to lower [C II]/FIR ratio and potentially higher (see Section 4.4).
The radial variation of in ALESS 49.1 and 57.1 is shown in Figure 8. Fitting the resolved [C II]/FIR data with a power-law , we find a strong evidence for a radial variation of the [C II]/FIR ratio in ALESS 49.1 (), while in ALESS 57.1, the slope is consistent with being flat (). A decrease in the [C II]/FIR ratio towards the centre of the source is seen in both local star-forming galaxies (e.g., Madden et al. 1993; Smith et al. 2017) and high-redshift sources (Gullberg et al., 2018) and indicates that the [C II]/FIR deficit is driven by local processes, as opposed to global properties of the sources. In particular, Smith et al. (2017) found the [C II]/FIR ratio to be suppressed by on average 3015% in the central pc regions of galaxies without an AGN. On the other hand, [C II]/FIR ratio drops by a factor of a few over the inner 2 kpc in nuclear starbursts in M82 and M83 (Herrera-Camus et al., 2018). While the obscured Chandra-detected AGN in ALESS 57.1 (Wang et al., 2013) might be expected to suppress the [C II] emission in the circumnuclear region, we do not detect any strong [C II] suppression in ALESS 57.1 on 1-kpc scales. The difference in the [C II]/FIR radial profiles in ALESS 49.1 and 57.1 is driven by the larger scatter in [C II]/FIR ratio for a given in ALESS 57.1 (see Figure 7), which is a result of the complex [C II] and 160-m morphology in that source (Figure 1). Note that the limited SNR of our data at kpc prevents us to study the [C II]/FIR radial dependence at larger radii.
4.4 Comparison with PDR models
The relative intensities of the [C II], CO(3–2) and FIR emission from hot-dissociation regions (PDRs) depend on the ionizing FUV field strength and the gas density (H), which determine the depth of the outer C+ layer. We now use our resolved [C II]/CO(3–2)/FIR observations to infer the and using the PDR models from the PDRToolbox library (Kaufman et al., 2006; Pound & Wolfire, 2008). We focus on the central regions of the source ( kpc) adopting the best-fitting models from Section 3.2.
For a proper comparison, several corrections need to be applied. First, the [C II] emission from the ionized ISM needs to be subtracted from the observed [C II] signal. The contribution from the ionized gas can be estimated from [N II] 122/205-m lines, which have similar critical density for collisions with electrons (300 cm*-3*/32 cm*-3*) as the [C II] line (50 cm*-3*, Goldsmith et al. 2012), but ionization energy eV and hence traces only the ionized gas. Croxall et al. (2017) carried out a systematic study of the [N II] 122/205 m lines in a sample of 21 nearby star-forming galaxies, estimating the fraction of [C II] in PDRs as for sources with M⊙ yr*-1* kpc*-2*. At high redshift, Zhang et al. (2018b) used [N II] 122-m line observations in SMGs to derive 10–15% ionized gas contribution to [C II] luminosity, assuming Galactic diffuse gas N and C abundancies. Consequently, we adopt a conservative (i.e., low) estimate of .
Second, PDRToolbox models are derived for a one-dimensional, semi-infinite slab, illuminated from the face side only. In the intensely star-forming SMGs, we expect the clouds to be illuminated from multiple sides and the optical thickness of individual tracers needs to be considered. Namely, for optically thick emission, only the emission from the side of the cloud facing the observer is observed; for the optically thin emission, the distant side of the cloud adds to the observed fluxes and the line intensities expected from PDR models need to be multiplied by a factor of 2 (Kaufman et al., 1999). The 160-m continuum is generally assumed to be optically thin. Based on the models of Narayanan & Krumholz (2014), CO(3–2) line is expected to be optically thick with a median optical depth for M⊙ yr*-1*. The [C II] emission is optically thin in most environments; although there is evidence for moderately optically thick [C II] (optical depth 1) in both Galactic PDRs (Graf et al., 2012; Sandell et al., 2015) and high-redshift sources (Gullberg et al., 2015). Therefore, for an optically thin [C II], the predicted [C II]/CO(3–2) ratio has to be increased 2; for an optically thick [C II], the predicted [C II]/FIR ratio has to be reduced by 1/2. We consider both optically-thin and optically-thick [C II] scenarios; however, as the evidence for optically-thick [C II] is limited, we adopt the values derived for the optically-thin ]C II] for the rest of this paper.
Figure 9 shows the contours in the / space for the central 2 kpc region of ALESS 49.1 and 57.1, with best-fitting values listed in Table 3. The combination of the three tracers provides orthogonal constraints on and . In particular, is largely determined by the [C II]/FIR ratio, and by [C II]/CO (3–2). Table 3 lists the inferred and values for the optically thin and optically thick [C II] scenarios, along with the PDR surface temperature. For the optically-thin [C II] case, the conditions in ALESS 49.1 and 57.1 are almost identical, with and cm*-3*, implying PDR surface temperature of 700 K. Increasing the fraction of [C II] emission from the PDRs from 0.8 to 1.0 causes the inferred and values to decrease by 0.25 dex. For the optically-thick [C II] case, the inferred and decrease by up to 0.5 and 1.0 dex, respectively; is reduced to 400–500 K.
The , values in the central region of ALESS 49.1 and 57.1 are comparable to , cm*-3* inferred from unresolved observations of larger SMG samples, such as [C II]/CO study of Stacey et al. (2010), [C I]/CO study of 14 SMGs by Alaghband-Zadeh et al. (2013) and FIR spectroscopy of lensed SMGs (Wardlow et al., 2017; Zhang et al., 2018b)). Using [C II] and low- CO observations in a sample of strongly lensed SMGs, Gullberg et al. (2015) found a larger scatter of FUV strength () and density ( cm*-3*), although the effect of differential magnification might be substantial. For nearby star-forming galaxies, a comparison of observed spatially integrated [C II], [O I] 63-m and FIR luminosities with the PDRToolbox models was carried out by Malhotra et al. (2001) and Díaz-Santos et al. (2017). ALESS 49.1 and 57.1 are consistent with the high-density Malhotra et al. (2001) sources; however, and in ALESS 49.1 and 57.1 are higher than in the most dense ultra-luminous infrared galaxies (ULIRGs) from the Díaz-Santos et al. (2017) sample, which have , cm*-3*. Note that the globally-averaged and in ALESS 49.1 and 57.1 might be lower than those inferred from the kpc region. Finally, compared to the resolved kpc-scale observations of local starburst galaxies NGC 6946 and NGC 1313 with inferred , cm*-3* (Contursi et al., 2002), the central regions of ALESS 49.1 and 57.1 show similar and somewhat higher .
What drives the strong FUV fields in ALESS 49.1 and 57.1: a central AGN, or star-formation? Although Chandra X-ray observations of ALESS 49.1 and 57.1 (Wang et al., 2013) revealed an obscured AGN in ALESS 57.1 (no emission from ALESS 49.1 was detected), it is unlikely that an obscured AGN would be driving a strong FUV field on few-kpc scales. On the other hand, the in the vicinity of H II regions is of the order (e.g., Tielens & Hollenbach 1985; Hollenbach & Tielens 1999), comparable to the values inferred from our PDR models. Similarly, typical and values for Galactic star-forming regions are of the order of , cm*-3*(Stacey et al., 1991, 2010). We therefore conclude that the strong FUV field in ALESS 49.1 and 57.1 is due to star formation, rather than a central AGN.
4.5 Origin of the [CII]/FIR deficit
Having estimated and in the central regions of ALESS 49.1 and 57.1, we now turn to the mechanism driving the [C II]/FIR deficit. We focus on the thermal saturation model proposed by Muñoz & Oh (2016), and the reduction of the photoelectric heating of the gas by small dust grains (e.g., Bakes & Tielens 1994; Malhotra et al. 2001); we briefly discuss other potentially relevant mechanisms – AGN contribution and dust-bounded HII regions – in Section 4.5.3. For a more exhaustive list of proposed mechanisms for the [C II]/FIR deficit, we refer the reader to Smith et al. (2017).
4.5.1 Thermal saturation of the [CII] line
Muñoz & Oh (2016) have proposed the thermal saturation of the upper level of the C+ fine-structure transition as the main driver of the [C II]/FIR deficit. In other words, when exceeds the C+ ionization temperature (92 K), the upper/lower level population ratio (and the [C II] luminosity) depends only weakly on , while the FIR luminosity keeps on increasing.
Our PDRToolbox models imply high FUV fields strength () and densities ( cm*-3*) with gas surface temperatures larger than 500 K (Table 3. The [C II] transition is saturated in this regime. Following Muñoz & Oh (2016), the thermal cooling rate per Hydrogen atom via the [C II] line depends on via
[TABLE]
where is the Boltzmann constant, is the [C II] ionization temperature and C/H the relative abundances of the Carbon and Hydrogen atoms. Following the equation (4), the [C II] cooling rate increases by only 40% between =100 K and 500 K, whereas the increases by a factor of few hundred, assuming scales proportionally with and , where the dust opacity is typically assumed to range from 1.5 to 2.5 (e.g., Casey et al. 2014).
For a more direct comparison with Muñoz & Oh (2016) model, we compare the resolved [C II]/FIR observations in ALESS 49.1 and 57.1 (Figure 7) to the predicted -[C II]/FIR slope. According to Muñoz & Oh (2016), ratio scales as:
[TABLE]
where is the fraction of gas emitting in [C II]. Fitting our datapoints with a power-law following the equation (5), we obtain a best-fitting slope of . This is in agreement with the thermal-saturation model slope of (equation (5)).
We note that Díaz-Santos et al. (2017) discount the thermal saturation of the [C II] line as a source of the [C II]/FIR deficit in local star-forming galaxies. Namely, comparing the [O I] 63 m and [C II] line ratios with a statistical equilibrium radiative transfer model, they obtain a scaling between dust and gas kinetic temperature . Given of 21–48 K, they find 92 K, i.e. below the thermal-saturation regime. However, ALESS 49.1 and 57.1 show relatively high global = and K, respectively (Table 2). Given the conversion factors from Díaz-Santos et al. (2017) and evidence for increase in dust and gas temperature towards the centre of SMGs (Calistro Rivera et al., 2018), we conclude that in the central regions of ALESS 49.1 and 57.1 likely exceeds 92 K.
4.5.2 Suppression of the [CII] emission due to positive grain charging
In addition to the thermal saturation, another potentially important effect at the , values inferred from our PDR analysis is the reduced photoelectric heating of the gas by electrons ejected from the small dust grains by the FUV photons (e.g., Bakes & Tielens 1994; Malhotra et al. 2001; Wolfire et al. 2003). At high ratios, the grains become positively charged, thus raising the potential barrier for the electrons to escape.
Qualitatively, a reduced photoelectric heating will manifest in moderate ratios. Although ALESS 49.1 and 57.1 have elevated dust temperatures compared to other high-redshift SMGs (Swinbank et al., 2014; da Cunha et al., 2015) and local ULIRGs (Díaz-Santos et al., 2017), the high PDR surface temperatures indicate that the gas is already heated to high temperature, at which point the [C II] line becomes saturated.
Quantitatively, following Wolfire et al. (2003), the photoelectric heating rate per hydrogen atom is give as:
[TABLE]
where , is the dust-to-gas ratio (normalized to the Galactic value), the electron density and a factor associated with the PAH molecules. The second term in the denominator corresponds to the positive grain charging. We follow Muñoz & Oh (2016) by adopting , . Note that equation (6) assumes 1000 K, which is satisfied for both ALESS 49.1 and 57.1. While for the ALESS 49.1 and 57.1 values of , the second term in the denominator corresponding to the reduction in photoelectric heating, becomes dominant, the numerator is also proportional to . Comparing a typical nearby star-forming galaxy with , cm*-3*, (c.f. Muñoz & Oh 2016) and ALESS 49.1 and 57.1 with , cm*-3*, the second term in the determinant increases from 0.3 to , indicating a significant reduction in the gas heating due to grain charging. However, at the same time, the overall increases by a factor of 6.
Therefore, we attribute the pronounced [C II]/FIR deficit in the central regions of ALESS 49.1 and 57.1 to the high gas temperature which results in a quantum-level saturation of the C+ fine structure.
4.5.3 Other mechanisms for [CII]/FIR deficit
Finally, we briefly consider other proposed mechanisms for the [C II] deficit.
AGNs can contribute to the [C II] deficit, both by increasing the FIR luminosity and reduce the C+ abundance and the [C II] emission by ionizing the carbon atoms to higher ionization states (C2+, C3+ etc.) via soft X-ray radiation (Langer & Pineda, 2015). Chandra observations of ALESS 49.1 and 57.1 revealed an obscured AGN with an extinction-corrected X-ray luminosity of and no X-ray emission in ALESS 49.1 (Wang et al., 2013). According to Langer & Pineda (2015) models, for cm*-3* (model closest to the conditions in ALESS 49.1 and 57.1), a 10% decrease in the fraction of carbon in the C+ state requires an X-ray flux of erg cm*-2* s*-1*. Assuming an X-ray flux dilutes with distance as , the AGN in ALESS 57.1 will affect only the innermost 100 pc radius, well below the spatial resolution of our data. Consequently, we do not expect a significant AGN contribution to the observed [C II] deficit.
Another proposed explanation for the [C II]/FIR deficit is the increased absorption of ionizing UV photons by the dust in dust-bounded H II regions, which would result in increased FIR and decreased [C II] luminosity, respectively (Luhman et al., 2003). Abel et al. (2009) used radiative transfer models of dust-bounded H II region to qualitatively reproduce the [C II]/FIR deficit trend. However, for the observed [C II]/FIR values in ALESS 49.1 and 57.1, the Abel et al. (2009) models require densities of cm*-3*, i.e. much lower than those inferred from the PDR modelling. Furthermore, as already noted by Muñoz & Oh (2016), the dust drift time for high , values becomes very short compared to O/B stars lifetime. We follow Draine (2011) to estimate a dust drift time for a cluster of O/B stars, providing an ionizing photons flux s*-1*. Given the density of cm*-3*, the dust drift time becomes yr (Figure 9 of Draine 2011). Even if the H II regions in ALESS 49.1 and 57.1 are originally dust-bounded, given the long duration of the starburst compared to , we do not expect a significant fraction of them to be dust-bounded at a given moment and hence do not expect the dust-bounded H II regions to dominate the [C II]/FIR deficit in ALESS 49.1 and 57.1.
5 Conclusions
We have investigated the morphology and kinematics of the [C II] 157.74-m line emission and associated 160-m rest-frame continuum in two sources from the ALESS sample, based on the 0.15 arcsec ALMA Band 8 imaging. The morphology and [C II] velocity field in both galaxies is consistent with an inclined rotating exponential disc. The [C II] rotation curves show a flattening within the inner 2-3 kpc radius, indicative of a potential dominated by a baryonic disc.
Comparing the resolved maps of the [C II] emission with those of CO(3–2) (Calistro Rivera et al., 2018), we found the [C II] surface brightness to be concentrated into a region a factor of 2–3 more compact the CO(3–2). In ALESS 49.1, we found evidence for a low surface-brightness, extended ( kpc) [C II] component, accounting for up to 80 percent of the [C II] brightness. Based on mock ALMA observations, we excluded the possibility that [C II] and 160-m continuum follow the same single-Gaussian surface brightness as the CO(3–2) emission.
We compared of the [C II]/FIR and CO (3–2) observations to the PDRToolbox photo-dissociation regions models (Kaufman et al., 2006; Pound & Wolfire, 2008). These indicate intense FUV radiation field () and moderately high gas densities ((H) cm*-3*), comparable to the and values found in the central regions of nearby starbursts (e.g., Contursi et al. 2002), as well as in other SMGs (Stacey et al., 2010). We attribute the strong FUV field to massive the star-formation, rather than an obscured AGN.
We tested the applicability of the Stacey et al. (2010) technique for estimating FIR source size from unresolved [C II]/low- CO / FIR observations to ALESS 49.1 and 57.1. The Stacey et al. (2010) method yields FIR sizes factor of 2.5–3.5 more compact than measured from the -plane fitting; this bias causes the SFR surface-density to be overestimated by up to 1 dex, having a potentially significant impact on the interpretation of low-resolution observations.
Both ALESS 49.1 and 57.1 show a pronounced [C II]/FIR deficit, with . The resolved [C II]/FIR luminosity ratios fall below the empirical trend of Smith et al. (2017), indicating a change in physical conditions compared to the nearby star-forming galaxies. A comparison with PDR models indicated surface temperatures of 400–800 K; at such a high temperature, the occupancy of the upper fine-structure level of C+ ions (and the [C II] luminosity) saturates, while FIR luminosity increases sharply. The most direct interpretation is that the strong [C II] deficit is a result of the C+ fines-structure thermal saturation (Muñoz & Oh, 2016). In addition, the resolved [C II]/FIR measurements in ALESS 49.1 and 57.1 scale with star-formation rate surface density as , in agreement with the thermal-saturation scenario slope of -0.5 Muñoz & Oh (2016). Although the photoelectric heating of the gas is reduced due to positive grain charging, for the , values in ALESS 49.1 and 57.1, the thermal saturation is the main driving mechanism of the [C II]/FIR deficit. This contrasts with the local star-forming galaxies, which are found to have gas temperatures below the C+ ionization energy (e.g., Díaz-Santos et al. 2017).
With only two galaxies in our sample, it is difficult to generalize our conclusions to the entire population of submillimeter galaxies. With ALMA now enabling routine observations of [C II] emission at redshift 3 and beyond, and with a rapid increase of high-redshift sources with robust spectroscopic redshifts that are necessary for parallel [C II]/CO observations, this study is a precursor to future multi-tracer, resolved studies of ISM at high redshift, and a necessary stepping stone to interpreting the [C II] observations at very high redshift.
Acknowledgements
The authors thank Frank Israel and Desika Narayanan for helpful discussions about the [C II]/CO extent.
This paper makes use of the following ALMA data: ADS/JAO.ALMA#2013.1.00470.S, #2015.1.00019.S, #2015.1.00948.S and #2016.1.00754.S. ALMA is a partnership of ESO (representing its member states), NSF (USA) and NINS (Japan), together with NRC (Canada), MOST and ASIAA (Taiwan), and KASI (Republic of Korea), in cooperation with the Republic of Chile. The Joint ALMA Observatory is operated by ESO, AUI/NRAO and NAOJ. MR and JH acknowledge support of the VIDI research programme with project number 639.042.611, which is (partly) financed by the Netherlands Organisation for Scientific Research (NWO). IRS acknowledges support from the ERC Advanced Grant DUSTYGAL (321334) and STFC (ST/P000541/1). HD acknowledges financial support from the Spanish Ministry of Economy and Competitiveness (MINECO) under the 2014 Ramón y Cajal program MINECO RYC-2014-15686. JLW acknowledges support from an STFC Ernest Rutherford Fellowship (ST/P004784/1).
Appendix A Companion sources in LESS 49 field
Hodge et al. (2013) identified a nearby counterpart to ALESS 49.1 - ALESS 49.2 (J2000 03:31:24.47 -27*∘* 50’ 38.1”). Detected at 4 confidence level in 870 m continuum ( mJy), it is included in the “main” ALESS sample. Additionally, ALESS 49.2 was detected in 3.3-mm continuum in ALMA Band 3 observations of Wardlow et al. (2018) with Jy; however, Wardlow et al. (2018) do not detect any CO(3–2) emission from ALESS 49.2, suggesting it is offset in redshift from ALESS 49.1. Finally, 1.4 GHz VLA observations (Biggs et al. 2011, based on Miller et al. 2008 data, 2 arcsec resolution) detect radio continuum emission from ALESS 49.2 at significance. The detections in these high-resolution observations confirm that ALESS 49.2 is a physical source, rather than an imaging artifact.
We do not find any significant Band 8 continuum or [C II] emission within a 1-arcsec radius of the position reported by Hodge et al. (2013). Given the small size of the ALMA Band 8 primary beam (FWHM=14.1 arcsec) and the large distance of ALESS 49.2 from the phase tracking centre (9.6 arcsec), the emission from ALESS 49.2 will be attenuated by 70%. Therefore, we impose a 3 upper limit of 1.2 mJy on the ALESS 49.2 620-m continuum flux-density. For a source, this constraint is compatible with a modified black-body SED with 20 K.
In addition to ALESS 49.2, Wardlow et al. (2018) detected significant 3.3-mm continuum emission from two additional sources in the vicinity of ALESS 49.1 - ALESS 49.L and ALESS49.C. However, we do not detect any emission at significance in either Band 8 continuum or [C II] emission at the position of any of the Wardlow et al. (2018) sources. Accounting for the primary beam response, we put 3 upper limits of 0.4 mJy, for both ALESS 49.L and ALESS 49.C. Given that ALESS 49.L and ALESS 49.C are detected at detection in the CO(3–2) and 3.3-mm continuum, respectively (Wardlow et al., 2018), we consider both sources to be physical. The companion sources in the LESS 49 field will be addressed in more detail using ALMA Band 4 observations in da Cunha et al. (in prep.).
Appendix B Spectral energy distribution for ALESS 49.1 and 57.1
The reference list from the paper itself. Each links out to its DOI / PubMed record.
- 1Abel et al. (2009) Abel, N. P., Dudley, C., Fischer, J., Satyapal, S., & van Hoof, P. A. M. 2009, Ap J, 701, 1147
- 2Alaghband-Zadeh et al. (2013) Alaghband-Zadeh, S., Chapman, S. C., Swinbank, A. M., et al. 2013, MNRAS, 435, 1493
- 3ALMA Partnership et al. (2015) ALMA Partnership, Vlahakis, C., Hunter, T. R., et al. 2015, Apjl, 808, L 4
- 4Armus et al. (2009) Armus, L., Mazzarella, J. M., Evans, A. S., et al. 2009, PASP, 121, 559
- 5Bakes & Tielens (1994) Bakes, E. L. O., & Tielens, A. G. G. M. 1994, Ap J, 427, 822
- 6Bevington (1969) Bevington, P. R. 1969, Data reduction and error analysis for the physical sciences
- 7Biggs et al. (2011) Biggs, A. D., Ivison, R. J., Ibar, E., et al. 2011, MNRAS, 413, 2314
- 8Bothwell et al. (2013) Bothwell, M. S., Smail, I., Chapman, S. C., et al. 2013, MNRAS, 429, 3047