A network model of immigration: Enclave formation vs. cultural integration
Yao-Li Chuang, Tom Chou, Maria R. D'Orsogna

TL;DR
This paper presents an agent-based network model to analyze how cultural adjustment speed and social link changes influence immigrant integration or enclave formation in native communities.
Contribution
It introduces a novel agent-based network model combining game theory and opinion dynamics to study factors affecting immigrant integration.
Findings
Fast cultural adjustment promotes cooperation and long-term host-guest connections.
Rapid social link remodeling leads to enclave formation and segregation.
Socioeconomic incentives and migrant skills impact integration outcomes.
Abstract
Successfully integrating newcomers into native communities has become a key issue for policy makers, as the growing number of migrants has brought cultural diversity, new skills, and at times, societal tensions to receiving countries. We develop an agent-based network model to study interacting "hosts" and "guests" and identify the conditions under which cooperative/integrated or uncooperative/segregated societies arise. Players are assumed to seek socioeconomic prosperity through game theoretic rules that shift network links, and cultural acceptance through opinion dynamics. We find that the main predictor of integration under given initial conditions is the timescale associated with cultural adjustment relative to social link remodeling, for both guests and hosts. Fast cultural adjustment results in cooperation and the establishment of host-guest connections that are sustained over…
Click any figure to enlarge with its caption.
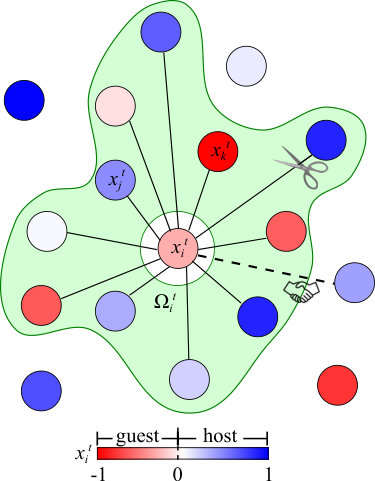 Figure 1
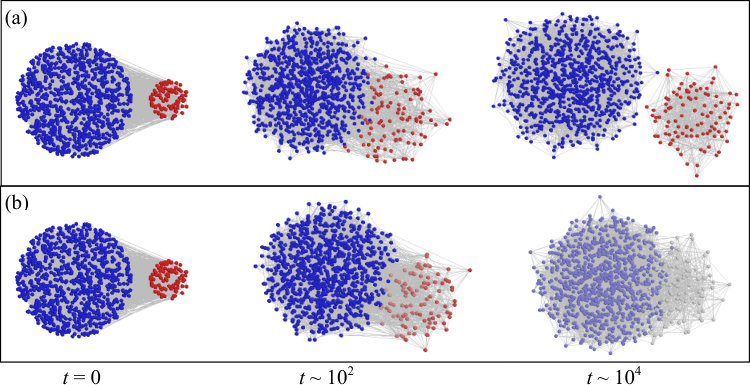 Figure 2
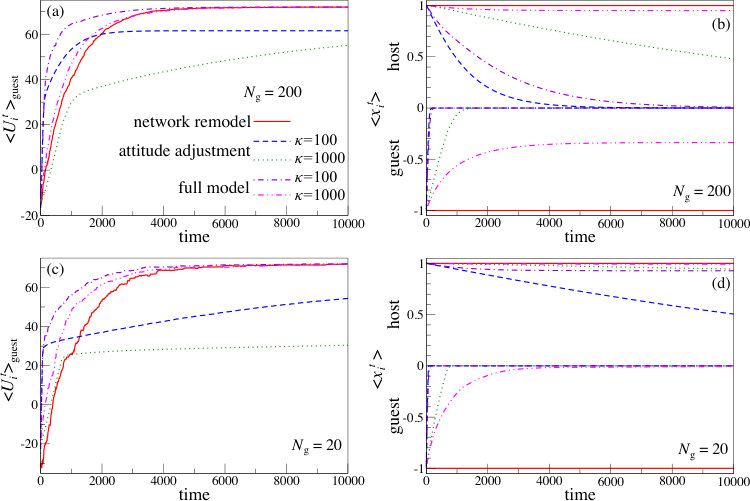 Figure 3
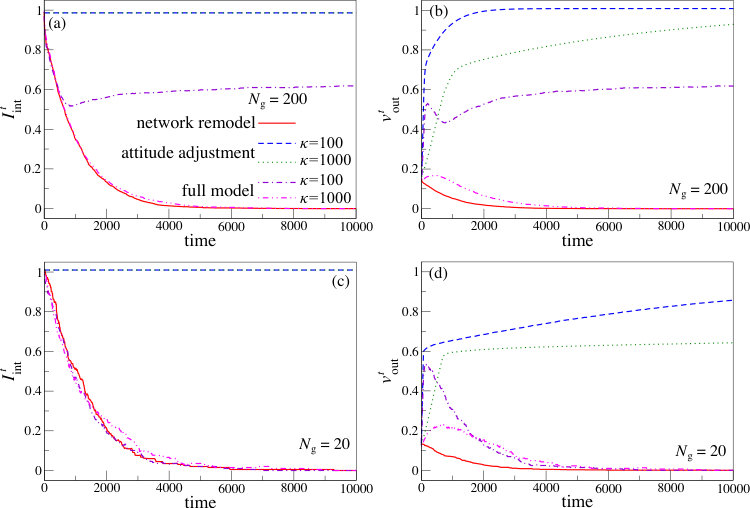 Figure 4
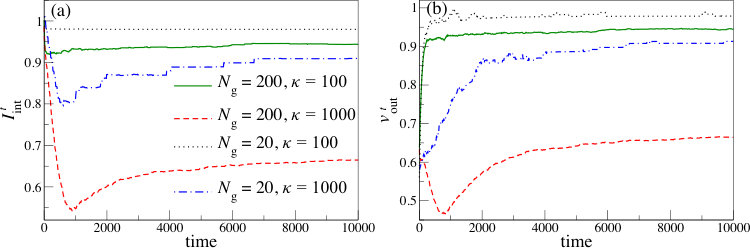 Figure 5
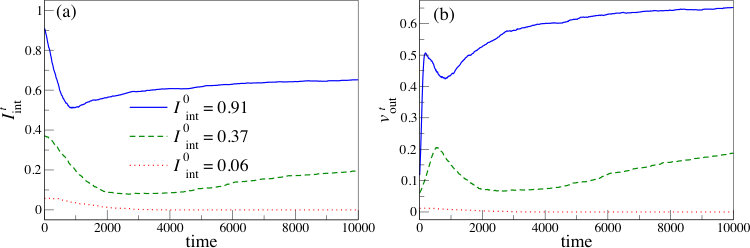 Figure 6
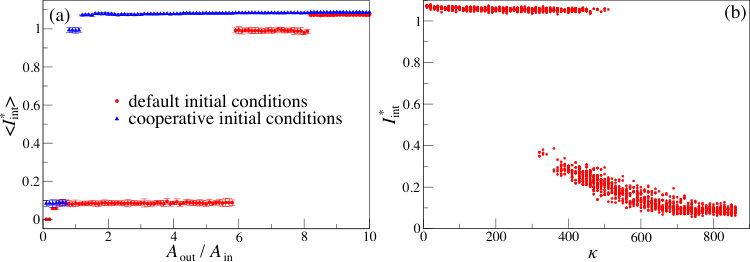 Figure 7
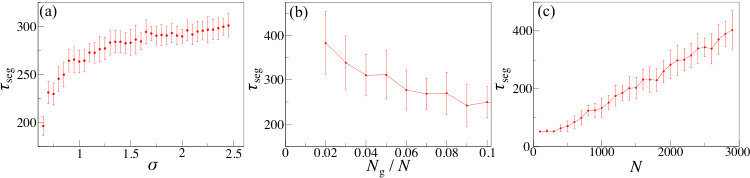 Figure 8
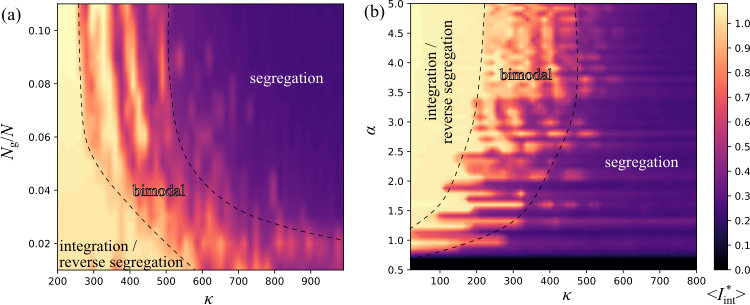 Figure 9
| Symbol | Description | default values |
|---|---|---|
| attitude | -1 to 1 | |
| maximal utility through in-group connection | ||
| maximal utility through out-group connection | to | |
| sensitivity to attitude difference | ||
| attitude adjustment timescale | to | |
| cost of adding connections | ||
| total population | ||
| guest population | to | |
| host population |
Peer Reviews
No public reviews on file for this paper yet. If you reviewed it on a platform where reviews are public (OpenReview, ICLR, NeurIPS, ICML), you can paste yours below so the community can read it here.
Videos
No videos yet. Explain this paper in a talk, walkthrough, or lecture? Add one.
A network model of immigration: Enclave formation vs. cultural integration
Yao-Li Chuang
Dept. of Mathematics, CSUN, Los Angeles, CA 91330-8313,
Dept. of Biomathematics, UCLA, Los Angeles, CA 90095-1766
Tom Chou
Dept. of Biomathematics, UCLA, Los Angeles, CA 90095-1766,
Dept. of Mathematics, UCLA, Los Angeles, CA 90095-1555
Maria R. D’Orsogna
Dept. of Mathematics, CSUN, Los Angeles, CA 91330-8313,
Dept. of Biomathematics, UCLA, Los Angeles, CA 90095-1766
Abstract
Successfully integrating newcomers into native communities has become a key issue for policy makers, as the growing number of migrants has brought cultural diversity, new skills, and at times, societal tensions to receiving countries. We develop an agent-based network model to study interacting “hosts” and “guests” and identify the conditions under which cooperative/integrated or uncooperative/segregated societies arise. Players are assumed to seek socioeconomic prosperity through game theoretic rules that shift network links, and cultural acceptance through opinion dynamics. We find that the main predictor of integration under given initial conditions is the timescale associated with cultural adjustment relative to social link remodeling, for both guests and hosts. Fast cultural adjustment results in cooperation and the establishment of host-guest connections that are sustained over long times. Conversely, fast social link remodeling leads to the irreversible formation of isolated enclaves, as migrants and natives optimize their socioeconomic gains through in-group connections. We discuss how migrant population sizes and increasing socioeconomic rewards for host-guest interactions, through governmental incentives or by admitting migrants with highly desirable skills, may affect the overall immigrant experience.
sociological model — network dynamics — game theory — opinion dynamics — agent-based model
pacs:
MSC-class: 90B15, 91D30 (Primary), 05C40, 05C57 (Secondary)
I Introduction
Migrating human populations have always played a significant role in history Boyle et al. (2013); Castles and Miller (2003); Crawford and Campbell (2012). For centuries individuals driven by adventurous spirits, or seeking better socio-economic opportunities, have voluntarily abandoned their original environments. Large groups of people have also been involuntarily forced from their homelands by hostile events such as famine, drought, religious persecution, political turmoil, human rights violations, and wars. According to the United Nations High Commissioner for Refugees (UNHCR), the number of forcibly displaced persons worldwide has been steadily climbing since 2011, reaching an unprecedented level of 68.5 million persons by the end of 2017. Among these 28.5 million are asylum seekers or refugees UNHCR (2018). Economic disparity enhances the pull of populations towards more developed regions; increased mobility reduces the cost in crossing national borders and geographic barriers; advanced communication technologies facilitate long distance social connections. All of these factors contribute to the massive scale of human migration observed in recent years Chaney (1979).
While large-scale emigration causes brain drain and loss of labor force in “source” countries, regions receiving immigrants also face challenges in accommodating new arrivals who may follow different social, cultural, and religious norms. Mistrust between natives and migrants may arise and exacerbate over time due to inadequate infrastructure and assistance programs. A well-documented phenomenon among immigrants is that of acculturative stress Berry (1992); Berry et al. (1987), whereby contact with another culture may lead to psychological and somatic health issues. Overall various studies of the immigrant experience describe outcomes ranging from very positive to very negative Berry (1992, 2005); Ireland (2004); Semyonov and Tyree (1981). Immigrants joining a multicultural society generally suffer from the least acculturative stress and are the best adapted, whereas those settling in less culturally tolerant communities face more challenges Berry (2005); Ireland (2004). A common observation is that those who do not adapt well, either by circumstances or lack of motivation, often become socially marginalized. Self-segregation may lead to the creation of insular communities that offer advantages to immigrants, but that also prevent them from fully integrating Berry (1992, 2005); Semyonov and Tyree (1981). These enclaves often deepen divisions between host and immigrant groups. The attitude of the majority host population is an important predictor of how successful the adaptation process of an immigrant group will be. Hostile host communities tend to hinder adaptation, with averse majorities playing a key role in the emergence of segregated minority communities Koopmans (2010); Priest et al. (2014).
The complex relationship between natives and migrants evolves over time and depends on many economic, historic, and political factors. By framing the main ingredients of this relationship in simple, quantifiable ways, mathematical models may help one to understand the implications of various mechanisms and of their synergy, and may help design intervention strategies. Agent-based mathematical models have been recently employed to study coexistence and cooperation among culturally heterogeneous populations through game theory Chiang (2013); Cohen et al. (2001); Fehl et al. (2011); Hales (2000); Hammond and Axelrod (2006); Klos (1999); Németh and Takács (2007); Riolo (1997); Riolo et al. (2001); Wang et al. (2018), opinion dynamics Chuang et al. (2017); Deffuant et al. (2000); DeGroot (1974); Felijakowski and Kosinski (2013, 2014); Friedkin (1999); Golub and Jackson (2010); Krause (2000); Weisbuch et al. (2002), population dynamics Axelrod (1997); Fossett (2006); Haw and Hogan (2018), and network theory Cohen et al. (2001); Fehl et al. (2011); Hammond and Axelrod (2006); Henry et al. (2011). In this paper we introduce an agent-based social-network model that assumes immigrant groups have two primary objectives: to improve their socioeconomic status and to gain acceptance within their social circles. The former scenario is usually modeled by implementing game theory rules, whereby a utility function associated with socioeconomic status is to be maximized Chiang (2013); Cohen et al. (2001); Hales (2000); Hammond and Axelrod (2006); Németh and Takács (2007); Riolo et al. (2001). The latter is typically described using opinion dynamics, whereby individuals adjust their opinions or cultural traits through social interactions Chuang et al. (2017); Deffuant et al. (2000); DeGroot (1974); Felijakowski and Kosinski (2013, 2014); Friedkin (1999); Galam (2005); Krause (2000); Weisbuch et al. (2002). Simplistic game theory models rarely yield cooperative patterns, as defectors tend to prevail if each agent is allowed to only make rational decisions for his or her own self-interest Németh and Takács (2007). Cooperative behavior may emerge through biased decision making whereby individuals collaborate solely with those that share their same opinion. This mechanism leads to social segregation, as tight collaborations develop only within culturally homogeneous enclaves Chiang (2013); Cohen et al. (2001); Fehl et al. (2011); Hales (2000); Hammond and Axelrod (2006); Nowak et al. (1990); Riolo (1997); Riolo et al. (2001). Models of opinion dynamics on the other hand often assume individuals seek like-minded peers, and willingly adjust to prevailing opinions Axelrod (1997); Galam (2005). Minority opinions arise and persist only through ad-hoc restrictions, such as including zealots, or by imposing thresholds so that consensus is reached only if two opinions are sufficiently close Galam (2016); Nowak et al. (1990).
As a rule of thumb, game theoretic models result in uncooperative behavior; opinion dynamics leads to uniform consensus. The immigrant narrative, however, is much more nuanced with behaviors ranging from uncooperative segregation to cooperative integration, suggesting modeling should include both mechanisms. We thus introduce a network populated with interacting “guest” and “host” nodes that seek to improve their socioeconomic status while culturally adjusting to each other. Socioeconomic gains are modeled via a utility function that evolves through game theoretic rules, while the attitudes (or “opinions”) that players harbor towards others evolve through opinion dynamics. These two mechanisms are interdependent, so that attitudes towards different cultures shape utility gains, and vice versa.
We show that the main predictor of integration or segregation is given by the relationship between two timescales: that of cultural adjustment, whereby guests and hosts adapt more tolerant attitudes of each other, and that of social link remodeling, whereby players change their network connections to increase their socioeconomic rewards. In the case of slow cultural adjustment, immigrant and host communities tend to segregate as accumulation of socioeconomic wealth occurs more efficiently through insular in-group connections. Conversely, if adjustment is sufficiently fast, cross-cultural bridges may be established and sustained, allowing different cultural groups to reach “consensus” and maintain active cooperation. Another key role will be played by the fraction of immigrants joining the total population as the immigrant-to-host ratio changes the cultural adjustment timescales. As we outline below, a high immigrant ratio increases the likelihood of in-group connections and reduces communication between immigrant and host populations.
In Section II, we introduce our network model, the mechanisms that govern the evolution of social connections, and the utility function for immigrant-host interactions. In Section III we examine the parameter dependence of our model and show how processes unfolding over different timescales lead to different outcomes of immigration integration. Finally, we conclude in Section IV with a discussion on sociological and policy implications.
II The model
Our basic model consists of a network whose nodes symbolize immigrant or native agents connected by edges that represent social links. Each node is also associated with an attitude and a utility function that depend on its connections and that determine an agent’s socioeconomic status. Over time, nodes change their connections and attitudes as they seek to increase their utility; as a result the network evolves towards integration or segregation between immigrant and host communities.
II.1 Network
Within our network model a node represents a social unit, such as an individual or a collection of individuals, and is labeled as a “guest” or a “host”, depending on whether it belongs to the immigrant or native group. Each node, indexed by , is characterized by an “attitude” variable at time , which varies between for guest nodes and in for host nodes. Hence the sign of is used to distinguish the group identity of the node. The magnitude indicates the degree of hostility that node harbors towards those belonging to the other group. Thus, characterizes most receptive guests or most hospitable hosts, while represents the highest level of xenophobia. Moreover, we define as the “social circle” of node at time , which is a set containing all nodes directly connected to node at time . We assume that there are a fixed number of host and guest nodes, with varying attitudes. All nodes seek to maximize their utility function as defined below.
II.2 Utility Function
The dynamics of our network is driven by the utility function assigned to each node . Each player seeks to maximize by shifting its attitude , and by forging and severing connections with other nodes. We model the utility of node at time via two components: a reward function for interacting with node , and a cost function for maintaining connections so that
[TABLE]
The pairwise reward function depends on the attitude difference between connected nodes and ; the smaller the attitude difference, the higher the reward. For a pair of nodes from the same group, i.e. if both and are hosts or immigrants, maximizing implies leading to consensus within the group. If and are nodes from different groups, is maximized by both sides adopting more cooperative attitudes such that and . Hence, the value of that will maximize will depend on the composition of and the attitudes of its members. The parameter controls the sensitivity of the reward, while the amplitude specifies the maximum reward attainable when . In principle, may depend on the specific socioeconomic attributes of the interacting pair. For simplicity we let be one of two discrete levels; for in-group interactions, where nodes and belong to the same group, both hosts or both migrants, and for out-group interactions between nodes and of different groups. The cost function in Eq. II.2 is a function of , the number of connections sustained by node at time , which by definition is also the cardinality of the social-circle set . We assume that the cost to maintain connections increases exponentially with through a scaling coefficient . A smaller value results in a steeper increase of cost, leading to fewer average connections per node. Note that such a cost function penalizes nodes with too many connections, suppressing the likelihood of “hub” nodes of high connectivity, a hallmark of small world networks that characterizes many real world social networks. In more realistic settings, the cost of maintaining social connections depends on more nuanced characteristics of each individual (wealth, fame, age, community status), allowing some to sustain higher degrees of connectivity than others. For simplicity our model does not include these considerations.
II.3 Mechanisms of Model Evolution
At each time step, each node seeks to increase its utility by adding or cutting connections and adjusting its attitude . We model this process as a series of stochastic events through the following steps:
At time , randomly pick the “active” node to make a decision. 2. 2.
Randomly pick another node .
- •
If and are connected, i.e., , check whether breaking the – connection increases for node . If it does, break the – connection.
- •
If , check whether adding an – connection increases for node . If it does, add the – connection. 3. 3.
Randomly pick a connected node via a reward-weighted probability
[TABLE] 4. 4.
Determine using ,
[TABLE]
where is the timescale associated with attitude adjustment. Large values of indicate longer adaptation times. We select different nodes for remodeling network connections and adjusting attitudes to avoid the emergence of any systematic biases. 5. 5.
Advance time and repeat steps 1–3.
In the above steps, all unweighted random selections are made through a uniform probability. As presented, our algorithm alternates between remodeling network connections and making attitude adjustments. Note that when steps 1–3 are repeated on all nodes, advances to , and that, on average, each node makes decisions once within this unitary time step. Thus, the timescale for network remodeling is one. The timescale for attitude adjustment, instead, is given by scaled by the probability for node to be paired with node carrying a different attitude. We can approximate this probability as the fraction of out-group connections, for hosts and for guests, so that the guest adjustment timescale can be estimated by , and the host adjustment timescale by .
An important observation is that can reach its maximum if within connected components of the network. This can be achieved in two different ways: i) through actual consensus where all nodes carry a neutral attitude so that in-group and out-group connectivities are equally likely, or ii) through a segregated network with homogeneous clusters made of all guests or all hosts, where non-zero but uniform attitudes are maintained in each cluster, so that does not necessarily imply . Although these two different network configurations lead to the same maximal utility, only the first one will be considered a true hallmark of harmonious integration, since attitudes are the most open on both sides, and there is minimal differentiation between intra-group or out-group connectivity. The second case instead represents the creation of parallel societies, with each group self-segregating into its own homogeneous enclave, maintaining little contact with “the other”.
II.4 Initial Conditions
All model parameters and typical values are listed in Table 1. Unless otherwise specified, our network simulations are performed using the initial conditions described here. We mostly simulate nodes, within which are hosts and are guests. In Section III.1 we also simulate the setting of and to examine the effect of extremely small fractions of guests. The initial attitudes are set at for all host nodes, and for all guest nodes, assuming that before the two groups make any contact they have minimal knowledge on how to coexist. For initial connections, we mostly use the following two extreme and opposite scenarios. One is that host and guest nodes are randomly connected with uniform probability, yielding on average ten connections per node at . The other is that hosts are connected to each other and that no guests are present. Host connectivity is determined by allowing the system to equilibrate in the absence of guests, representing the natural state of the community before the arrival of immigrants. Guests are introduced at as nodes without any links to either hosts or fellow guests. Note that because of the definition of the utility function in Eq. II.2, and because we allow the host community to equilibrate prior to inserting guests, we expect each host to be connected to an average number of other hosts at . The first initial condition scenario represents a perfectly executed welcoming program for immigrants, providing with them sufficient social ties to connect to the native community. In the second initial condition scenario, such a welcoming program does not exist at all, and guests arrive in a completely foreign environment.
III Results
Figure 2 shows two representative outcomes of our network model at steady state. In Fig. 2a guests (red circles) and hosts (blue circles) segregate and maintain highly hostile attitudes, as illustrated by the dark red and blue shades of the right hand panel. Cross-group utilities at the beginning of simulations yield low rewards which do not increase over time, leading to the severing of all ties between hosts and guests at . In Fig. 2b guests adopt more cooperative attitudes as represented by the lighter red colors. Such attitudes increase cross-group rewards so that guests and hosts stay mixed. Hosts will also become more cooperative, although at slower timescales than guests.
The two configurations shown in Fig. 2 represent two ways through which in Eq. II.2 is maximized. The configuration in Fig. 2a arises by cutting all cross-group links to form enclaves, within which guests and hosts adopt uniform but different attitudes . The configuration in Fig. 2b emerges through cooperative attitudes for all players. Both lead to as . To which of these two basins of attraction society converges, will depend on parameter choices and initial conditions as discussed below.
III.1 Maximizing utilities via network remodeling
and attitude adjustment
For a more quantitative perspective, we now examine how the utility function and the attitude profiles vary over time in some sample simulations. We set the model parameters to , , and , and let vary between and with and or . The assumption leads to a maximum in the utility which is reached if all connected nodes conform their attitude so that for any linked pair and when each node has links. For our chosen parameters, connections and .
Since we are interested in how immigrants adapt to their host environment, we will mainly focus on quantities associated with guest nodes. Although host node properties will also dynamically evolve, relative changes to their attitudes and connections will be much slower than that of guests due to their overwhelming majority. Initial conditions are chosen so that guests and hosts are randomly connected to each other as described in Section II.4. For the relatively large number of guests allows for segregated clusters to emerge and persist with in-group connections. For the low number of guests either leads to smaller in-group guest clusters with less-than-optimal number of connections (), or forces host-guest mixture to reach . We will first examine network remodeling and attitude adjustment independently of each other, and later the interplay between the two mechanisms.
Figure 3 shows the temporal evolution of the average utility per guest node and the average attitude of guests and hosts for sample simulations of (Figs. 3a and 3b) and (Figs. 3c and 3d) guest nodes with total nodes. In the red-solid curves we only allow for network remodeling, and deactivate attitude adjustment. Vice-versa, in the blue-dashed () and green-dotted curves () we only allow for attitude adjustment and deactivate network remodeling. Finally, the purple dotted-dashed curve () and the magenta-double-dotted-dashed curve () are results from the full model, where both network remodeling and attitude adjustment are implemented.
As can be seen in Fig. 3a for , increases over time towards for all five chosen cases. When only network remodeling is allowed (red-solid curve), increases quickly at the onset of the dynamics as nodes efficiently exchange low-utility, out-group connections for high-utility, in-group ones. As the number of exchanges nears completion, increases at a slower rate, until it converges to the steady state at with optimal, high-utility connections that are mostly in-group. Guests have established their own self segregated communities and thrive within it. When only attitude adjustment is activated (blue-dashed and green-dotted curves), nodes can only change their attitude and not their connections, hence they tend to evolve towards conformity ( for all nodes ). Note that if are a guest-host pair respectively, conformity will only arise from . Since depends solely on attitude adjustment, its dynamics will vary on the same timescale as , given by . In the case of fast attitude adjustment (blue-dashed curve for ), the early rise of can be more pronounced than in the case of network remodeling (red-solid curve), as can be seen for short times () in Fig. 3a. However, the utility at steady state under attitude adjustment is lower than under network remodeling, regardless of . This is because when only attitude adjustment is allowed, network connections cannot be rearranged, resulting in a less-than-optimal connectivity that changes to can only partially alleviate. Having network adjustment as the sole mechanism at play allows for more flexibility, since, although cannot change, a given node can actively search for others with similar attitude and even increase its number of connections. We verified that when only one of the two mechanisms is allowed, attitude adjustment consistently leads to less optimal outcomes compared to network remodeling for a number of parameter choices and initial conditions.
These trends are confirmed and better elucidated by inspecting the average attitudes of guests and hosts as a function of time in Fig. 3b. We use the same parameter sets and initial conditions as in Fig. 3a and the same color-coding scheme. The red-solid curves correspond to the case where we only allow for network readjustment and attitudes stay unmodified, so and for all times. The blue-dashed and green-dotted curves, where only attitude adjustment is allowed show that as increases, at a faster rate, and that at a much slower one. This is easily understood. Since nodes are not allowed to rewire their connections, they can only adapt their attitudes as discussed above, and provided the network is connected and no isolated clusters exist, all nodes will eventually conform to . However, being a numerical minority in the network, guests, for which , will share a large number of connections with hosts, for which . Under this condition, the adaptation rules presented in Sec. II.3 drive guests towards conformity more than hosts, so that faster than . Hence, the early increases in when only attitude adjustment is allowed and observed in Fig. 3a (blue-dashed , and green-dotted curves) can be attributed to fast adaptation of guests with time scale , and the later increases to slow adaptation of hosts with time scale .
The dynamics of the full model (purple-dotted-dashed , and magenta-double-dotted-dashed curves) depend on the interplay between the two mechanisms at play, attitude adjustment and network remodeling, and the respective timescales in gaining utility. From Fig. 3a, for the full model with fast attitude adjustment (purple-dotted-dashed, ) follows the attitude adjustment (blue-dashed, ) curve at early times, later shifting towards the network remodeling (red-solid) curve. Guests thus find it more advantageous to first adjust their attitudes, and then modify their network connectivity. Similarly, Fig. 3b shows as , following the curve where only attitude adjustment is allowed. The convergence of is slower because network remodeling allows the many hosts to replace their relatively few out-group connections with conspecifics. Eventually however, both guests and hosts converge towards integration, with , . In contrast, for the full model with slow attitude adjustment (magenta-double-dotted-dashed ) follows the network remodeling (red-solid) curve at all times. Here, guests find it more advantageous to change their connectivity, preferentially creating links to other guest nodes, rather than modify their attitudes towards host communities. Indeed attitudes converge to and as , with no further attitude adjustment possible.
This example illustrates the central role played by in the dynamics: low values of , indicating relatively short times for attitude adjustment , lead to harmonious societies with for all nodes, while larger values of , indicating longer times for attitude adjustment, lead to segregated communities.
In Figs. 3c and 3d we show and for a smaller immigrant population, and the same parameters as in Figs. 3a and 3b. We observe the same qualitative increase of utility in each of the five cases as discussed above. Discrepancies with plots obtained for mainly emerge when only attitude adjustment is allowed (blue-dashed , and green-dotted curves). Here, the early increase of utility is faster than for , but steady state is reached at a much slower rate. The overwhelming majority of hosts drives guests to rapidly adjust their attitudes, increasing at short times. By the same token, the host majority will not significantly change its attitude, so that guests can further increase their utility only by remodeling their connectivity. Indeed, the corresponding curves in Fig. 3d show guests rapidly converging to for all cases, while does not. Note that as long as the network is initially connected and no isolated clusters exist, when only attitude adjustment is allowed, as , although the process may be slow. For , due to the low number of guests, there is a higher probability than for of initiating the model with isolated host-only clusters. For these clusters, if only attitude adjustment is allowed, attitudes will stay quenched at . As a result, the overall will converge towards a non zero value.
In the case of the full model (purple-dotted-dashed, and magenta-double-dotted-dashed ) we see a similar trend , while for , and for as . Segregated host communities arise, with the numerically lesser guests adapting to the majority.
III.2 Quantifying outcomes of integration
The above results lead us to seek measures to better understand the topology of the network as a function of time, specifically from the guest standpoint. To this end, we introduce an integration index as the relative number of out-group connections of a guest node, averaged over all nodes, and scaled by the host population fraction
[TABLE]
Here, is the time independent host population fraction and is the number of out-group connections; the ratio is averaged over all guest nodes. A guest-only enclave for which leads to . Conversely, in a uniformly mixed guest-host configuration, , should not be too dissimilar from the host population fraction , leading to . As defined, . At guest nodes preferentially connect to hosts, shunning other guest nodes. We refer to this outcome as reverse segregation.
While measures the connectivity between guest and host nodes, another relevant measure is the fraction of the reward that arises from cross-group interactions. This is important, as guests connecting predominantly to host nodes may not necessarily be an indicator of balanced socioeconomic growth. For example, even for large values of hosts may share large rewards among themselves but very little with guests, representing a two-track society where guests, although connected, are not part of the mainstream socioeconomic activity.
In a perfect scenario, guests and hosts form an all-connected network, with out-group, host-guest connections among the total edges. If the reward is distributed equally among all edges, the ratio of out-group connections is given by . We thus define an out-group reward fraction as follows
[TABLE]
The first term on the right-hand side is the fraction of reward shared between guests and hosts with respect to the total. We then renormalize this quantity by the ratio derived above for the perfectly mixed scenario. As a result, indicates a connected network with no isolated clusters and with rewards equally spread among all nodes. Instead, points to complete segregation, where no socioeconomic reward comes from cross-group activities. Note that can exceed unity if the cross-group economy is more flourishing than intra-group growth.
The dynamics of and under the same parameter choices and mechanisms used to plot Fig. 3 are shown in Fig. 4. We first discuss the case of , in Figs. 4a and 4b. If we allow only for network remodeling (red-solid curves), the system will evolve towards segregation ( in Fig. 4a and in Fig. 4b). Here, since attitudes cannot change, nodes will maximize their utility through in-group connections and by creating insular communities. In the blue-dashed and green-dotted curves we deactivate network remodeling and only allow for attitude adjustment, with respectively. As can be seen from Fig. 4a at all times since the random connections assigned at are fixed and guest and host nodes remain well mixed in time. Fig. 4b shows that as cooperative attitudes emerge, cross-group rewards increase. In the case of fast attitude adjustment (blue-dashed curve), when nodes are completely cooperative, as , while in the case of slow attitude adjustment (green-dotted curve) convergence to is slower.
Results for the full model reveal the subtle interplay between network remodeling and attitude adjustment. At early times follows the network remodeling case only (red-solid curve) for both and . In both scenarios guests progressively severe their ties to hosts, due to their low utility. At the same time, attitude adjustment increases cooperativity on the given initial connections and temporarily increases. Eventually ineffective cross-group connections are completely eliminated under slow attitude adjustment (magenta-double-dotted-dashed, ) where and as . Under fast attitude adjustment (purple-dot dashed, ) instead cross-group connections contribute to the utility, so that and as . Note that and converge to the same value as since for both in-group and out-group connections. As a result, the distribution of rewards directly reflects the fraction of cross-group connections.
Taken together with results shown in Fig. 3a and 3b, the above dynamics confirm the crucial role played by , the attitude adjustment timescale, in determining societal outcomes. For the chosen parameters and when the full model is considered, more rapid attitude adjustment () leads to a more integrated society with , reaching non-zero values as , and with and . All these are hallmarks of a well-mixed, functional society, where guests and hosts share links, their socioeconomic progress is intertwined, and groups are not hostile to each other. On the other hand, slower attitude adjustment () leads to a segregated society, where , , and where and converge to non zero values as . In this case, there are no links connecting guests and nodes, there is no shared socioeconomic interest, and groups are hostile to each other. Society is fragmented and parallel societies have emerged. Note that these two opposite outcomes emerge from the same set of parameters, with the exception of .
Because of their superior number, it is the attitudes of hosts in particular that play a fundamental role in determining whether a society is segregated or not. This is consistent with findings from several surveys and societal observations Koopmans (2010); Priest et al. (2014). Recall that our initial conditions were set at , the most inhospitable. Figs. 4a and 4b show that this hostile environment drives the immigrant population towards segregation, unless attitudes can easily change, i.e. for small .
Results for confirm the above scenario, with a small difference. Here, , for both values of as , while and converge to values that deviate only slightly from unity. In this case, the very few guests must initially interact with the many hosts and their attitude will become cooperative. Hosts on the other hand will not necessarily link to guests, and due to their numerical superiority can remain hostile towards them. Over time, separated enclaves of hosts and guests will emerge, with guests keeping their cooperative attitude, but in isolation from hosts, while hosts will largely remain in the same state as at the onset of the adaptation process. In this case, in order for a more cooperative society to emerge the value of must be even smaller. We have verified this numerically, finding that for , in order for a more integrated society to emerge.
III.3 Initially hostile host attitudes drive immigrants
into enclaves
The importance of initial attitudes is further examined in Fig. 5, where at hosts are extremely hospitable and . Initial guest attitudes remain uncooperative at . All other parameters are set as in Figs. 3 and 4. Curves in Fig. 5a and 5b arise from the full model and should be compared to their counterparts in Fig. 4a and 4c.
In Fig. 5a we plot . As can be seen, guests and hosts are no longer completely segregated. At early times, decreases due to network remodeling, however at intermediate times, guests become more cooperative so that and for long times. The early decrease of is more significant for , since slow attitude adjustment leads to ineffective cross-group links and network remodeling will induce segregation. The decrease of is also relatively more significant for than for under the same value of . This is because a larger guest population, and a larger will more slowly evolve its initially hostile attitudes, allowing for segregation to cut cross-group, ineffective connections. In Fig. 5b, we plot which increases at early times in all cases except for and under slow adjustment . This is due to network remodeling. As discussed above, the slow attitude adjustment prompts nodes to seek in-group connections at early times; the guest population is large enough to allow for this leading to segregation with and an initially decreasing for the red-dashed curve. Due to the cooperative attitude of hosts however, guest eventually change their attitudes so that , and and increase.
One interesting finding is that when initial host attitudes are hostile, as shown in Figs. 4c and 4d, a larger guest population more effectively drives host attitudes towards cooperation. In contrast, when initial host attitudes are hospitable, as shown in Fig. 5a, a larger guest population results in less integration. In this case, the larger guest population is more resistant to attitude changes, and segregation may more easily emerge.
III.4 Higher initial connectivity facilitates better
integration
The initial social connections assigned to migrants upon arrival may affect integration outcomes. As discussed in Section II.4, one ideal scenario is that of welcoming programs that provide guests with prearranged social connections to hosts (), another is that of completely isolated guests arriving in an already connected native society (). In previous sections we only implemented these two extremes, perfect connectivity or total isolation. In this section we will consider more realistic, intermediate levels of initial guest connectivity.
Figure. 6 illustrates the effects of three initial configurations: well connected guests, (blue-solid curve), intermediately connected guests, (green-dashed curve), and poorly connected guests (red-dotted curve). Initial attitudes are uncooperative, and . All model parameters are the same as in Fig. 3 with and .
The time evolution of for all cases is shown in Fig. 6a. Here, decreases at early times until guests and hosts begin adopting more cooperative attitudes. For the initially well connected case (blue-solid curve), drops to before the trend is reversed at . For the initially intermediately connected case (green-dashed curve), the decreasing trend is not reversed until when . Finally, for the initially poorly connected case (red-dotted curve) attitude adjustment cannot give rise to cooperation before and host and guest communities are fully segregated. Mirroring trends are seen in Fig. 6b where we plot the out-group reward fraction . When guests are poorly connected at the onset (red-dotted curve), few links exists through which attitudes can change, guests become progressively segregated, and very little socioeconomic activity is shared. Hence, throughout. For the other two cases when there is more initial connectivity at the onset increases at early times (blue-solid and red-dotted curves) as guests adopt cooperative attitudes () through these initial guest-host connections. Later, network remodeling causes to decline as cross-group connections are replaced with in-group ones. At longer times, host attitudes also evolve towards cooperation () from residual guest-host connections. Here, network remodeling no longer favors in-group connections, and increases once more.
Although these results point to the importance of an initial network of connections for immigrants, in reality very few of them will have a support system upon arrival. Many host countries may not have adequate resources or programs to foster such contact, and host and guest communities may view each other with suspicion. In the rest of this paper we attempt to identify best practices leading to integration, and look at how results vary depending on model parameters. We will consider a realistic, worst case initial condition: that of an initially equilibrated host community and a totally isolated guest cohort, as outlined in Section II.4.
III.5 Dependence on parameters of
cross-group reward, attitude adjustment rate, and sensitivity to attitude difference
We now study how results from the model defined in Eqs. II.2–3 depend on its main parameters , , , , and . In earlier sections, we set and determined analytically that the utility reaches a maximum if each node has links. We have also verified this numerically for several parameter choices. Note that setting leads to indicating a network with no links, which we have verified numerically. We also briefly discussed how affects the dynamics by comparing results from high () and a low () regimes. Here we will conduct a more thorough investigation of the relevant parameters.
First we examine a scenario where and the effects of varying while keeping other parameters fixed. In Fig. 7a we plot the steady-state integration index as a function of , with , , , and for guests and a total population of nodes, corresponding to . Note that setting is equivalent to activating network remodeling only, since the timescale for attitude change diverges, hence attitudes will remain fixed at their initial values throughout the entire course of the dynamics. We also use two different initial conditions of total guest isolation but different initial attitudes. The blue-solid triangles represent initially cooperative populations with , while the red-solid circles represent initially hostile populations with , and . In both cases, guests have no connections at .
Each data point and relative error bar in Fig. 7a represents the mean and variance over realizations, respectively. For the cooperative case (blue-solid triangles) as long as in-group connections yield higher rewards and are preferred; hence the two populations are almost completely segregated and . Conversely, when out-group connections are preferred, and , indicating reverse segregation. When out-group and in-group connections are equivalent in terms of their socioeconomic weight and integration is observed at . Note the sharp transitions between regimes. The progression segregation integration reverse segregation as a function of also appears for the uncooperative conditions (red-solid circles). However, in this case transitions are shifted towards the right, indicating that out-group connections must yield higher socioeconomic gain to promote integration (or reverse segregation) in order to overcome the initial hostility among players. Here, segregation persists until for which , full integration arises for and reverse segregation at appears only for . Note that in both cases since attitudes are fixed, rewards are given by if through out-group connections, and by if through in-group ones. The two will be the same for .
These results indicate that to promote integration, cross-group connections must generate higher rewards than in-group ones. This may be realized, for example, if the immigrant population possesses skill sets that complement those of the host population. Since no attitude adjustment is allowed in the dynamics, Fig. 7a suggests that integration may occur even if groups maintain their hostility towards each other as long as the socioeconomic rewards are large enough, as seen for the uncooperative case (red-solid circles). Finally, note that the same parameter sets yields very different results for a wide range of values, as can be seen by the bimodal values of in Fig. 7a and underlying the role of initial conditions in determining integration or segregation.
We examine the effects of varying in Fig. 7b. Here, we use the same parameters as in Fig. 7a with , , , and . The ratio provides modest incentives for guests and hosts to collaborate. We consider initially hostile guests and hosts at and , and omit fully cooperative initial conditions since, in this case, changes to will not alter the dynamics. Each red solid circle in Fig. 7b is the result of a single simulation; for each value of simulations are repeated times. The dot-plot shows that if attitude adjustment is sufficiently fast () reverse segregation arises and ; guests and hosts adopt cooperative attitudes before segregation can arise. For very slow attitude adjustments (), almost complete segregation as is the only outcome. A bimodal regime instead arises for intermediate values of where segregation and reverse segregation are both likely. The bimodal feature of Fig. 7b is indicative of the different timescales between the two competing mechanisms of network remodeling and attitude adjustment. If attitude adjustment is fast compared to network remodeling (low ) guests will quickly adopt cooperative attitudes, and guest-only enclaves will not be formed. Conversely, if attitude adjustment is slow compared to network remodeling (large ) guest-only enclaves will form hindering cooperativity. In between these limits, is a regime where the timescales of network remodeling and attitude adjustment are comparable, and the outcomes stochastic.
The last parameter we examine here is , which regulates the sensitivity of the reward function to attitude differences in Eq. II.2. Note that renders independent of . Finite values of , however large, do not determine whether in-group or out-group connections are preferred. This parameter thus will only affect the timescale of the dynamics. In particular, since larger values of attenuate the sensitivity of to we expect larger values of to also be associated with slower dynamics. We have verified this by considering the time to reach segregation, defined as , as a function of and for a variety of parameter choices. In Fig. 8a we plot the time to segregation, denoted by , for the particular case of , , and , with initially hostile populations and and no initial link between hosts and guests. As can be seen, increases with . This result suggests that decreasing the sensitivity to attitude differences, particularly between guests and hosts, results in longer times to full segregation. This larger time window between migrant arrival and full segregation may provide better opportunities to implement interim policies that promote cooperation.
III.6 High immigrant ratios and small native populations promote segregation
In this section we examine the effects of migrant population sizes compared to that of the native community. We are particularly interested in the uncooperative, segregated case and examine how the time to segregation depends on the fraction of guests. Under parameters and conditions that favor segregation, we expect larger guest populations will more quickly evolve to the uncooperative steady state. We thus consider a scenario where at steady state guests segregate, resulting in , , as . We then keep all parameters fixed, including the total population , and modify only to study as a function of the ratio. In Fig. 8b we show for the representative case of , , , and . Initial conditions are initially hostile populations and and no initial link between hosts and guests. As can be seen, is a decreasing function of its argument, as expected. Here, attitude adjustment timescales are not affected by , however a larger guest population makes in-group interactions more likely under the dynamics specified in Section II.3. The increased guest-guest pairing allows for uncooperative attitudes to be maintained for longer times, lowering the utility reward from cross-group interactions and hastening the severing of such links. Numerically lower guest populations instead carry a higher likelihood of interacting with hosts, fostering cooperative attitudes for longer times, and allowing for socioeconomically advantageous cross-group connections to emerge. Several sociological reports show that conflicts between a majority and a minority population are less intense and frequent, if the majority population greatly exceeds that of the minority, Barron et al. (2004). We can conjecture that such conflicts arise when hosts and guests are extremely polarized and segregated from each other, as for the case illustrated above. Our results show that as increases segregation, and by proxy, the emergence of conflict between the two groups increases as well, confirming these sociological findings.
Finally, in Fig. 8c we plot as a function of the total population by fixing . All other parameters and initial conditions are the same as in Fig. 8b. As can be seen, larger populations lead to longer times to segregation . This result implies that the same fraction of migrants can be more easily accommodated in larger communities.
III.7 Transitioning from segregation to integration
In this section we study the interplay between the two timescales, and , that determine whether or not guest-only enclaves will form, starting from an initially hostile and unconnected mixture of guests and hosts. In Fig. 7b we showed that fast attitude adjustment (small ) prevents the formation of guest-only enclaves if incentives are in place to support cross-group collaborations (). As shown in Fig. 8b, increasing the guest population ratio , shortens the time to segregation and facilitates the establishment of guest-only enclaves.
To study the interplay between and we plot in Fig. 9a as a function of and for the representative case of , , , , and . The populations are initiated with hostile attitudes and , and no cross-group initial link. As can be seen, decreasing induces a transition from segregation at for large , to integration at , for small , or even reverse segregation at , for very small . Transitions towards integration thus are favored in societies where attitudes towards the other are less entrenched and where guests and hosts more readily adapt to each other. Fig. 9a also shows that transitions depend on the value of , and indirectly on : larger values of imply shorter transition values. This is because increases in , and consequently decreases in , correspond to less time for attitude adjustment to affect cross-group utility gains. Larger percentages of migrants imply that individual attitudes must be even more open to diversity if one is to observe the same target integration index . Note that in Fig. 9a we can also identify a bimodal regime, where takes on values between zero and where final integration outcomes depend on stochastic events.
Finally, in Fig. 9b, we study how the integration index depends on and , the latter controlling the average number of connections associated with each node. We fix and use the same parameter values and initial conditions as in Fig. 9a. Increasing corresponds to increasing the number of connections per node. As can be seen in Fig. 9b the same progression seen in Fig. 9a of transitioning from segregation to integration can be seen upon lowering for fixed . Increasing leads these transition points to shift towards larger values of , signifying that more connections per node allow for slower attitude adjustment to achieve the same integration value . Beyond however, the transition regime of appears not to change appreciably, implying little sensitivity of to the average number of connections per node.
IV Discussion and Conclusions
As recent news reports and historical analysis attest, societal dynamics after the influx of newcomers depends on many factors, including the socioeconomic environment of the host country, the adaptability of the immigrant population, the open-mindedness of natives, and the degree of compatibility between guest and host values. Our model is based on the assumption that upon resettlement immigrants have two primary goals: socioeconomic prosperity and social acceptance. Game-theoretic rules are used to model socioeconomic gains through a utility function to be maximized, leading to network remodeling. Attitude adjustment is instead driven by opinion dynamics rules. The two processes occur at different timescales: network remodeling at a timescale of unity, and attitude adjustment at a timescale of for guests. Due to their numerical superiority, hosts constitute a quasi-infinite bath: they greatly impact migrant dynamics, but their own characteristics change only marginally and over very long timescales, given by .
The interplay between the various timescales is shown across our analysis. For low values of attitude adjustment is fast, cross-group socioeconomic gains are robust and immigrants are less likely to form segregated enclaves. For large values of , attitudes change very slowly, and the formation of isolated guest niches becomes the most efficient way for guests to advance their socioeconomic status. Our results are consistent with findings from public goods evolutionary game theory models where interactions among various social contexts, such as population diversity and cultural tolerance, lead to different ratios between the timescales for strategy evolution and network structure remodeling; such timescale difference determines whether cooperative patterns emerge Szolnoki and Perc (2016); Wang et al. (2018). In particular, cooperators will outweigh defectors if strategy evolution is faster than network remodeling Santos et al. (2006).
The socioeconomic reward structure associated with guest-host collaborations also plays an important role in determining societal outcomes. As shown in Fig. 7a larger out-group versus in-group rewards, represented by the ratio, are more conducive to integration. Out-group rewards promote the willingness among a mixed population to pursue conformity, which was identified as a key psychological factor for cooperative patterns to emerge in game theoretical models Javarone et al. (2015). These results suggest that segregation may be avoided if newcomers carry inherent advantages, for example in the form of skill sets that are complementary to those of the native population, or if governmental incentives are established to promote cross-group interactions. Fig. 7a also reveals the fundamental role of initial conditions. If out-group rewards are much larger than in-group ones, , cooperation arises regardless of initial conditions. However, if the two are comparable, Fig. 7a shows that integrated or segregated societies can emerge from the same parameter set, and that whether one configuration prevails over the other depends on the initial conditions. Of course, integration is the more likely outcome if the initial attitudes are highly cooperative, while segregation will typically emerge from initial scenarios where guests and hosts are highly hostile to each other. This finding is also consistent with sociological observations Koopmans (2010); Priest et al. (2014) where the attitude of the majority population is identified as a primary determinant in minority segregation.
We also find that given the same social environment, a higher immigrant population ratio results in segregation, while a larger total population will more harmoniously absorb the same percentage of immigrants, which agrees with previous Ising-type sociophysical models of immigrant integration Galam and Javarone (2016). Our results suggest accommodating newcomers in accordance with the host population. Small, possibly rural, communities may not be optimal conduits to integration compared to more populous cities, especially if the percentage of migrants is large. Examples of countries distributing refugees in proportion to the population of receiving municipalities include Denmark, from 1986 to 1998, Sweden, from 1987 to 1991, and the United Kingdom since 2000. However, refugees were later found to relocate to larger cities Damm (2009); Stewart (2011); White et al. (2016), attracted by the presence of more co-ethnics, job opportunities and housing. Recent studies have also observed higher segregation of immigrants in rural areas, especially when the size of the migrant group is large and hosts are hostile to guests Kandel and Cromartie (2004); Lichter et al. (2016, 2010).
Our model does not include spatial dependence or geographical factors in making and maintaining social connections. For example, the turnover rate of social connections may be higher in denser areas, leading to inhomogeneous timescales for attitude changes in the network. We also do not consider the effects of virtual connectivity, whereby internet connections may render spatial dependence less relevant while also accelerating segregation as finding co-cultural companions is facilitated in online venues.
Our model may be generalized by introducing a continuous influx of immigrants, instead of assuming a fixed initial guest population. A continuous influx may allow us to include in-group interactions between immigrants arriving at different times, and to study cooperation or antagonism among them. To further extend our model across generations, since earlier immigrants and their descendants eventually may be considered part of the native community, the barrier between hosts and guests must be relaxed in order to allow for generational crossover between groups. Similarly, long-term attitude differences between hosts and guests can lead to open conflict or violence that may curb socioeconomic rewards, including in-group ones. This mechanism would require higher order corrections and feedback mechanisms that are currently not included in our work.
Moreover, our utility function carries the same form for every node and penalizes those with too many connections. As a result, all nodes converge towards an average number of connections, which is not realistic, since actual social networks take on small-world characteristics, with hub nodes having a large number of connections Watts and Strogatz (1998). Our model may be improved by introducing more nuanced utility functions. For example, we may postulate that nodes with larger socioeconomic utility are able to maintain a larger number of connections, compared to those with lower utility, creating a mechanism for hubs to emerge Gabel et al. (2013). All these factors may influence the entire society and change host and guest perceptions, in a positive or negative way.
Acknowledgements.
This work was made possible by support from grants ARO W1911NF-14-1-0472, ARO W1911NF-16-1-0165 (MRD), and NSF DMS-1516675 (TC).
The reference list from the paper itself. Each links out to its DOI / PubMed record.
- 1Boyle et al. (2013) P. Boyle, K. Halfacree, and V. Robinson, Exploring contemporary migration (Pearson Education Limited, London and New York, 2013), 2nd ed.
- 2Castles and Miller (2003) S. Castles and M. J. Miller, The age of migration: International population movements in the modern world (The Guilford Press, New York, 2003).
- 3Crawford and Campbell (2012) M. H. Crawford and B. C. Campbell, eds., Causes and consequences of human migration (Cambridge University Press, Cambridge, UK, 2012).
- 4UNHCR (2018) UNHCR, Tech. Rep., The UN Refugee Agency, The United Nations (2018), http://www.unhcr.org/5b 27be 547.pdf.
- 5Chaney (1979) E. M. Chaney, The International Migration Review 13 , 204 (1979).
- 6Berry (1992) J. W. Berry, International Migration Quarterly Review 30 , 69 (1992).
- 7Berry et al. (1987) J. W. Berry, U. Kim, T. Minde, and D. Mok, The International Migration Review 21 , 491 (1987).
- 8Berry (2005) J. W. Berry, International Journal of Intercultural Relations 29 , 697 (2005).