On the unification of zero-adjusted cure survival models
Francisco Louzada, Pedro Luiz Ramos, Hayala C. C. Souza, Lawal, Oyeneyin, Gleici da Silva Castro Perdona

TL;DR
This paper introduces a unified survival model that incorporates zero-adjustment and cure proportions, accommodating various cause distributions, and demonstrates its effectiveness through simulations and real obstetric data analysis.
Contribution
It presents a novel, flexible survival model unifying zero-adjusted and cure models with multiple cause distributions, validated by simulations and real data.
Findings
Model fits obstetric data well with geometric causes.
Simulation shows improved estimator accuracy with larger samples.
Flexible framework applicable to diverse survival data.
Abstract
This paper proposes a unified version of survival models that accounts for both zero-adjustment and cure proportions in various latent competing causes, useful in data where survival times may be zero or cure proportions are present. These models are particularly relevant in scenarios like childbirth duration in sub-Saharan Africa. Different competing cause distributions were considered, including Binomial, Geometric, Poisson, and Negative Binomial. The model's maximum likelihood point estimators and asymptotic confidence intervals were evaluated through simulation, demonstrating improved accuracy with larger sample sizes. The model best fits real obstetric data when assuming geometrically distributed causes. This flexible model, capable of considering different distributions for the lifetime of susceptible individuals and competing causes, is an effective tool for adjusting survival…
Click any figure to enlarge with its caption.
 Figure 1
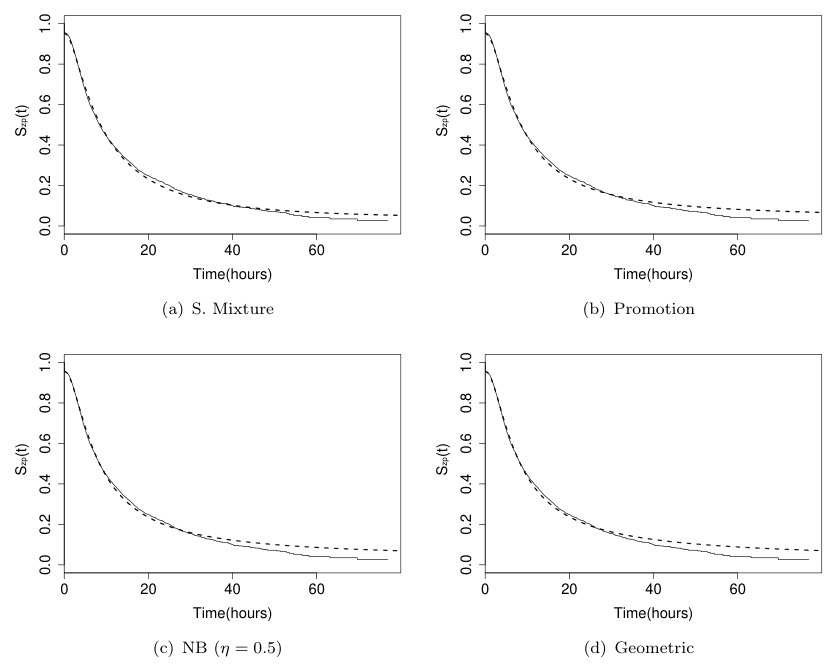 Figure 2
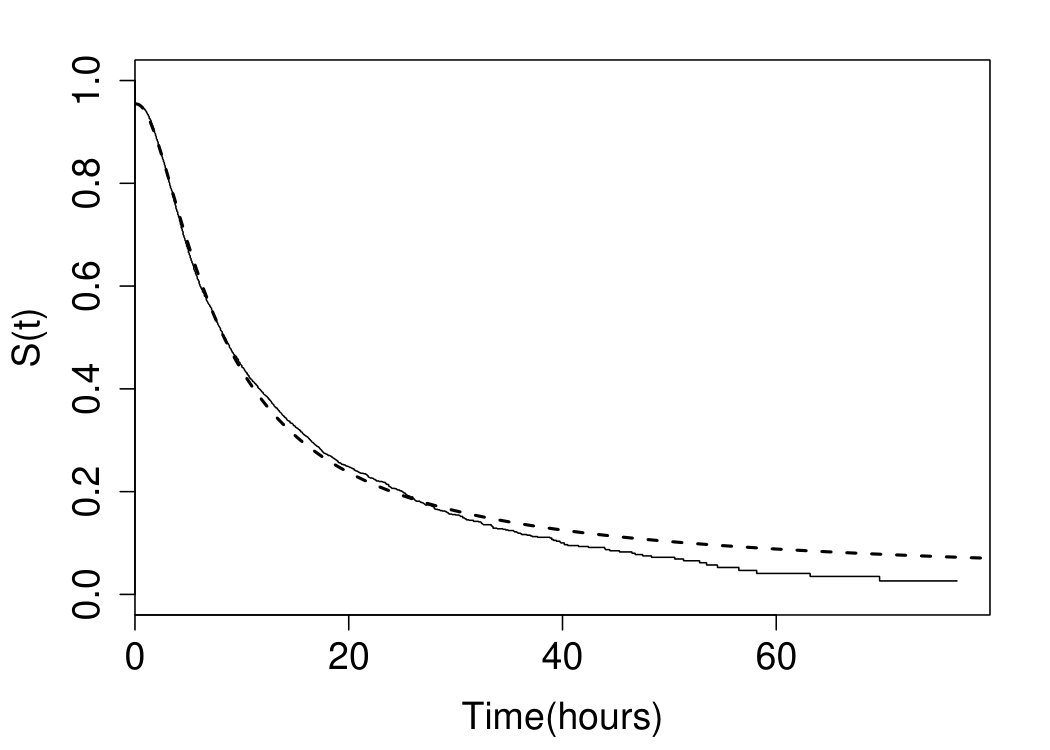 Figure 3
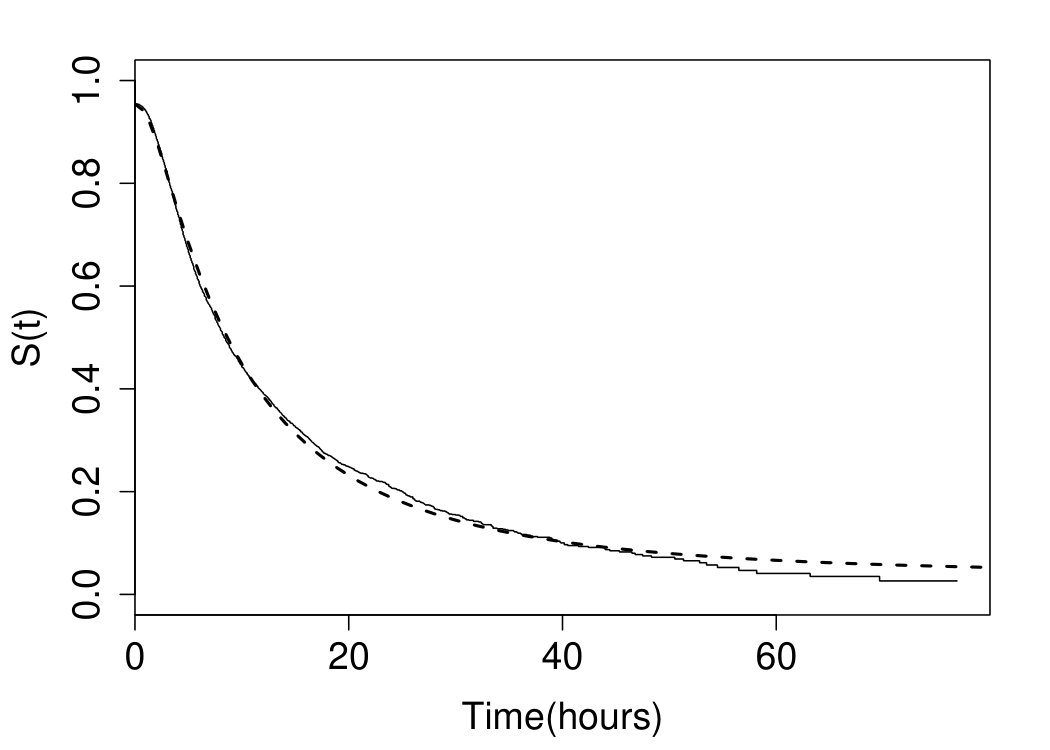 Figure 4
 Figure 5
| Sample size | Parameter | Bias | RMSE | CP |
|---|---|---|---|---|
| 50 | 0.0100 | 0.2276 | 0.9411 | |
| -0.0243 | 0.1705 | 0.9023 | ||
| 0.0014 | 0.0418 | 0.8861 | ||
| -0.0044 | 0.0770 | 0.9420 | ||
| 150 | 0.0057 | 0.1277 | 0.9479 | |
| -0.0060 | 0.0960 | 0.9338 | ||
| -0.0005 | 0.0247 | 0.9211 | ||
| -0.0009 | 0.0436 | 0.9487 | ||
| 300 | 0.0004 | 0.0890 | 0.9480 | |
| -0.0043 | 0.0669 | 0.9468 | ||
| -0.0001 | 0.0174 | 0.9358 | ||
| -0.0001 | 0.0308 | 0.9488 | ||
| 500 | 0.0012 | 0.0686 | 0.9486 | |
| -0.0016 | 0.0525 | 0.9436 | ||
| 0.0000 | 0.0134 | 0.9461 | ||
| -0.0006 | 0.0236 | 0.9501 |
| Sample size | Parameter | Bias | RMSE | CP |
|---|---|---|---|---|
| 50 | 0.0137 | 0.2685 | 0.9409 | |
| -0.0159 | 0.1711 | 0.9144 | ||
| 0.1480 | 0.8659 | 0.9710 | ||
| 0.0394 | 0.2735 | 0.9573 | ||
| 150 | 0.0026 | 0.1466 | 0.9443 | |
| -0.0070 | 0.0959 | 0.9351 | ||
| 0.0346 | 0.2645 | 0.9582 | ||
| 0.0110 | 0.1429 | 0.9497 | ||
| 300 | 0.0002 | 0.1021 | 0.9455 | |
| -0.0029 | 0.0666 | 0.9471 | ||
| 0.0132 | 0.1794 | 0.9529 | ||
| 0.0053 | 0.1000 | 0.9508 | ||
| 500 | 0.0021 | 0.0785 | 0.9529 | |
| -0.0009 | 0.0516 | 0.9477 | ||
| 0.0081 | 0.1386 | 0.9493 | ||
| 0.0056 | 0.0766 | 0.9520 |
| S. Mixture | Promotion | NB () | Geo () | ||||||||
| MLE | SD | MLE | SD | MLE | SD | MLE | SD | ||||
| 2.167 | 0.024 | 3.200 | 0.088 | 4.151 | 0.185 | 5.8163 | 0.4375 | ||||
| 1.035 | 0.016 | 1.259 | 0.025 | 1.430 | 0.034 | 1.6848 | 0.0490 | ||||
| 0.045 | 0.0025 | 3.092 | 0.058 | 7.383 | 0.058 | 21.0093 | 0.0575 | ||||
| 0.038 | 0.011 | 3.248 | 0.221 | 9.726 | 0.259 | 64.4428 | 0.3888 | ||||
| AIC | 31034.95 | 31035.61 | 31033.08 | 31029.67 | |||||||
| Time | Admission | 6 hours | 12 hours | 18 hours |
|---|---|---|---|---|
| (y) | 95.46% | 61.82% | 37.53% | 26.16% |
Peer Reviews
No public reviews on file for this paper yet. If you reviewed it on a platform where reviews are public (OpenReview, ICLR, NeurIPS, ICML), you can paste yours below so the community can read it here.
Videos
No videos yet. Explain this paper in a talk, walkthrough, or lecture? Add one.
Taxonomy
TopicsBayesian Methods and Mixture Models · Stochastic processes and statistical mechanics
On the unification of zero-adjusted cure-rate survival models
Francisco Louzada1
Pedro L. Ramos1
Hayala C.C. de Souza2
[email protected];[email protected]
Lawal Oyeneyin3
Gleici da S. C. Perdoná2
1Institute of Mathematical and Computer Sciences, Sao Paulo University, Sao Carlos, Brazil
2 Department of Social Medicine - Ribeirão Preto School of Medicine, University of São Paulo, Ribeirão Preto, Brazil
3 Department of Obstetrics and Gynaecology, Mother and Child Hospital, Ondo State, Nigeria
Abstract
Background and Objective: It has become widespread in several areas, that survival models may accommodate a cure-rate proportion, which appears when a group of subjects does not present the event of interest, even after an extended follow-up. Moreover, for a diversity of phenomena, a considerable proportion of individuals may have lifetimes equal to zero, which affects the survival curve by deflating its initial value to values smaller than one. Survival models that include these two features can be referred to as zero-adjusted cure-rate survival models. This class of models is still limited in terms of modeling competitive causes. This paper’s main objective is to present a unified version of the survival models, which accommodates the zero-adjustment and cure-rate proportions for a general class of latent competing causes. The modeling is motivated by the characteristics observed in a real dataset about the duration of childbirth in sub-Saharan Africa. Methods: We first derive the proposed model and present the particular cases considering various distribution for the competing causes, as Binomial, Geometric, Poisson, and Negative Binomial. It was performed a simulation study to evaluate the properties of maximum likelihood point estimators and asymptotic confidence intervals. Finally, we present the modeling of particular cases in real obstetric data collected by the World Health Organization. Results: The simulation study indicates that both bias and root mean square errors are closer to zero, and the empirical coverage probabilities are closer to the nominal coverage level as the sample size increases. Regarding the study of the childbirth times, the particular case that assumes Geometrically distributed causes presented a better fit to the data. Conclusions: We have shown that our model is a useful tool for adjusting survival data in the presence of zeros. The main advantage of the proposed methodology is that it guarantees great flexibility for modeling, as the researcher can consider different probability distributions for the lifetime of susceptible individuals and competitive causes. As can be applied in several practical situations that need to accommodate zero-adjusted lifetimes, we believe that our model has a vast application potential.
keywords:
competitive causes , cure-rate , unified model , zero-adjustment.
MSC:
[2010] 62F15, 62N05
mytitlenotemytitlenotefootnotetext: On the unification of zero-adjusted cure-rate survival models
1 Introduction
Nowadays, survival models accommodating a long-term proportion (or a cure-rate), representing a group of subjects that do not present the event of interest, even after an extended follow-up, are standard. There are several examples of the application of this class of models in the biomedical field [1, 2, 3]. Perhaps the most popular cure-rate models are the mixture cure-rate model proposed by Berkson and Gage [4] and the promotion cure-rate model proposed by Chen et al. [5]. Recently, a unified approach for cure-rate survival models was proposed by Rodrigues et al. [6].
Although it is usually the survival models to assume that the variable time should be greater than zero, there is a diversity of phenomena in which we can find a considerable proportion of individuals with lifetimes equal to zero, which affects the survival curve by deflating its initial value to values smaller than one. For instance, in the commercial area, where the interest is to predict the defaulters or fraudsters, a proportion of clients do not pay their loans from the beginning of the contract, leading to times of default equal to zero [7]. In oncology, when there is interest in the time interval between diagnosis and the occurrence of metastasis, it is possible that patients already present metastasis at the time of diagnosis [8]. In mice laboratory trials, where the interest is the induced sleep time measured after the ingestion of a dose of ethanol, some mice showed immunity to the ingested dose, resulting in sleep times equal to zero [9]. Statistically speaking, such peculiarity is the so-called zero-adjustment or zero-inflation [10, 11, 7].
Therefore, it is crucial to propose survival models that can accommodate the two features described above: zero-adjustment and cure-rate. These models are referred to as the zero-adjusted cure-rate (ZACR) survival models. To the best of our knowledge, there are just three proposed models for continuous lifetime datasets accommodating lifetime values equal to zero and cure-rate [7, 11, 12].
The first one is the standard mixture ZACR model [7], which generalizes the mixture cure-rate model proposed by Berkson and Gage[4]. In this model the survival function of the population is given by , where is the cure-rate proportion, is the zero-adjustment proportion and is the survival function of the susceptible population. It is possible to show that, in the standard mixture ZACR, the number of competitive causes follows a Bernoulli distribution. The second one is the promotion ZACR model [11], which generalizes the promotion cure-rate model [5], assuming that follows a Poisson distribution with mean equals to . Then, the population survival function is given by Therefore, the cure-rate and zero-adjusted proportions are given by and , respectively. Finally, the third model [12] proposes that the population survival function is given by , where denotes the proportion of zero-adjusted lifetime and is an improper survival function from Gompertz or Inverse Gaussian defective models.
In light of the described above, we conclude that the proposed models are restricted regarding the distribution of . To consider more flexible models for can be useful for describing intricate data patterns and for identifying which distribution best fit the data. Therefore, the ZACR models must be more flexible in terms of modeling competitive causes.
In this paper, in order to allow the distribution of the to be more flexible than a Poisson or a Bernoulli one, we propose a unified version of the survival models, hereafter the unified ZACR model, which accommodates the zero-adjustment and cure-rate proportion for a general class of latent competing causes. Our modeling is motivated by the peculiarities observed in data from a sub-Saharan African obstetric study. This data set was collected by the World Health Organization (WHO) as part of the development of the project Better Outcomes in Labour Difficulty (BOLD) [13, 14, 15]. More details are provided in the application section.
The paper is organized as follows. In Section 2, we derive the unified zero-adjusted cure-rate survival model and present some particular cases. In Section 3, we discuss the inferential procedures under the maximum likelihood approach, assuming that the follows a Negative Binomial distribution. In Section 4, we present the results of a simulation study, performed in order to evaluate the finite sample performance of parameter estimates of our model. In Section 5, we illustrate the proposed methodology on a sub-Saharan African obstetric dataset. The discussion and final remarks are presented in Section 6.
2 Methods
2.1 The unified zero-adjusted cure-rate survival model
Following Rodrigues et al. [6], let be defined as the time-to-event due to the -th competitive risk. Also, let be a random variable with a discrete distribution . In order to account the individuals that are not susceptible to the event of interest, the lifetime is defined as , with , this leads to a proportion of the population which is not susceptible to the event of interest. Additionally, according to Feller [16], let be a real number sequence. It is known that the function can be defined as the generating function of the sequence if, for , converges.
The standard survival models suppose that , is a non-negative random variable. Then, in order to present a model that takes into account zero initial failures, let us define
[TABLE]
as realizations of W. The survival function of the random variable W is given by
[TABLE]
where is related to proportion of zero-adjustment. In other words, is a random variable having a mass at the origin. Additionally, to account the individuals that are not susceptible to the event of interest,the lifetime, , is redefined as , where .
Definition 2.1**.**
If for , then
[TABLE]
where and converges if .
Based on Definition 2.1 and on the definitions of Feller[16] and Rodrigues et al.[6], the survival function of the unified ZACR model, , is defined in the following Theorem.
Theorem 2.2**.**
Given a proper survival function, S(y), the survival function of the random variable Y is given by
[TABLE]
where and converges if .
Proof.
Note that, from the zero-adjusted (ZA)
[TABLE]
Therefore,
[TABLE]
∎
The unified ZACR model (2) generalizes a variety of survival models with and without zero-adjustment. This particularity is demonstrated in the following two Theorems to the ZACR models proposed by Louzada et al. .[7] and Olivera et al. .[11].
Theorem 2.3**.**
The Standard Mixture ZACR model is given by
[TABLE]
where
[TABLE]
Proof.
Let
[TABLE]
then
[TABLE]
∎
Note that is a proper survival function. Given a proper survival function, we have that
[TABLE]
while , therefore, accommodates both ZA and the cure-rate survival fraction. This model was presented by Louzada et al.[7] to describe time-to-default in bank loan portfolios. The sub-density function is given by
[TABLE]
where is a proper probability density function (pdf) associated with the individuals that are susceptible to the event of interest.
It is worth noting that (2) is necessary to achieve the standard mixture ZACR (3) model since the zero-adjusted standard distribution cannot be included directly in the unified cure rate model. Following Feller[16] and Rodrigues et al.[6], the probability generating function is used to achieve the standard cure rate model. Letting and , and substituting in , we have that which differ from (3).
Theorem 2.4**.**
The Promotion ZACR model is given by
[TABLE]
where is the cumulative distribution function of the baseline distribution of the random variable Y. The expression above is equivalent to
[TABLE]
where
[TABLE]
Proof.
It is easy to show that
[TABLE]
Recalling the equation
[TABLE]
By considering that N follows a Poisson with parameter , i.e., , then, if , where
[TABLE]
From (5) we have that
[TABLE]
∎
In addition to the models (3) and (4), it is possible to assume more flexible probability distributions for the number of competing causes, . Therefore, bellow, we present a more flexible particular case of the unified ZACR model, assuming a Negative Binomial (NB) distribution for the unobservable initial number of competing causes, . In this scenario, the probability mass function of is given by
[TABLE]
where , and . Since and , it is worth noting that positive values for correspond to an over-dispersion, while negative values correspond to an under-dispersion relative to the Poisson distribution. The BN distribution has a variety of particular cases: Bernoulli (), Poisson () and Geometric ().
The ZACR model with NB Causes, hereafter ZACR-NB model is given by
[TABLE]
where and . Note that, if , then , the equation (7) reduces to , i.e., the model proposed by Rodrigues et al.[6].
In terms of mixture distribution the ZACR-NB can be written as
[TABLE]
where
[TABLE]
where and , i.e. (9) is a proper survival function. The density function for the non-cured population without ZA is given by
[TABLE]
From given in (7) the density function of ZACR-NB model is given by
[TABLE]
When and , the survival presented on (8) reduces to the standard mixture ZACR and promotion ZACR models, respectively. Additionally, when , we obtain the ZACR model with Geometrically distributed causes (ZACR-Geo).
2.2 Estimation
In this section, we present the details about the maximum likelihood estimators (MLE) for the parameters of the survival model (7) under censored data. Suppose that and are the lifetime and censoring time, respectively, for the th individual. Thus, the data is given by the pairs, where , , and is the sample size. Then, assuming a random censoring process,the log-likelihood function related to the ZACR-NB is given by
[TABLE]
where and is a vector with parameters associated to . The corresponding score function is . The maximum likelihood (ML) estimation for the parameter vector can be implemented from the numerical maximization of the log-likelihood function (2.2).
To obtain the confidence intervals (CI) for the model parameters, it is reasonable to assume that the MLE are asymptotically distributed with normal joint distribution given by
[TABLE]
where is the Fisher information matrix, , and
[TABLE]
As it is not trivial to obtain , we can consider the observed information matrix, Therefore, we can obtain the approximated CI for a specific parameter, , , assuming that the marginal distributions are given by .
3 Results
3.1 Simulation
We performed a Monte Carlo simulation study to assess the performance of the MLE and asymptotic CI for finite samples. Therefore, to measure the performance of point estimates we consider bias and root of mean square errors (RMSE), which are obtained as follows
[TABLE]
where is the number of simulated samples and is the estimate of in the th sample. In this scenario, the Bias and the RMSEs should be close to zero. To measure the performance of asymptotic CIs, we present the coverage probability (CP), which should be close to the nominal confidence level of 95%.
The samples were simulated assuming the competitive causes are i.i.d with NB distribution given in (6), with known: (standard mixture ZACR) and (promotion ZACR). Further, we assume that the unobservable baseline distribution follows a lognormal distribution where and are the location and scale parameters. The chosen values of the simulation parameters were for the standard mixture ZACR (3) and for the promotion ZACR (4). The mean proportion of right-censored rates are, respectively, 0.351 and 0.372. The maximum likelihood estimates were achieved by numerical optimization using the optim function available in the R software.
Tables 1 and 2 present the Bias, MSEs and CP for the obtained estimates for different samples sizes. The results indicate that both Bias and RMSE are closer to zero, and the empirical coverage probabilities are closer to the nominal coverage level as the sample size increases. Such results are expected if the underlying estimation scheme is working correctly to produce consistent and asymptotically normal estimates. The results were similar for other choices of .
3.2 Application: A Sub-Saharan African obstetric data
In this section, we present the results of applying the proposed model in a sub-Saharan African obstetric study, developed by WHO as part of the BOLD project [14]. Because this project aims to improve the quality of intrapartum care and to generate evidence-based tools, it is essential to consider all events involved in the process of health care management to ensure reliability. Concerning the intrapartum care and, notably, the time between hospital admission and vaginal birth, three different women groups can be observed: a proportion of women with fetal death at admission (representing the zero adjustments), a proportion who undergo to c-section (cure-rate), and the third group, which presents a normal progression, with vaginal delivery (observed labour times). The critical point is that for the women who arrive at the hospital already having a stillbirth, generally, the time is not registered, leading to the necessity to consider that the time is equal to zero (T=0). Usual survival models do not allow us to consider lifetimes equal to zero. Therefore, for the model proposed in Section 2.1, it is possible to account for this feature and consider the three women groups in the process of survival estimation concomitantly.
The present dataset contains labor times of pregnant women, selected according to clinical characteristics of interest. Figure 1 presents fitted survival for each model compared with Kaplan-Meier estimates and Table 3 presents the MLE, standard deviations and Akaike Criterion (AIC) for the main particular cases of the unified model: standard mixture ZACR model, promotion ZACR model, ZACR-NB and ZACR-Geo. To fit the ZACR-NB model, we assume that . As the baseline distribution, we choose the Log-Normal with location and scale parameters and , respectively. All the fitted models presented similar fitness. According to the Akaike Criterion (AIC) values, the ZACR-Geo presents the best fit to the data.
The estimates of zero-adjustment and cure-rate by considering the ZACR-Geo model are and 1.528%, respectively. Based on the survival estimates presented in Table 4, at admission 95.46% of women still have the possibility of vaginal delivery. This value decreases to 61.82% in 6 hours, 37.53% in 12 hours, and 26.16% in 18 hours. These values could support the management of the facilities to organize the care for a woman.
4 Discussion
In this paper, we present a unified approach for survival models, considering two essential features: zero-adjustment and cure rate. The main advantage of this methodology is that it guarantees great flexibility for modeling. Using the proposed unified ZACR model, a researcher can consider different probability distributions for the lifetime of susceptible individuals. Different distributions can also be considered for the competitive causes, associated with the occurrence of the event of interest. Moreover, our model generalizes other recent proposed models such as the unified cure-rate models [6], and the mixture and promotion ZACR models [7, 11]. The standard mixture cure model by Berkson and Gage[4] and the promotion cure model [5] are also particular cases of the proposed model proposed. In this sense, if the researcher wants to evaluate several models for his data, it is possible to choose a flexible probability distribution and, from there, infer about which particular case is most suitable for the data.
In the application section, we exemplify the use of the proposed model with a sub-Saharan African labor data, considering the log-normal distribution for the susceptible group. The results indicate that the model ZACR-Geo excels at others, showing that there is an advantage in modeling by considering more flexible models.It is also possible to infer that there are competitive causes related to the primary outcome (vaginal delivery), which may indicate different causes for medical decision-making during labor.We observed that about 5% of the pregnant women arrive at the hospital already presenting fetal death. So, we estimate that 95% of women can go through a vaginal birth with a live baby when they arrive at the hospital. After 12 hours of admission, for example, there remain 37% of women have not yet had a vaginal delivery. These results can be a useful tool for hospital managers to know the dynamics of entry and exit of pregnant women in hospitals.
In general, we have shown that our model is a useful tool for adjusting survival data in the presence of zeros, allowing the evaluation of different particular cases with great flexibility. It is essential to highlight that this model can be applied in several other practical situations that need to accommodate zero adjusted lifetimes. In this way, we believe that the model has a vast application potential beyond the labor example presented here.
Statements of ethical approval
The BOLD cohort obtained ethical approval from the following committees: World Health Organization Ethical Review Committee, Makerere University School of Health Sciences Research and Ethics Committee, Uganda, University of Ibadan/University College Hospital Ethics Committee, Federal Capital Territory Health Research Ethics Committee, Nigeria, and Ondo State Government Ministry of Health Research Ethics Review Committee, Nigeria.
Declaration of Competing Interest
No potential conflict of interest was reported by the author(s).
Acknowledgements
The dataset considered in this paper was obtained as one of the BOLD project stages, with the collaboration of researchers and health professionals. Researches and health professionals. Therefore, we acknowledge the contributions of the country leaders. We also would like to thank BOLD coordinators João Paulo Souza and Olufemi T. Oladapo.
Funding
The BOLD project was funded by the Bill & Melinda Gates Foundation, United States Agency for International Development, and the UNDP-UNFPA-UNICEF-WHO-World Bank Special Program of Research, Development, and Research Training in Human Reproduction (HRP). The researchers were partially supported by CNPq, FAPESP, CAPES of Brazil, and the Public Health Graduate Program from Ribeirão Preto Medical School, University of São Paulo, Brazil. Pedro L. Ramos acknowledges support from to the São Paulo State Research Foundation (FAPESP Proc. 2017/25971-0).
The reference list from the paper itself. Each links out to its DOI / PubMed record.
- 1[1] E. Z. Martinez, J. A. Achcar, Bayesian bivariate generalized lindley model for survival data with a cure fraction, Computer methods and programs in biomedicine 117 (2) (2014) 145–157.
- 2[2] E. Z. Martinez, J. A. Achcar, A. A. Jácome, J. S. Santos, Mixture and non-mixture cure fraction models based on the generalized modified weibull distribution with an application to gastric cancer data, Computer methods and programs in biomedicine 112 (3) (2013) 343–355.
- 3[3] J. Mazucheli, E. A. Coelho-Barros, J. A. Achcar, The exponentiated exponential mixture and non-mixture cure rate model in the presence of covariates, Computer methods and programs in biomedicine 112 (1) (2013) 114–124.
- 4[4] J. Berkson, R. P. Gage, Survival curve for cancer patients following treatment, Journal of the American Statistical Association 47 (259) (1952) 501–515.
- 5[5] M.-H. Chen, J. G. Ibrahim, D. Sinha, A new Bayesian model for survival data with a surviving fraction, Journal of the American Statistical Association 94 (447) (1999) 909–919.
- 6[6] J. Rodrigues, V. G. Cancho, M. de Castro, F. Louzada-Neto, On the unification of long-term survival models, Statistics & Probability Letters 79 (6) (2009) 753–759.
- 7[7] F. Louzada, F. F. Moreira, M. R. de Oliveira, A zero-inflated non default rate regression model for credit scoring data, Communications in Statistics-Theory and Methods 47 (12) (2018) 3002–3021.
- 8[8] T. A. Marko, B. J. Diessner, L. G. Spector, Prevalence of metastasis at diagnosis of osteosarcoma: an international comparison, Pediatric blood & cancer 63 (6) (2016) 1006–1011.