The interplay between thermal Rydberg gases and plasmas
Daniel Weller, James P. Shaffer, Tilman Pfau, Robert L\"ow, Harald, K\"ubler

TL;DR
This paper explores how plasma formation due to ionized Rydberg atoms causes optical bistability in thermal cesium gases, combining experiments and modeling to understand the underlying ionization and avalanche processes.
Contribution
It provides the first detailed experimental and numerical analysis linking plasma formation to optical bistability in thermal Rydberg gases, highlighting plasma effects as a limiting factor.
Findings
Plasma formation causes optical bistability in thermal Rydberg gases.
Measured plasma frequency confirms plasma's role in bistability.
Numerical model accurately reproduces experimental spectra.
Abstract
We investigate the phenomenon of bistability in a thermal gas of cesium atoms excited to Rydberg states. We present both measurements and a numerical model of the phenomena based on collisions. By directly measuring the plasma frequency, we show that the origin of the bistable behavior lies in the creation of a plasma formed by ionized Rydberg atoms. Recombination of ions and electrons manifests as fluorescence which allows us to characterize the plasma properties and study the transient dynamics of the hysteresis that occurs. We determine scaling parameters for the point of plasma formation, and verify our numerical model by comparing measured and simulated spectra. These measurements yield a detailed microscopic picture of ionization and avalanche processes occurring in thermal Rydberg gases. From this set of measurements, we conclude that plasma formation is a fundamental ingredient…
Click any figure to enlarge with its caption.
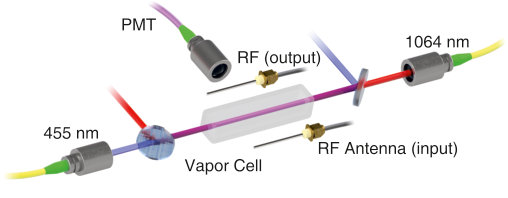 Figure 1
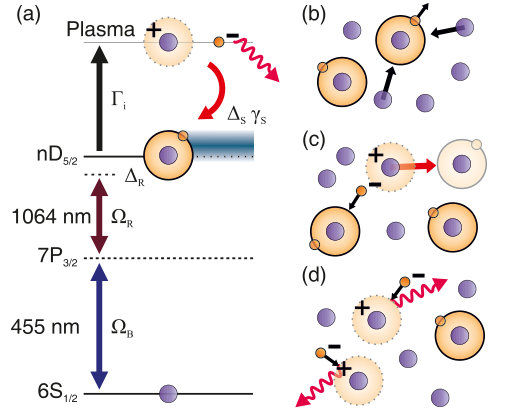 Figure 2
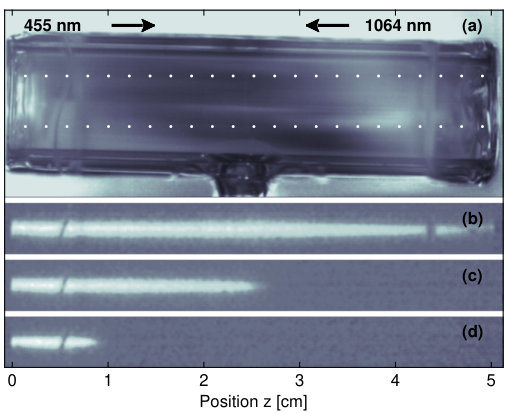 Figure 3
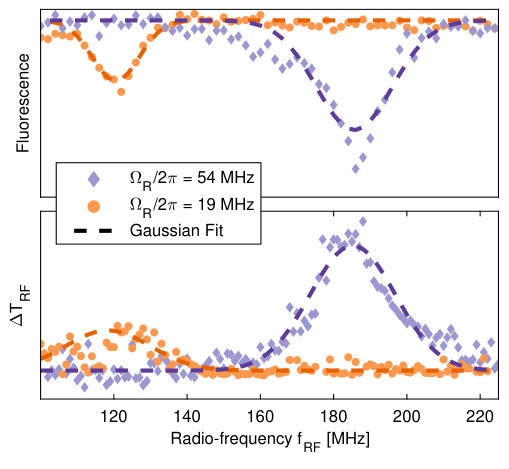 Figure 4
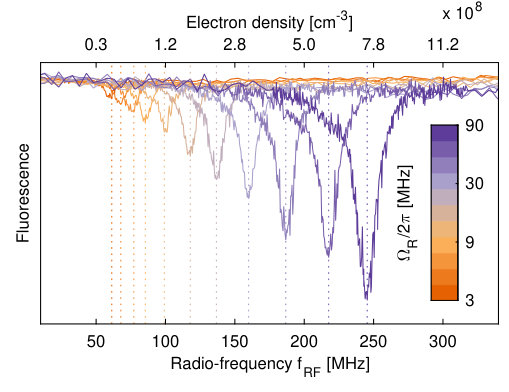 Figure 5
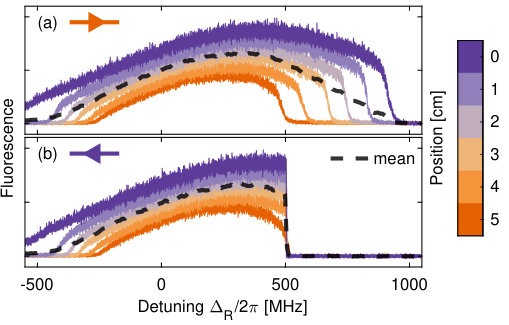 Figure 6
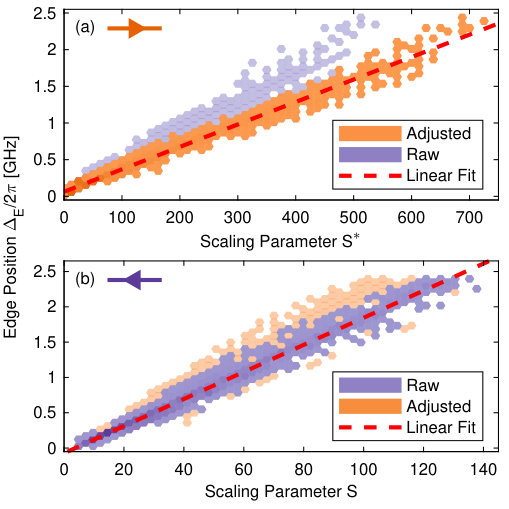 Figure 7
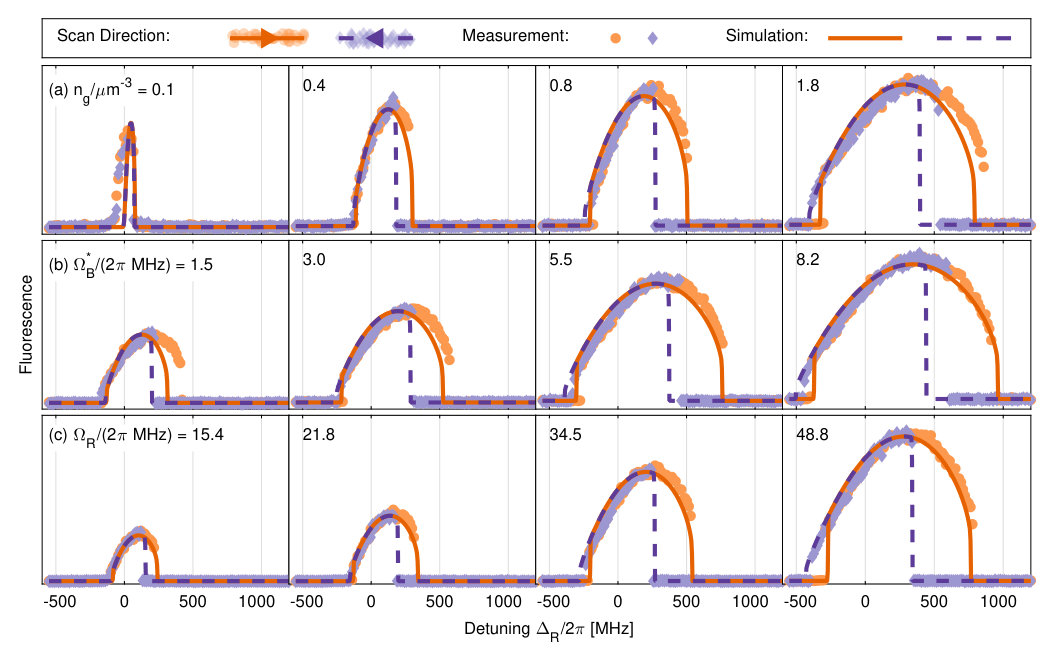 Figure 8
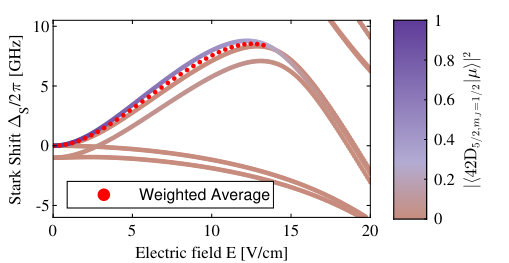 Figure 9
| (Scan) | () | () | () | |
|---|---|---|---|---|
Peer Reviews
No public reviews on file for this paper yet. If you reviewed it on a platform where reviews are public (OpenReview, ICLR, NeurIPS, ICML), you can paste yours below so the community can read it here.
Videos
No videos yet. Explain this paper in a talk, walkthrough, or lecture? Add one.
\newunit\dBm
dBm
The interplay between thermal Rydberg gases and plasmas
Daniel Weller
5. Physikalisches Institut and Center for Integrated Quantum Science and Technology, University of Stuttgart, Pfaffenwaldring 57, 70569 Stuttgart, Germany
James P. Shaffer
Quantum Valley Ideas Laboratories, 485 Wes Graham Way, Waterloo, ON N2L 0A7, Canada
Tilman Pfau
5. Physikalisches Institut and Center for Integrated Quantum Science and Technology, University of Stuttgart, Pfaffenwaldring 57, 70569 Stuttgart, Germany
Robert Löw
5. Physikalisches Institut and Center for Integrated Quantum Science and Technology, University of Stuttgart, Pfaffenwaldring 57, 70569 Stuttgart, Germany
Harald Kübler
http://www.pi5.uni-stuttgart.de 5. Physikalisches Institut and Center for Integrated Quantum Science and Technology, University of Stuttgart, Pfaffenwaldring 57, 70569 Stuttgart, Germany
(March 2, 2024)
Abstract
We investigate the phenomenon of bistability in a thermal gas of cesium atoms excited to Rydberg states. We present both measurements and a numerical model of the phenomena based on collisions. By directly measuring the plasma frequency, we show that the origin of the bistable behavior lies in the creation of a plasma formed by ionized Rydberg atoms. Recombination of ions and electrons manifests as fluorescence which allows us to characterize the plasma properties and study the transient dynamics of the hysteresis that occurs. We determine scaling parameters for the point of plasma formation, and verify our numerical model by comparing measured and simulated spectra. These measurements yield a detailed microscopic picture of ionization and avalanche processes occurring in thermal Rydberg gases. From this set of measurements, we conclude that plasma formation is a fundamental ingredient in the optical bistability taking place in thermal Rydberg gases and imposes a limit on usable Rydberg densities for many applications.
pacs:
42.65.Pc, 32.80.Rm, 34.50.Fa, 34.20.Cf
I Introduction
Highly excited atoms are well-known for their extraordinary properties, such as high sensitivity to electric fields and strong interactions between Rydberg atoms effective in the micrometer range. These properties can be fine-tuned by choosing different Rydberg states. The strong long-range interactions between Rydberg atoms has motivated studies of a variety of collective phenomena and applications with strongly correlated atomic clouds. Among some of the most prominent in the field of ultracold atoms are quantum gates (Saffman and Walker, 2005; Jones et al., 2007), quantum phase transitions (Löw et al., 2009; Schauß et al., 2014), optical non-linearities on the single photon level (Dudin and Kuzmich, 2012; Peyronel et al., 2012; Maxwell et al., 2013; Tiarks et al., 2014; Gorniaczyk et al., 2014), beyond two-body interactions (Faoro et al., 2015), excitation transfer (Günter et al., 2013; Barredo et al., 2015), aggregation of excitations (Schempp et al., 2014; Malossi et al., 2014; Urvoy et al., 2015) and ultralong-range molecules (Bendkowsky et al., 2009; Overstreet et al., 2009). The study of Rydberg atoms in thermal vapors enriches the spectrum of research topics as these vapors can provide much larger atom numbers and higher densities compared to ultracold gases. Besides this, the technical overhead for hot vapor spectroscopy is much smaller and it does not require preparation steps such as laser and evaporative cooling. The possibility to work at high bandwidths and fast timescales brings this technology closer to real world applications. Examples of these areas of focus are electric field and terahertz sensing (Sedlacek et al., 2013; Wade et al., 2018) and single photon sources (Ripka et al., 2018).
One of the topics that has generated interest in hot Rydberg atom physics is the phenomenon of optical bistabilities (Carr et al., 2013; Marcuzzi et al., 2014; Šibalić et al., 2016; de Melo et al., 2016; Ding et al., 2016; Weller et al., 2016). The mechanism that is responsible for the observation of bistability in Rydberg gases has been controversial as charged particles and long-range Rydberg atom interactions can, in principle, both lead to bistable behavior. In our previous publication (Weller et al., 2016) we presented experimental evidence that the underlying mechanism for the optical bistability is given by the presence of charges in the vapor. However, a minute picture remains to be worked out. In this article, we show that the appearance of optical bistability in a thermal Rydberg vapor is caused by a plasma that is formed due to inelastic, ionizing collisions between Rydberg atoms and ground state atoms which generate charged particles. The electrons produced by the ionization of the Rydberg atoms become an additional source for collisions with Rydberg atoms leading to even more charges in the system. Eventually, when sufficiently many Rydberg atoms are ionized, a steady state plasma is formed. We explore the relation between the Rydberg density, the plasma charge density and the plasma frequency by directly measuring the interaction of the plasma with a radio-frequency field. We introduce a model for the steady state of the system based on the excitation of Rydberg states and their subsequent ionization due to collisions. With this model we are able to determine two scaling parameter (one for each scan direction of the excitation lasers) such that the point of plasma formation is described by a simple linear function. The theoretical model is compared to experimental spectra and excellent agreement is found. We conclude that the underlying mechanism for the optical bistability in thermal Rydberg gases is dominated by the formation of a plasma, which acts back on the Rydberg excitation via the Stark effect.
The interplay between Rydberg density and the presence of a plasma has important implications on every thermal vapor cell experiment that involves Rydberg atoms when laser intensities are outside the weak probe regime. The presence of charged particles in the vapor alters the value of the electric dipole matrix elements of the atoms and allows for the admixture of dipole-forbidden transitions. This directly affects the pair-potentials of Rydberg-Rydberg interactions and therefore influences any blockade/anti-blockade physics as well as Rydberg dressing. As the electric field is not homogeneous but given by a distribution, the field gradients lead to shorter coherence times and time-varying interactions. Especially continuous beam experiments suffer from this limitation, but also pulsed experiments are imposed by an upper boundary with respect to the repetition rate and pulse duration. Understanding the microscopic mechanisms that are responsible for ion production and its corresponding electric field distribution in thermal Rydberg vapor is an important component for future experiments and applications.
The paper is organized in 6 sections. In Sec. II we describe the experimental setup and conditions under which we performed the measurements. We qualitatively describe the microscopic model that captures the underlying mechanisms responsible for the observed phenomenon of optical bistability in Sec. III. Section IV presents the data showing that a plasma is present in the thermal Rydberg gas. Based on collisional cross-sections and motional dephasing in an electric field distribution, we have developed a microscopic model which is detailed in Sec. V. We confirm our model by comparing measured and simulated data before concluding the manuscript with Sec. VI.
II Setup and Methods
Figure 1 shows the experimental setup for the investigation of the origin of the bistability and the analysis of the plasma. A vapor cell containing cesium is placed in the path of two counter propagating, collimated laser beams.
Each beam has a radius of . The vapor cell has a square cross-section with a side length of . The length in the direction along the beam is . The bulk of the cesium resides in a reservoir attached to a side arm of the vapor cell. The temperature of the reservoir is stabilized to control the vapor density inside the vapor cell. The main body of the vapor cell is held at a higher temperature to prevent alkali condensation on the windows. We determine the cesium atomic density for each measurement by recording and fitting the absorption profile of the cesium D2 spectrum. The densities used for the experiments are varied from to .
We excite Cs atoms to the Rydberg state ( and 42) via the inverted wavelength two-photon scheme depicted in Fig. 2(a). The first laser is a frequency-stabilized 455-nm laser – a frequency doubled diode laser – tuned to the cesium 6S 7P transition. Rabi frequencies, , used for the experiments range between and . The 455-nm laser is locked via dichroic atomic vapor spectroscopy Corwin et al. (1998) in a separate cesium vapor cell. The second laser – a fiber-amplified 1064-nm diode laser – is either scanned over the cesium 7P transition with a detuning (measurements with ), or locked on resonance (measurements with ), using another cesium vapor cell. Side-of-fringe locking (Fritschel et al., 1989) to the reference electromagnetically induced transparency (EIT) signal is used for this light field. Rabi frequencies, , are varied between and . The laser detuning scans are calibrated using a Fabry-Pérot interferometer with a free-spectral range of 1.5\text{,}\mathrm{G}\mathrm{H}\mathrm{z}$$ in combination with an EIT reference signal.
The fluorescence from the highly excited atoms was used to identify the formation of the plasma. Due to the high laser powers involved, measured changes in the transmission of either light field suffer from a large background signal. For this reason, we either measure the change in transmission of a radio-frequency field (frequency fRF ranging from ) through the vapor cell in the presence of Rydberg excitations and ions, or the change in fluorescence to obtain a signal. Long- and short-pass filters are placed in front of a photo-multiplier tube (PMT) with a bandwidth of so that the fluorescence light between transverse to the laser beam propagation direction can be collected. With this interval, we exclude the 455-nm laser light, and the strongly fluorescing decay via the D2 line at that can already occur with the 455-nm excitation on its own. The fluorescence is collected by an imaging system consisting of two lenses with focal lengths of 30\text{,}\mathrm{mm} and $f_{2}=$8\text{\,}\mathrm{mm}. The second lens focuses the light into a multi-mode fiber, core diameter. The fluorescence is imaged on to the fiber facet from within the excitation laser beam path, which is about in front of the first lens. The diameter of the spot from which photons are collected is approximately . Overall, we estimate that the collection efficiency is of the photons emitted into all directions from that spot.
For the transmission measurements of the radio-frequency fields, the RF field is coupled into the vapor cell with a -long dipole antenna that is oriented parallel to the laser beams. A second, identical antenna at the opposite side of the vapor cell picks up the signal. In some measurements, to appear later in the paper, we measure the atomic fluorescence as a surrogate for the microwave transmission measurements. We show that this proxy is a valid one. In order to improve the signal-to-noise ratio, we modulate the radio-frequency amplitude as well as the laser intensity and make use of lock-in amplification. We used two lock-in steps in combination with quadrature detection.
III Bistability Mechanism
In previous work on optical bistability in thermal vapor cells the authors assumed that mutual Rydberg atom interactions embody the mechanism. The effect of charges was not incorporated into the model used to explain the observed behavior (Carr et al., 2013; Šibalić et al., 2016; de Melo et al., 2016) The term optical bistability, in the context of Rydberg atoms and plasmas in thermal vapor cells, refers to the appearance of a hysteresis in the observed spectral response of the system when scanning one laser in a multi-photon excitation scheme across a Rydberg state resonance. The hysteresis arises due to the competition between a non-linear shift – in our case caused by a Stark shift due to surrounding charges – on the one side and decay of the excited state population on the other side.
Figure 3(a) shows a photograph of the vapor cell from the side. The beams travel horizontally through the cell. Given suitable combination of density, laser power and detuning; the lasers create a fluorescing ray (Fig. 3(b-d)). As the 1064-nm laser is scanned back and forth across the Rydberg resonance position, fluorescence suddenly appears to streak across the vapor cell for one scan direction, but then gradually retracts towards the entrance window of the blue laser beam until it completely vanishes for the opposite scan direction. The directionality of the phenomenon depends on the sign of the polarizability. This lightsaber-like phenomenon (Bowden, 2016) with a distinct transition between a light and a dark side along the beam (Fig. 3(b-d)) repeats for every cycle of the detuning scan, and is visible by eye. This is a visual manifestation of the optical bistability.
In this work, we modify the overall concept for the occurrence of the hysteresis as depicted in Fig. 2. As evidenced in (Weller et al., 2016), charges play an essential role in the optical bistability that takes place in dense thermal Rydberg gases. In fact, it is not Rydberg-Rydberg interactions that mediate the optical bistability, but the plasma of ions and electrons that are created at the Rydberg densities required to observe the effect. We show that in typical optical bistability experiments over a range of parameters where the phenomena can be observed, a weakly coupled plasma exists in the vapor. The sudden switching to the plasma state via an avalanche ionization process leads to the observation of the hysteresis that motivates the term optical bistability. Here, the term bistability is used in that sense that the system jumps from one metastable state to another via this avalanche dynamics (Letscher et al., 2017). We have identified two mechanisms that contribute to the ionization initiating the plasma formation. Rydberg atoms collide with ground state atoms (Fig. 2(b)), creating ions and free electrons. The electrons then collide with other Rydberg atoms (Fig. 2(c)), giving rise to a much higher ionization rate . This effect is commonly known as the avalanche process. (Vitrant et al., 1982; Killian et al., 1999; Robinson et al., 2000).
The plasma plays a fundamental role in the bistability observed in the thermal Rydberg gas. With charges present in the gas, the Rydberg energy level is shifted due to the Stark shift, . As thermal atoms move through an electric field distribution (Holtsmark, 1919), their energy levels rapidly change during the atom-light interaction causing a homogeneous broadening. Therefore, an additional dephasing of the Rydberg population needs to be taken into account which changes the excitation dynamics of the driven system. Plasma recombination gives rise to the distinct fluorescence spectrum (Agnew and Reichelt, 1968; Carr et al., 2013; Wade et al., 2018) which can be measured. The recombination events lead to a broad, discrete distribution of Rydberg principal quantum number states which then subsequently decay (Fig. 2(d)).
IV Plasma Characterization
We measured the change in transmission of a radio-frequency signal to show that a plasma exists in the gas. The results are shown in Fig. 4. The resonance position and its shift with the Rydberg density already suggests the presence of an (electron) plasma. The effect of the radio-frequency excitation would not occur in a neutral cesium gas at these frequencies. The data-set was taken for two different Rydberg excitation laser Rabi frequencies, , but otherwise identical configurations. Both lasers were locked on resonance and excite the atoms to the 30D5/2 state. The ground state cesium density was cm*-3* and the radio-frequency power delivered to the antenna was -15\text{,}\dBm$$.
A careful look at Fig. 4 appears puzzling at first glance since the radio-frequency field doesn’t appear in absorption but increased transmission. The enhanced coupling between the two antennas is justified by the increased electric susceptibility, , and the fact that the antennas are in the near-field of each other. Effectively, the distance between the antennas is being reduced by the free charges within the plasma.
Figure 4 additionally shows the change in fluorescence measured as a function of radio-frequency, . The overlap of the radio-frequency and fluorescence signals show that the fluorescence can be used as a surrogate for the radio-frequency transmission signal. Such a connection is important because the fluorescence signal is much larger than the radio-frequency transmission signal and therefore easier and much faster to measure. The change in fluorescence can be explained by considering how the radio-frequency field accelerates the free electrons into an oscillating motion with an amplitude depending on the frequency of the radio-frequency field. If the radio-frequency field is resonant with the plasma frequency, the amplitude of the electron oscillation is maximal and the motion effectively decreases the electron density within the laser beams. If the amplitude of the electrons exceeds the radial extent of the laser beams, the recombination probability in the center of the beam, where the ions are presumably located and most fluorescence is collected, decreases. The electrons can also collide with the walls of the vapor cell, further reducing the number of particles contributing to the fluorescence signal.
Figure 5 shows a typical series of measurements with varying Rydberg excitation laser intensity. As the Rabi frequency gradually increases, the plasma resonance clearly shifts its position and increases in amplitude. The shift in the plasma resonance enables us to extract the density of the electron plasma.
Given the relation between plasma frequency and the electron density ,
[TABLE]
the electron density can be calculated using the electron mass , the electronic charge , and the permittivity of free space . The axis ticks above Fig. 5 are computed with this formula, yielding an electron density on the order of . Note that the observed plasma resonance in Fig. 5 must be that of the electrons because a calculation of the ion density using these resonant frequencies gives densities that are 2 to 100 times larger than the peak cesium vapor density 3\text{\times}{10}^{12}\text{,}{\mathrm{cm}}^{-3}$$ we measured in the vapor cell.
Along with the plasma frequency, the Debye length,
[TABLE]
and the Coulomb coupling parameter,
[TABLE]
fully describe the plasma. Assuming a plasma temperature equal to the vapor temperature 370\text{,}\mathrm{K}, the Debye length is $\lambda_{\mathrm{D}}\sim$100\text{\,}\mathrm{\SIUnitSymbolMicro m} and the Coulomb coupling parameter is . is the Boltzmann constant. The plasma parameters indicate that the electron plasma is in the weakly coupled regime. The associated plasma parameter
[TABLE]
which is the number of electrons in a Debye sphere, is . The volume of the Debye sphere contains Cesium atoms. The plasma is weakly ionized and has properties comparable to the earth’s ionosphere Schunk and Nagy (2009).
Figure 6 shows a set of fluorescence signal data for both red to blue and blue to red 1064-nm laser scans at different fluorescence collection positions along the vapor cell. The fluorescence is associated with population in a large number of Rydberg states because of recombination. The fluorescence was dispersed with a spectrometer to verify that a broad distribution of Rydberg states were present. As evident from the plots, the system stays in the state with a high Rydberg density 111High Rydberg density implies high charge density when scanning from red towards blue detuned wavelengths, even for larger detunings, Fig. 6(a). The behavior of the curves in Fig. 6(a) is to be contrasted with that in Fig. 6(b) where a sharp transition occurs at the same 1064-nm laser detuning for all fluorescence collection points.
It is apparent that for larger distances from the 455-nm laser beam input window, corresponding to larger propagation distances of the blue light through the vapor cell, the overall strength of the fluorescence signal decreases. The decreasing 455-nm laser intensity affects the detuning at which the falling edge of the hysteresis occurs for red to blue detuning, Fig. 6(a). In contrast, the plots in Fig. 6(b) all feature the same sharp edge at approximately . The rising edge, Fig. 6(b), where the data is acquired for blue to red detuning, is unaffected by the varying 455-nm laser absorption along the length of the vapor cell. When the system is in the bistable part of the spectrum, but in the low Rydberg population state, the conditions for the ionization only need to be fulfilled at a single position along the laser beam. The avalanche ionization then quickly spreads across the whole cell. We estimate the timescale to be on the order of . Typically, the conditions for the avalanche ionization are fulfilled first where the maximum Rabi frequency exists, i.e., at the entrance window of the blue laser.
The prominent jump in the Rydberg population and associated change in fluorescence is referred to as the edge frequency. In the numerical evaluation of the data, we determine the edge frequency as the 1064-nm laser detuning value, , where the fluorescence signal exceeds of the maximum value in each trace, when tracing the data from the blue side. It is useful to look at to determine how the laser Rabi frequencies and density scale with its value in order to learn about the driven system dynamics.
The plasma and its role in bistability can be further analyzed by investigating the dependence on the laser Rabi frequencies and vapor density. To study the optical bistability the 1064-nm laser is scanned across the transition. We collected the fluorescent light as described in Sec. II. Since the system is bistable, both positive and negative scan directions are recorded and treated separately. We measured spectra for a wide range of experimental parameters, varying vapor density and both excitation laser Rabi frequencies, and . We focused on analyzing the transition to the plasma state as we sweep the 1064-nm laser detuning across the spectrum. We show that it is possible to combine the experimental parameters into 2 scaling parameters or , for the blue to red scan and red to blue, respectively. The scaling parameter and are defined as
[TABLE]
The two sets of exponents are chosen in such a way that the frequencies where the system jumps between high and low Rydberg excitation linearly scale with or . The asterisk denotes that the Rabi frequency is adjusted for absorption up to the position where the fluorescence measurement is made, see Appendix A. Previous experiments demonstrate that the frequency shift of the phase transition additionally scales with the forth power of the effective principal quantum number, (de Melo et al., 2016). This is consistent with our interpretation, because the geometric cross-section of Rydberg atoms for ionizing collisions also scales with .
The set of data points we acquired for the bistability edge position are plotted in Fig. 7. The plots cover over a range of , from , and within .
The values for the three scaling exponents are obtained by a non-linear least-squares fit to the data plotted in Fig. 7, for each scan direction. The results are given in Tab. 1. The fact that the values are different for and indicates that the dynamics are different for the two detuning cases as is expected for bistable behavior.
Interpreting the numerical values of the exponents for the scaling parameters reveals interesting properties of the bistable system. An intuitive picture based on rate equations can be developed, to explain the rough trend of the determined exponents, . The most important parameters are the density of Rydberg atoms and ions, and . The two steady state densities can be obtained by solving the coupled system of rate equations,
[TABLE]
The cross-sections for Rydberg-ground state collisions , Rydberg-electron collisions , and recombination of ions with electrons and mean relative velocity of the respective interacting species are parameters in these equations. Ions diffuse away at a rate . The effective rate at which atoms are excited to the Rydberg state is The decay of the Rydberg population results in an offset in the resulting equations, and does not play a role for the scaling behavior in the parameters of interest. Depending on whether the system approaches from the ground state side (0\text{,}{\mathrm{cm}}^{-3}) or the highly populated excited state side ($\mathcal{N}_{\mathrm{ion}},\mathcal{N}_{\mathrm{e}},\mathcal{N}_{\mathrm{Ryd}}\gg$0\text{\,}{\mathrm{cm}}^{-3}), different approximations for Eq. 6 can be applied. For the analysis of the scaling behavior in both of these two extremes in the following paragraphs, we assume the electron and ion density to be approximately the same, , both given by the parameter .
For blue to red detuning sweeps which are described by in Tab. 1 and Fig. 7(b), is approximately linear with respect to all 3 parameters, . In order for the system to jump to the plasma state, it is sufficient to trigger the threshold for the avalanche mechanism at a single point along the vapor cell. All traces in Fig. 6(b) feature a sharp edge at the same detuning value. It is important to understand that the Stark shift and associated spectral broadening due to the charge distribution does not play a role in this case.
The system starts from the ground state, so we can approximate the rate equations, Eq. 6, as
[TABLE]
Here, the pump rate to the Rydberg state is taken to be the effective two-photon Rabi frequency divided by the effective detuning , making this a non-resonant 2-photon coherent excitation. Without the plasma or a significant number of charges, the line width of the Rydberg transition corresponds to its natural width, and both lasers are above saturation. Hence, the Rabi frequencies contribute linearly to the pump rate. In steady state, the charge density from Eq. 7 is given by
[TABLE]
which reflects the measured linear scaling in all three parameters.
For the opposite scan direction, scaling parameter in Tab. 1 and Fig. 7(a), the dominant terms in Eq. 6 are
[TABLE]
With the plasma present, the Rydberg transition is massively broadened by the varying Stark shifts and the 1064-nm laser intensity is effectively below the saturation intensity. As a result, the Rydberg population depends quadratically on . The 455-nm laser transition remains saturated. The intermediate population is proportional to the Rabi frequency divided by the Doppler width , reflecting the fact that more velocity classes contribute to the Rydberg population because of the increasing power broadening. Solving Eq. 9 for the steady state charge density gives
[TABLE]
which is in agreement with the experimentally obtained scaling shown in Tab. 1.
It is important to note that most of the measurements were not performed in one of the extreme cases mentioned here. Therefore a detailed numerical model is developed in the next section.
V Microscopic Model
To calculate the state populations and coherences of an ensemble of thermal atoms excited by laser beams, we find the steady state solution to the Lindblad master equation
[TABLE]
for all possible velocities, for a given set of experimental parameters; i.e., a given set of density, laser detuning and Rabi frequencies. The Rydberg state population, for example, is obtained by averaging over the ensemble weighted by the Boltzmann probability distribution describing the atomic velocities, and the electric field distribution which causes an additional detuning of the Rydberg state due to the Stark shift. Analogous to Doppler averaging, we integrate over the combined probabilities of the electric field and velocity to obtain the observable quantities from the density matrix. Our model of the atomic system is depicted in Fig. 2(a-d).
Applying the density matrix formalism, we describe the thermal gas interacting with the lasers as a conventional 3 + 1 level system. The lower 3 levels describe the neutral gas including its excitation to the Rydberg state. The additional level (+1) describes the generation of ions (Fig. 2(a)) which gives rise to the plasma. Details of the density matrix, Hamiltonian and the Lindblad operator, can be found in the Appendix B.
We have identified two mechanisms responsible for the ionization of the Rydberg atoms. The ionization rate, which depends on the ion population , is given by
[TABLE]
where is the cesium mass. and are the ionization cross-sections for Rydberg atoms colliding with ground-state atoms (Fig. 2(b)) or electrons (Fig. 2(c)), respectively. Since the ground-state density is not significantly influenced by the excitations, we take in our model. We assume values for to be on the order of (Vitrant et al., 1982), with being the geometric cross-section of the Rydberg state with effective principal quantum number . For – to our knowledge – there is no literature reference for cesium. However, according to experiments with sodium Rydberg states (Nagesha and MacAdam, 2003) a reasonable range for this parameter would be . We neglect that the electron impact ionization cross-section depends on the velocity of the electron (Vrinceanu, 2005).
In a similar fashion, the rate
[TABLE]
quantifies the mechanisms leading to losses in the charged particle population. The most obvious contribution is charges simply leaving the interaction volume due to their thermal motion which is described by . The second term describes recombination of ions with electrons into neutral particles. The transit time losses, , are determined by the diameter of the excitation volume and the velocity of the particles. The measured fluorescence rate can be used to estimate the actual recombination rate, and therefore to determine the recombination cross-section . The expected value for can be estimated in semiclassical treatment with Kramer’s formula (Kramers, 1923), which gives a value of 1\text{\times}{10}^{-5}\text{\,}$\sigma_{\mathrm{geo}}$. However, for the densities shown in the dataset in Fig. [8](#S5.F8), the approximations in Eq. [7](#S4.E7) are not completely valid, and therefore the transit time losses of the ions, $\Gamma_{\mathrm{t}}$ still play a non-negligible role. For even higher charge densities, the neighboring 42D*3/2* is shifted more than the spacing of $2\pi\times$1\text{\,}\mathrm{GHz}, and starts to overlap with the spectrum of the 42D5/2 state. Hence, we focused on the parameter space where the two states are still separated. As the distinction between a linear and quadratic component – such as in in Eq. 7 – is not feasible in the vicinity of the origin of the plot, c.f. Fig. 7, we reduce the complexity of the model by the following substitution. We replace the recombination term in Eq. 13 with
[TABLE]
and thereby assume to be an effective ion-loss rate, with a constant value independent of the ion density. We also suppose ions to leave the beam geometry at the same rate as Rydberg atoms. Our estimation of the respective rates can be found in Appendix C.
The electric field due to the present charges rapidly varies as the atoms move through the plasma. A distribution of detunings needs to be considered because each atom sees a different sequence of local electric fields, resulting in different accumulated phase shifts. The random distribution of phase shifts can be treated as an effective shift and homogeneous broadening due to dephasing of the Rydberg transition. In our model, we define the overall dephasing factor as
[TABLE]
1\text{,}\mathrm{MHz}$$ accounts for the laser line width. The effect of the Stark shift distribution is approximated to be proportional to its weighted mean
[TABLE]
The details of the electric field distribution are found in the Appendix D.
The fluorescence spectrum is proportional to the square of the charge density, , because of two-body recombination of ions and electrons, and the before mentioned assumption of . This process leads to the broad, discrete distribution of Rydberg states which then subsequently emit the fluorescence via their decay. In order to obtain a spectrum to compare to our data, the solution of Eq. 11 for the ion state population of the ensemble of atoms in the vapor cell needs to be calculated. The analytic expressions for the velocity distribution and Stark shift distribution has to be used to average the density matrix elements. The value for a density matrix element for a single laser detuning and charge density is the average of the density matrix element obtained using the respective probability distribution functions for the Stark shifts and the atomic velocities,
[TABLE]
(Maxwell, 1860) is the one dimensional Maxwellian distribution function for the velocity, , in the beam direction and is the electric field distribution as given in Eq. 23. In order to obtain an equilibrium solution for the charge density, we make use of an iterative method as described in the Appendix E.
We fit the theory to the spectra found in Fig. 8. The parameters that were fit are shown in Tab. 2. We have refined their values via non-linear least-squares optimization using the Levenberg-Marquardt method (Levenberg, 1944; Marquardt, 1963).
The data covered a wide range of different experimental parameters as shown in Fig. 8. We excluded the values close to the plasma formation edge , for the dashed traces. The steep waveform has a disproportionate contribution to the overall error measure, and the point of plasma formation is prone to additional uncertainties, such as fluctuations in charge density due to the cell walls which can trigger the formation of the plasma state. Furthermore, as previously shown in Fig. 7, the edge frequency for the plasma formation point depends on the raw Rabi frequency, while the line shape of the system is defined by the adjusted Rabi frequency.
The results of the fits shown in Tab. 2 demonstrate that our assumptions are sound, as all the fit values are close to the expected values. Perhaps most significantly, indicates that our approximation of the line broadening due to the Stark shifts of the plasma is in good agreement with the proposed mechanism. Likewise, is consistent with our estimates using the photon emission rate suggesting that our modelling of the recombination rate is consistent with the experimental observations. The cross-section , which accounts for the finite ionization efficiency of Rydberg-ground state collisions as compared to the geometric cross-section , is in agreement with prior experiments (Vitrant et al., 1982), and similar to the very crude estimate in (Weller et al., 2016), . The ionization cross-section of the electron-Rydberg collisions, , also yields a reasonable value. The coulombic interaction in conjunction with the large polarizability of the Rydberg atom gives an expected cross-section that that is larger than the geometric cross-section (Nagesha and MacAdam, 2003; Deutsch et al., 2005). Calculating cross-sections for the electron-impact ionization of Rydberg states is beyond the scope of this manuscript, but in Tab. 2 is consistent since it is slightly larger than . Overall, the values that were fit to get best agreement with the spectra are consistent with expected results. From the overall agreement, we conclude that the model is consistent with the spectra.
Figure 8 shows the bistable fluorescence spectra, as captured by the PMT when scanning the 1064-nm laser across the Rydberg resonance line. Because the underlying mechanism is interactions between charged particles and Rydberg atoms, the peak is shifted towards blue detuning as the charge density increases; i.e., more atoms, or higher Rydberg fraction. The shift direction is in agreement with the negative sign of the polarizability one obtains for the state Šibalić et al. (2017). An increase in fluorescence amplitude is also observed as the ground state density, and consequently the Rydberg density, increases.
The measurements in Fig. 8 are overlaid with the results from the model, adjusted only for amplitude. The solid and dashed lines correspond to positive, red to blue, and negative, blue to red, scan directions, respectively. We achieve excellent agreement between the calculations and the measurements as demonstrated by the low residuals shown in the figure. The spectral broadening and line shape are described well and the hysteresis feature is correctly reproduced for both red and blue 1064-nm detuning sweeps.
For certain settings a second hysteresis feature on the seemingly wrong side of the spectrum appears, which has also previously been observed (Ding et al., 2016; Weller et al., 2016), but is straightforward to explain. For a blue shifting interaction, one expects an effect on the blue detuned side of the resonance. If the spectral broadening is larger than the shift caused by the Stark effect, the far-detuned features of the resonance can extend beyond the resonance position, and influence the spectrum on the red detuned side of the overall resonance feature. The Stark map of the 42D5/2 state, Fig. 9, features a red shifting branch, and also the 42D3/2 state is in close proximity. However, both these aspects are neglected in the modeled traces, but the feature is still reproduced correctly.
Despite the overall excellent agreement between the model and experiment, something can be learned from the regions where the deviations are maximum. For one, the plasma formation point is not always precisely predicted by the simulation for the larger scaling parameters, but the jump occurs earlier than expected. We attribute the deviation to the fact that when the system is in the bistable regime, minor disturbances, e.g., laser fluctuations or random charges produced by the photoelectric effect on the vapor cell walls, can cause the system to jump to the plasma state before reaching a detuning where the jump would take place in the absence of perturbation. Once the system is in the high population state, it will stay there, even if the average parameter values would not support the jump to the plasma state at this point.
VI Conclusion
We have shown measurements and a comprehensive numerical model that describes optical bistability in a thermal Rydberg gas. We showed that plasma formation is the key ingredient in the phenomena of optical bistability in thermal Rydberg gases. By measuring radio-frequency transmission spectra we established that a plasma exists in the gas. We characterized the plasma by direct measurement of the plasma frequency as weakly ionized. Measuring the fluorescence at and its dependence on detuning and 1064-nm laser sweep direction allows us to determine the plasma formation point. We combined all experimental parameters into scaling parameters and , such that the plasma formation point scales linearly with these parameters. The excitation dynamics were characterized using the results. Measuring the fluorescence at different positions along the cell demonstrates the role of absorption of the 455-nm laser. We observed a lightsaber-like fluorescing beam that extends only along a part of the cell length, because the necessary conditions for the ionization avalanche can only be sustained when the laser is strong enough. The fluorescence spectrum shows a broad range of Rydberg states consistent with recombination from the plasma continuum. We developed a numerical model based on collisional cross-sections and motional dephasing in an electric field distribution due to the presence of the plasma, that fits the spectral data extremely well confirming our microscopic model. The physical parameters obtained from fits to the spectral data are in excellent agreement with expectations. We conclude that plasma formation is the fundamental ingredient in optical bistability in thermal Rydberg gases.
Acknowledgements.
The authors acknowledge contributions from N. Sieber in an early stage of the experiment. We thank S. Weber for stimulating discussions. J.P.S thanks the AFOSR (Grant No. FA9550-12-1-0282) and NSF (Grant No. PHY-1104424) for support.
Appendix A Adjusted Rabi frequencies
The laser beams are being absorbed while propagating through the atomic medium. Therefore, the Rabi frequency in general is a function of the position , , c.f., Fig. 3. In our experiment, the 1064-nm laser intensity is not considerably affected by absorption along the cell. The blue 455-nm laser beam however is strongly absorbed, since it couples the highly populated ground state to the intermediate state. As the local varies along the length of the vapor cell, the excitation and ionization conditions vary. The spectrum one obtains by measuring the fluorescence therefore depends on the spatial position at which the fluorescence is collected. As a consequence, one needs to adjust according to the position where the measurement is made, which is indicated by . We numerically propagate the intensity through a thermal ensemble of the respective density to determine , following the derivation in (Siddons, 2014).
Appendix B Lindblad Master Equation
The density matrix is given by
[TABLE]
where the states are coupled by the two lasers according to the Hamiltonian
[TABLE]
with Rabi frequencies and and the reduced Planck constant . The detunings are and with wave vectors , and atom velocity . The detuning includes the laser detuning , and the detuning resulting from the Doppler effect. The 455-nm laser is assumed to be tuned to resonance. Figure 2(a) shows the relevant near-resonant atomic levels. In the case of the Rydberg state, the additional term represents the Stark shift due to nearby charges, Fig. 2(c). The ground state and intermediate state Stark shifts are negligible.
The Lindblad operator, accounts for dephasing, decay and ionization mechanisms. First, , the intermediate state decoherence and decay, which is dominated by its natural lifetime 1.18\text{,}\mathrm{MHz}$$ (Schmieder et al., 1970), gives the contribution
[TABLE]
Second, takes into account ionization and recombination,
[TABLE]
The ionization rates are given by while the loss of charged particles due to recombination and motion out of the interaction region are represented by .
The interaction between the Rydberg atoms and the plasma is the last part of and is modeled as
[TABLE]
The rate includes the natural lifetime of the Rydberg state and transit time effects. The dominating part here clearly is the transit time decay , therefore we estimate 0.2\text{,}\mathrm{MHz}$$ for the beam sizes used in the experiments. The dephasing factor accounts for the line broadening mechanisms.
Appendix C Recombination Rate and Transit Time Loss Rate Estimation
Given the experimental parameters, one can estimate the photon flux emitted by plasma recombination. Here we show the quantitative analysis for the experimental parameters as well as measured and simulated values from the dataset in Fig. 8. The atomic densities cover a range from to .
The PMT has a sensitivity of and yields a signal height of 0.1 to . Given the collection efficiency of the lens system capturing the fluorescence, this corresponds to an emitted power of approximately 70 to , or a photon flux of to , when assuming only photons of wavelength. The simulation for these configurations, c.f. Sec. V, peaks at a plasma population between and . A sphere with a diameter of – approximately the volume we collect photons from – therefore contains to ions. Multiplied with the de-ionization rate reduced by transit time (this gives the fluorescence photon emission rate), we end up with a total number of to , which is in excellent agreement with the measured photon flux. The simulated Rydberg population ranges between and , which is around Rydberg excitations per 1.5-mm sphere.
With regard to the transit time losses, we estimate 0.2\text{,}\mathrm{MHz}$$ for the given beam sizes. By multiplying the rate with the ion numbers per 1.5-mm sphere from above, we obtain values for the transit time ion loss between and , roughly the same range as the photon flux.
Appendix D Electric field distribution
The interesting part of the fluorescence spectrum for the Rydberg state occurs on the blue detuned side of the Rydberg resonance, where the plasma suddenly forms. A Stark map for the Rydberg state, calculated using (Weber et al., 2017), is shown in Fig. 9. The particular state has 3 sub-levels and splits up into two branches. The dominant branch has a negative polarizability, and consists of and . The second branch, , evokes a red detuning Stark shift. Since the electric field caused by randomly positioned charges has no preferred direction, we integrate over all angles with respect to the laser polarization axis. The dominant contribution to the Stark shift for each electric field strength is then obtained via the angular integral, weighted by the respective overlap with the (unperturbed) 42D5/2, state. Since both positive and negative branches are well separated for most of the electric field strengths, we only consider the blue-shifting branch for our calculations.
The electric field distribution is modeled by randomly positioned point charges which depends on the charge density . The distribution, , is described by the Holtsmark probability distribution function (Holtsmark, 1919)
[TABLE]
where the normal field is given by
[TABLE]
and
[TABLE]
The electric field strengths are converted into Rydberg energy level shifts via the angular average of the Stark map for the Rydberg state, as calculated in the previous paragraph. We used only the ion density for the electric field distribution calculations. The electrons move much faster than ions, and the energy shifts due to their electric fields averages out on a timescale that is shorter than the atomic dynamics.
Appendix E Iterative Equilibrium
For a given initial charge density, , , atomic density, temperature and Stark shift distribution, a steady state solution of the master equation is obtained that yields a charge density
[TABLE]
The calculated charge density is used for a subsequent calculation. The equations are solved iteratively using the previous calculation of the charge density as an input parameter for subsequent computation steps until the system converges to an equilibrium solution. A flow-chart summarizing this algorithm is shown in Fig. 10.
The reference list from the paper itself. Each links out to its DOI / PubMed record.
- 1Saffman and Walker (2005) M. Saffman and T. G. Walker, Physical Review A 72 , 022347 (2005).
- 2Jones et al. (2007) M. P. A. Jones, J. Beugnon, A. Gaëtan, J. Zhang, G. Messin, A. Browaeys, and P. Grangier, Physical Review A 75 , 040301 (2007).
- 3Löw et al. (2009) R. Löw, H. Weimer, U. Krohn, R. Heidemann, V. Bendkowsky, B. Butscher, H. P. Büchler, and T. Pfau, Phys. Rev. A 80 , 033422 (2009).
- 4Schauß et al. (2014) P. Schauß, J. Zeiher, T. Fukuhara, S. Hild, M. Cheneau, T. Macrì, T. Pohl, I. Bloch, and C. Gross, ar Xiv preprint ar Xiv:1404.0980 (2014).
- 5Dudin and Kuzmich (2012) Y. Dudin and A. Kuzmich, Science 336 , 887 (2012).
- 6Peyronel et al. (2012) T. Peyronel, O. Firstenberg, Q.-Y. Liang, S. Hofferberth, A. V. Gorshkov, T. Pohl, M. D. Lukin, and V. Vuletić, Nature 488 , 57 (2012).
- 7Maxwell et al. (2013) D. Maxwell, D. J. Szwer, D. Paredes-Barato, H. Busche, J. D. Pritchard, A. Gauguet, K. J. Weatherill, M. P. A. Jones, and C. S. Adams, Phys. Rev. Lett. 110 , 103001 (2013).
- 8Tiarks et al. (2014) D. Tiarks, S. Baur, K. Schneider, S. Dürr, and G. Rempe, Phys. Rev. Lett. 113 , 053602 (2014).