Transient Hot Electron Dynamics in Single-Layer TaS$_2$
Federico Andreatta, Habib Rostami, Antonija Grubi\v{s}i\'c \v{C}abo,, Marco Bianchi, Charlotte E. Sanders, Deepnarayan Biswas, Cephise Cacho,, Alfred J. H. Jones, Richard T. Chapman, Emma Springate, Phil D. C. King, Jill, A. Miwa, Alexander Balatsky, S{\o}ren Ulstrup

TL;DR
This study investigates how femtosecond laser pulses induce transient electronic and band structure changes in single-layer TaS$_2$, revealing temperature-induced shifts and screening effects through photoemission spectroscopy and modeling.
Contribution
It provides a detailed analysis of ultrafast electronic dynamics and band shifts in single-layer TaS$_2$ using time- and angle-resolved photoemission spectroscopy combined with semi-empirical modeling.
Findings
Valence band shifts up to 150 meV after excitation
Electronic temperatures exceed 3000 K
Chemical potential shift dominates the electronic response
Abstract
Using time- and angle-resolved photoemission spectroscopy, we study the response of metallic single layer TaS in the 1H structural modification to the generation of excited carriers by a femtosecond laser pulse. A complex interplay of band structure modifications and electronic temperature increase is observed and analyzed by direct fits of model spectral functions to the two-dimensional (energy and -dependent) photoemission data. Upon excitation, the partially occupied valence band is found to shift to higher binding energies by up to 150 meV, accompanied by electronic temperatures exceeding 3000~K. These observations are explained by a combination of temperature-induced shifts of the chemical potential, as well as temperature-induced changes in static screening. Both contributions are evaluated in a semi-empirical tight-binding model. The shift resulting from a change in the…
Click any figure to enlarge with its caption.
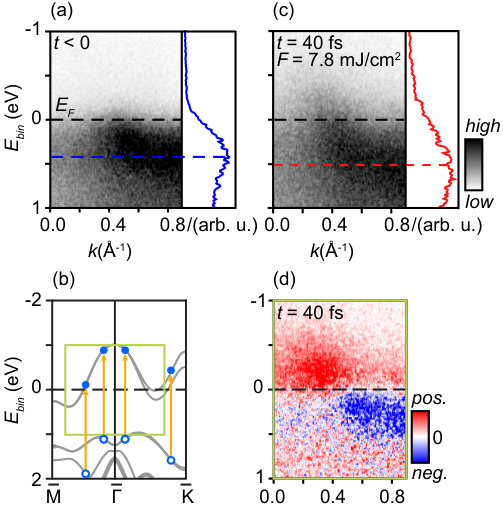 Figure 1
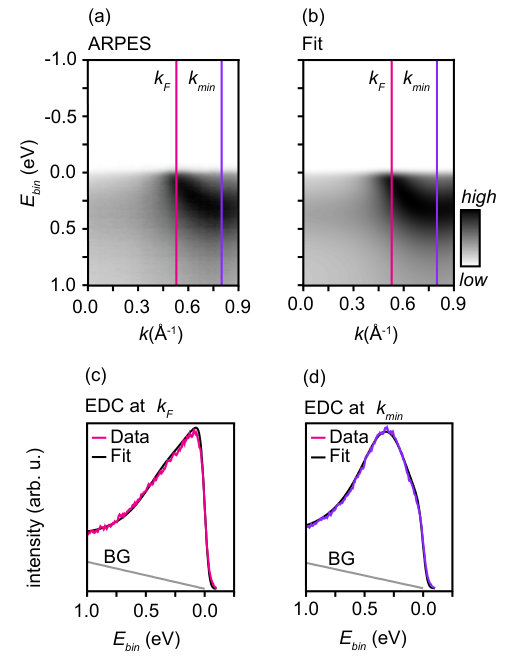 Figure 2
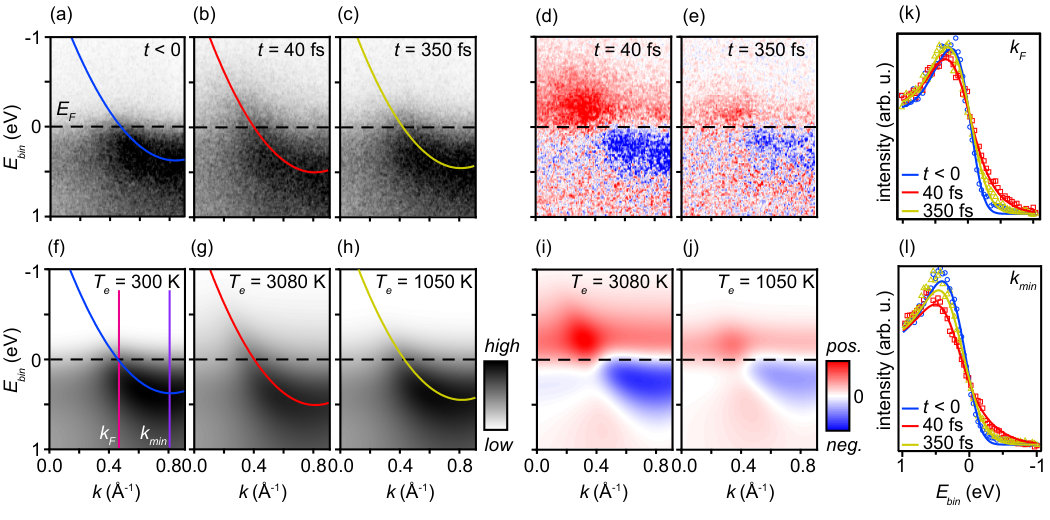 Figure 3
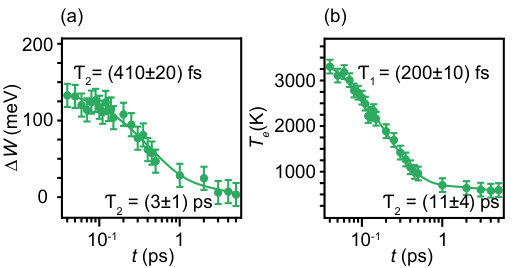 Figure 4
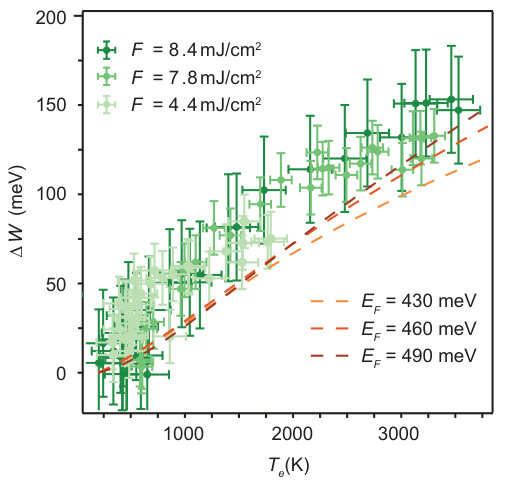 Figure 5
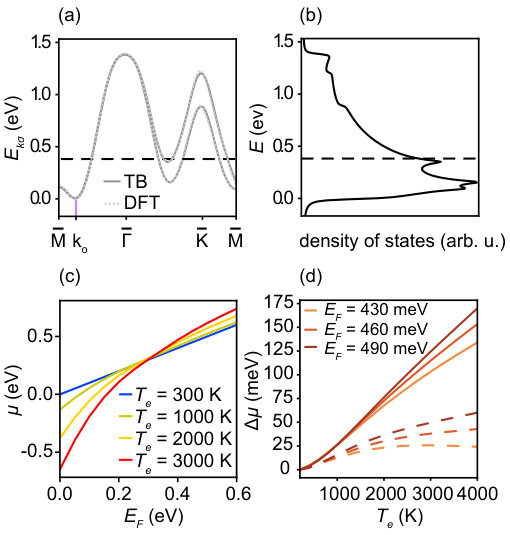 Figure 6
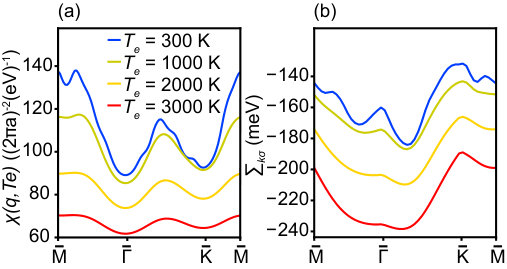 Figure 7
Peer Reviews
No public reviews on file for this paper yet. If you reviewed it on a platform where reviews are public (OpenReview, ICLR, NeurIPS, ICML), you can paste yours below so the community can read it here.
Videos
No videos yet. Explain this paper in a talk, walkthrough, or lecture? Add one.
Transient Hot Electron Dynamics in Single-Layer TaS2
Federico Andreatta
Contributed equally
Department of Physics and Astronomy, Interdisciplinary Nanoscience Center, Aarhus University, 8000 Aarhus C, Denmark
Habib Rostami
Contributed equally
Nordita, 106 91 Stockholm, Sweden
Antonija Grubišić Čabo
Marco Bianchi
Department of Physics and Astronomy, Interdisciplinary Nanoscience Center, Aarhus University, 8000 Aarhus C, Denmark
Charlotte E. Sanders
Central Laser Facility, STFC Rutherford Appleton Laboratory, Harwell, United Kingdom
Deepnarayan Biswas
SUPA, School of Physics and Astronomy, University of St. Andrews, St. Andrews, United Kingdom
Cephise Cacho
Alfred J. H. Jones
Richard T. Chapman
Emma Springate
Central Laser Facility, STFC Rutherford Appleton Laboratory, Harwell, United Kingdom
Phil D. C. King
SUPA, School of Physics and Astronomy, University of St. Andrews, St. Andrews, United Kingdom
Jill A. Miwa
Department of Physics and Astronomy, Interdisciplinary Nanoscience Center, Aarhus University, 8000 Aarhus C, Denmark
Alexander Balatsky
Nordita, 106 91 Stockholm, Sweden
Institute for Materials Science, Los Alamos National Laboratory, Los Alamos, New Mexico 87545, USA
Søren Ulstrup
Department of Physics and Astronomy, Interdisciplinary Nanoscience Center, Aarhus University, 8000 Aarhus C, Denmark
Philip Hofmann
Department of Physics and Astronomy, Interdisciplinary Nanoscience Center, Aarhus University, 8000 Aarhus C, Denmark
Abstract
Using time- and angle-resolved photoemission spectroscopy, we study the response of metallic single layer TaS2 in the 1H structural modification to the generation of excited carriers by a femtosecond laser pulse. A complex interplay of band structure modifications and electronic temperature increase is observed and analyzed by direct fits of model spectral functions to the two-dimensional (energy and -dependent) photoemission data. Upon excitation, the partially occupied valence band is found to shift to higher binding energies by up to 150 meV, accompanied by electronic temperatures exceeding 3000 K. These observations are explained by a combination of temperature-induced shifts of the chemical potential, as well as temperature-induced changes in static screening. Both contributions are evaluated in a semi-empirical tight-binding model. The shift resulting from a change in the chemical potential is found to be dominant.
I Introduction
Two-dimensional (2D) electron systems can be dramatically altered and driven into a number of distinct phases by the application of external fields. A prime example of this is the ability to change the electron-electron interaction by electric field control of the charge carrier density in 2D electron gasses (2DEGs) confined in high electron mobility transistors Smith and Stiles (1972); Shashkin et al. (2003). Tuning such systems into extreme conditions can create an electronic instability such as a metal-insulator transition Pudalov et al. (2002) or lead to the emergence of superconductivity Wan et al. (2015). Even when merely doped by using different substrates or adsorbates, Fermi level shifts on the order of electron volts can be induced in semimetallic 2D materials such as graphene Bostwick et al. (2007); Pletikosic et al. (2009); Larciprete et al. (2012); Ulstrup et al. (2014a), providing access to the dependence of the electronic self-energy on the electron/hole density over a wide energy range Ulstrup et al. (2016a). In principle, the electronic self-energy also depends on the temperature but such effects are usually negligible because at reachable temperatures tends to be much smaller than the electronic bandwidth Giuliani and Vignale (2008); Zhang and Das Sarma (2004). The emergence of interesting physics therefore requires narrow electronic bandwidths or high electronic temperatures. These conditions are ideally reached in 2D systems where non-trivial temperature effects are expected to influence density-dependent many-body effects Coleridge et al. (1996); Shin et al. (1998).
By employing an intense optical excitation in a pump-probe scheme such as time- and angle-resolved photoemission (TR-ARPES) to drive (semi) metallic 2D materials out of equilibrium, an extremely wide range of transient electronic temperatures can be accessed Johannsen et al. (2013). This approach is effective for studying instabilities in the electronic system under extreme conditions and on ultrafast time scales where transient charge order effects and metal-insulator transitions may completely alter the electronic spectrum around the Fermi energy as observed in metallic transition metal dichalcogenides (TMDCs) Perfetti et al. (2006); Petersen et al. (2011); Rohwer et al. (2011); Hellmann et al. (2012); Monney et al. (2016).
Here we probe the electronic response of a metallic 2D TMDC, single layer (SL) TaS2 of the 1H polymorph, to the excitation of electrons by a femtosecond laser pulse with a photon energy of 2.05 eV using TR-ARPES. We observe that this leads to a strongly excited thermal distribution of the electrons within the time resolution of our experiment, with electronic temperatures exceeding 3000 K. Interestingly, the elevated electronic temperature is accompanied by a binding energy shift of the band structure of up to 100 meV. Such a change of the electronic structure is not necessarily expected for a 2D metal. While dynamic band structure renormalization is not uncommon in 2D semiconductors due to the strongly enhanced screening by degenerate transient doping Steinhoff et al. (2014); Chernikov et al. (2015); Ulstrup et al. (2016b), and complex band shifts have even been observed for bulk insulators Mor et al. (2017), such effects are absent in semimetallic systems such as graphene Johannsen et al. (2013) or bilayer graphene Ulstrup et al. (2014b).
This paper is structured as follows: this Introduction section is followed by an Experimental section that provides the details of the sample preparation, static ARPES, and TR-ARPES. The Results and Discussion section is divided into five subsections that give (i) a presentation of the experimental results, (ii) a description of an approach to fit the full -dependence of the measured photoemission intensity, (iii) a presentation of the band shifts and electronic temperatures resulting from our analysis, (iv) a theoretical description of the expected band shifts in the single particle picture, and (v) a section accounting for the effect of temperature-dependent screening. Finally, the main results and their implications are summarized in a Conclusions section.
II Experimental
SL TaS2 was grown on bilayer graphene by ultra-high vacuum (UHV) van der Waals epitaxy, in a manner similar to that used previously for the growth of SL MoS2 Miwa et al. (2015). Tantalum from an e-beam evaporator was deposited on a graphene bilayer on top of a buffer layer on the Si-face of a 6H-SiC(0001) substrate (TanKeBlue Semiconductor Co.) Yu et al. (2011). The Ta deposition took place in a H2S atmosphere of 10*-6* mbar for two minutes. Subsequently, the sample was annealed for 20 minutes at 590 K in the same background pressure of H2S. Repetition of this procedure allowed for an increase in coverage. For the sample used in this experiment, two growth cycles were performed, resulting in a coverage on the order of one monolayer, as judged by the reduced photoemission intensity from the graphene -band. Due to the weak interaction between the SL TaS2 and the underlying bilayer graphene, TaS2 domains are found to be randomly oriented with respect to the substrate; this is clearly evidenced by both low energy electron diffraction (LEED) and scanning tunnelling microscopy (STM). Indeed, the interaction is so weak that individual domains can be moved on the surface using the tip of the STM.
The growth of SL TaS2 on bilayer graphene and the resulting electronic structure were monitored using core level spectroscopy sup and ARPES at the SGM3 beamline at the ASTRID2 synchrotron light source using a photon energy of 25 eV at a sample temperature of 44 K Hoffmann et al. (2004). The energy and angular resolution were set to 25 meV and 0.2*∘*, respectively. Since the typical size of the SL TaS2 islands (less than 10 nm) is much smaller than the spot size of the synchrotron beam (100 m), the random orientation of the islands results in the observation of an azimuthally averaged band structure, in contrast to the well-defined Dirac cone of the underlying bilayer graphene sup .
TR-ARPES experiments were performed at the Artemis facility, Rutherford Appleton Laboratory Frassetto et al. (2011). The sample was transferred from the growth chamber at ASTRID2 to the TR-ARPES facility under UHV conditions, which was necessary because the chemical sensitivity of TaS2 causes degradation of the samples if they are exposed to air. A 1 kHz Ti:sapphire amplified laser system with a fundamental wavelength of 785 nm was used to generate -polarized high harmonic probe pulses with an energy of 25 eV for photoemission and -polarized pump pulses with a photon energy of 2.05 eV for optical excitation of our sample. The angular and time resolution were 0.3*∘* and 40 fs, respectively, while the energy resolution varied between 300 and 800 meV depending on the beamline and detector settings and the fluence of the optical pulses. Different fluences and sample temperatures were investigated. The spot size of the laser beams are also of the order of 100 m, leading to the same averaging of the electronic structure from azimuthally disordered SL TaS2 areas as for the experiments using the spot coming from the synchrotron light source.
III Results and Discussion
III.1 (i) Time-resolved ARPES on TaS2
The electronic structure of undoped SL TaS2 is characterized by a half-filled band with a Fermi surface consisting of hole pockets around the and points of the 2D Brillouin zone (BZ) Sanders et al. (2016). A TR-ARPES spectrum taken near without optical pumping is shown in Fig. 1(a). It shows a dispersive feature with a highest binding energy of 400 meV at 0.8 Å*-1*. It crosses the Fermi level at 0.5 Å*-1* and is unoccupied at . In view of the azimuthal disorder between different domains of SL TaS2 on the sample, this observed dispersion does not correspond to any particular high-symmetry direction in the calculated band structure of Fig. 1(b), but has to be interpreted as an average over all possible orientations, roughly corresponding to an average over the and directions marked in Fig. 1(b) Sanders et al. (2016). The main differences between these directions are the higher maximum binding energy reached along and the strong spin-orbit splitting along . However, for small , the dispersion in the two directions is sufficiently similar for the average to still show the hole pocket character. The main effect of integrating over all directions is a broadening of the features at higher binding energies in the data shown. The spin-orbit splitting along the direction has no direct consequence for the observed band, since the upper spin-split branch is above the Fermi energy.
Figure 1(c) shows the result of optically pumping the system with a photon energy of 2.05 eV at a fluence of 7.8 mJ/cm2, displaying TR-ARPES data collected at a time delay of 40 fs between the pump and the probe pulse, corresponding to the peak excitation of the system. Pumping leads to drastic changes in the spectrum: The observed dispersion now extends well above the Fermi energy, indicating the presence of hot electrons. This is clearly seen when considering the difference between the excited spectrum and the equilibrium spectrum in Fig. 1(d). Excited carriers are expected to be generated from direct optical transitions involving occupied valence band and unoccupied conduction band states, as indicated by the arrows in Fig. 1(b). The presence of a continuous distribution of hot electrons is then merely indicative of a very fast thermalization of these excited carriers that takes place at a timescale lower than our temporal resolution.
A much more surprising result of the optical excitation is that the entire dispersion is shifted to higher binding energies by 100 meV, as seen clearly by the shift between the maxima of the energy distribution curves (EDCs) in Fig. 1(a) and (c). Such shifts are not necessarily expected for metallic systems. Indeed, for a simple free-electron like 2D system, one might not expect any shift at all because of the energy-independent density of states.
III.2 (ii) Fit to simulated model spectral function
A quantitative comparison of the observed effects to calculations requires an accurate determination of the band structure changes and the electronic temperature as a function of pump fluence and time delay. The complexity of the situation and the many unknown parameters render the conventional approach of fitting energy or momentum distribution curves by simple models impractical. Indeed, extracting the electronic temperature from such fits is already problematic even for very simple situations Kröger et al. (2001); Crepaldi et al. (2012); Ulstrup et al. (2014c). Instead, we introduce an approach in which the energy and dependent photoemission intensity, such as in Fig. 1(a), is fitted to a model based on a resolution-broadened spectral function that can, in principle, include the single particle dispersion, many-body effects and the electronic temperature.
The photoemission intensity measured in an ideal ARPES experiment is given by
[TABLE]
where is the hole spectral function, is the Fermi-Dirac distribution and is the energy- and dependent matrix element for the transition from the initial state to the final state . If, as in the present case, the data are only collected for a small range of energy and and for a fixed photon energy and polarization, is expected to vary only weakly. In our experiment, the finite energy and resolution of the setup must be taken into account, such that the actual measured intensity is modelled by a convolution of with the appropriate resolution functions and , assumed to be Gaussian. The measured intensity thus needs to be fitted to .
The azimuthally averaged photoemission intensity from SL TaS2 is phenomenologically modelled as
[TABLE]
where is the experimentally determined Fermi energy in the spectrum and the three parameters in the first term are used to match the calculated photoemission intensity to the experimental results, allowing for the possibility of a linear dependence on and that could arise from, e.g., small matrix element variations. The second term represents the spectral function in which the single particle dispersion is approximated by a parabola as , with its minimum position constrained to , as determined from a high-resolution ARPES spectrum. The electronic self-energy appearing in the spectral function is a complex quantity with the real part re-normalizing the dispersion and the imaginary part broadening the features. Here we assume that the real part is zero and that . This will always result in an increased broadening at higher energies that accounts for the azimuthal averaging over the somewhat anisotropic band structure. Care should thus be taken, to assign physical significance to . In the third term, the population of the states is dictated by the Fermi-Dirac distribution with referring to the electronic temperature in the SL TaS2. In addition to the description of the SL TaS2 spectral function, it is necessary to account for the background intensity which is described in further detail in the supporting information sup .
In order to determine the equilibrium dispersion parameters, this model for the photoemission intensity is fitted to high-resolution experimental data taken at ASTRID2 at a photon energy of 25 eV, i.e. the same photon energy as used for the probe pulse in the TR-ARPES experiment. Fig. 2 shows the resulting excellent agreement between (a) measured and (b) modelled spectral function. Fig. 2(c) and (d) further show the degree of agreement in the form of EDC-cuts at the Fermi level crossing () and at the band minimum (). In this fit, the highest binding energy reaches a value of 350 meV. The light gray lines in these cuts represent the background (BG) function that is not included in equ. (2).
III.3 (iii) Extracting electronic temperature and band shifts
The approach of fitting to a model spectral function now permits the precise determination of parameters such as the electronic temperature and changes of the dispersion. Fig. 3 shows representative results for the application of this fitting method to time-resolved data sets. Fig. 3(a)-(c) show the measured dispersion in equilibrium, at maximum excitation (40 fs) and at 350 fs, while Fig. 3(f)-(h) show modelled spectral functions, obtained as described in section (ii) above. In order to obtain these fits, we have varied the electronic temperatures , the dispersion offset in equ. (2), and the constant and linear coefficient of the linewidth and . A redistribution of background intensity following photoexcitation is also taken into account sup . The application of this fitting procedure results in an excellent description of the data in Fig. 3(a)-(c) for all experimental parameters (delay time, fluence). This is illustrated in the comparison between measured (Fig. 3(d) and (e)) and fitted (Fig. 3(i) and (j)) intensity differences for time delays of 40 and 350 fs and in the direct comparison between measured and fitted EDC-cuts at and , as shown in Fig. 3(k) and (l). Fits of similar quality are obtained for data sets taken at different sample temperatures and pump laser fluence sup . Given the high quality of the fits obtained, we conclude that the hot electron gas is always observed to be in thermal equilibrium with a well-defined temperature, as might be expected given the time resolution of the experiment.
The extracted dynamic changes of the dispersion and electronic temperature are given in Fig. 4. In order to quantify the band shift, we introduce the quantity , defined as the difference between the band minimum energy in the excited and equilibrium state, that is the change of the parameter in equ. (2). Fig. 4(a) shows that this shift is very substantial - more than 100 meV at peak excitation (i. e. roughly a third of the total occupied bandwidth). Fig. 4(b) shows the shift takes place at the same time delays as the peak temperature of the electron gas exceeding 3000 K. The time dependence of both and can be described by a double-exponential decay with a relaxation time well below 1 ps and a slower . We tentatively assign to a decay process involving the excitations of high energy optical phonons in the TaS2 layer Hinsche and Thygesen (2018) and the slower decay to a combination of acoustic phonon excitations and anharmonic decay of the optical phonons, similar to the situation seen in graphene Johannsen et al. (2013).
This presence of a transient hot electron distribution is thus accompanied by a substantial band shift that is not a priori expected for a metallic system. Note that the fit was constrained to a rigid band shift, without other changes and, in particular, without the boundary condition of fixed values. This procedure was chosen because the position of the band minimum is an experimentally well accessible quantity, as this spectral region is least affected by the broad Fermi-Dirac distribution. Moreover, the change in resulting from a rigid shift of the dispersion is small ( Å*-1*) and would be much harder to resolve than the energy shift. Assuming merely a rigid shift of the band also appears justified because of the high fit quality at all time delays. However, minor changes in the dispersion and of the Fermi wave vector cannot be completely excluded.
A strong correlation between and emerges when we combine all data points obtained at different fluences and sample temperatures and plot as a function of in Fig. 5. The cause of this correlation is explored in the next sub-sections. However, the relation is clearly not strictly linear, explaining the fact that the relaxation times and from the fit of the data in Fig. 4(a) and (b) are not necessarily the same.
III.4 (iv) Calculated chemical potential shifts
While the observed correlation between and does not imply causality, it is tempting to seek a simple mechanism that can explain the band shift as caused by the high electronic temperature without invoking, for example, substrate effects. In the present section we explore how the band shift can be caused by a temperature-induced shift of the chemical potential, which is required to conserve the total charge in the system. In the following sub-section we also address the possibility of additional shifts caused by the temperature-dependence of the electronic screening.
Small changes of the chemical potential compared to the zero temperature Fermi energy are always expected in a metallic system, but since in typical experimental conditions is much smaller than the Fermi energy the shifts are also small. This is clearly not the case here. Indeed, the width of the Fermi-Dirac function at 3000 K exceeds the occupied bandwidth of SL TaS2, and temperature-induced shift of the chemical potential could thus be considerable. Predicting the size or even the direction of the shift is not trivial because it involves the details of the entire occupied and unoccupied electronic band structure.
In order to calculate the expected shift of the chemical potential, we start from a tight-binding (TB) model for SL TMDCs Liu et al. (2013) and adapt it for the case of SL TaS2. The model is based on the -orbitals of Ta atoms on a triangular lattice where the first, second and third nearest neighbour hopping integrals are taken into account. Accurate TB parameters are obtained by fits to the results of a density functional theory (DFT) calculation sup . The resulting single particle dispersion at zero temperature is shown in Fig. 6(a) and the corresponding density of states in Fig. 6(b).
Based on the known electronic structure, we can determine the temperature-dependent chemical potential using the following procedure. We start from the assumption of a fixed number of electrons at any temperature. This number is given by
[TABLE]
where and is the chemical potential. The density of states, including lifetime broadening effects, is given by , where is the side length of the sample. The spectral function is given by
[TABLE]
in which the quasiparticle dispersion follows
[TABLE]
Note that stands for the bare dispersion as a function of and for a particular spin-split branch of in the whole BZ sup ; Sanders et al. (2016). is the real part of the on-shell self-energy correction, , and is the corresponding imaginary part of the self energy resulting from electron-electron interactions at finite temperature. Note that the theoretical linewidth cannot be compared directly to the experimental linewidth. The experimental linewidth is expected to be larger, due to the contributions of electron-phonon and electron-defect scattering not present in the theoretical model. Moreover, the experimental linewidth at higher binding energies is affected by the presence of azimuthal disorder in the sample.
When defining the absolute band minimum in the BZ as the zero of the energy scale (see Fig. 6(a)), the temperature-dependent occupied bandwidth measured in the experiment is given by
[TABLE]
where is the real part of the self-energy at the band minimum position . thus has two contributions, one from the temperature-dependent chemical potential and one from the electron-electron interaction that affects the energy of the band minimum via the self-energy (we tacitly assume that self-energy effects do not move the band minimum away from . This is confirmed by the calculations below).
The temperature-induced change of the bandwidth when the system is heated from the equilibrium temperature to then reads
[TABLE]
where and . Note that is also affected by self-energy effects (if present), since these can lead to a rigid shift of the entire band which is then compensated by a change in the chemical potential. This will be discussed in the next sub-section.
We perform the energy integral in equ. (3) analytically and then numerically integrate over the BZ. From this, the temperature-dependent chemical potential can be extracted, and thereby also the shift of the observed dispersion. In the initial iteration, we neglect the influence of many-body effects on the band dispersion by setting and assume a constant electronic lifetime broadening of . Fig. 6(c) shows the resulting shift of the chemical potential as a function of electron filling in the layer, expressed in terms of the Fermi energy (i.e., the chemical potential at zero temperature). Evidently, the degree of change strongly depends on the position of the Fermi energy. For a very low filling of the band a temperature increase leads to a decrease of the chemical potential, whereas the opposite is the case for high filling.
These opposite trends at different filling levels can be understood by considering the following thermodynamical identity in a fixed system volume Marder (2015):
[TABLE]
Then, utilizing the low- Sommerfeld expansion for the number of particles, , we have Marder (2015)
[TABLE]
where stands for the derivative of the density of states. At low- we can approximate . By looking at the density of states in Fig. 6(b), we can see that has a positive (negative) sign in low (high) doping. This can roughly explain () for low (high) filling as depicted in Fig. 6(c).
It is not entirely clear what choice of is most appropriate for a comparison with the experiment. The band minimum at determined from the static high-resolution experiment is 350 meV. However, due to the azimuthal disorder this is not equal to the Fermi energy but roughly to the average highest binding energy in the and directions. The actual Fermi energy corresponds to the highest binding energy along (marked in Fig. 6(a)) which is 80 meV higher than the average highest binding energy. A choice of meV should thus be a good estimate of the Fermi energy in the experimental data.
We plot the temperature-induced shift in the chemical potential as a function of for three different values of the Fermi energy in Fig. 6(d). Due to the extreme temperatures reached and the small bandwidth, the effect of a temperature-induced chemical potential shift is essential in order to explain the observed band shift . However, due to the potentially strongly temperature-dependent screening of the Coulomb interaction, a considerable contribution from the self-energy correction is also expected. This is discussed in the following section.
III.5 (v) Calculated effect of static screening
It is conceivable that many-body effects also contribute to the observed band shift in addition to the effect stemming from the chemical potential. It is well-known, for instance, that the electronic self-energy has a significant effect on the observed dispersion of electronic states in ARPES, even in the case of simple metals Jensen and Plummer (1985); Northrup et al. (1987). In the present experiment the electronic temperature is changed over such a wide range that it is relevant to ask if the temperature-induced change in electronic screening could contribute significantly to the observed changes in the electronic structure.
We investigate this by calculating the temperature-dependent static screened exchange self-energy using the single-band TB model of SL TaS2. For this we first evaluate the density-density susceptibility which is given by Giuliani and Vignale (2008)
[TABLE]
The effect of temperature-dependent screening is treated through the static screened exchange which is given by Giuliani and Vignale (2008)
[TABLE]
where the bare Coulomb interaction in 2D reads with . Note that is the dielectric constant of the graphene/SiC substrate Walter et al. (2011).
The -dependent susceptibility of SL TaS2 is shown in Fig. 7(a) for four different temperatures along high-symmetry directions in the BZ and for meV, as observed in the experiment. As seen in Fig. 7(a), the absolute magnitude of the static susceptibility (considering that the static susceptibility is always a negative value, i.e. |{\mathchoice{\raisebox{0.0pt}{\displaystyle\chi}}{\raisebox{0.0pt}{\textstyle\chi}}{\raisebox{0.0pt}{\scriptstyle\chi}}{\raisebox{0.0pt}{\scriptscriptstyle\chi}}}({\bf q},T_{e})|=-{\mathchoice{\raisebox{0.0pt}{\displaystyle\chi}}{\raisebox{0.0pt}{\textstyle\chi}}{\raisebox{0.0pt}{\scriptstyle\chi}}{\raisebox{0.0pt}{\scriptscriptstyle\chi}}}({\bf q},T_{e})), and therefore the screening, decreases by increasing . This is a universal trend at low temperature and low momentum. At the BZ center and at low electronic temperature (), we can approximate {\mathchoice{\raisebox{0.0pt}{\displaystyle\chi}}{\raisebox{0.0pt}{\textstyle\chi}}{\raisebox{0.0pt}{\scriptstyle\chi}}{\raisebox{0.0pt}{\scriptscriptstyle\chi}}}(0,T_{e})\approx-\rho(\mu) Giuliani and Vignale (2008) and by using equ. (9) we have
[TABLE]
with being the Fermi temperature. In general this negative slope is not fulfilled at finite or very high temperature. Under our experimental conditions, the electronic temperature is very high, leading to a considerable broadening of the Fermi-Dirac distribution function which in fact becomes similar to the entire bandwidth (i.e. ). This strong broadening reduces the probability of virtual transitions, , for all values of in the BZ. Because of this semi-Pauli-blocking effect at very high temperature, the number of virtual electron-hole excitations is diminished, leading to a weaker screening effect. A similar reduction of screening is predicted to emerge in the parabolic-band two dimensional electron gas (2DEG) Maldague (1978); Hwang and Das Sarma (2009); Das Sarma et al. (2011), i.e. {\mathchoice{\raisebox{0.0pt}{\displaystyle\chi}}{\raisebox{0.0pt}{\textstyle\chi}}{\raisebox{0.0pt}{\scriptstyle\chi}}{\raisebox{0.0pt}{\scriptscriptstyle\chi}}}_{\rm 2DEG}({\bf q},T_{e}\gg T_{\rm F})\approx T_{\rm F}/T_{e} Hwang and Das Sarma (2009). On the other hand, in the massless Dirac fermion (MDF) model of graphene the screening effect is predicted to have an increasing trend with temperature as {\mathchoice{\raisebox{0.0pt}{\displaystyle\chi}}{\raisebox{0.0pt}{\textstyle\chi}}{\raisebox{0.0pt}{\scriptstyle\chi}}{\raisebox{0.0pt}{\scriptscriptstyle\chi}}}_{\rm MDF}({\bf q},T_{e}\gg T_{\rm F})\approx\log(4)T_{e}/T_{\rm F}Hwang and Das Sarma (2009). This can be due to the inter-band transitions in graphene which do not exist in our single-band metallic system.
Having a weaker screening of the Coulomb interaction at high electronic temperature implies a stronger many-body effect. As depicted in Fig. 7(b), the explicit self-energy calculation indicates a very strong temperature dependence, with changes of 100 meV over the experimental temperature range. However, this self-energy is mostly comprised of a rigid shift of the whole band which is compensated by an opposite shift in the chemical potential in order to conserve the particle number. When these many-body effects are included in equ. (4) and the chemical potential is calculated in a second iteration, this new estimate is thus strongly modified. This explains the large difference between the chemical potential shifts with and without self-energy corrections in Fig. 6(d). Experimentally, neither the change in the chemical potential nor in the self-energy is directly observable but only their combination in , see equ. (7). Fig. 5 thus compares the full theoretical result to the experimental data, showing an almost quantitative agreement between experiment and calculation. A comparison of the theoretical results in Fig. 5 and 6(d) shows that including static screening to first order leads to a bandwidth change of merely meV at K. Note that while the experimentally observed highest binding energy of the band is not equal to the occupied bandwidth, the change in this binding energy is the same as the theoretically calculated .
IV Conclusions
We have demonstrated strong electronic heating and changes in the occupied bandwidth upon optical pumping of a 2D metal, SL TaS2. The data could be quantitatively analyzed using a 2D fitting scheme of the entire resolution-broadened spectral function. The experimentally observed band shifts are explained by considering the temperature-dependent many-body screening effect and the chemical potential shift required to conserve charge neutrality in the presence of a hot electron population.
The possibility of very large band shifts in pumped metallic systems could potentially be used to create a number of unconventional states of matter. We emphasize that neither the direction nor the magnitude of the shift is trivial but both result from the material’s band structure in a wide range around the Fermi energy. Indeed, much larger shifts still could be expected for SL TaS2 with a different band filling. Starting from an appropriate band structure, it could thus be possible to use transient temperature-induced shifts in order, for example, to push a Van Hove singularity in the density of states close to the chemical potential, possibly creating electronic instabilities at high temperatures.
V Acknowledgements
We thank Phil Rice and Alistair Cox for technical support during the Artemis beamtime. We gratefully acknowledge funding from VILLUM FONDEN through the Young Investigator Program (Grant. No. 15375) and the Centre of Excellence for Dirac Materials (Grant. No. 11744), the Danish Council for Independent Research, Natural Sciences under the Sapere Aude program (Grant Nos. DFF-4002-00029, DFF-6108- 00409 and DFF-4090-00125), the Aarhus University Research Foundation, The Leverhulme Trust and The Royal Society. Access to the Artemis Facility was funded by STFC.
The reference list from the paper itself. Each links out to its DOI / PubMed record.
- 1Smith and Stiles (1972) J. L. Smith and P. J. Stiles, Phys. Rev. Lett. 29 , 102 (1972) . · doi ↗
- 2Shashkin et al. (2003) A. A. Shashkin, M. Rahimi, S. Anissimova, S. V. Kravchenko, V. T. Dolgopolov, and T. M. Klapwijk, Phys. Rev. Lett. 91 , 046403 (2003) . · doi ↗
- 3Pudalov et al. (2002) V. M. Pudalov, M. E. Gershenson, H. Kojima, N. Butch, E. M. Dizhur, G. Brunthaler, A. Prinz, and G. Bauer, Phys. Rev. Lett. 88 , 196404 (2002) . · doi ↗
- 4Wan et al. (2015) Z. Wan, A. Kazakov, M. J. Manfra, L. N. Pfeiffer, K. W. West, and L. P. Rokhinson, Nature Commun. 6 , 7426 EP (2015) . · doi ↗
- 5Bostwick et al. (2007) A. Bostwick, T. Ohta, T. Seyller, K. Horn, and E. Rotenberg, Nature Phys. 3 , 36 (2007).
- 6Pletikosic et al. (2009) I. Pletikosic, M. Kralj, P. Pervan, R. Brako, J. Coraux, A. T. N’Diaye, C. Busse, and T. Michely, Phys. Rev. Letters 102 , 056808 (2009) . · doi ↗
- 7Larciprete et al. (2012) R. Larciprete, S. Ulstrup, P. Lacovig, M. Dalmiglio, M. Bianchi, F. Mazzola, L. Hornekær, F. Orlando, A. Baraldi, P. Hofmann, and S. Lizzit, ACS Nano 6 , 9551 (2012) . · doi ↗
- 8Ulstrup et al. (2014 a) S. Ulstrup, M. Andersen, M. Bianchi, L. Barreto, B. Hammer, L. Hornekær, and P. Hofmann, 2D Materials 1 , 025002 (2014 a) .