Jet-powered Outflows in Supermassive Black Hole Binary Candidate SDSS J1048+0055
Sumit Jaiswal, Prashanth Mohan, Tao An, and S\'andor Frey

TL;DR
This study used multi-frequency VLBI data to investigate the radio properties of the SMBH binary candidate SDSS J1048+0055, finding evidence against the binary interpretation of the radio components and suggesting a core-jet structure instead.
Contribution
The paper provides detailed VLBI analysis that challenges the binary SMBH interpretation, favoring a core-jet scenario and clarifying the nature of the double-peaked emission lines.
Findings
The brighter VLBI component shows flat spectrum and high brightness temperature.
The apparent separation speed exceeds expected orbital motion, ruling out a binary core.
The double-peaked lines may originate from jet interactions, not a binary SMBH.
Abstract
The search and study of close pairs of supermassive black holes (SMBHs) is important in the study of galaxy mergers which can possibly trigger active galactic nucleus (AGN) activity, and in the context of their evolution into the gravitational wave emitting regime. The quasar SDSS~J1048+0055 was identified as a SMBH binary candidate based on the observed double-peaked \OIII4959,5007 emission lines and two distinct radio components separated by ~pc \citep{2004ApJ...604L..33Z}. To ascertain the binary nature of this source, we analyzed multi-frequency, multi-epoch very long baseline interferometry (VLBI) data to investigate its pc-scale radio properties. The source shows double components with the western feature being brighter than the eastern one. This brighter component has a brightness temperature of ~K, spectral index of $\alpha = -0.09 \pm…
Click any figure to enlarge with its caption.
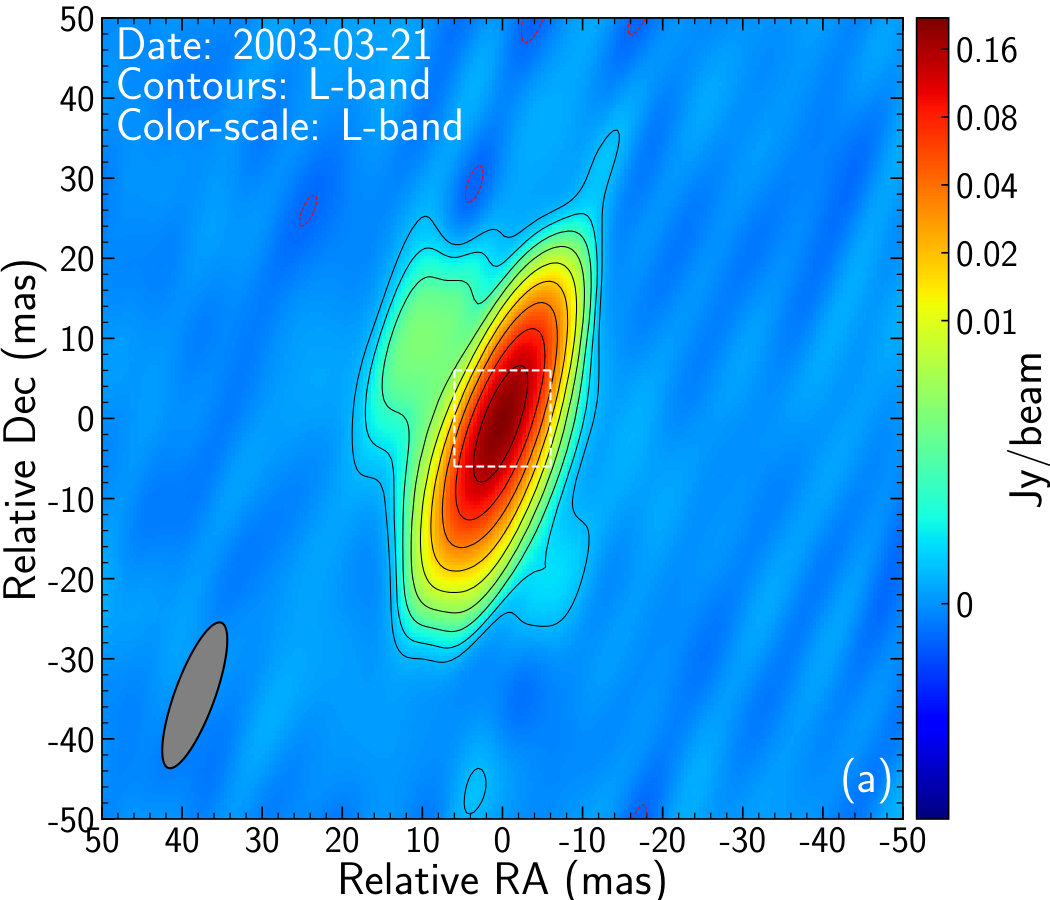 Figure 1
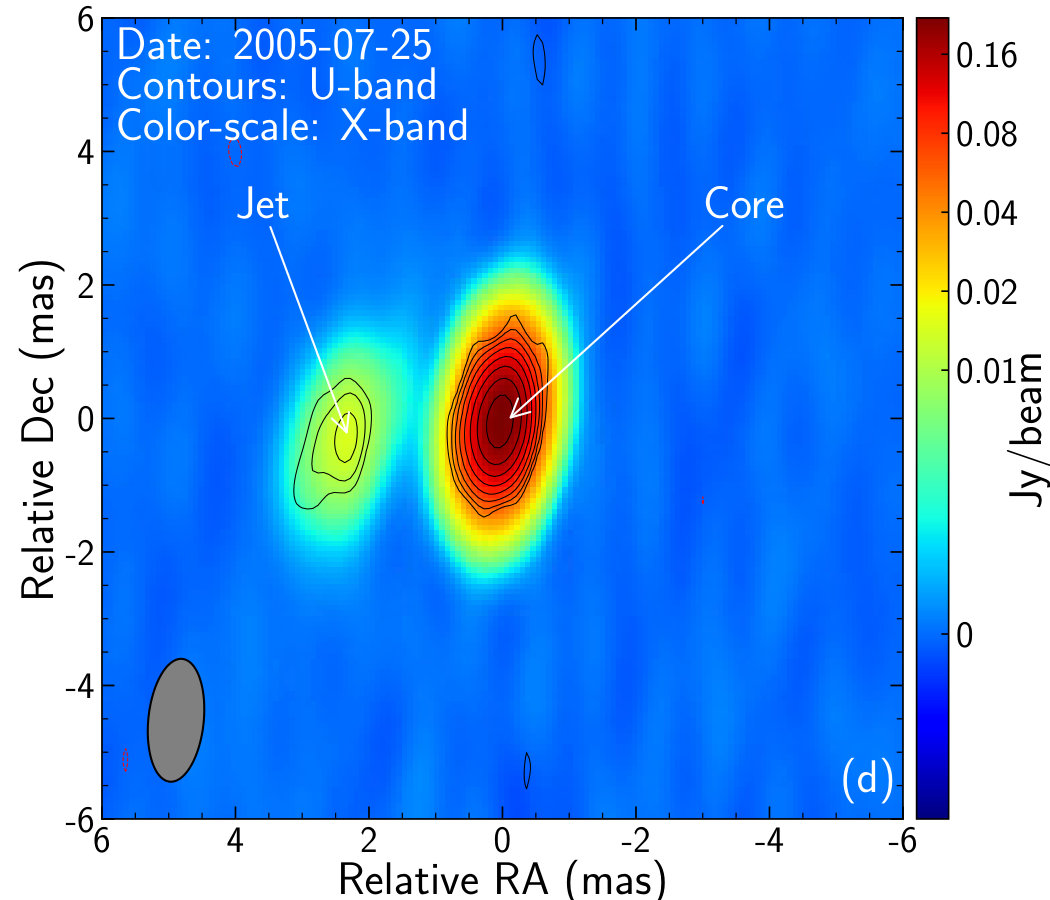 Figure 2
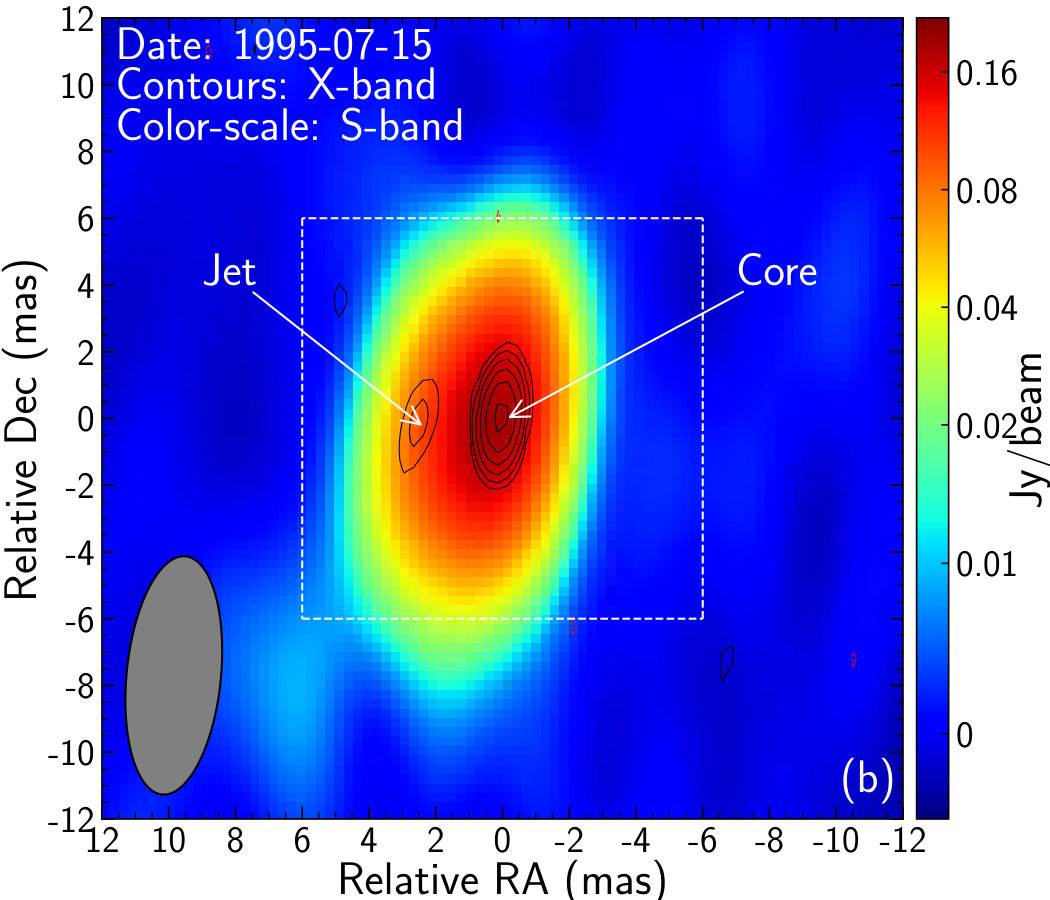 Figure 3
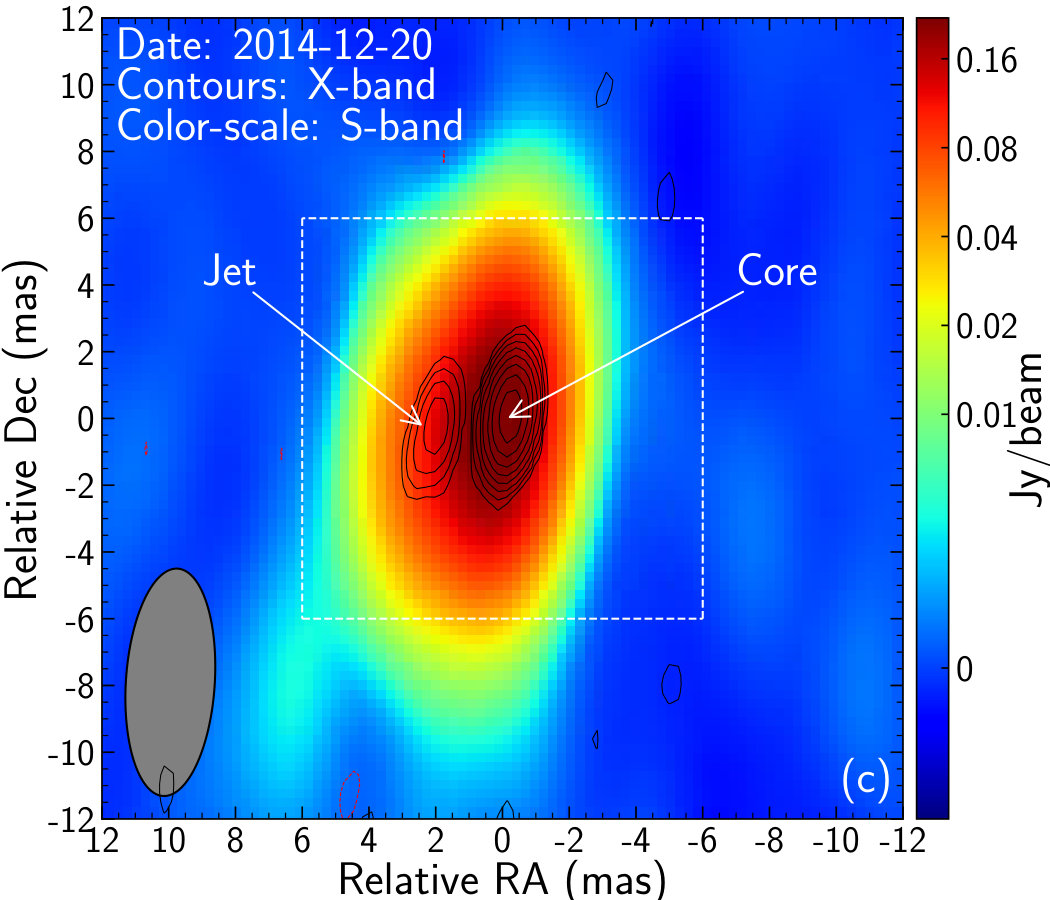 Figure 4
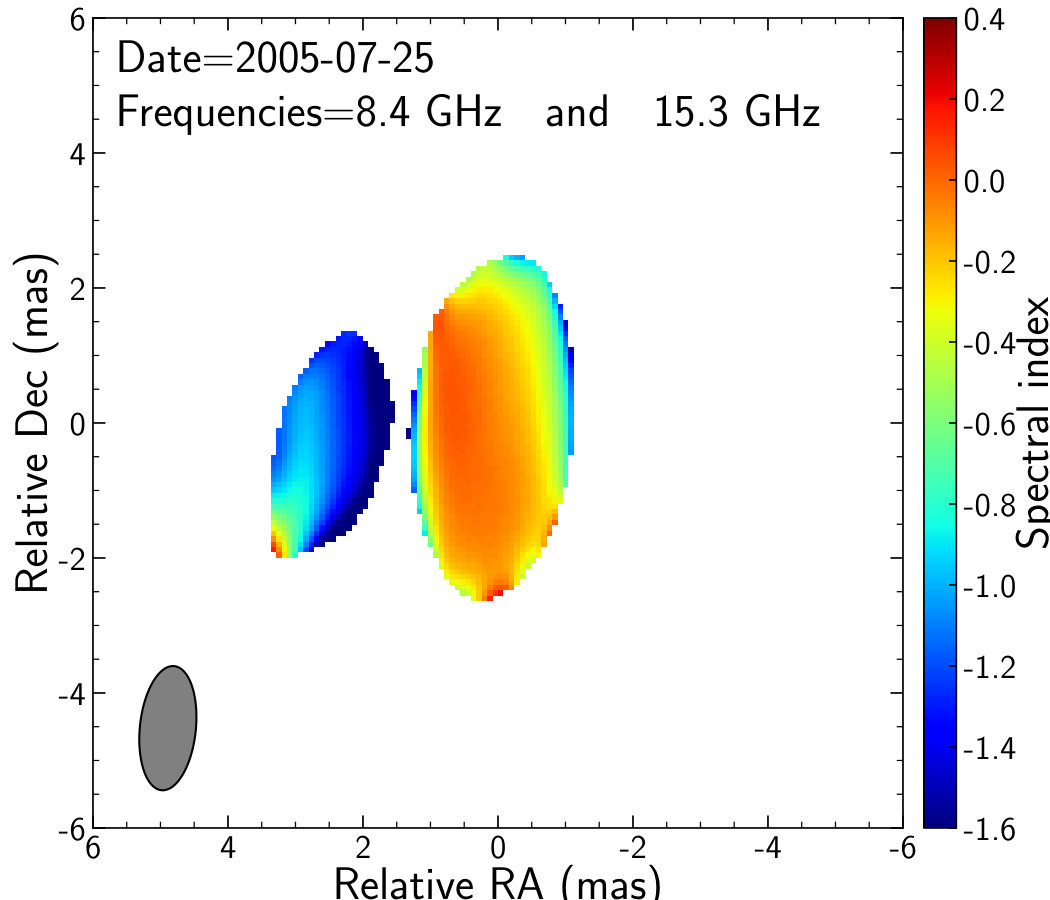 Figure 5
| Observing date | Project code | Frequency (Band) | Bandwidth | On-source time | BeamaaRestoring beam major and minor axes (FWHM) and the major axis position angle measured from north through east. | RMS noise | Peak intensity |
|---|---|---|---|---|---|---|---|
| (yyyy-mm-dd) | (GHz) | (MHz) | (min) | (masmas, °) | (mJy beam-1) | (mJy beam-1) | |
| 1995-07-15 | BB023 | 2.3 (S) | 16 | 4.2 | 1.8 | 191 | |
| 1995-07-15 | BB023 | 8.4 (X) | 16 | 4.2 | 1.5 | 179 | |
| 2003-03-21 | BP106 | 1.4 (L) | 16 | 418 | 0.2 | 210 | |
| 2005-07-25 | BL127 | 8.4 (X) | 16 | 587 | 0.2 | 233 | |
| 2005-07-25 | BL127 | 15.3 (U) | 16 | 569 | 0.3 | 219 | |
| 2014-12-20 | BG219F | 2.3 (S) | 128 | 2.7 | 0.6 | 261 | |
| 2014-12-20 | BG219F | 8.4 (X) | 384 | 2.7 | 0.3 | 168 |
| Frequency band | Flux density (mJy) | Size (as) | Relative position of Jet comp. (mas) | Brightness temperature ( K) | |||||
|---|---|---|---|---|---|---|---|---|---|
| (Observing year) | Core comp. | jet comp. | Total | Core comp. | jet comp. | Core comp. | jet comp. | ||
| S (1995) | — | — | — | — | — | — | |||
| X (1995) | |||||||||
| L (2003) | — | — | — | — | — | — | |||
| X (2005) | |||||||||
| U (2005) | |||||||||
| S (2014) | — | — | — | — | — | — | |||
| X (2014) | |||||||||
Peer Reviews
No public reviews on file for this paper yet. If you reviewed it on a platform where reviews are public (OpenReview, ICLR, NeurIPS, ICML), you can paste yours below so the community can read it here.
Videos
No videos yet. Explain this paper in a talk, walkthrough, or lecture? Add one.
Jet-powered Outflows in Supermassive Black Hole Binary Candidate SDSS J1048+0055
Sumit Jaiswal
Shanghai Astronomical Observatory, Key Laboratory of Radio Astronomy, Chinese Academy of Sciences, 80 Nandan Road Shanghai 200030, China
Prashanth Mohan
Shanghai Astronomical Observatory, Key Laboratory of Radio Astronomy, Chinese Academy of Sciences, 80 Nandan Road Shanghai 200030, China
Tao An
Shanghai Astronomical Observatory, Key Laboratory of Radio Astronomy, Chinese Academy of Sciences, 80 Nandan Road Shanghai 200030, China
Sándor Frey
Konkoly Observatory, MTA Research Centre for Astronomy and Earth Sciences, Konkoly Thege Miklós út 15-17, H-1121 Budapest, Hungary
Abstract
The search and study of close pairs of supermassive black holes (SMBHs) is important in the study of galaxy mergers which can possibly trigger active galactic nucleus (AGN) activity, and in the context of their evolution into the gravitational wave emitting regime. The quasar SDSS J1048+0055 was identified as a SMBH binary candidate based on the observed double-peaked [O iii] 4959,5007 emission lines and two distinct radio components separated by pc (Zhou et al., 2004). To ascertain the binary nature of this source, we analyzed multi-frequency, multi-epoch very long baseline interferometry (VLBI) data to investigate its pc-scale radio properties. The source shows double components with the western feature being brighter than the eastern one. This brighter component has a brightness temperature of K, spectral index of (flat) and is indicative of mildly relativistic beaming. In contrast, the faint component has a lower brightness temperature of K and steep spectrum. These clues are consistent with a core–jet structure, moreover, the apparent separation speed between the two components is much higher than the expected orbital motion in a binary SMBH. Thus the present study excludes the association of the two VLBI components with the cores of a SMBH binary, although the SMBH binary possibility (e.g., a pair of radio-loud and radio-quiet AGNs) is not fully ruled out. In the single active galactic nucleus (AGN) scenario, the double-peaked optical emission lines can originate from the jet interacting with the narrow-line region as indicated by a change in the jet direction at 140 pc.
galaxies: active — galaxies: individual (SDSS J1048+0055) — quasars: emission lines — radio continuum: galaxies — black hole physics
††journal: ApJ
1 Introduction
A central supermassive black hole (SMBH, ) is putatively hosted by every massive galaxy (e.g. Ferrarese & Ford, 2005; Kormendy & Ho, 2013). An efficient major merger in interacting galaxies can result in a gravitationally bound SMBH binary (SMBHB) with a typical separation of 10 pc (e.g. Begelman et al., 1980; Colpi, 2014). The study of SMBHs can help understand their growth and role in triggering active galactic nucleus (AGN) activity in the merging system (e.g. Hopkins et al., 2008; Van Wassenhove et al., 2012; Koss et al., 2018). If one or both SMBHs of the binary system are actively accreting, the jet-based synchrotron radio emission can be used to trace the merger dynamics (e.g. An et al., 2018; Das et al., 2018).
A small sample of SMBHB and dual AGN (with kpc-scale separation) candidates have been reported to date (e.g. An et al., 2018, and references therein) and include AGN hosting a spatially resolved dual core morphology (e.g. Komossa et al., 2003; Rodriguez et al., 2006; Fabbiano et al., 2011). Methods of identification employ searches in spectroscopic (double peaked spectral lines, e.g. Wang et al., 2009; Comerford et al., 2009; Liu et al., 2010; Smith et al., 2010; Comerford et al., 2012; Smith et al., 2012; Woo et al., 2014) or timing domains (periodic variability over year-timescales, e.g. Graham et al., 2015; D’Orazio et al., 2015; Charisi et al., 2016), or through imaged peculiar large-scale jet morphologies (S, X or Z-shaped, e.g. Ekers et al., 1978; Gopal-Krishna et al., 2003; Deane et al., 2014; Koss et al., 2018). Competing explanations can include AGN with overlapping spatially projected locations, outflows associated with the narrow line region (e.g. Rosario et al., 2010; An et al., 2013), or rotating gaseous disks (e.g. Greene & Ho, 2005) relevant to the spectroscopic domain; helical motion in the jet either due to large scale structured magnetic fields (e.g. Mohan & Mangalam, 2015; Mohan et al., 2016) or due to jet precession enabled by a misalignment between the jet direction and the accretion flow powering the central engine (e.g. Caproni et al., 2006; Liska et al., 2018), relevant to the timing and imaging domains.
AGN hosting narrow optical spectral lines (e.g. [O iii]) are key probes of ionized outflows likely originating in the narrow line region (NLR). The outflow kinematics and emission can be naturally powered by the central engine including the jet which can transfer momentum and energy flux, and the ionizing accretion disk and broad line region photons. Double peaked narrow lines are then indicative of a complex kinematic structuring in the NLR (e.g. Xu & Komossa, 2009) and can be used to probe mechanisms enabling it. Employing observational diagnostics including the optical line ratios provide constraints on the ionization parameter and distribution (density and geometry) of the NLR clouds which can then be used to infer their location and energetics (e.g. Baskin & Laor, 2005; Bennert et al., 2006). Radio very long baseline interferometry (VLBI) observations then help constrain the drivers of the ionized outflows and provide a consistent picture connecting the physical regions, complementing the observational diagnostics and hydrodynamic simulations of jet interaction with the interstellar medium (e.g. Wagner et al., 2012).
The quasar SDSS J104807.74+005543.5 (hereafter J1048+0055; redshift , Zhou et al., 2004) having RA=10h 48m 077446 and DEC=00∘ 55*′* 43482111International Celestial Reference Frame 3, http://hpiers.obspm.fr/icrs-pc/newwww/icrf/icrf3sx.txt, P. Charlot et al., in prep. is one of the first identified double-peaked narrow-line quasars found from the Sloan Digital Sky Survey Data Release 1 (SDSS DR1, Abazajian et al., 2003). Its optical spectrum shows clear double peaks of the [O iii] 4959 and 5007 emission lines with a line luminosity corresponding to each peak comparable to that of a luminous quasar. As reported by Zhou et al. (2004), the observed wavelengths of the red and blue peaks for the [O iii] 4959 double-peaked line are (FWHM km s*-1*) and (FWHM km s*-1*) respectively, and that for the [O iii] 5007 double-peaked line are (FWHM km s*-1*) and (FWHM km s*-1*). The average velocity offsets are therefore km s*-1* for the redshifted peaks and km s*-1* for the blueshifted peaks relative to the systemic redshift of J1048+0055. The H line (observed wavelength ) is found to be broad with FWHM km s*-1*, twice that of the [O iii] lines, indicating that H is blended with two narrow-line components. The source shows two distinct radio features with a projected separation of pc in the 8.4 GHz image (resolution 1.5 mas 3 mas) from Very Long Baseline Array (VLBA) calibrator survey (VCS1, Beasley et al., 2002). Zhou et al. (2004) speculate on the origin of the double-peaked [O iii] and H lines and suggest an origin from two distinct NLRs, with the identified radio components in 8.4 GHz VLBA image being two AGN cores. However, as the double-peaked optical emission lines from the nuclear region may also be produced by a range of distinguishable phenomena as mentioned above, the binary identification requires further supporting evidence.
In this paper, we employ archival multi-frequency, multi-epoch VLBI observations to investigate the validity of the proposed binary identification of J1048+0055. Assuming a standard CDM cosmology with km s*-1Mpc-1*, and , an angular size of 1 mas corresponds to a linear size of 6.9 pc and a proper motion of 1 mas yr*-1* to an apparent speed of 36.9 at the redshift of the source.
2 Observations and data analysis
The calibrated VLBA data at 2.3 and 8.4 GHz of J1048+0055 were obtained from the VLBA calibrator survey (VCS) archival repository222http://astrogeo.org/cgi-bin/imdb_get_source.csh?source=J1048%2B0055 (VCS1: Beasley et al. (2002) and VCS2: Gordon et al. (2016)), while the raw VLBA data at 1.4, 8.4 and 15.3 GHz of J1048+0055 from the National Radio Astronomy Observatory (NRAO) science data archive333https://archive.nrao.edu/archive/advquery.jsp. The basic calibration of the raw data was performed using the Astronomical Image Processing System (AIPS) software package (Greisen, 2003). While processing the raw data, we followed the standard procedure given in AIPS cookbook for VLBA data calibration 444ftp://ftp.aoc.nrao.edu/pub/software/aips/TEXT/PUBL/COOKC.PS.gz. The basic calibration process involves the data editing to flag essentially bad data, gain calibration for amplitude and phase corrections, fringe fitting to make the source at the phase center for improving phase accuracy, and bandpass calibration for correcting the change in frequency response across the channels. We further analyzed the calibrated datasets using the Caltech DIFMAP software package (Shepherd et al., 1995). Data with significant scatter are averaged in time over 30 seconds and bad data points are flagged. The edited data are then mapped and self-calibrated in a standard procedure. The final maps are made using uniform weighting to get higher resolution. The images are deconvolved with the beam using the CLEAN algorithm (Hogbom & Brouw, 1974). The CLEANing in the final maps is performed up to 3 level. The imaging parameters are given in Table 1.
We performed circular Gaussian model fitting on the self-calibrated visibility data, and estimated the integrated flux densities of the two VLBI components (see Fig. 1), their angular size and relative positions of the faint component with respect to the bright one (see Table 2). We first fit a single Gaussian component on the source. However, multiple circular Gaussian components were used to fit the data when required to ensure that the model matches the data and there is no visible structure brighter than 5 appearing in the map. In cases of multi-component Gaussian models, the total flux density is obtained by adding that from individual components. With the use of elliptical Gaussian model fitting, the derived results are still consistent with those using circular Gaussian models. The errors in the model fitting parameters are estimated using the relations given in Schinzel et al. (2012) which are based on the approximations introduced by Fomalont (1999) and modified for the strong side-lobes of VLBI observations. When the fitted Gaussian size of a component was found to be less than the minimum resolvable size estimated using Lobanov (2005) relation, the resolution-limited size was used in place of as the size of that component.
3 Results
3.1 Morphology
The images of J1048+0055 for different wavebands and epochs of observation are shown in Figure 1. Two resolved components are seen in the X-band and U-band images. The western component is significantly brighter and more compact than the eastern one at both frequencies. The source is unresolved in the S-band images. However, the S-band images show an elongation in the East direction, in alignment with the resolved structure at two higher frequencies. Also, the S-band image is fit better with an additional Gaussian component at the same position as that of the faint eastern component in X- and U-band images than a single component. The flux densities of the fitted components are given in Table 2. The L-band image shows a structure extended to about 20 mas in the northeast of the center, suggesting a jet deflection or bending based on a 40∘ difference between the inner and outer jet direction. The north-east jet feature is real as it is detected at above 12 with a consequent smaller chance of being a sidelobe pattern. There is a hint of a counter-jet at around 3 which would require more sensitive imaging for a confirmation.
3.2 Spectral index
The spectral indices, (defined as ), are estimated for the epochs 1995, 2005 and 2014 using the model-fitted flux densities (see Table 2) of the contemporaneous dual frequency observations. The X/U band spectral index distribution during 2005 is also presented in Figure 2. We first aligned the two images by shifting their peak to the center of the images, then convolved the high-resolution U-band image with the restoring beam of the low-resolution X-band image, and changed the pixel scale of this convolved image equal to the X-band image, and finally made the spectral index map using the X-band image and the scaled U-band image after blanking the noise up to 3 level. The spectral index clearly indicates the flat spectrum with for the western (self-absorbed core, see more discussion in following subsections) component and steep spectrum with for the eastern (optically thin jet) component, and thereby provides direct evidence of the core–jet nature of the source J1048+0055. The average spectral indices of the overall source with unresolved components are and for the 1995 and 2014 data respectively. The difference in the spectral indices at 1995 and 2014 epochs could be related to the intrinsic change in the emission structure of the core region, as expected from the flux density changes listed in Table 2. However the resolution is not high enough to make a conclusive inference.
3.3 Brightness temperature
The brightness temperature indicates the level of relativistically beamed jet emission; that for the AGN core is typically high ( K). The brightness temperatures were estimated here (see Table 2) using (e.g., Kellermann & Owen, 1988):
[TABLE]
where is the total flux density, the diameter (full width at half maximum, FWHM) of the source component, the observing frequency, and the redshift. The bright component indicates a at least an order of magnitude higher than that of the faint component. The observed brightness temperatures of the bright component are close to but slightly lower than the equipartition brightness temperature ( K, Readhead, 1994), or the inverse Compton limit ( K, Kellermann & Pauliny-Toth, 1969), suggesting that the radio jet in J1048+0055 is not strongly beamed. The of the faint component is significantly (two orders of magnitude) lower than the typical of Doppler-boosted radio-loud AGN cores. Instead, it is more consistent with a hot spot in the jet (e.g. K in 3C 48, An et al., 2010). Though, the distinctive differences in (1–2 orders of magnitude) of the components, together with their spectral indices, confirm the core–jet nature.
3.4 Proper motion
As both components are detected and well separated in the X-band VLBI images in 1995, 2005 and 2014 (see Fig. 1 and Table 2), the average proper motion of the jet with respect to the core is estimated to be mas year*-1* (). Any orbital motion of pc-scale separation in binary SMBHs cannot appear very fast. For instance, the VLBI observations of the archetypal compact SMBHB 0402+379 indicates a separation of 7.3 pc between two AGN cores (Rodriguez et al., 2006), and a relative motion of is derived from the VLBI monitoring over 12 years Bansal et al. (2017). The orbital velocity of a SMBHB (equating the binding energy to the kinetic energy of the system) is
[TABLE]
where is the inclination angle of the orbital plane with respect to the line of sight, is the binary separation, is the ratio of masses in the SMBHB system ( and are the masses of the secondary and primary orbiting SMBHs, respectively). The SMBH in AGN can typically grow to masses of (e.g. Shen et al., 2008; King, 2016). The maximum orbital velocity for this system is therefore for (SMBHB system with equal masses of ), pc and ∘ (mildly relativistic beaming inferred from the brightness temperatures suggests a moderate viewing angle between the jet direction and the observer line of sight). The inferred relative motion in J1048+0055 is distinctly larger ( two orders of magnitude) than expected from eqn. (2) thus adding to the evidence against the SMBHB scenario.
4 Re-examining the source nature
The quasar J1048+0055 was reported to indicate double peaked [O iii] 4959,5007 emission lines and two distinct radio components at a projected separation of pc in VLBI images (Zhou et al., 2004), prompting an investigation of its true nature with the availability of additional radio images.
The steep spectrum, lower brightness temperature than expected in highly beamed AGN cores, and a larger proper motion speed compared to expected orbital motion of binary cores, as discussed in Section 3, rule out the identification of the eastern component as an additional self-absorbed core. The presence of double peaks in the optical spectrum and two distinct radio components are then not sufficient to identify the source as a SMBHB host, thus requiring a careful investigation from additional epochs of multi-wavelength observations to make a robust inference.
The origin of the double peaked optical spectral lines presents an interesting avenue for interpretation. The compact emission structure, flat spectrum of the radio source and one-sided jet indicates a pole-on viewing direction. We assume this is the case for the following discussions. An asymmetry in the peak amplitudes of the optical emission lines (Zhou et al., 2004) renders an origin in an extended rotating gaseous disk with an underlying continuum source less feasible. An origin in the NLR is then a likely scenario. The distance of the NLR clouds from the central engine can be approximated by assuming their photoionization by the underlying continuum emission source and is
[TABLE]
where cm*-3* (e.g. Villar Martín et al., 2014) is the number density of the hydrogen gas constituting a dense NLR, is the ionization parameter, and (Bicknell et al., 1998) is the rate at which ionizing photons emitted by the luminous quasar (with luminosity ) impinge on the NLR. Employing erg s*-1*, pc is inferred, corresponding to an angular scale mas, close to the scales being probed in the L-band VLBA image (Fig. 1 panel (a)). This, the presence of an elongated outer jet component at 20 mas, and a difference in the direction of the inner and outer jet components suggest that the NLR kinematics may be driven by the jet. This could be enabled through radiative and momentum flux transport across a shock formed when the jet impacts the NLR cloud (e.g. Bicknell et al., 1998), especially relevant to the production of the double peaked lines owing to a kinematic structuring upon impact (e.g. Kharb et al., 2015). The study of Bîrzan et al. (2008) estimates an empirical relationship based on the best fitting linear relation between the observed total jet power and the spectral power from radio synchrotron emission (integrated over the full source: core and jet/lobes) from a sample of 18 sources, given by
[TABLE]
where is the spectral power at 1.4 GHz corresponding to the spectral power for the momentum flux transfer . From the and inferred in Table 2, the average jet kinetic power erg s*-1*.
A jet-cloud interaction can cause a deflection (e.g. Bicknell et al., 1998; Falcke et al., 1998; Saxton et al., 2005) which can be constrained and compared with observations to ascertain this scenario. The jet velocity (Bicknell et al., 1998)
[TABLE]
where is the pressure just behind the propagating shock acting on an area and is a factor parameterizing the dependence on the jet thermodynamic and kinematic properties through the Mach number and the deflection angle respectively. Assuming that the jet with a half opening angle , and proper motion speed , erg s*-1* acts through a shock dominated by ram pressure, dyn cm*-2* with a surface area kpc2 (solid angle accounts for the area in contact with NLR clouds). Then, the factor gives a in the range , consistent with an observed median of from a large sample of AGN (Pushkarev et al., 2017). With the parameterization (Bicknell et al., 1998)
[TABLE]
where is the adiabatic index, is the angle between the jet velocity and the normal of the shock front, and (Frank et al., 2002) is the post-shock subsonic jet Mach number. Assuming a moderate to strong shock with and in the range 1∘ (near grazing) – 90∘ (head-on), we obtain a maximum corresponding to a deflection angle between and an angle of approach 7.5∘. The inferred is larger than the observed 40∘, with the possibility of simplifying assumptions in the model including the structure and evolution of the interacting clouds and in the jet and shock energetics being a cause for this discrepancy.
Based on the results presented in the preceding section and the above discussion, J1048+0055 indicates a core–jet morphology with less evidence for a SMBHB. The blueshifted emission lines likely originate from the interaction between the jet and NLR clouds. The redshifted emission lines can then originate from the NLR region on the counter-jet side. The counter-jet component is however undetected in the VLBI images, likely due to Doppler de-boosted emission rendering it very faint. To further address the origin of the double peaked emission lines, a search was conducted in a larger sky zone around J1048+0055 to find a second radio core at arcsecond separations. This resulted in a failure in such a detection up to a radius of around J1048+0055 based on the NASA/IPAC Extragalactic Database (NED). We also looked at the Multi-Element Radio Linked Interferometer Network (MERLIN) L-band image of J1048+0055 and found the source remains unresolved at 200 mas (1 kpc) resolution. This then rules out the presence of a dual radio-loud AGN at the kpc scale. The current analysis then tends to support a single radio-loud AGN, although the possibility of a second radio-quiet nucleus (e.g., a low-luminosity AGN) can not be fully excluded.
5 Summary
The process of hierarchical merging should make close pairs of SMBHs common in the Universe, especially near the centers of galaxy clusters where multiple mergers have occurred. However, only a few candidates at sub-kpc separations have been seen to date. If they are radio-emitting AGN, their direct imaging and confirmation requires mas or even sub-mas resolution VLBI images at different wavebands and at well-separated epochs of observation. The present systematic VLBI imaging of the quasar J10480055 produces the following inferences.
Identification of a core–jet morphology from significant differences in measured flux densities, spectral index (flat–steep) and brightness temperature in the resolved components and a jet separation speed of , unlikely to be the case for a SMBHB system at a separation of 20 pc. 2. 2.
Indication of a mildly relativistic jet from the brightness temperature (mean of K) and proper motion. 3. 3.
The double-peaked optical emission lines originating from the interaction of jet with the NLR cloud as indicated by a change in the jet direction at 138 pc (20 mas).
Though J1048+0055 may not host a SMBHB system, it is a promising target to study jet–NLR interaction, the origin of lower velocity outflows ( 1000 km s*-1*) and the structure of their host regions. Additional evidence can be obtained by the inference of polarized emission at these scales owing to the jet interaction with the NLR clouds as it can cause pockets with an increased plasma density.
We would like to thank the referee for his/her valuable comments and suggestions which have improved our manuscript. This work was supported by National Key R&D Programme of China (2018YFA0404603). PM is supported by the NSFC Research Fund for International Young Scientists (grant no. 11650110438). SF thanks for the support received from the Hungarian Research, Development and Innovation Office (OTKA NN110333). SJ thanks Yingkang Zhang and Xiaofeng Li for helping in VLBI data analysis. The National Radio Astronomy Observatory is a facility of the National Science Foundation operated under cooperative agreement by Associated Universities, Inc. We are grateful to Yuri Y. Kovalev and Alexander Pushkarev for making their fully calibrated VLBI FITS data publicly available and to Leonid Petrov for maintaining, at the Astrogeo Center, the data base of brightness distributions, correlated flux densities and images of compact radio sources produced with VLBI. MERLIN is a National Facility operated by the University of Manchester at Jodrell Bank Observatory on behalf of STFC. The NASA/IPAC Extragalactic Database (NED) is operated by the Jet Propulsion Laboratory, California Institute of Technology, under contract with the National Aeronautics and Space Administration.
The reference list from the paper itself. Each links out to its DOI / PubMed record.
- 1Abazajian et al. (2003) Abazajian, K., Adelman-Mc Carthy, J. K., Agüeros, M. A., et al. 2003, AJ, 126, 2081, doi: 10.1086/378165 · doi ↗
- 2An et al. (2018) An, T., Mohan, P., & Frey, S. 2018, Radio Science, 53, 1211, doi: 10.1029/2018 RS 006647 · doi ↗
- 3An et al. (2010) An, T., Hong, X. Y., Hardcastle, M. J., et al. 2010, MNRAS, 402, 87, doi: 10.1111/j.1365-2966.2009.15899.x · doi ↗
- 4An et al. (2013) An, T., Paragi, Z., Frey, S., et al. 2013, MNRAS, 433, 1161, doi: 10.1093/mnras/stt 801 · doi ↗
- 5Bansal et al. (2017) Bansal, K., Taylor, G. B., Peck, A. B., Zavala, R. T., & Romani, R. W. 2017, Ap J, 843, 14, doi: 10.3847/1538-4357/aa 74e 1 · doi ↗
- 6Baskin & Laor (2005) Baskin, A., & Laor, A. 2005, MNRAS, 358, 1043, doi: 10.1111/j.1365-2966.2005.08841.x · doi ↗
- 7Beasley et al. (2002) Beasley, A. J., Gordon, D., Peck, A. B., et al. 2002, Ap JS, 141, 13, doi: 10.1086/339806 · doi ↗
- 8Begelman et al. (1980) Begelman, M. C., Blandford, R. D., & Rees, M. J. 1980, Nature, 287, 307, doi: 10.1038/287307 a 0 · doi ↗