Measurement of the mass and production rate of $\Xi_b^-$ baryons
LHCb collaboration: R. Aaij, C. Abell\'an Beteta, B. Adeva, M., Adinolfi, C.A. Aidala, Z. Ajaltouni, S. Akar, P. Albicocco, J. Albrecht, F., Alessio, M. Alexander, A. Alfonso Albero, G. Alkhazov, P. Alvarez Cartelle,, A.A. Alves Jr, S. Amato, S. Amerio, Y. Amhis, L. An

TL;DR
This paper reports the first measurement of the production rate and mass of $ ext{Xi}_b^-$ baryons in proton-proton collisions at various energies, using LHCb data, providing precise mass determination and production asymmetries.
Contribution
It presents the first measurement of $ ext{Xi}_b^-$ baryon production rates relative to $ ext{Lambda}_b^0$, and the most precise mass measurement of $ ext{Xi}_b^-$ to date.
Findings
Measured production ratios at different energies.
Determined the $ ext{Xi}_b^-$ mass with high precision.
Reported production asymmetries between baryons and antibaryons.
Abstract
The first measurement of the production rate of baryons in collisions relative to that of baryons is reported, using data samples collected by the LHCb experiment, and corresponding to integrated luminosities of , and fb at and TeV, respectively. In the kinematic region and GeV/, we measure \begin{align*} \frac{f_{\Xi_b^-}}{f_{\Lambda_b^0}}\frac{{\mathcal{B}}(\Xi_b^-\to J/\psi\Xi^-)}{{\mathcal{B}}(\Lambda_b^0\to J/\psi\Lambda)} &= (10.8\pm0.9\pm0.8)\times10^{-2}~~[\sqrt{s}=7,8~{\rm TeV}],\\ \frac{f_{\Xi_b^-}}{f_{\Lambda_b^0}}\frac{{\mathcal{B}}(\Xi_b^-\to J/\psi\Xi^-)}{{\mathcal{B}}(\Lambda_b^0\to J/\psi\Lambda)} &= (13.1\pm1.1\pm1.0)\times10^{-2}~~[\sqrt{s}=13~{\rm TeV}], \end{align*} where and are the fragmentation fractions of quarks into…
Click any figure to enlarge with its caption.
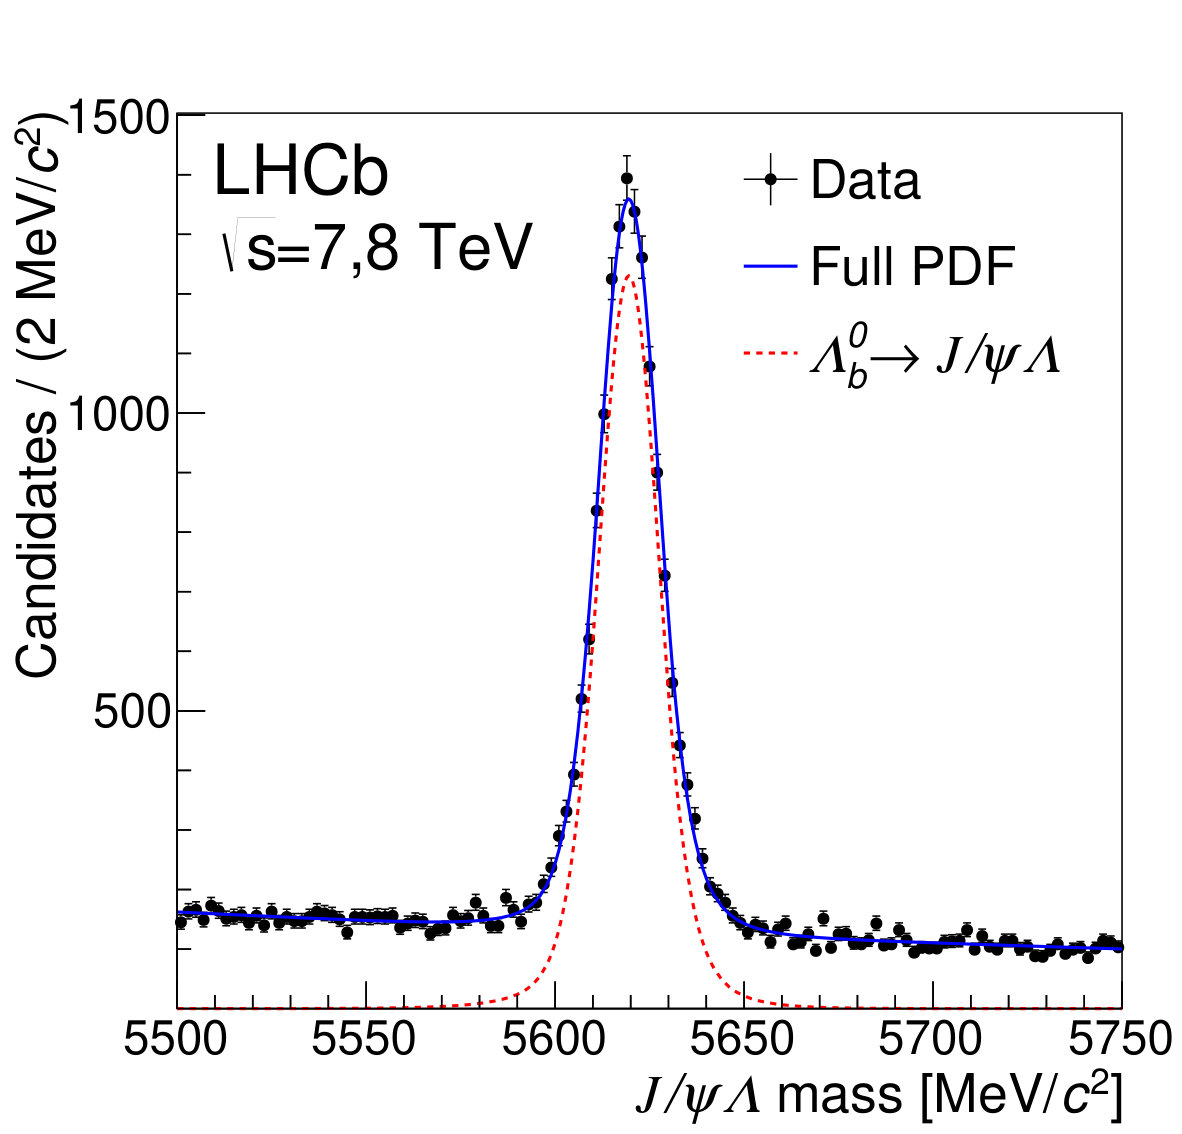 Figure 1
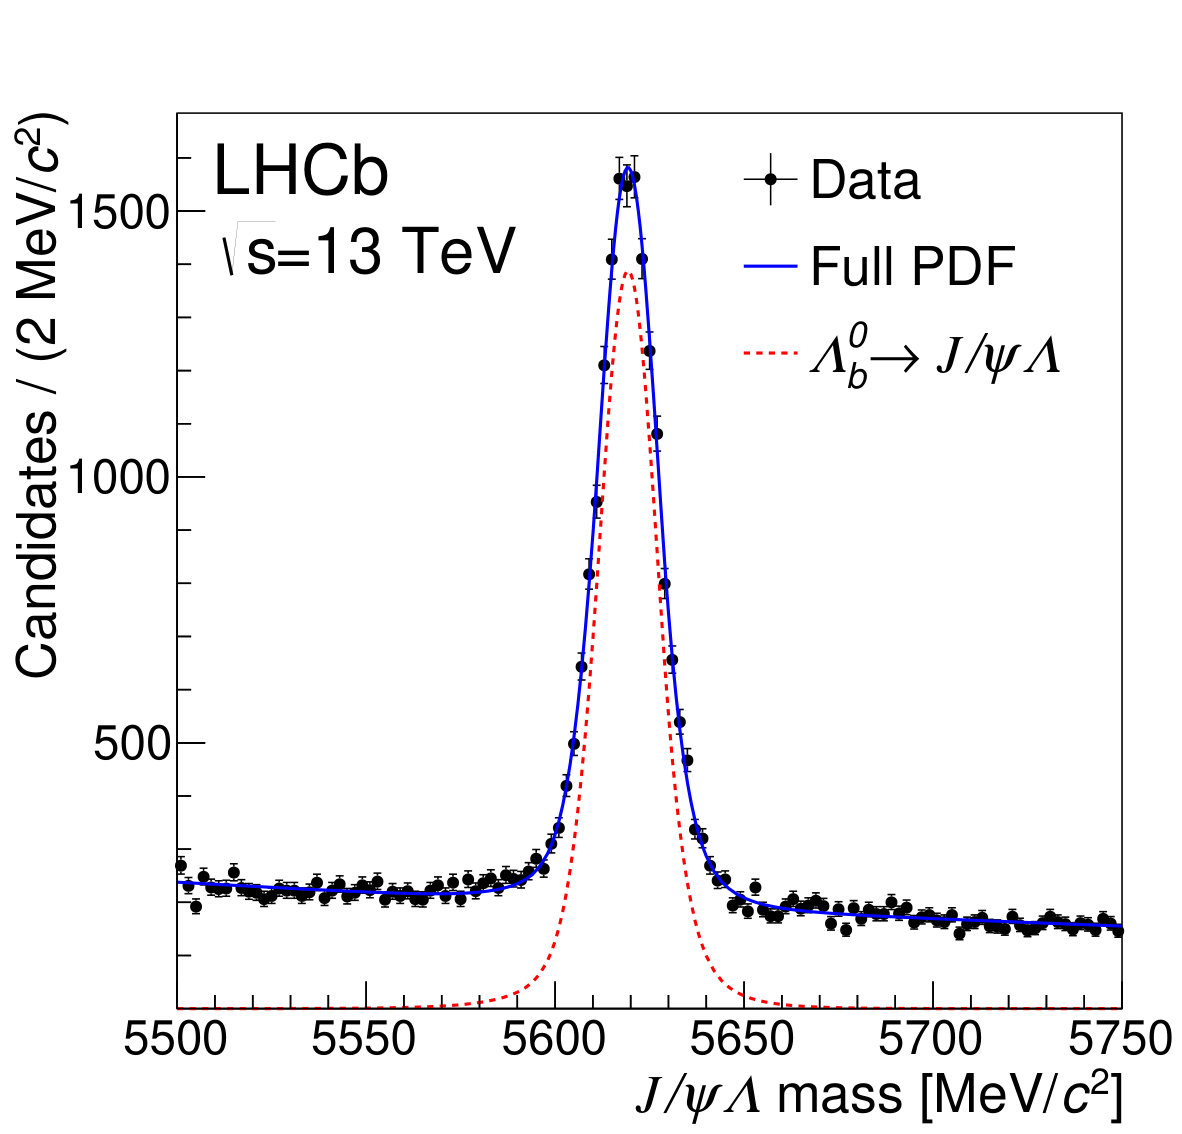 Figure 2
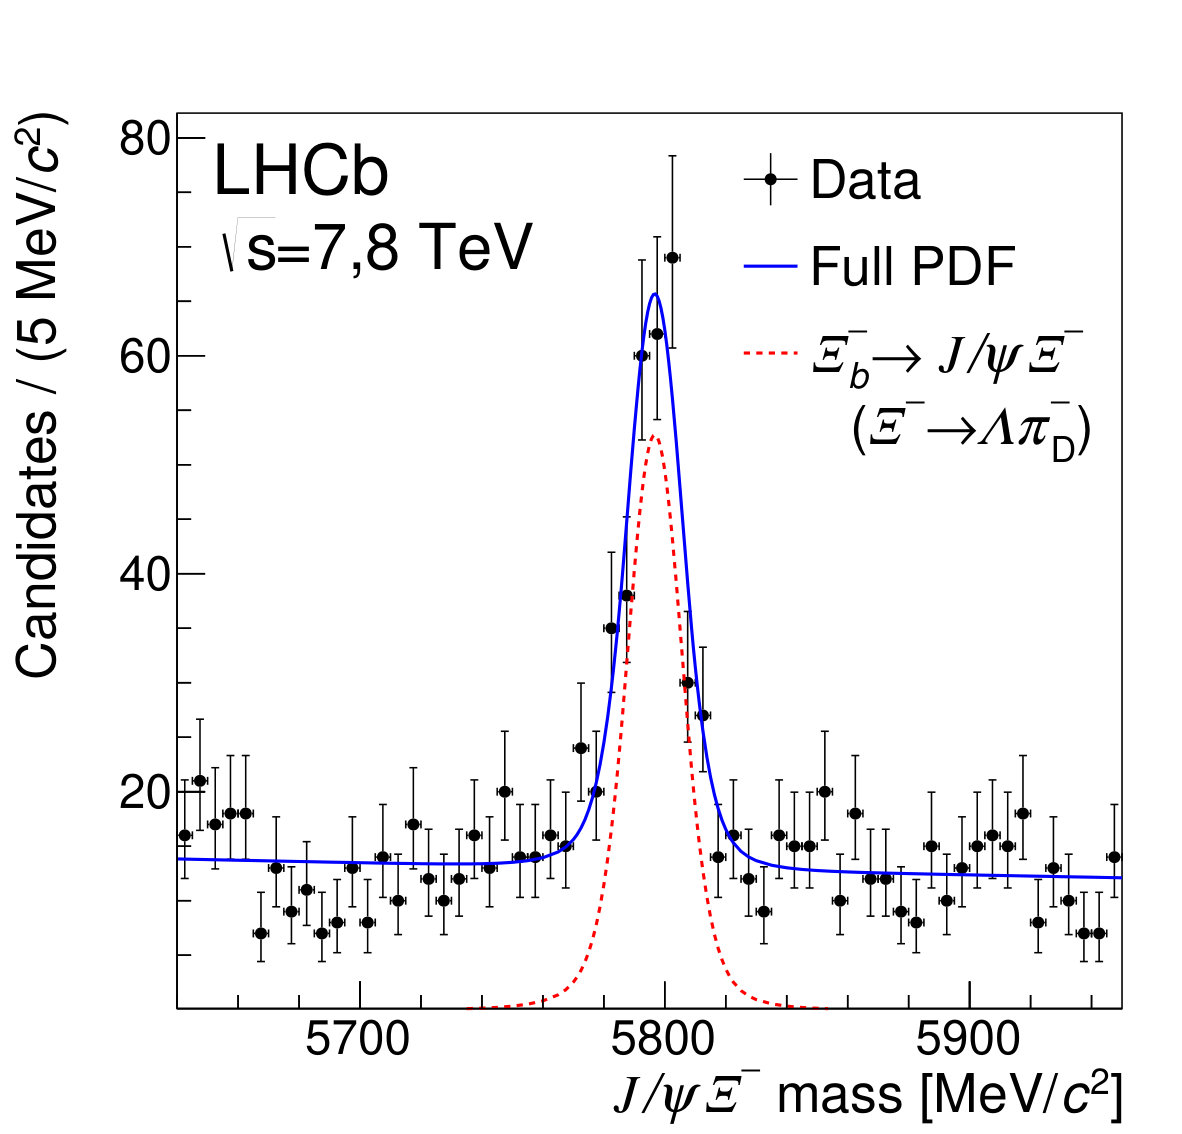 Figure 3
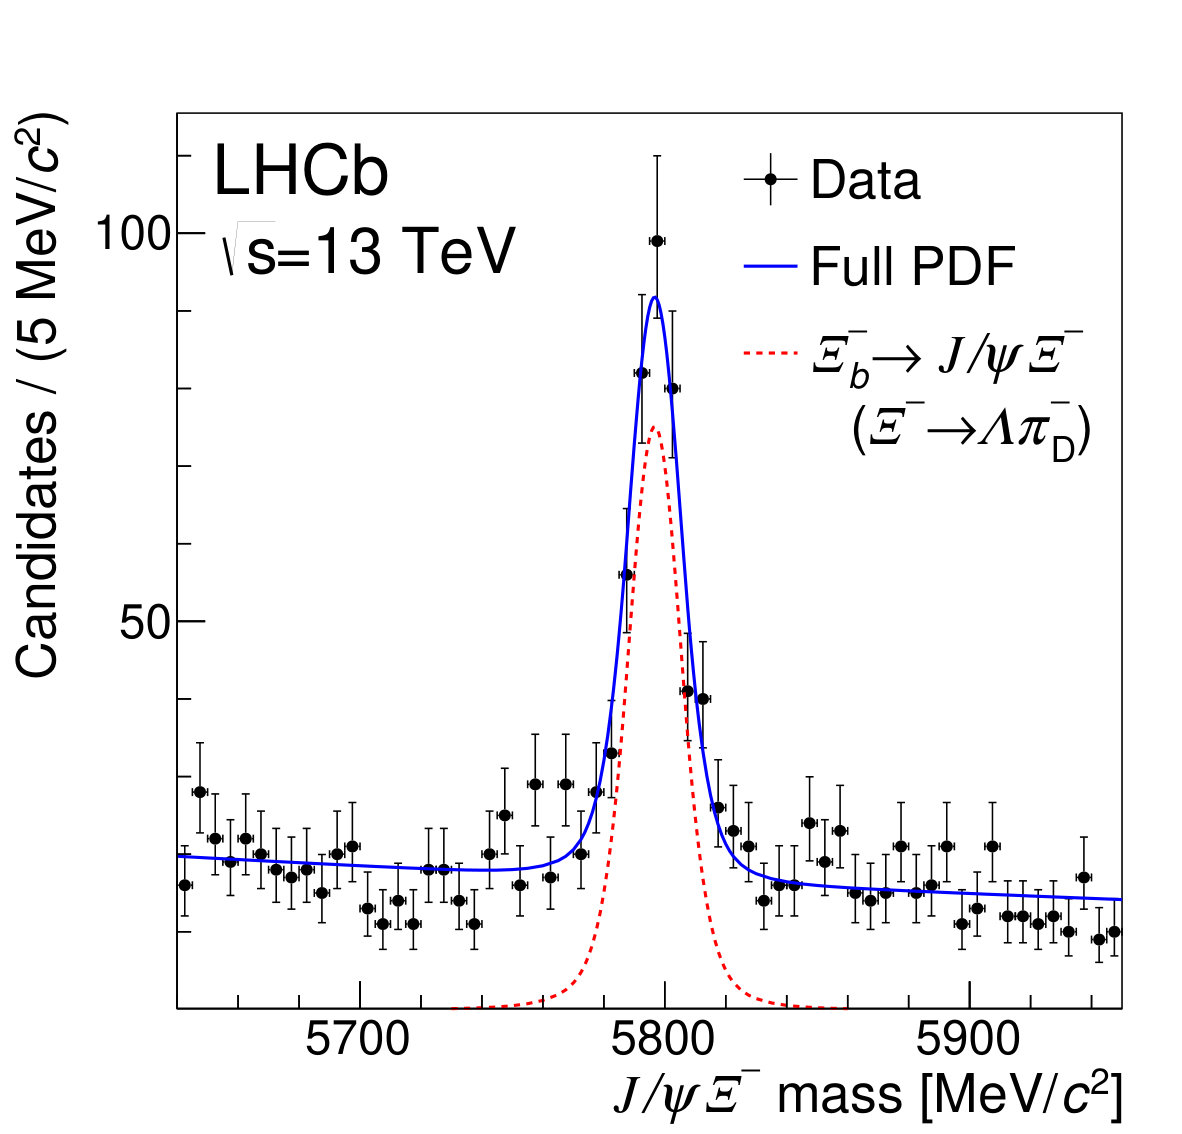 Figure 4
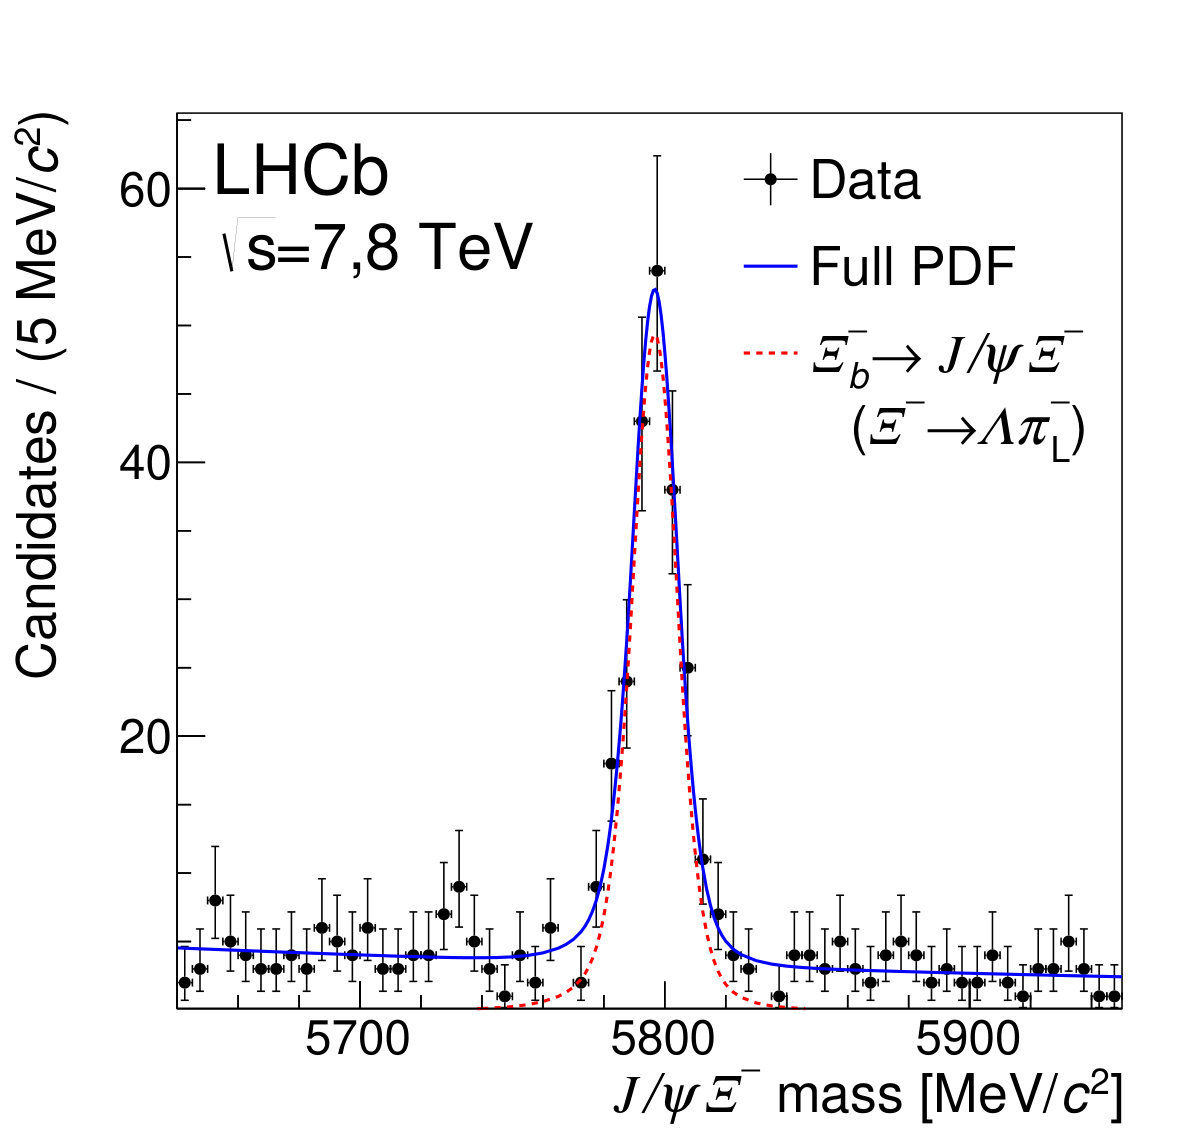 Figure 5
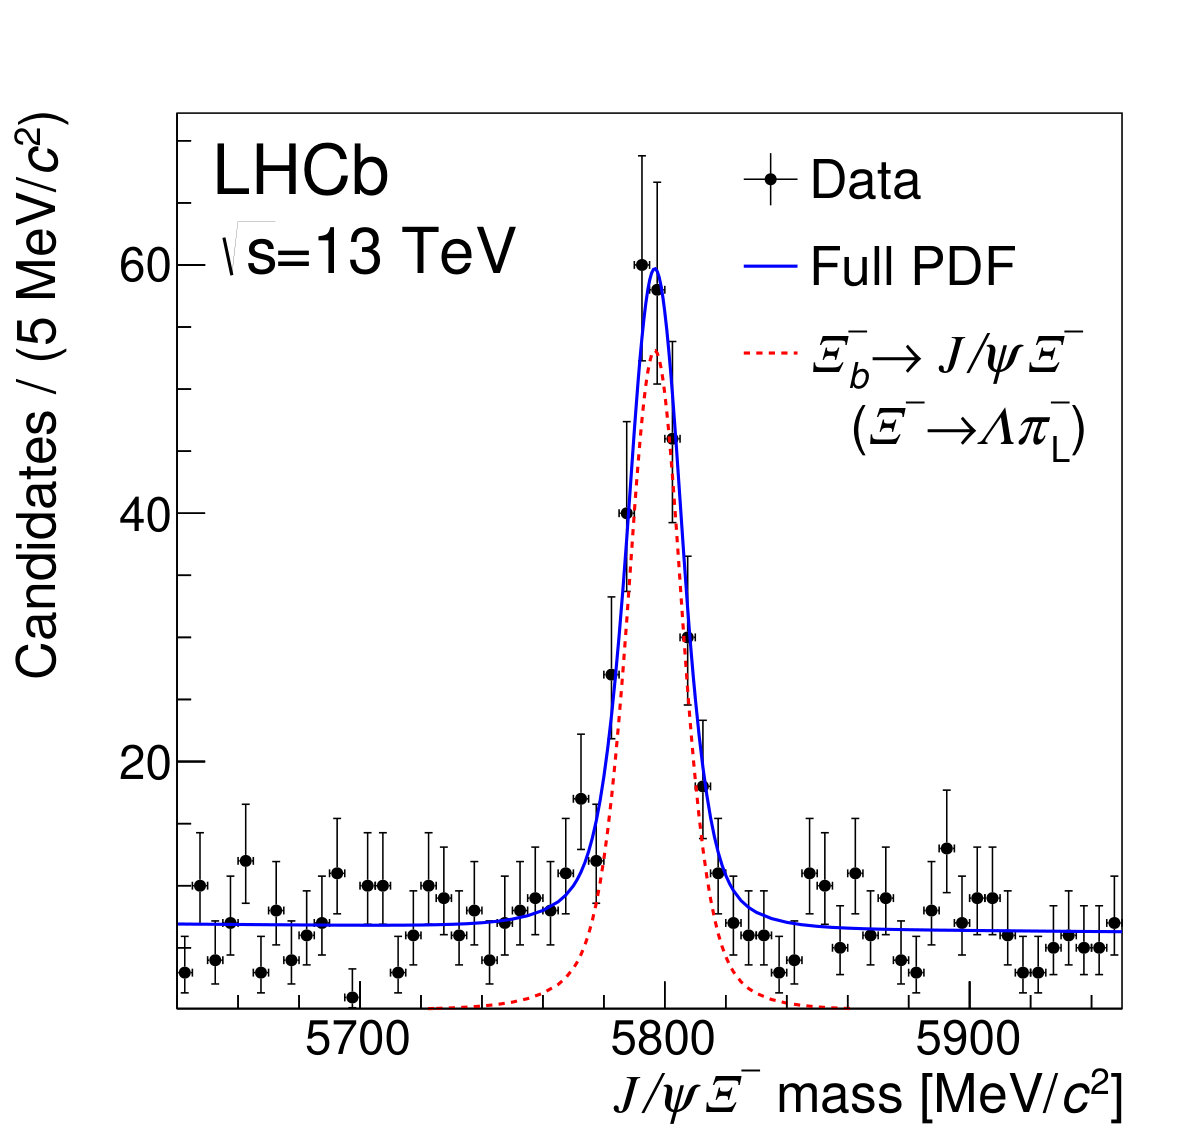 Figure 6
| TeV | 13 TeV | |
|---|---|---|
| (MeV/) |
| 7, 8 TeV | 13 TeV | |||
| Final state | ||||
| (%) | ||||
| (%) | ||||
| (%) | ||||
| () | ||||
| (%) | ||||
| Source | Value (%) |
|---|---|
| , polarization | 3.0 |
| Signal and background shape | 2.0 |
| production spectra | 3.0 |
| tracking efficiency | 4.5 |
| mass resolution & non-resonant | 3.0 |
| selections | 1.4 |
| lifetime | 0.5 |
| Simulated sample sizes | 2.0 |
| Total | 7.6 |
Peer Reviews
No public reviews on file for this paper yet. If you reviewed it on a platform where reviews are public (OpenReview, ICLR, NeurIPS, ICML), you can paste yours below so the community can read it here.
Videos
No videos yet. Explain this paper in a talk, walkthrough, or lecture? Add one.
EUROPEAN ORGANIZATION FOR NUCLEAR RESEARCH (CERN)
CERN-EP-2018-348
LHCb-PAPER-2018-047
Measurement of the mass and production rate of baryons
LHCb collaboration†††Authors are listed at the end of this paper.
The first measurement of the production rate of baryons in collisions relative to that of baryons is reported, using data samples collected by the LHCb experiment, and corresponding to integrated luminosities of 1, 2 and 1.6 at and 13 TeV, respectively. In the kinematic region and p_{\mathrm{T}}<20$$\text{\,Ge\kern-1.00006ptV\!/}c, we measure
[TABLE]
where and are the fragmentation fractions of quarks into and baryons, respectively, represents branching fractions, and the uncertainties are due to statistical and experimental systematic sources. The values of are obtained by invoking SU(3) symmetry in the and decays. Production asymmetries between and baryons are also reported.
The mass of the baryon is also measured relative to that of the baryon, from which it is found that
[TABLE]
where the last uncertainty is due to the precision on the known mass. This result represents the most precise determination of the mass.
Published in Phys. Rev. D99 052006 (2019)
© 2024 CERN for the benefit of the LHCb collaboration. CC-BY-4.0 licence.
The decays of beauty () quarks provide a sensitive probe of physics within, and beyond, the Standard Model. Due to the large production cross-section at the Large Hadron Collider, beauty hadrons of all species are abundantly produced. Measurements of branching fractions in specific decay channels are often needed in order to make quantitative comparisons to theoretical predictions. However, absolute branching fraction measurements at hadron colliders are difficult to perform without external input. Instead, one generally resorts to measuring a particular branching fraction relative to that of a topologically similar decay mode, frequently one that involves either a or a meson, whose absolute branching fractions are known from -factory measurements. When or branching fractions are measured relative to those of a decay, knowledge of the ratio of fragmentation fractions, for decays, or for decays, is required. Here, , and represents the rates at which a quark hadronizes into a , or hadron, respectively.
Theoretically, the most robust way to measure the -quark fragmentation fractions is to exploit the well tested prediction from heavy quark effective theory [1, 2, 3, 4, 5, 6, 7, 8] that, to first order, all hadrons containing a single heavy quark have equal semileptonic decay widths. Such analyses have been carried out by the LHCb experiment at [9] and 13 TeV [10], where it is found that and , averaged over the pseudorapidity () and transverse momentum () region and 3<p_{\mathrm{T}}<25$$\text{\,Ge\kern-1.00006ptV\!/}c. An alternative technique, which relies on factorization and SU(3) flavor symmetry in the and decays [11], has also been used to measure , yielding a value consistent with that obtained in semileptonic decays.
With the large samples of hadrons collected by the LHCb experiment, a number of new decay modes of , , and even baryons have been searched for, and in many cases have led to first observations [12, 13, 14, 15, 16, 17, 18, 19, 20]. However, when new decay modes of these baryons are observed, absolute branching fractions cannot be determined due to a lack of knowledge of the fragmentation fractions , and . For example, in one such measurement, evidence of the strangeness-changing weak decay is reported [16], with the result that . To compute the decay width and compare to theoretical predictions requires knowledge of the ratio .
In principle, the same procedure used to measure and can be applied to semileptonic and decays to measure and . However, an obstacle to such an analysis is the limited knowledge of absolute branching fractions for the decays of the or baryon. Recently, the Belle experiment published a first measurement of the absolute branching fractions for three decay modes, each with a relative precision of about 40% [21]. No such measurements exist yet for the baryon. Precise measurements of branching fractions for both and decays should be feasible in the Belle II experiment [22].
Production ratio measurements of the hadronic and decays [14], where both the and baryons are reconstructed in the final state, have been used to predict . In this case, theoretical estimates of are used, resulting in predictions of [23] and [24].
An alternative approach to either of these two methods is to exploit the decays and , where the baryon is detected in its decay to . Charge-conjugate processes are implicitly included. These decay rates are related through SU(3) flavor symmetry, where one finds [25, 26, 27]
[TABLE]
The ratio
[TABLE]
depends on , the partial decay widths, , and the lifetimes, , of the indicated baryons. Experimentally, is obtained from the ratio of efficiency-corrected yields
[TABLE]
where represents the detection efficiency and is the yield of the indicated decays.
In this article, we report a first measurement of the ratio in collision data collected by the LHCb experiment, corresponding to integrated luminosities of 1.0 at TeV, 2.0 at TeV and 1.6 at TeV. The measurement of , along with the SU(3) assumption in Eq. 1 and the known and baryon lifetimes [28], is used to infer the value of . The same data samples are also used to measure the production asymmetry between and baryons, and make the most precise measurement of the mass.
The LHCb detector [29, 30] is a single-arm forward spectrometer designed for the study of particles containing or quarks. The detector includes a high-precision tracking system consisting of a silicon-strip vertex detector surrounding the interaction region, a large-area silicon-strip detector located upstream of a dipole magnet with a bending power of about , and three stations of silicon-strip detectors and straw drift tubes placed downstream of the magnet. The tracking system provides a measurement of the momentum, , of charged particles with a relative uncertainty that varies from 0.5% at low momentum to 1.0% at 200. The minimum distance of a track to a primary vertex (PV), the impact parameter (IP), is measured with a resolution of , where is expressed in . Different types of charged hadrons are distinguished using information from two ring-imaging Cherenkov detectors. Photons, electrons and hadrons are identified by a calorimeter system consisting of scintillating-pad and preshower detectors, an electromagnetic and a hadronic calorimeter. Muons are identified by a system composed of alternating layers of iron and multiwire proportional chambers. The online event selection is performed by a trigger which consists of a hardware stage, based on information from the calorimeter and muon systems, followed by a software stage, which applies a full event reconstruction.
Simulation is required to model the effects of the detector acceptance and the imposed selection requirements. In the simulation, collisions are generated using Pythia [31, *Sjostrand:2007gs] with a specific LHCb configuration [33]. Decays of unstable particles are described by EvtGen [34], in which final-state radiation is generated using Photos [35]. The interaction of the generated particles with the detector, and its response, are implemented using the Geant4 toolkit [36, *Agostinelli:2002hh] as described in Ref. [38].
The and decays both contain a meson and a baryon in the decay chain, and are kinematically similar. To reduce systematic uncertainties, selection requirements are tailored to exploit the common particles in the final state of the and decays. At the trigger level, both modes are required to satisfy requirements based solely on the decay. Firstly, the hardware stage must register either a single high- muon or a pair. The software stage [39] then requires a pair whose decay vertex is displaced from all PVs in the event, and that has an invariant mass consistent with the known mass [28].
Selected events may contain more than one PV. Each particle is associated to the PV for which the corresponding value of is smallest, where is defined as the difference in the vertex-fit of a given PV reconstructed with and without the particle under consideration.
In the offline analysis, each muon must have in excess of 550 and have IP to all PVs in the event that exceeds approximately three times the expected uncertainty. The pair must form a good-quality vertex and have an invariant mass within 40 of the known mass, corresponding to about three times the mass resolution.
Reconstructed charged particles are classified into two categories in this analysis. The long category refers to tracks that have reconstructed segments in both the vertex detector and the tracking stations upstream and downstream of the LHCb magnet. The downstream category consists of those tracks that are not reconstructed in the vertex detector, and thus only include information from the tracking detectors just before and after the LHCb magnet. While most of the reconstructed particles from the interactions are in the long category, the decay products of long-lived strange particles tend to be mostly reconstructed as downstream tracks. Because of the presence of vertex detector measurements, the trajectories, and hence the IP, of long tracks are measured with better precision than those of downstream tracks.
Candidate decays are formed by combining downstream and candidates with in excess of 500 and 100, respectively. Both tracks are required to be significantly detached from all PVs in the event, and together they must form a good-quality vertex and must satisfy the requirement |M(p{{\pi}^{-}})-m_{{\mathchar 28931\relax}}|<8$$\text{\,Me\kern-1.00006ptV\!/}c^{2}, corresponding to approximately three times the mass resolution. Here and throughout the text, represents an invariant mass and represents the known mass of the indicated particle [28].
The baryon is reconstructed through its decay to . Due to the long and lifetimes, only candidates formed from downstream tracks are used, as they contribute about 90% to the sample in decays. To maintain a uniform selection, the same requirement is imposed on decays in the mode. The meson from the decay may be reconstructed as either a long or a downstream track. For the mass and production asymmetry measurements, both categories are used. However, for the measurement of , only the long-track sample is used, since the efficiency for detecting the meson in the decay enters directly in Eq. 3, and long-track efficiencies have been precisely calibrated using a tag-and-probe method [40]. No explicit momentum requirement is applied to the meson, since it typically has low momentum. When necessary, the notation and is used to distinguish between long (L) and downstream (D) tracks. Tracks in the sample are required to be significantly detached from all PVs in the event, corresponding to a requirement that the impact parameter exceeds about four times the corresponding uncertainty; no such requirement is necessary on the sample. Exploiting the large baryon lifetime, candidates must have ps, where is the decay time measured relative to the associated PV. Lastly, candidates are required to satisfy the mass requirement |M({\mathchar 28931\relax}\pi^{-}_{\rm L,D})-M(p{{\pi}^{-}})+m_{{\mathchar 28931\relax}}-m_{{{\mathchar 28932\relax}^{-}}}|<10$$\text{\,Me\kern-1.00006ptV\!/}c^{2}, corresponding to about three times the mass resolution, and have positive decay time, measured relative to the decay vertex.
The () candidates are formed by combining and () candidates. A vertex fit of good quality is required. To suppress background from prompt production, the hadron is required to have a reconstructed decay time larger than 0.2 ps, which is about four times the resolution. Finally, to have a well-defined fiducial region, the and candidates are required to be within the kinematic region and p_{\mathrm{T}}<20$$\text{\,Ge\kern-1.00006ptV\!/}c. Multiple candidates in a single event occur in less than 1% of selected events, and all candidates are kept. To improve the mass resolution, an additional kinematic fit is performed on each candidate, employing both vertex and mass constraints on the , and candidates [41]. The resulting mass resolution is about 8 for both modes.
The invariant-mass spectra of selected and candidates are shown in Fig. 1. The data are partitioned into the combined 7, 8 TeV data samples and the 13 TeV data sample, and show the distributions for candidates, and candidates formed from either long or downstream pions. A simultaneous fit to all six distributions is performed in order to determine the signal yields. Each of the signal shapes is described by the sum of two Crystal Ball (CB) functions [42] with a common peak position and a common width. The tail parameters, which describe the non-Gaussian portion of the signal on either side of the signal peak, are independent for the two CB components. The parameters of the signal shape are determined from large samples of simulated signal decays. The background is described by an exponential function, with the shape parameter left free in the fit to data.
The signal-shape fit parameters are: (i) the peak positions, , of the mass in the 7, 8 TeV and 13 TeV data, (ii) a single mass difference, , and (iii) a scale factor applied to the simulated width of the CB functions, which allows the mass resolution in data to be slightly different than in simulation. The values of are allowed to differ for the 7, 8 TeV data and the 13 TeV data, since the statistical uncertainty on each is about four times smaller than the systematic uncertainty from the momentum scale calibration [43]. However, that same calibration renders the corresponding uncertainty on negligible.
The fitted signal yields and the values of are shown in Table 1. From the fit, it is determined that
[TABLE]
where the uncertainties are statistical only, and we have used , with m_{{{\mathchar 28931\relax}^{0}_{b}}}=5619.60\pm 0.17$$\text{\,Me\kern-1.00006ptV\!/}c^{2} [28]. The value of is corrected by +0.12\pm 0.06$$\text{\,Me\kern-1.00006ptV\!/}c^{2} to account for a bias observed in the obtained value of , as seen in the fit to large samples of simulated signal decays. The uncertainty on this value is due to the size of the simulated samples.
The ratio of efficiencies in Eq. 3 is determined from weighted simulations of the signal decays. The simulation is weighted in bins of (, ) of the baryon to reproduce the 2D distribution observed in the data, after the background contribution is subtracted using the sPlot method [44]. We assume that the spectrum is the same as that of the , and variations are investigated when assessing systematic uncertainties. By studying the distributions of the fraction of the momentum carried by the decay products in each part of the decay chain, it is found that the simulation differs from the corresponding spectra observed in data. The simulation is weighted to match the distributions observed in data for the momentum ratio and the momentum asymmetry in the decay. After this weighting is applied, a large number of other observables are compared, such as decay times, flight distances, , and , and good agreement is found between both and data and simulation. For the sample, only the and weights are needed to obtain good agreement with the data.
The resulting efficiencies are summarized in Table 2. The efficiencies associated with the detector acceptance, the reconstruction and selection, and the trigger requirements are given, along with the total selection efficiencies. The relative efficiency is approximately 14% for both the 7, 8 TeV and 13 TeV data sets. For the 7, 8 TeV values, the efficiencies represent the weighted average value. This small value is due to the combination of the relatively low momentum and usage of only long tracks for the meson in the decay.
From the signal yields and relative efficiencies, the ratios are computed to be
[TABLE]
where the uncertainties are statistical only.
The difference between the and baryon production asymmetries is determined using the relation
[TABLE]
where is the raw yield asymmetry between the and and decays. In the difference of the raw yield asymmetries, the detection asymmetry cancels since the kinematical properties are similar. The detection asymmetry, , has been measured [45, 46], and, while it is consistent with zero, an asymmetry of up to about 1% in this low momentum region cannot be discounted. In the above expression, it is expected, and assumed, that there is no direct violation in these decays.
The raw yield asymmetries are obtained by fitting for the signal yields separately for the beauty baryon and antibaryon subsamples. The fit is similar to that which was described previously, except that the CB width scale factors are fixed to the values obtained from the fit to the full sample, since the mass resolution can be assumed to be the same for the baryons and antibaryons. The fitted signal yields are shown in Table 3, along with the resulting raw asymmetries.
The difference in production asymmetries are readily found to be
[TABLE]
where the uncertainties are due to the signal yields obtained in this analysis.
To obtain , previous measurements of at and 8 TeV are used [47]. Since the value of averaged over the LHCb acceptance is not expected to change significantly with center-of-mass energy [48], and the measured values of obtained at and 8 TeV are compatible [47], they are averaged, taking the systematic uncertainties as fully correlated, to obtain . An alternate measurement of yielded results that are consistent with the above value [49]. The value at 7, 8 TeV is also used for the asymmetry measurement at 13 TeV, and a systematic uncertainty, which is discussed below, is assigned. The asymmetries are found to be
[TABLE]
In the mass measurement, most sources of systematic uncertainty cancel, since it relies on the mass difference, . The modulus of the correction of 0.12 described previously is assigned as a systematic uncertainty. The signal shape uncertainty is quantified by performing an alternate fit using the sum of two Gaussian functions. Apart from a common peak value, all shape parameters are left free in the fit. The difference with respect to the nominal value, 0.06, is assigned as a systematic uncertainty. The background shape uncertainty is assessed by using a first-order polynomial in place of the nominal exponential function, and is found to change the result by 0.01. The systematic uncertainties due to the momentum scale and energy loss have been evaluated previously [50] and are found to contribute 0.01 each. Knowledge of the mass contributes an uncertainty of 0.07. Adding these uncertainties in quadrature, the total systematic uncertainty on is 0.15.
For the measurement of , several sources of uncertainty are considered, which are summarized in Table 4. The efficiency for all decay products to be within the LHCb acceptance is derived from the simulation, and could depend on the polarization of the or baryon. To investigate this effect, variations in the and polarization are considered, including full polarization, zero polarization, and using the helicity amplitudes presented in Ref. [51]. All three variations are found to give statistically compatible acceptance corrections. The assigned uncertainty of 3.0% reflects the statistical precision of the test.
The systematic uncertainty due to the signal and background functions is estimated by using alternate choices for each, as described above for the uncertainty on , leading to an uncertainty of 2.0%. The and simulations are weighted as discussed previously and reproduce well the kinematical distributions of the final-state particles seen in data. However, due to low signal yields, variations with respect to the nominal weighting are considered. In particular, a 3% change in the relative efficiency is seen when applying an additional weight to the pseudorapidity spectrum that is permissible by the data. A significantly smaller difference is seen when weighting the baryon’s spectrum. A 3% uncertainty is therefore assigned to account for potential differences in the spectrum of and baryons.
Uncertainties in the detection efficiency of the meson from the decay enters directly into the result for the ratio . The tracking efficiency in simulation has been calibrated using a tag-and-probe method [40] using decays, however, the calibration only covers the kinematic region p>5$$\text{\,Ge\kern-1.00006ptV\!/}c and . Outside this region, no correction to the tracking efficiency in simulation is applied and an uncertainty of 5% is assigned to the tracking efficiency. This value is justified based upon a comparison of the reconstructed momentum spectrum of mesons from decays in data and simulation, where the baryons are formed from long tracks. These tracks serve as a good proxy for the meson from baryon decay, since they also have low momentum and large impact parameter. Averaging over the tracks within and outside the range covered by the tracking calibration, an uncertainty of 4.5% on the tracking efficiency is obtained. As a cross-check, the analysis is repeated using only candidates in the range covered by the calibration, and the values are consistent with the nominal results.
Potential uncertainties due to the mass requirement may arise from differences in the mass resolution, or possibly a (Cabibbo-suppressed) nonresonant contribution. To quantify the potential size of such effects, the signal yield in the sideband region, 10<|M({\mathchar 28931\relax}\pi^{-}_{\rm L,D})-M(p{{\pi}^{-}})+m_{{\mathchar 28931\relax}}-m_{{{\mathchar 28932\relax}^{-}}}|<20$$\text{\,Me\kern-1.00006ptV\!/}c^{2} is measured. The yield in that region, which is consistent with zero, is taken as a systematic uncertainty. Other selections are very loose and are studied by comparing background-subtracted distributions of relevant variables in data with those in simulation. From the observed differences an uncertainty of 1.4% is assigned. The uncertainty on due to the knowledge of the lifetime, ps [28], is estimated by weighting the simulation to replicate 0.04 ps shorter and longer lifetimes. The effect on of the lifetime uncertainty is negligible. Lastly, the simulated sample sizes contribute 2.0% uncertainty to the relative efficiency.
The uncertainty on the production asymmetry receives contributions from the detection asymmetry and the measurement of . The pion detection asymmetry uncertainty is assigned to be 1%, as mentioned previously. Taking the sum in quadrature of the statistical and systematic uncertainties in the value of , a 1.7% systematic uncertainty is assigned. Since the average value of at and 8 TeV [47] could differ from that at 13 TeV [48], an additional systematic uncertainty of 1.5% is assigned to the measured value of at 13 TeV. The total systematic uncertainty in is therefore 1.9% and 2.5% for the 7, 8 TeV and 13 TeV data samples, respectively.
In summary, data samples collected at = 7, 8 and 13 TeV have been used to measure the ratio of production rates of and baryons in the pseudorapidity and region, and p_{\mathrm{T}}<20$$\text{\,Ge\kern-1.00006ptV\!/}c, to be
[TABLE]
where the uncertainties are statistical and systematic. From the values of , the ratios of fragmentation fractions are determined to be
[TABLE]
The last uncertainty, due to the assumed SU(3) flavor symmetry and taken to be 30%, is an estimate of the typical size of SU(3)-breaking effects between decays related by this symmetry. The LHCb results show no significant dependence on the center-of-mass energy in the 7 to 13 TeV range. These results are consistent with the predictions in Refs. [23, 24], which used production ratio measurements of and decays at 7 and 8 TeV [14] and an estimated value for . Assuming that , these results indicate that in the forward region, quarks fragment into baryons at about 15% of the rate at which they fragment into baryons. Previous measurements of by the CDF [52] and D0 [53] collaborations are about two standard deviations larger than the results reported here, however, those measurements are performed in collisions at TeV and in the central rapidity region .
The mass difference, , and the corresponding value of the mass, , are measured to be
[TABLE]
where the last uncertainty is due to the mass. This mass measurement includes the data used in Ref. [50], and therefore supersedes those results. This measurement represents the most precise determination of the mass, and is consistent with the previous most precise measurement of the mass difference of 178.36\pm 0.46\pm 0.16$$\text{\,Me\kern-1.00006ptV\!/}c^{2} [15].
The production asymmetry is also measured for the first time. The values at the lower and higher center-of-mass energies, are
[TABLE]
The asymmetries are consistent with zero at the level of a few percent.
Acknowledgements
We thank M. Voloshin for interesting and helpful discussions on theoretical aspects of this work. We express our gratitude to our colleagues in the CERN accelerator departments for the excellent performance of the LHC. We thank the technical and administrative staff at the LHCb institutes. We acknowledge support from CERN and from the national agencies: CAPES, CNPq, FAPERJ and FINEP (Brazil); MOST and NSFC (China); CNRS/IN2P3 (France); BMBF, DFG and MPG (Germany); INFN (Italy); NWO (Netherlands); MNiSW and NCN (Poland); MEN/IFA (Romania); MSHE (Russia); MinECo (Spain); SNSF and SER (Switzerland); NASU (Ukraine); STFC (United Kingdom); NSF (USA). We acknowledge the computing resources that are provided by CERN, IN2P3 (France), KIT and DESY (Germany), INFN (Italy), SURF (Netherlands), PIC (Spain), GridPP (United Kingdom), RRCKI and Yandex LLC (Russia), CSCS (Switzerland), IFIN-HH (Romania), CBPF (Brazil), PL-GRID (Poland) and OSC (USA). We are indebted to the communities behind the multiple open-source software packages on which we depend. Individual groups or members have received support from AvH Foundation (Germany); EPLANET, Marie Skłodowska-Curie Actions and ERC (European Union); ANR, Labex P2IO and OCEVU, and Région Auvergne-Rhône-Alpes (France); Key Research Program of Frontier Sciences of CAS, CAS PIFI, and the Thousand Talents Program (China); RFBR, RSF and Yandex LLC (Russia); GVA, XuntaGal and GENCAT (Spain); the Royal Society and the Leverhulme Trust (United Kingdom); Laboratory Directed Research and Development program of LANL (USA).
The reference list from the paper itself. Each links out to its DOI / PubMed record.
- 1[1] V. A. Khoze and M. A. Shifman, Heavy quarks , Sov. Phys. Usp. 26 (1983) 387 · doi ↗
- 2[2] I. I. Bigi and N. G. Uraltsev, Gluonic enhancements in non-spectator beauty decays − - an inclusive mirage though an exclusive possibility , Phys. Lett. B 280 (1992) 271 · doi ↗
- 3[3] I. I. Bigi, N. G. Uraltsev, and A. I. Vainshtein, Nonperturbative corrections to inclusive beauty and charm decays. QCD versus phenomenological models , Phys. Lett. B 293 (1992) 430 , Erratum ibid. B 297 (1992) 477 , ar Xiv:hep-ph/9207214 · doi ↗
- 4[4] B. Blok and M. Shifman, The rule of discarding 1/ N c subscript 𝑁 𝑐 N_{c} in inclusive weak decays (I) , Nucl. Phys. B 399 (1993) 441 , ar Xiv:hep-ph/9207236 · doi ↗
- 5[5] B. Blok and M. Shifman, The rule of discarding 1/ N c subscript 𝑁 𝑐 N_{c} in inclusive weak decays (II) , Nucl. Phys. B 399 (1993) 459 , ar Xiv:hep-ph/9209289 · doi ↗
- 6[6] M. Neubert, B decays and the heavy quark expansion , Adv. Ser. Direct. High Energy Phys. 15 (1998) 239 , ar Xiv:hep-ph/9702375 · doi ↗
- 7[7] N. Uraltsev, Heavy quark expansion in beauty and its decays , ar Xiv:hep-ph/9804275 , also published in proceedings, Heavy Flavour Physics: A Probe of Nature’s Grand Design, Proc. Intern. School of Physics “Enrico Fermi”, Course CXXXVII, Varenna, July 7-18 1997
- 8[8] G. Bellini, I. I. Y. Bigi, and P. J. Dornan, Lifetimes of charm and beauty hadrons , Phys. Rept. 289 (1997) 1 · doi ↗