Wideband on-chip terahertz spectrometer based on a superconducting filterbank
Akira Endo, Kenichi Karatsu, Alejandro Pascual Laguna, Behnam Mirzaei,, Robert Huiting, David J. Thoen, Vignesh Murugesan, Stephen J. C. Yates, Juan, Bueno, Nuri van Marrewijk, Sjoerd Bosma, Ozan Yurduseven, Nuria Llombart,, Junya Suzuki, Masato Naruse, Pieter J. de Visser

TL;DR
This paper presents a superconducting chip-based wideband terahertz spectrometer with 45 GHz bandwidth, high spectral resolution, and photon-noise limited sensitivity, suitable for rapid, sensitive spectroscopic applications.
Contribution
The development of a compact, on-chip superconducting spectrometer with wide bandwidth and high resolution using a filterbank and microwave kinetic inductance detectors.
Findings
Achieved 45 GHz instantaneous bandwidth centered at 350 GHz.
Demonstrated photon-noise limited sensitivity.
Successfully detected methanol emission lines.
Abstract
Terahertz spectrometers with a wide instantaneous frequency coverage for passive remote sensing are enormously attractive for many terahertz applications, such as astronomy, atmospheric science and security. Here we demonstrate a wide-band terahertz spectrometer based on a single superconducting chip. The chip consists of an antenna coupled to a transmission line filterbank, with a microwave kinetic inductance detector behind each filter. Using frequency division multiplexing, all detectors are read-out simultaneously creating a wide-band spectrometer with an instantaneous bandwidth of 45 GHz centered around 350 GHz. The spectrometer has a spectral resolution of and reaches photon-noise limited sensitivity. We discuss the chip design and fabrication, as well as the system integration and testing. We confirm full system operation by the detection of an emission line…
Click any figure to enlarge with its caption.
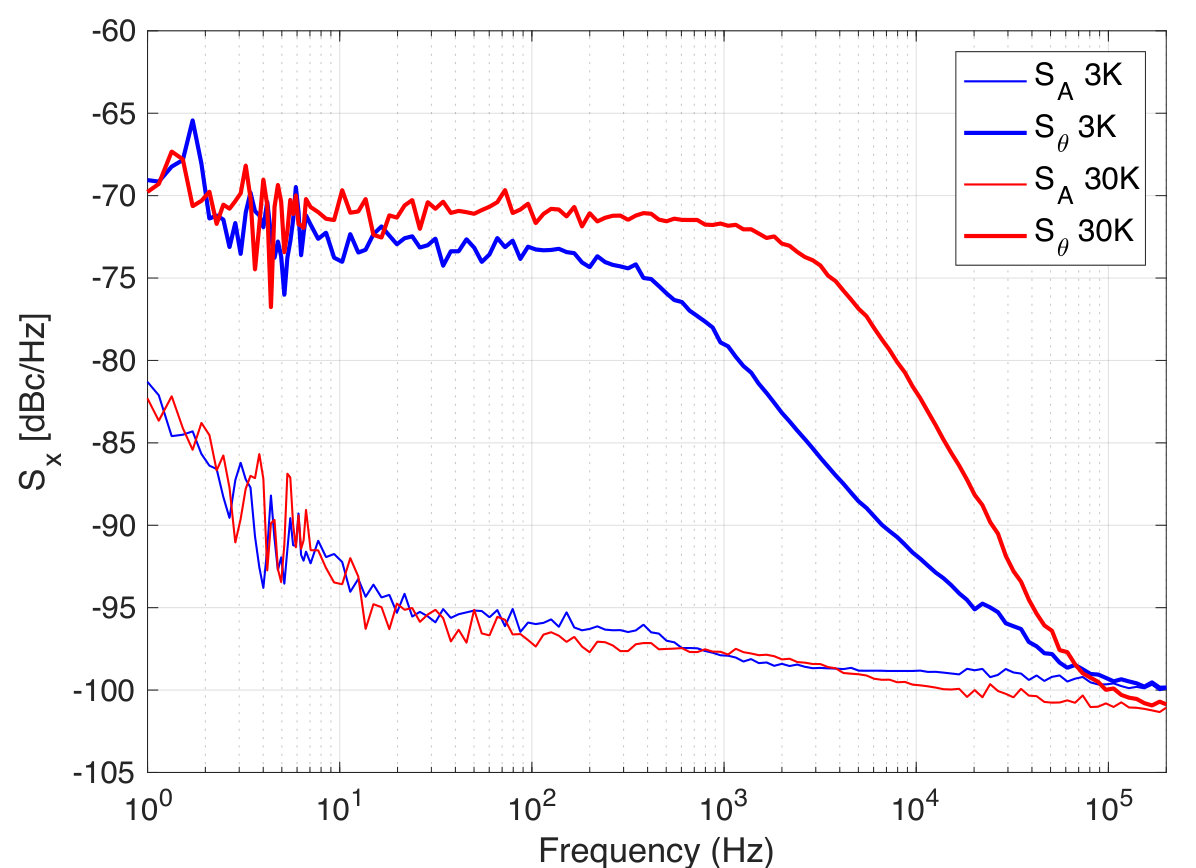 Figure 1
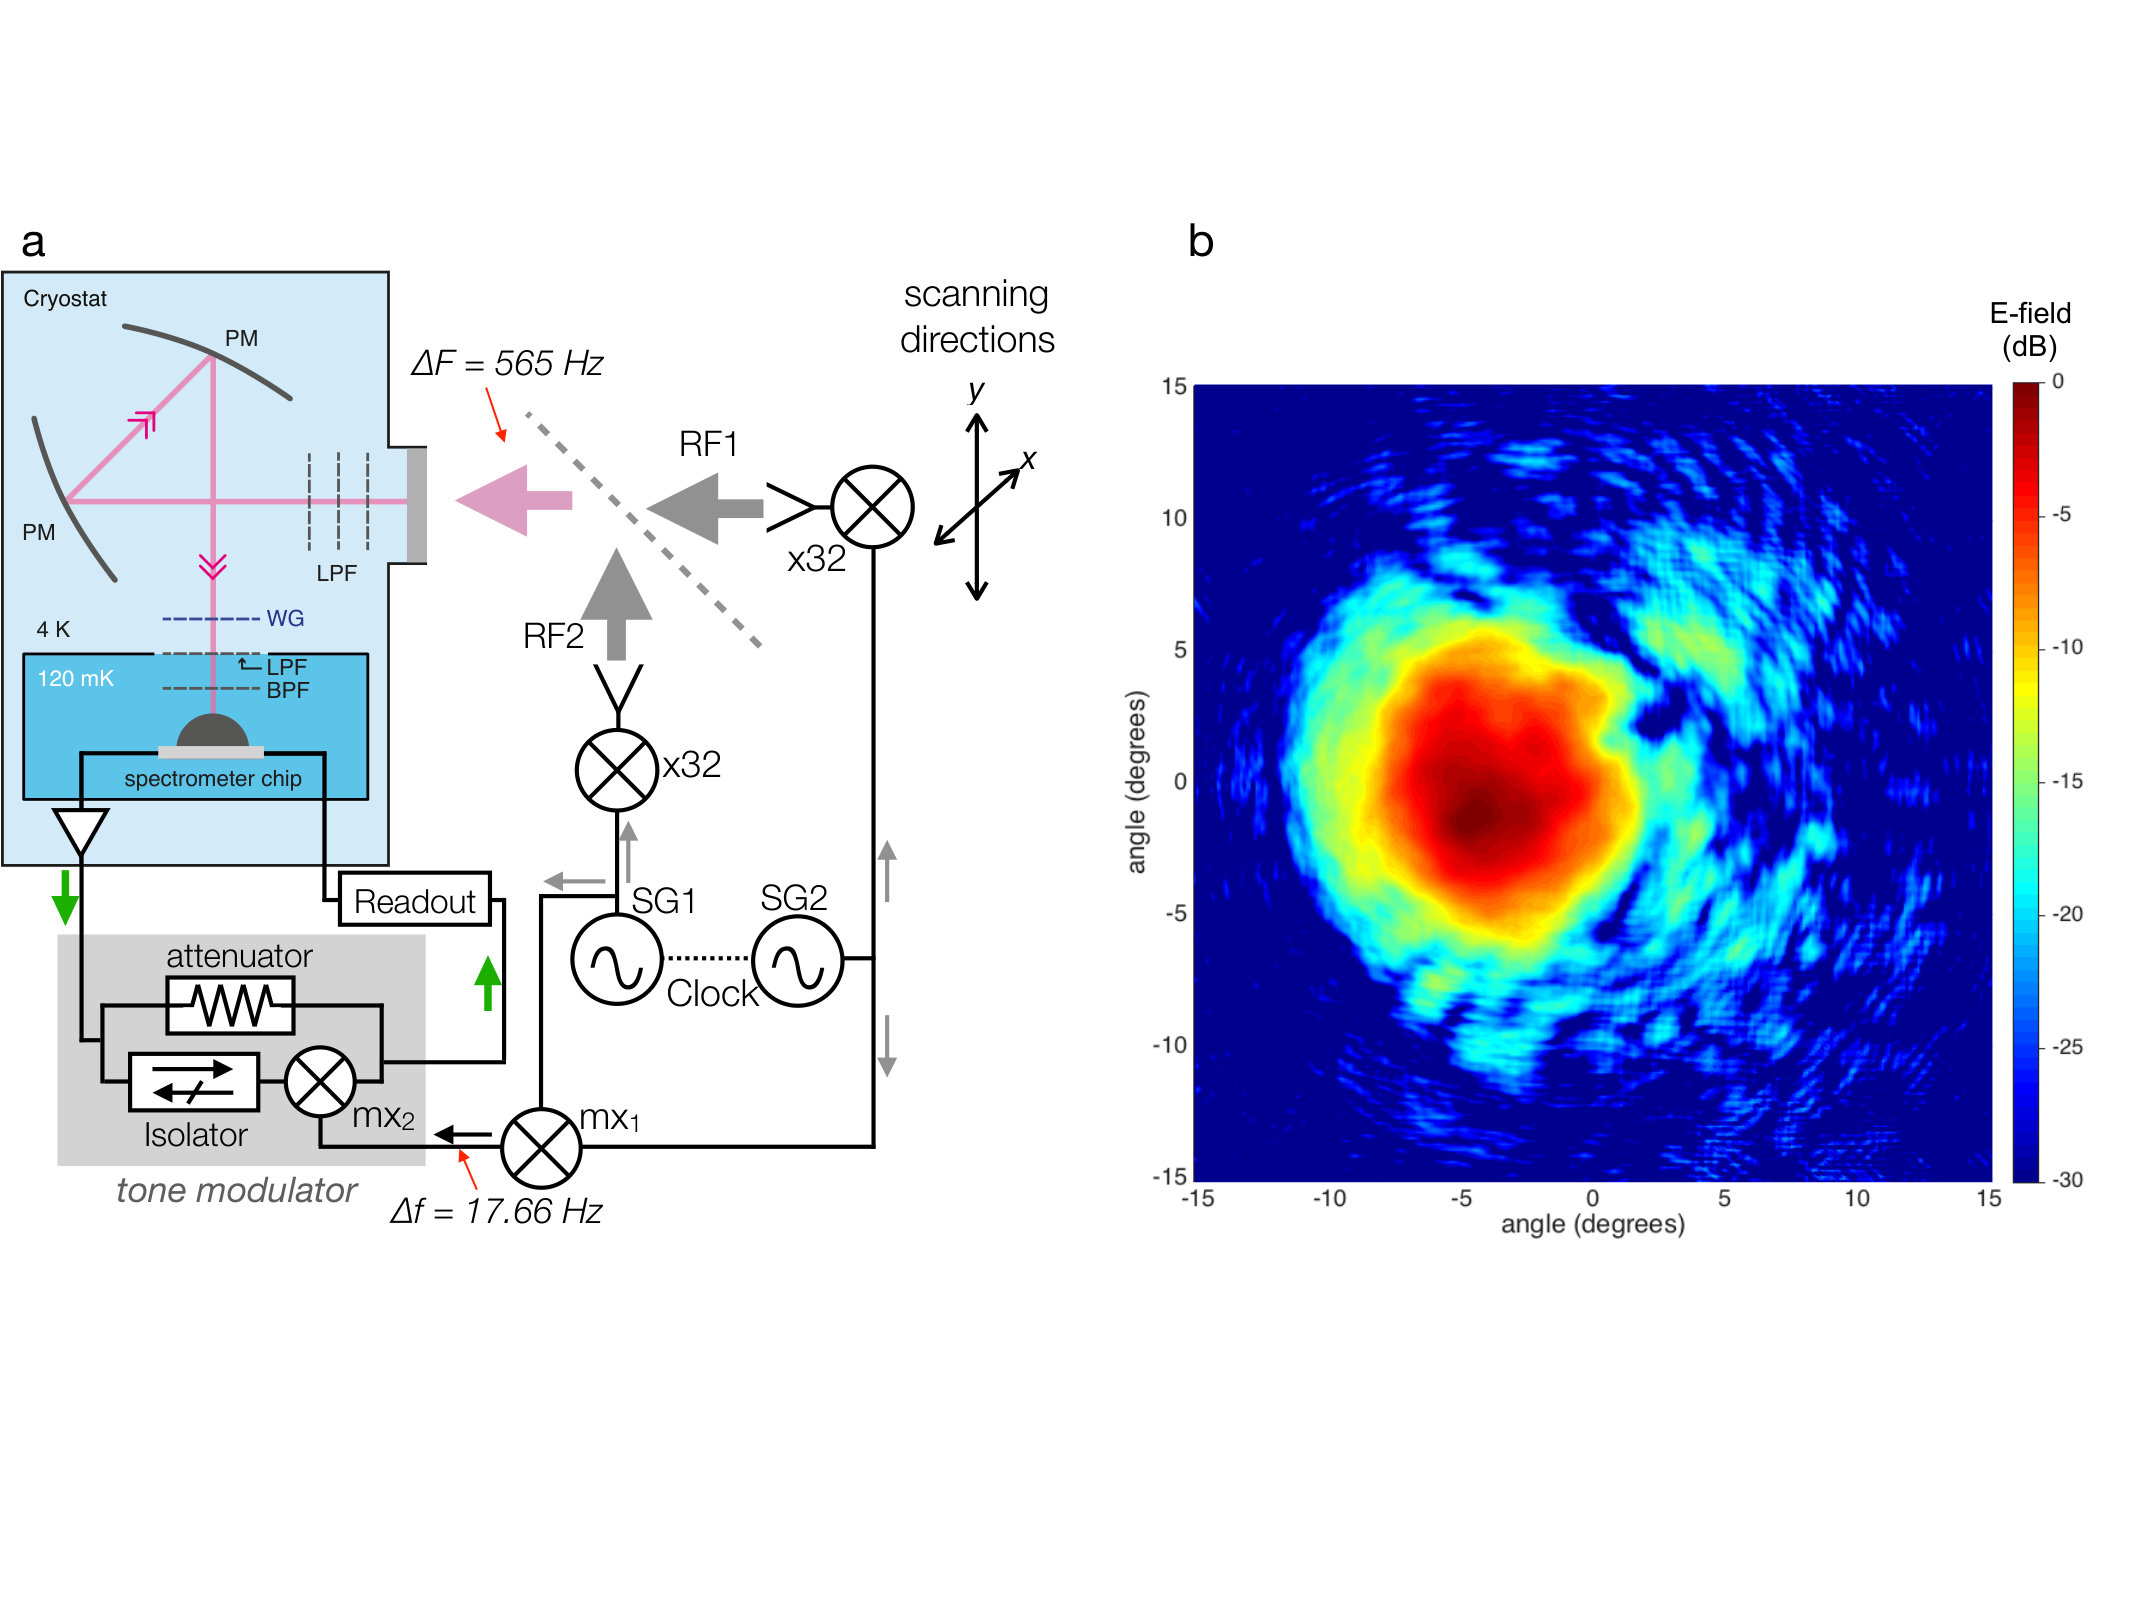 Figure 2
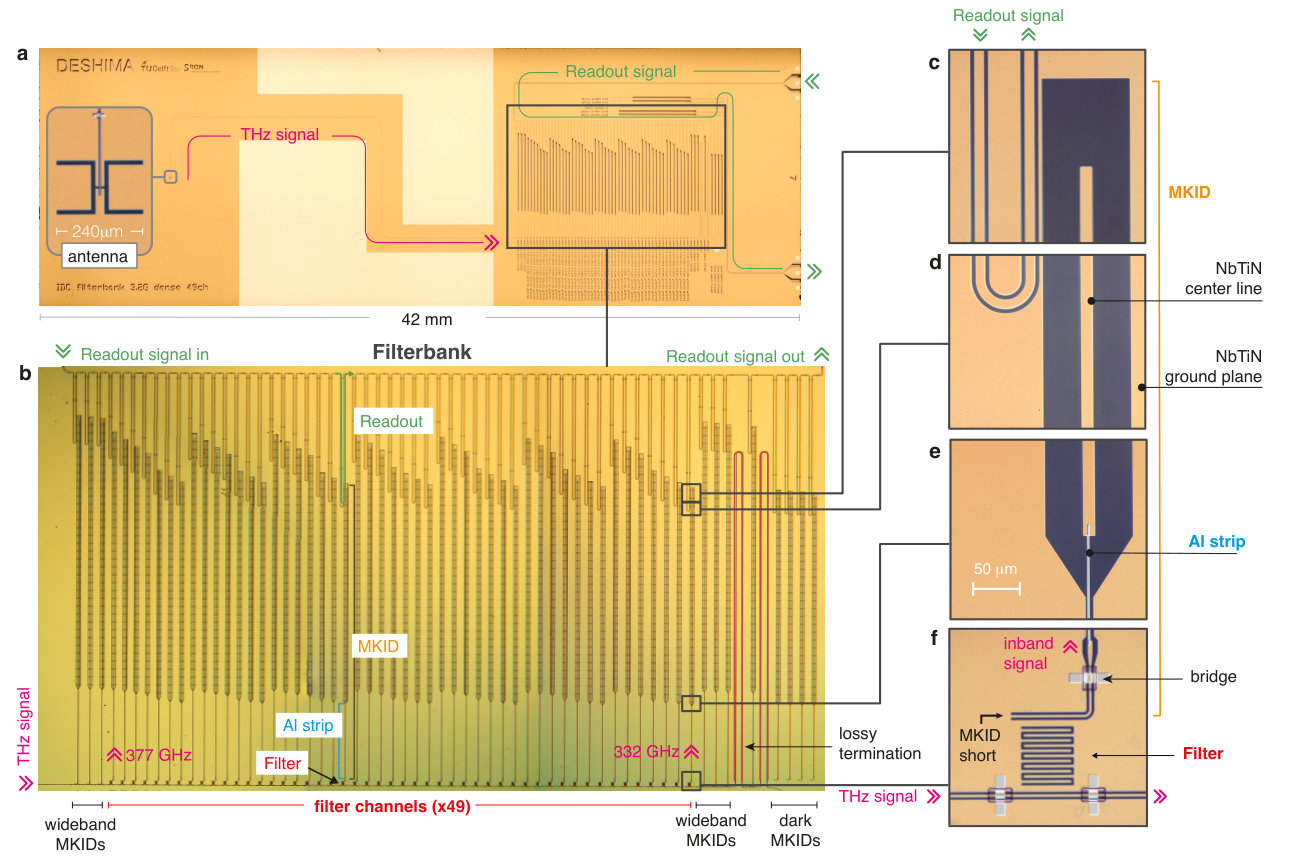 Figure 3
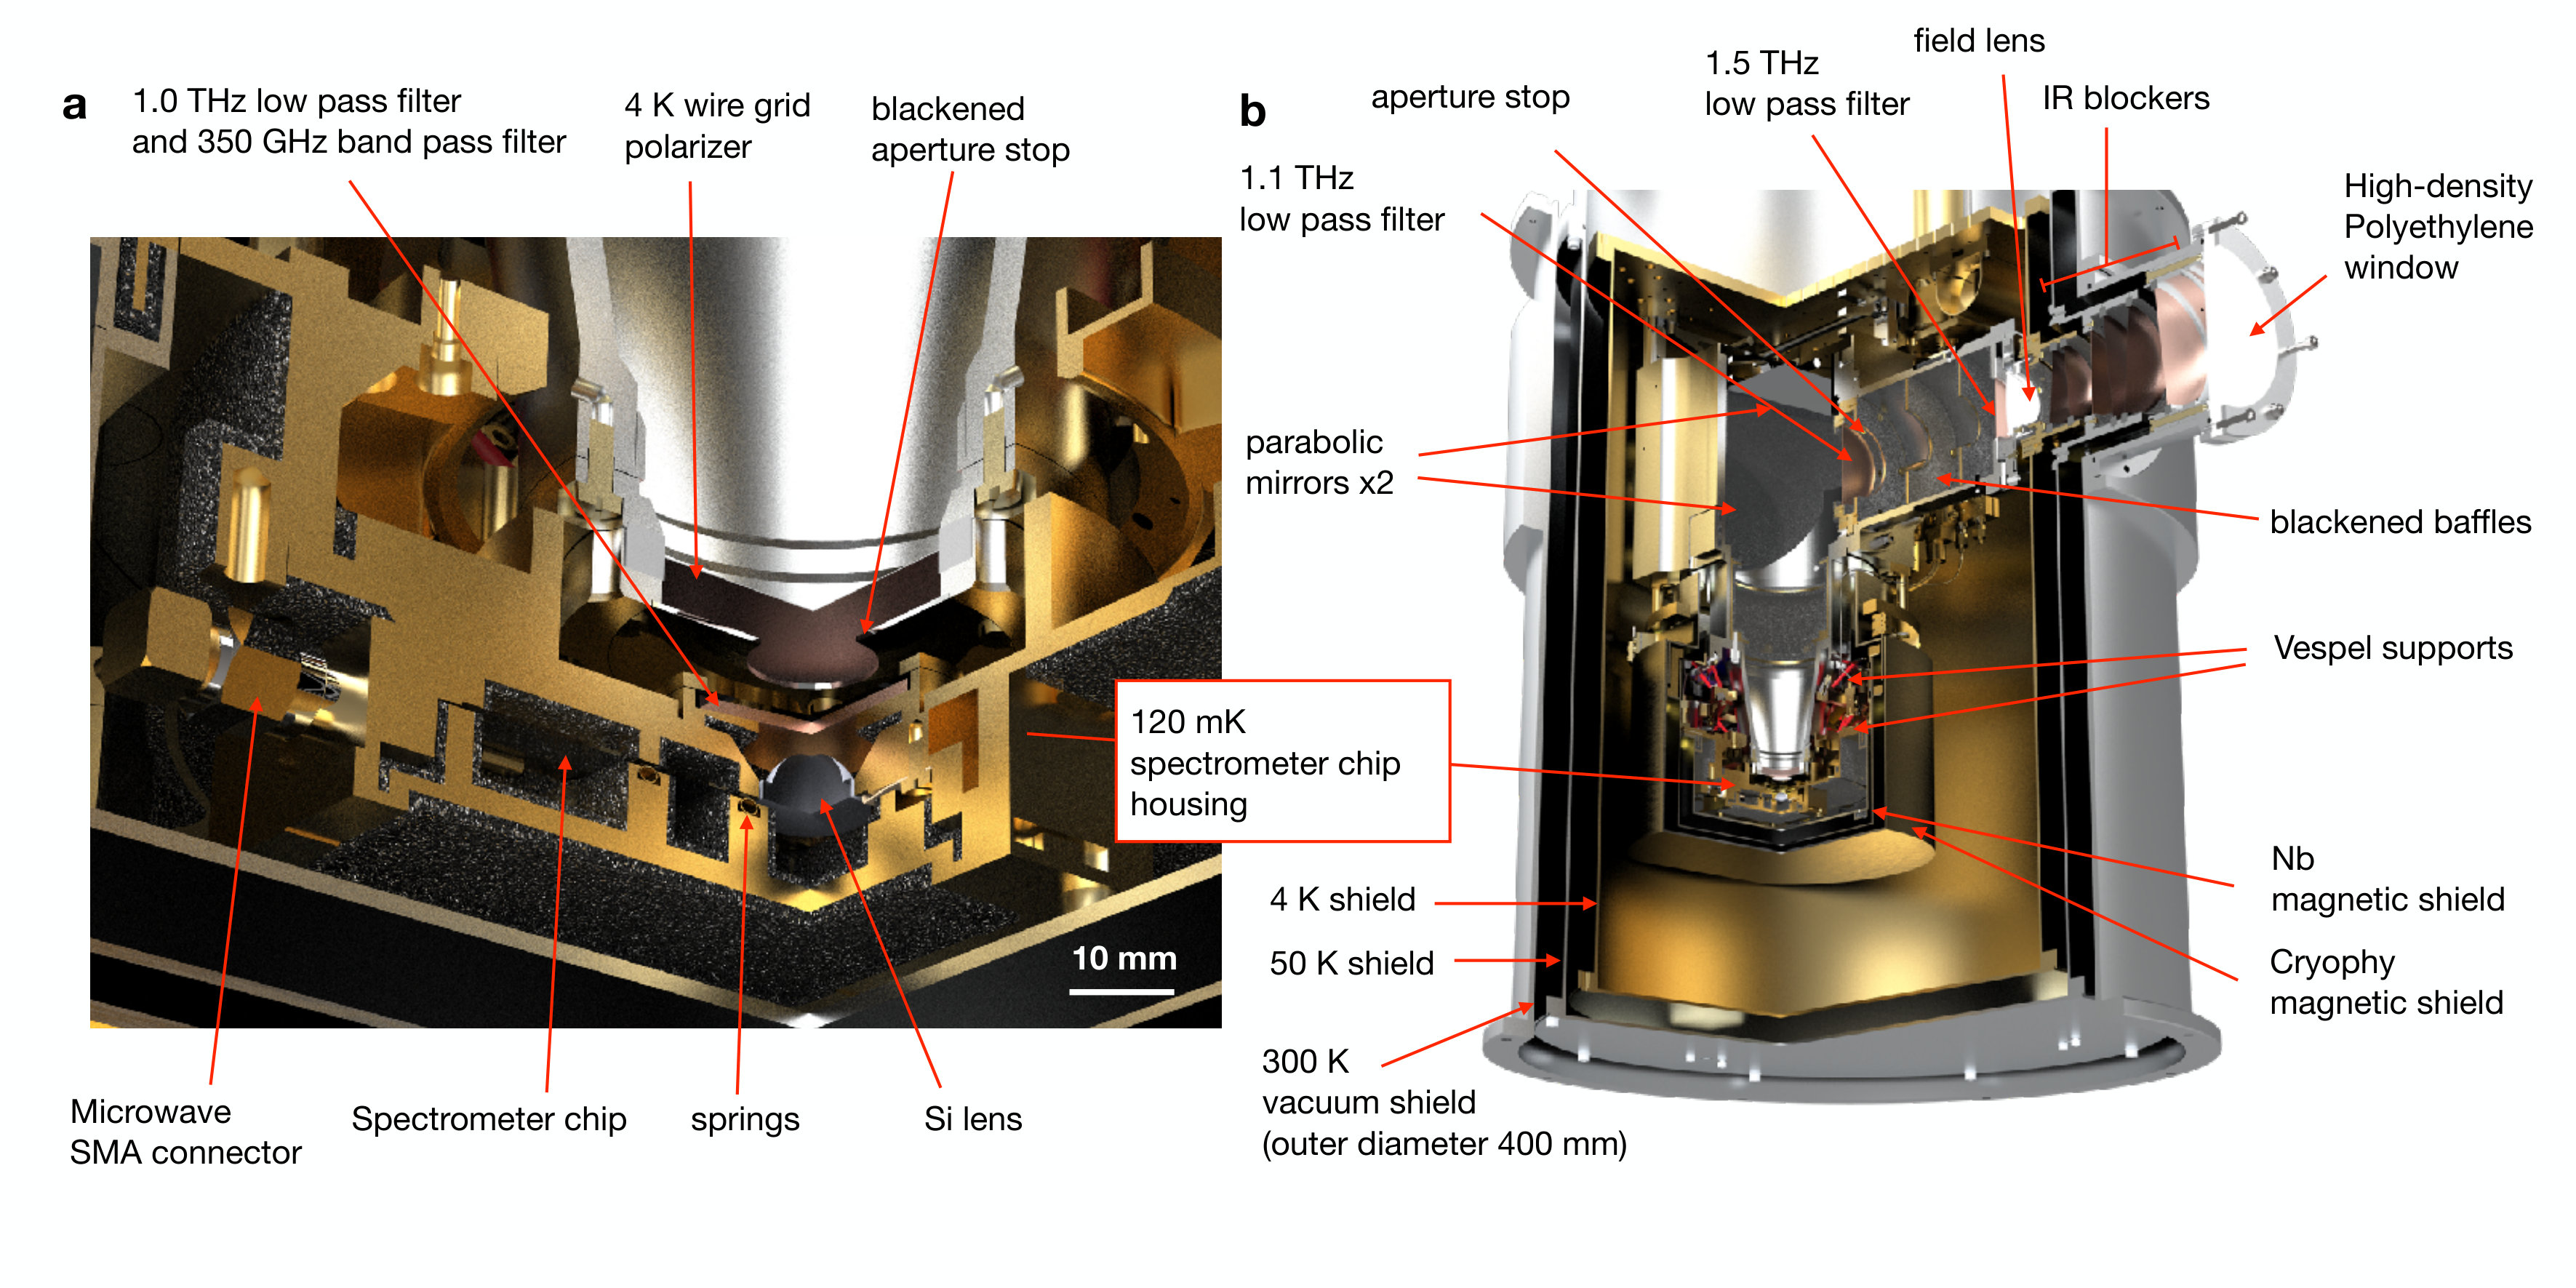 Figure 4
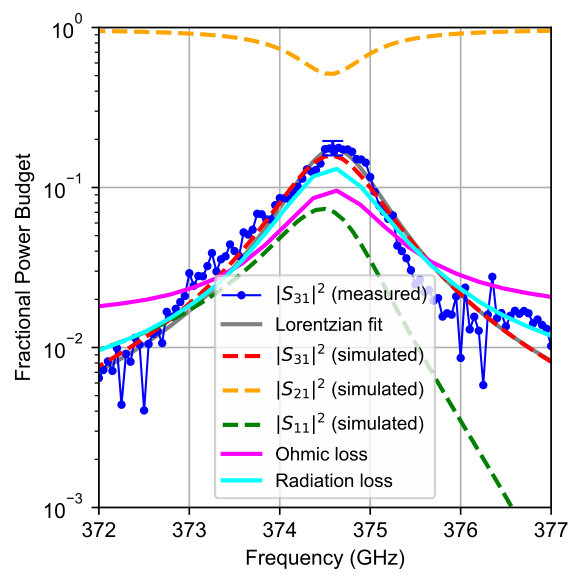 Figure 5
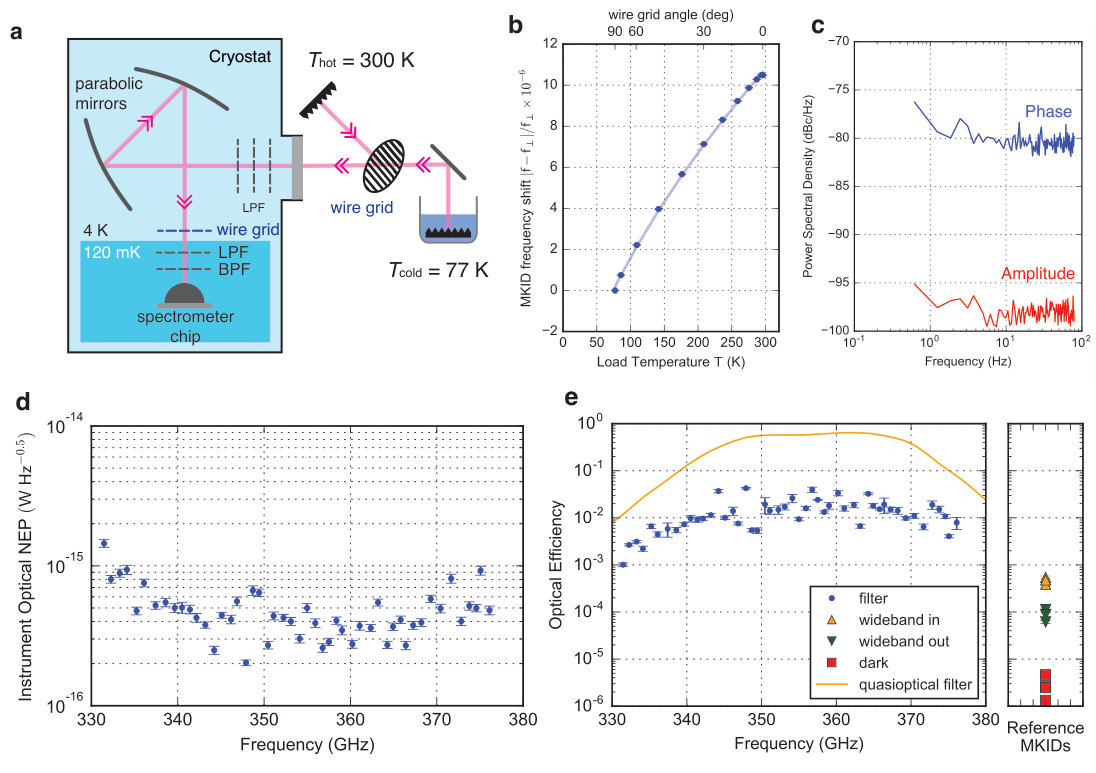 Figure 6
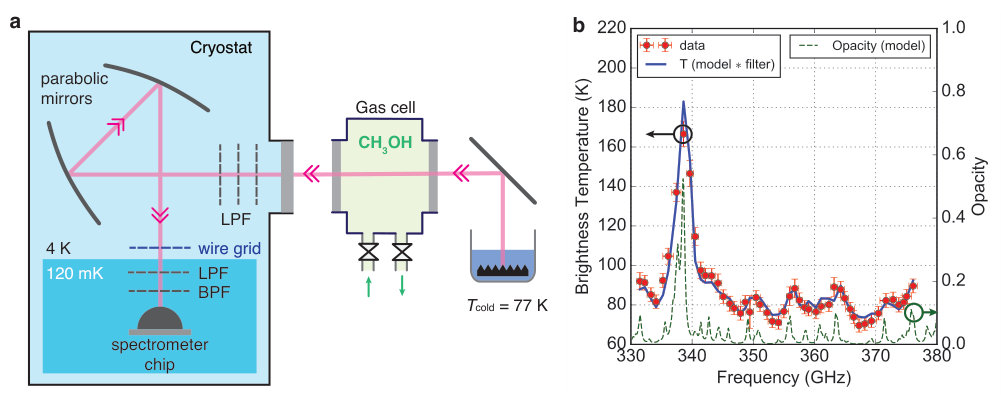 Figure 7
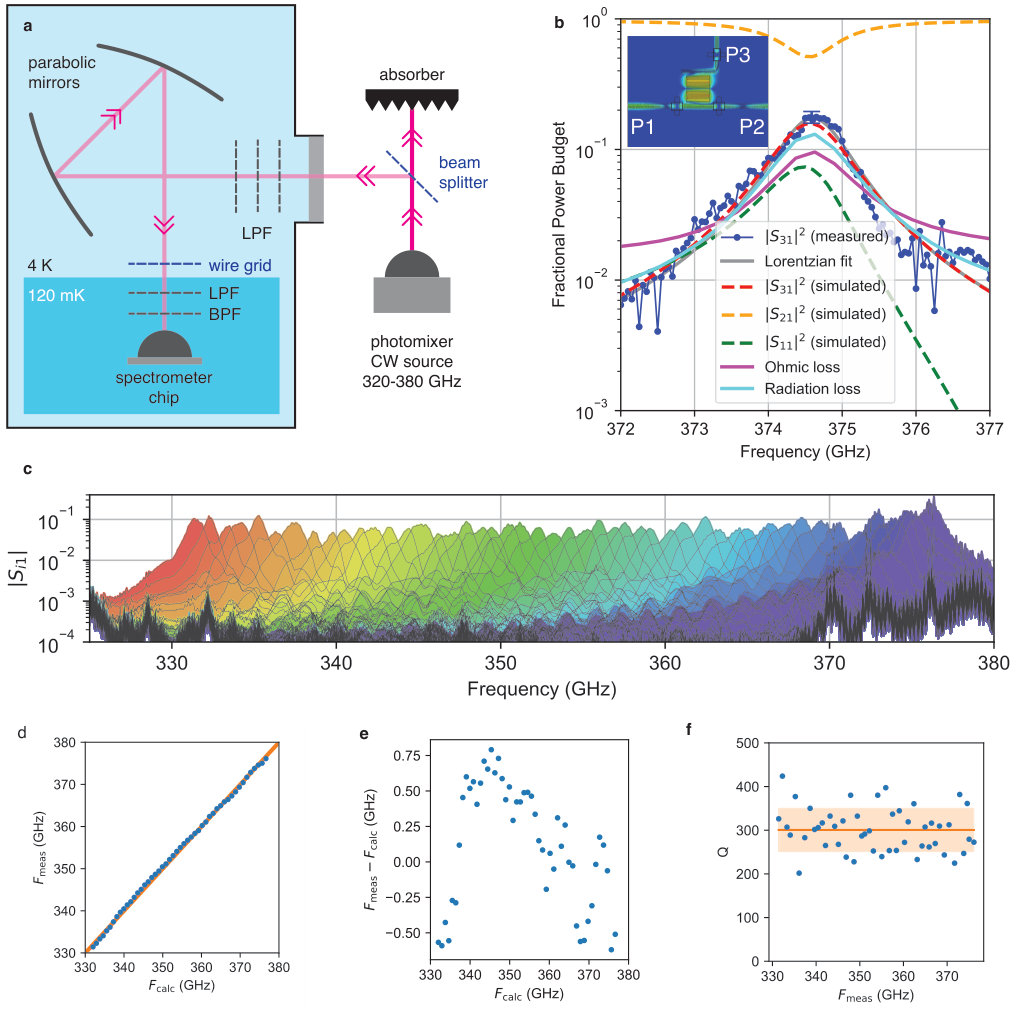 Figure 8
Peer Reviews
No public reviews on file for this paper yet. If you reviewed it on a platform where reviews are public (OpenReview, ICLR, NeurIPS, ICML), you can paste yours below so the community can read it here.
Videos
No videos yet. Explain this paper in a talk, walkthrough, or lecture? Add one.
\cftpagenumbersoff
figure \cftpagenumbersofftable
Wideband on-chip terahertz spectrometer based on a superconducting filterbank
Akira Endo
Faculty of Electrical Engineering, Mathematics and Computer Science, Delft University of Technology, Mekelweg 4, 2628 CD Delft, the Netherlands.
Kavli Institute of NanoScience, Faculty of Applied Sciences, Delft University of Technology, Lorentzweg 1, 2628 CJ Delft, The Netherlands.
Kenichi Karatsu
SRON—Netherlands Institute for Space Research, Sorbonnelaan 2, 3584 CA Utrecht, The Netherlands.
Faculty of Electrical Engineering, Mathematics and Computer Science, Delft University of Technology, Mekelweg 4, 2628 CD Delft, the Netherlands.
Alejandro Pascual Laguna
SRON—Netherlands Institute for Space Research, Sorbonnelaan 2, 3584 CA Utrecht, The Netherlands.
Faculty of Electrical Engineering, Mathematics and Computer Science, Delft University of Technology, Mekelweg 4, 2628 CD Delft, the Netherlands.
Behnam Mirzaei
Kavli Institute of NanoScience, Faculty of Applied Sciences, Delft University of Technology, Lorentzweg 1, 2628 CJ Delft, The Netherlands.
Robert Huiting
SRON—Netherlands Institute for Space Research, Sorbonnelaan 2, 3584 CA Utrecht, The Netherlands.
David J. Thoen
Faculty of Electrical Engineering, Mathematics and Computer Science, Delft University of Technology, Mekelweg 4, 2628 CD Delft, the Netherlands.
Kavli Institute of NanoScience, Faculty of Applied Sciences, Delft University of Technology, Lorentzweg 1, 2628 CJ Delft, The Netherlands.
Vignesh Murugesan
SRON—Netherlands Institute for Space Research, Sorbonnelaan 2, 3584 CA Utrecht, The Netherlands.
Stephen J. C. Yates
SRON—Netherlands Institute for Space Research, Landleven 12, 9747 AD Groningen, The Netherlands.
Juan Bueno
SRON—Netherlands Institute for Space Research, Sorbonnelaan 2, 3584 CA Utrecht, The Netherlands.
Nuri van Marrewijk
Faculty of Electrical Engineering, Mathematics and Computer Science, Delft University of Technology, Mekelweg 4, 2628 CD Delft, the Netherlands.
Sjoerd Bosma
Faculty of Electrical Engineering, Mathematics and Computer Science, Delft University of Technology, Mekelweg 4, 2628 CD Delft, the Netherlands.
Ozan Yurduseven
Faculty of Electrical Engineering, Mathematics and Computer Science, Delft University of Technology, Mekelweg 4, 2628 CD Delft, the Netherlands.
Nuria Llombart
Faculty of Electrical Engineering, Mathematics and Computer Science, Delft University of Technology, Mekelweg 4, 2628 CD Delft, the Netherlands.
Junya Suzuki
High Energy Accelerator Research Organization (KEK), 1-1 Oho, Tsukuba, Ibaraki, 305-0801, Japan.
Masato Naruse
Graduate School of Science and Engineering, Saitama University, 255, Shimo-okubo, Sakura, Saitama 338-8570, Japan.
Pieter J. de Visser
SRON—Netherlands Institute for Space Research, Sorbonnelaan 2, 3584 CA Utrecht, The Netherlands.
Paul P. van der Werf
Leiden Observatory, Leiden University, PO Box 9513, NL-2300 RA Leiden, The Netherlands.
Teun M. Klapwijk
Physics Department, Moscow State Pedagogical University, 119991 Moscow, Russia.
Jochem J. A. Baselmans
SRON—Netherlands Institute for Space Research, Sorbonnelaan 2, 3584 CA Utrecht, The Netherlands.
Faculty of Electrical Engineering, Mathematics and Computer Science, Delft University of Technology, Mekelweg 4, 2628 CD Delft, the Netherlands.
Abstract
Terahertz spectrometers with a wide instantaneous frequency coverage for passive remote sensing are enormously attractive for many terahertz applications, such as astronomy, atmospheric science and security. Here we demonstrate a wide-band terahertz spectrometer based on a single superconducting chip. The chip consists of an antenna coupled to a transmission line filterbank, with a microwave kinetic inductance detector behind each filter. Using frequency division multiplexing, all detectors are read-out simultaneously creating a wide-band spectrometer with an instantaneous bandwidth of 45 GHz centered around 350 GHz. The spectrometer has a spectral resolution of and reaches photon-noise limited sensitivity. We discuss the chip design and fabrication, as well as the system integration and testing. We confirm full system operation by the detection of an emission line spectrum of methanol gas. The proposed concept allows for spectroscopic radiation detection over large bandwidths and resolutions up to , all using a chip area of a few . This will allow the construction of medium resolution imaging spectrometers with unprecedented speed and sensitivity.
keywords:
microwave kinetic inductance detector, on-chip spectrometer, filterbank, submillimeter wave
*Akira Endo, \[email protected]
1 Introduction
Cool gas is the most abundant phase of matter in the interstellar medium of galaxies, and in the Earth’s atmosphere. Hence, precise knowledge of the spatial variation and dynamics of the physical and chemical properties of cool gas is of crucial importance for astrophysics[1], as well as weather forecasting and global climate modeling[2, 3]. These properties can be diagnosed using passive terahertz remote sensing, because many molecules and atoms in cool gas make energy level transitions that leave distinct fingerprints in the terahertz emission spectrum[4]. However, most of the currently used coherent receivers[5] can observe only 1–10 GHz of bandwidth at a time (exceptionally up to 35 GHz[6, 7]). This makes it very time consuming to cover a significant fraction of the 0.1–1 THz band (referred to as ‘terahertz radiation’ in the remainder of this article), where the atmosphere is partially transparent. Indeed, it is often essential to probe multiple energy transitions of multiple chemical species to make a meaningful diagnosis, calling for much wider simultaneous bandwidths[2, 8].
The on-chip filterbank spectrometer[9, 10, 11, 12] is a recently proposed concept that aims to enable wideband terahertz remote-sensing spectroscopy with a threefold advance. The first step is to use an array of incoherent detectors[8] to measure the signal, after dispersion, in one detector for each frequency bin. This decouples the observation bandwidth from the detector readout bandwidth, allowing very efficient back-ends for medium resolution spectroscopy. The second step is to use superconducting millimeter wave electronics to: i) couple the signal to the chip, ii) disperse it and iii) measure it. This integrates the functionality of a classical dispersion spectrometer[8] with a typical size of 1 m onto a chip of a few , which makes the spectrometer much more scalable towards larger bandwidths, longer wavelengths, and a larger number of spectrometers to form a spectral-imaging array. The emergence of such a passive spectroscopic imager could also reform the landscape of terahertz applications in our daily lives, because it combines the advantages of a broad input frequency band, ideally suited for pressure broadened lines, fast imaging without scanning, real-time material diagnosis even through clothing, and not irradiating the subject[13, 14, 15, 16]. The last advance is the fact that incoherent detectors allow for extremely sensitive spectrometers, especially for low radiation environments, because they are not subject to quantum noise[8].
Here we demonstrate the design, performance and operation of a terahertz on-chip filterbank spectrometer system, consisting of a spectrometer chip, cryogenic system and readout electronics. The spectrometer chip, as shown in Fig. 1, covers a frequency band of 332–377 GHz with 49 spectral channels with a constant spectral resolving power of . It is based on incoherent NbTiN-Al hybrid microwave kinetic inductance detector (MKID) technology[17] that can be scaled to near the NbTiN gap frequency of 1.1 THz. The sensitivity we demonstrate here is set by the photon noise inherent to the incoming optical signal, and by the instrument radiation coupling efficiency. Using large bandwidth antennas such as the leaky wave antenna [18] and the sinuous antenna[19], input bandwidths in excess of one octave are possible (e.g., 300–900 GHz), allowing truly wideband spectroscopy with up to 1000 channels per spectrometer.
2 Filterbank spectrometer chip
The chip is fabricated from a 100 nm-thick NbTiN film, which is deposited on the c-plane sapphire substrate using reactive magnetron sputtering [20]. This film has a critical temperature , which implies that the material has low losses up to near the gap frequency . ( is the Boltzmann constant, and is the Planck constant.) The chip couples to linearly polarized radiation using a double slot antenna, patterned using UV contact lithography and plasma etching in a plasma, followed by an in-situ cleaning[21]. The antenna is placed in the focus of a 8 mm extended-hemispherical Si lens[22], which is anti-reflection coated with a 130 -thick layer of Parylene-C [23]. The received signal is guided to the filterbank through the terahertz line: a coplanar waveguide (CPW) patterned in the NbTiN ground plane. The filterbank sorts the wideband signal into 49 sub-bands by means of narrow band pass filters. These filters are coplanar, interdigitated resonators, as shown in Fig. 1f, which are coupled to the terahertz line on one side, and to a NbTiN-Al hybrid MKID[24] on the other side. At the resonant frequency of the filter, maximum signal power is transferred from the terahertz line to the MKID. Each MKID is a CPW quarter wavelength resonator, with a resonant frequency in the order of 5 GHz. Its open end is coupled to the readout line and its shorted end is coupled to the terahertz filter. Near the terahertz filter the MKID CPW has a central line made from 40 nm-thick aluminium with a resistivity of 0.8 and . For the signal frequencies of 332–377 GHz the aluminium acts as a radiation absorber, because is smaller than the signal frequency band of the spectrometer. The radiation power absorbed creates a proportional shift in the resonant frequency of the MKID, which is read out as a change in the transmission phase of a microwave tone in the readout line that connects to all MKIDs. The ground planes of the readout line, and the terahertz line, are balanced using aluminium bridges with dielectric bricks fabricated from spin-coated polyimide LTC9505 from Fujifilm[21].As a reference for the terahertz signal power at the input of the filterbank, three ‘wideband MKIDs’ are placed before the filterbank; these are MKIDs that are weakly coupled to the terahertz line directly without a filter, with a nearly constant power coupling of dB over the relevant frequency range. Similarly, another three wideband MKIDs are placed after the filterbank for a reference of the power that runs through the filterbank without being drawn out by the filter channels. Furthermore, there are four ‘dark MKIDs’ that are placed away from the terahertz line as a reference for signal power coupled to the MKIDs by way of stray light or surface waves[25]. The chip is equipped with a mesh of 40 nm-thick -phase Ta on its backside to reduce the propagation of stray radiation inside the chip. The terahertz signal line is terminated by a CPW with an aluminium center line, which absorbs the remaining terahertz signal after the filterbank, to prevent reflection of power that is not drawn out by the filter channels.
3 Spectrometer System
The filterbank spectrometer chip is integrated into a system, which includes the detector readout using microwave frequency division multiplexing (FDM) for simultaneously reading out all detectors, optics to couple the terahertz signal to the chip, and a refrigerator for cooling them. The spectrometer chip is mounted in a housing as displayed in Fig. 2a. The optical entrance of the chip housing is closed off above the lens with a 1 THz low-pass filter, and a 350 GHz bandpass filter with a transmission as shown later in Fig. 4e. The chip housing is mounted inside a light-tight chamber equipped with coaxial cable filter feedthroughs[26]. The chamber is cooled via copper thermal straps to 120 mK using a two-stage adiabatic demagnetisation refrigerator (ADR), connected to the 4 K stage provided by a two-stage pulse tube cooler. The chamber itself is isolated from the 4 K environment by a thermal-mechanical structure based on Vespel tubes. Both the chamber and chip housing operated at 120 mK are coated on the inside by a radiation absorber that consists of 3% by weight carbon powder mixed with Epotek 92 epoxy, in which we embed 1 mm or 0.5 mm SiC grains as diffusive scattering elements. This recipe is adapted from Ref.[27] to yield better absorption at long wavelengths and better adhesion on large surfaces. A microwave analog/digital readout system[28] and a 4 K low noise amplifier are used to read out the phase response of all of the MKIDs simultaneously. This is achieved by creating a time dependent signal that is the reverse Fourier transform of a set of single frequency tones, one for each MKID, with the addition of a few ‘blind’ tones used for system calibration and monitoring. These tones are sent to the chip, where radiation absorbed in an MKID modifies its associated single frequency tone. After passing through the chip the signal is amplified at 4 K using the low noise amplifier with a noise temperature of 5 K, after which it is further amplified and analyzed in the readout system. Here the change in complex transmission at each tone is obtained using an on-board fast Fourier transform (FFT) engine, and it is converted to a resonance frequency response in the post analysis to increase the linearity[29]. Radiation is coupled to the detector chip using a 4 K light-tight box, equipped with an optical relay of two parabolic mirrors, baffling structures coated with the same radiation absorber as the 120 mK box and sample holder, infrared filters and a polarizing filter mounted in co-polarization with the antenna, as shown in Fig. 2b. The relay creates a pupil where the beam is tapered at the 10 dB level, limiting large angular stray radiation. Even in a single beam system the pupil has a specific meaning in optics, being the conjugate plane of the focal plane which limits the angular extent of the beam. Complete baffling to limit the optical throughput incident on the chip in both area extent and angle therefore requires limiting apertures (stops) in both conjugate planes (focal and pupil planes). Here aperture baffles at the window, on the array and the lens itself act as an effective focal plane aperture stop. While at the pupil there is an aperture limiting the angle to a f/D ratio of 3.9 (7.7 deg.) This entire optical chain is cooled to 4 K. In addition, the chip is surrounded by two layers of magnetic shielding (Nb and Cryophy[30]), also cooled to 4 K. The combined shields attenuate the magnetic field perpendicular to the chip by a factor 700.
4 Spectral response
The frequency response of the spectrometer is measured with a photomixing terahertz continuous wave (CW) source (Toptica Terabeam 1550) in a setup as shown in Fig. 3a. We couple the beam from the CW source to the cryostat by reflecting it from a 15 -thick sheet of Mylar to attenuate the signal power by dB to dB. We then measure the response of each MKID while sweeping the frequency of the CW source from 320 GHz to 380 GHz. In all results we apply a frequency shift of GHz to the CW source frequency as a result of a frequency calibration of the CW source using a methanol emission line as will be discussed in Sec. 6. Fig. 3b shows the response of one filter channel MKID near the filterbank entrance, which has less influence from neighboring channels and transmission losses compared to filters further downstream. The calculation of the response takes the following steps: i) divide the frequency-dependent response of the filter-MKID with the response of a wideband MKID at the entrance of the filterbank (see Fig.1); ii) normalize the peak of the response to unity to calculate the instrument optical efficiency (), see Fig. 4e. iii) return to the frequency-dependent response and adjust it so that the peak height is equal to divided by the losses between the entrance of the filterbank to the cryostat window. In this way the only result from the photomixing-source scan is the relative frequency response, and the peak height of correctly represents the magnitude of the scattering parameter according to the definition in the inset of Fig. 3b. A Lorentzian fit to the measured transmission peak yields a quality factor of . From the measured peak and we can infer an internal and a coupling of , assuming the same coupling strength to the feed line and to the MKID[10]. The simulation using CST Microwave Studio shows that the filter has a measured transmission to the MKID of on resonance, which is consistent with the measured value. The peak transmission is smaller than the theoretical maximum transmission of 50% for a single bandpass filter[31]. According to the power budget around the resonance frequency simulated with CST Microwave Studio[32] shown in Fig. 3b, this can be understood as a result of the following contributions: = 51% of the power passing through the terahertz signal line; = 7% being reflected back towards the input of the filterbank; 13% being lost as radiation from the filter into the substrate; and 10% being absorbed by the aluminium bridges; leaving to couple to the MKID. Note that the simulated coupling numbers do not add up to 100%, but to 97%, due to the total power budget from the CST simulation. This uncertainty is much smaller than the error in the absolute efficiency measurement.
The measured transmission from the filterbank entrance to the MKIDs for all 49 channels is plotted in Fig. 3c. With being the frequency spacing between adjacent channels, the peak frequencies of the filters follow well a geometric sequence of GHz, as presented in Fig. 3d. The convex trend seen in the small residual as presented in Fig. 3e is likely due to a gradient in sheet inductance of the NbTiN film along the filterbank [20], and a scatter on the order of 0.1% of the resonance frequency as seen here is typical for the readout frequency of MKID arrays[22, 33]. In Fig. 3f we present the quality factors of all channels, showing an average . The frequency spacing of is an intentional oversampling compared to the mean filter of 300, to conservatively avoid gaps in the spectral coverage (this resolution is well suited for the detection of redshifted emission lines from terahertz-bright galaxies[34]). As a consequence of the power being partially shared among neighboring channels, the oversampling causes the peak transmission of many channels to be slightly lower (mean of 8%) than the highest-frequency channels close to the entrance of the filterbank, such as the one shown in Fig. 3b. Collectively, the sufficiently small scatter in both filter frequency and with a channel yield of 100% makes it possible to cover the entire 332–377 GHz band without significant gaps, as demonstrated in Fig. 3c.
5 System sensitivity
Because the MKID detectors used in this study are photon-noise limited in the relevant range of terahertz loading power [24], we can measure the sensitivity of the spectrometer by using the stream of photons as an absolute calibration source. A pair of black body radiators at room temperature and liquid temperature are placed at reflection and transmission positions of a wire grid seen from the spectrometer window, respectively, as shown in Fig. 4a. Looking into the wire grid, the spectrometer sees an effective load brightness temperature of , where is the reflectance in co-polarization to the cryogenic wire grid and on-chip antenna.
Fig. 4b shows the relative frequency response ( is the MKID resonant frequency for ) of a representative filter-channel MKID, as a function of . From a square-root-law fit (expected if the responsivity is scaling as where is the absorbed power[35], and the total optical loading is dominated by the variable thermal load outside of the cryostat), we determine the temperature response . To be able to measure the spectrometer sensitivity expressed in noise equivalent power (NEP), we convert the load temperature to radiation power , which is defined as the single-mode, single polarization radiation power outside of the cryostat window that can couple to a single filter channel:
[TABLE]
Here, is the transmission of the filter channel, as shown in Fig. 3c, with the peak transmission normalized to unity. Note that we have limited the integral bounds of Eq.1 to the bandwidth of the quasioptical filter to avoid integrating noise as signal. Furthermore, is the speed of light in vacuum, and is the Planck brilliance as a function of and frequency . The NEP can now be determined experimentally by combining the responsivity with MKID photon noise level using
[TABLE]
where is determined from the flat phase noise floor at 20 Hz of the power spectral density as shown in Fig 4c. The amplitude noise presented in Fig. 4c, at a level of 18 dB compared to the phase noise, corresponds to the noise in the readout system [28], proving that the phase noise level is not affected by the readout noise. It has to be noted that both and depend on background load . We plot in Fig. 4d the experimental NEP obtained using Eq. 2 at . In the range of 345–365 GHz where the quasioptical filter stack has its highest transmission of 40%, the instrument has an optical NEP of 3\times$$10^{-16}\ \mathrm{W\ Hz^{-0.5}}.
By equating the measured optical NEP to the theoretical optical NEP of photon-noise limited MKIDs[21, 37] one can obtain the total coupling efficiency between the calibration load and the detector,
[TABLE]
Here, is the Planck constant, is the Boltzmann occupation number of the radiation outside of the cryostat window, and is the pair-breaking efficiency[38]. We show the optical efficiency in Fig. 4e, together with the band-pass characteristics of the quasioptical filter stack. The figure shows that the instrument optical efficiency in the passband of the filter stack is %. This is close to the product of the following transmissions: 1) Quasi-optical filter stack with a transmission of , 2) coupling of the cryogenic optics of , simulated with physical optics using GRASP[39], 3) radiation efficiency of the lens-antenna of , simulated in CST Microwave Studio, 4) ohmic loss of the 30 bridges across the terahertz line in between the antenna and the filterbank of , estimated from an independent measurement of the loss of the bridges, and 5) on-chip filter has a mean peak transmission of 8% as shown in Fig. 3c.
It is informative to calculate the optical efficiency for the reference MKIDs, by approximating with the full passband of the quasioptical filter stack normalized to unity at the maximum. The results are shown in the right panel of Fig. 4e. The optical efficiency of the wideband MKIDs at the input of the filterbank is consistent with the designed value of dB when multiplied with . The wideband MKIDs at the output of the filterbank receive 5 times less power than those at the input, because of the fraction of power taken out by the filterbank, including radiation losses, ohmic losses and reflections. The dark MKIDs receive 30–40 dB less power than the filter channel MKIDs, showing that the amount of stray light that couples to the MKID detectors is sufficiently small for constructing a filterbank with – channels.
6 Detection of Methanol Gas Emission Spectrum
To demonstrate that the system can spectroscopically observe emission or absorption lines from molecular gas, we have measured the emission spectrum of methanol gas at 17 mbar using the experimental configuration as shown in Fig. 5a. We couple the system beam to a gas cell that can be filled with methanol gas at 293 K so that the spectrometer looks through the gas cell into a black body cooled to 77 K with liquid . Initially, the gas cell is pumped to a near vacuum of 0.014 mbar. While the spectrometer is continuously observing with all channels at a sampling rate of 160 Hz, we increase the methanol pressure to 17 mbar. The relative frequency shift , where is the initial MKID frequency with the gas cell at vacuum, is converted to an effective brightness temperature by using the response curve as presented in Fig. 4b for each MKID. To convert the individual filter channel response to a spectral brightness we use the measured spectral response of the filterbank, obtained using the photomixing CW source, as presented in Fig.3c. The spectral brightness obtained with our spectrometer, is presented in Fig. 5b. We can compare this response to a simulation of the expected emission spectrum of methanol gas: we present the opacity of methanol gas at 17 mbar by the green dashed line in Fig. 5b. This spectrum is calculated using expected line frequencies and intensities from the JPL line catalog[40] and taking different line broadening mechanisms into consideration in order to comply with the length (270 mm), pressure, and temperature of the gas cell[41]. By further taking into account the losses at the gas cell window, and convoluting the intensity spectrum with the bandpass characteristics of the filters as presented in Fig. 3c, we can calculate the expected response of each channel of the filterbank, as shown in Fig. 5b. Note that here we have applied to all of the spectral channels a common multiplication factor and an offset, to compensate for the uncertainty in the beam spillover at the windows of the gas cell and at the cold source. Interestingly, we find that we have to use an overall frequency shift of GHz to get a maximum correspondence between the measured filterbank response and the methanol spectrum. This is consistent with the 2 GHz absolute accuracy quoted by the supplier of the CW source, and shows that it is possible to use a gas cell as a method to improve the absolute frequency calibration of the spectrometer.
From the good correspondence between measurement and simulation as shown in Fig. 5b, we can conclude that the spectral shape observed by the on-chip spectrometer reproduces very well the peak frequencies and their relative strengths expected from the database.
7 Measurement of the system beam pattern
The on-chip filterbank spectrometer uses direct detectors, MKIDs, but the radiation coupling via the filterbank and lens-antenna is phase coherent. The coupling between the lens-antenna and finally the telescope is sensitive to the exact phase- and amplitude distribution of the beam, details of which are easily overlooked when doing a conventional scalar beam pattern measurement using thermal sources. To avoid this, and to be able to predict the coupling to the telescope quantitatively, we have measured the phase- and amplitude pattern, using a method pioneered in Ref. [42] and explained in Fig. 6a. We use two coherent sources, each driven from a signal generator and a 32 frequency multiplier. The two synthesizers have a small frequency difference and a source offset frequency of , well within the bandwidth of the detectors and readout system, which modulates the detector response in the time domain. The complex field parameters can be obtained as a function of the position of RF1 by a complex FFT of the time domain data. However, MKIDs are not phase sensitive detectors and the phase information is not conserved in the detection process. To overcome this we create a stable phase reference by adding a small amplitude modulation to all the readout tones coming from the cryostat at a frequency using the ‘tone modulator’. The exact technique is described in great detail in Ref.[43].
We show, in Fig. 6b, the final result of this measurement, which is the far field pattern calculated from the measured data. We observe a reasonably clean pattern, which can be fitted well to a Gaussian beam, yielding a Gaussicity of 0.82, angular offsets in and given by off and off, and Gaussian beam far-field divergence angle and , corresponding to the value in power of the best fit Gaussian beam. The reference plane of this direction is the front side of the mounting structure of the cryostat. The cause of the relatively large angular offset is not fully understood, but likely a misalignment between the field lens and the beam impinging on it.
8 Summary and Outlook
We have demonstrated the operation of a full on-chip filterbank spectrometer with 49 spectral channels with a resolution of that observes over an instantaneous band of 332–377 GHz. The photon-noise limited sensitivity of , together with an actual detection of methanol gas, proves that the spectrometer can already be applied in atmospheric and astronomical sciences. Indeed, the spectrometer presented here meets all the interface requirements for immediate installation on the 10 m ASTE telescope[44] as the first generation of the DESHIMA spectrometer[45] for astronomy: with the excellent atmospheric transmission of the Atacama Desert at around 350 GHz, the on-chip spectrometer will more than quadruple the simultaneous bandwidth of existing heterodyne spectrometers at this type of facilities[46], matching well the full spectral coverage of direct-detection cameras.
Yet the system demonstrated in this Article should be regarded as a narrow-band, single-pixel demonstrator, when compared to the vast potential scalability of the on-chip filterbank spectrometer concept. By using quarter-wavelength bandpass filters[17] and wideband antennas[18, 19], the filterbank can be naturally extended to a bandwidth of 1:3 (1.5 Octave)[9]. For a 1:3 broad band system the out-of-band coupling of the individual filters must be below dB with respect to the peak power coupling to limit out-of-band power loading the detectors. The stray radiation coupling to ’blind MKIDs’ in our design is already good enough, but the current filter design has spurious resonances and will not fulfill this requirement. Better instrument sensitivity can be reached by increasing the system coupling efficiency, by improving the coupling efficiency of the chip and the optics. The on-chip filter transmission can be improved from 8% to values approaching unity by a combination of two methods: First, the single filter efficiency is now limited by radiation loss and ohmic losses in the aluminium bridges. This can be mitigated by using microstrip filters and a microstrip THz line, which will both eliminate radiation loss, and the need for bridges. This will bring the single filter efficiency close to the theoretical limit of 50%[31]. The second step requires a more advanced filter design, an example would be to combine several oversampled filters to absorb more power[31], and to incoherently couple that power into one MKID[47]. The instrument optical efficiency can be improved by using isotropic substrates (e.g., Si) for the antenna, and by a very careful choice of the infrared and quasi-optical filters. These improvements on the chip and optics should collectively bring the instrument optical efficiency up to %, corresponding to an instrument of . As we show in the Appendix, an incoherent spectrometer with this NEP value will have the same per-channel sensitivity as a coherent receiver with a single-sideband receiver noise temperature of K: this is very close to the standard quantum limit[8] of for coherent detection, and a factor of 3 better than the state-of-the-art superconductor-insulator-superconductor (SIS) receivers for astronomy in this frequency range[46]. With the dual advantage in bandwidth and sensitivity, near-future incoherent spectrometers will offer a substantial sensitivity margin over coherent spectrometers for medium resolution spectroscopy (F/\Delta F$$\leq a few 1000), opening up new observational parameter space in fields such as very wide-band spectroscopy and blind spectroscopic surveys.
Furthermore, the compactness of the spectrometer chip allows small spectrometer units that can be combined into a focal plane array of spectrometer pixels—what is often referred to as a hyperspectral imager or imaging spectrometer. Indeed, the on-chip spectrometer is regarded as the most viable path towards a 100 pixel multi-object spectrometer, which is expected to substantially improve the galaxy-surveying capabilities of existing ground-based observatories for terahertz astronomy [48, 49], and enable future satellite missions for climatology and meteorology applications[2].
Appendix A Proof of photon noise limited radiation detection
The noise spectrum given in Fig. 4c is white for both phase and amplitude, which is indicative of photon noise, but not a hard proof. Referring to Ref. [50], photon noise limited performance is proven if i) the noise is white, ii) has a roll off determined by the quasiparticle lifetime, which depends on the absorbed power. The DESHIMA system as described does not allow to perform such a test due to the limited bandwidth of the readout system. We therefore re-measured the same chip-holder combination in the exact same setup as in Ref. [50], and measured the noise spectra using the cryogenic black body calibrator at temperature of 3 K and 30 K. A set of band-pass and low-pass filters defining a 320–380 GHz band coupling between calibration load and the DESHIMA holder, the power to an individual MKID, taking into account the DESHIMA filter bandwidth, is 0.015 fW at 3 K and 15 fW at 30 K, the power absorbed in DESHIMA is 20 fW at a 77 K load. The resulted spectrum from one of the resonators is shown in Fig. 7. We clearly observe a white noise spectrum, with a roll-off depending on the absorbed power. At the 3 K black body temperature, the noise is still not quite flat, indicating that two-level-system (TLS) noise still has a small contribution. At 30 K, the noise is white in the 10–100 Hz frequency range used in the main manuscript to determine he coupling efficiency. Also, we clearly see a power dependent roll off in the spectrum. This shows that the device is intrinsically photon noise limited at all power levels relevant for the experiment. Note that the amplitude noise shows a similar behavior, but the photon signature exceeds the amplifier noise, given by the level at the highest frequency, only marginally, implying a significant system noise contribution even at low frequencies.
Appendix B Equivalent coherent receiver noise temperature of a MKID-based incoherent spectrometer
The calculation is similar to the case in which the incoherent system is completely photon-noise limited[8], except that here we include the relatively small effect of the quasiparticle recombination noise of MKIDs. We will consider a case representative for a spectrometer system installed on a ground-based astronomical observatory, where the signal to be detected has a power that is much smaller compared to a background temperature of K typical for the 0.3–1.0 THz range[8].
The signal to noise ratio (SNR) of a coherent receiver is given by the radiometer equation:
[TABLE]
where is the brightness temperature of the signal, is the system noise temperature, is the integration time, and is the detection bandwidth. is the sum of and the receiver noise temperature .
Similarly, the SNR for an incoherent spectrometer is given by:
[TABLE]
where is the power of the signal.
Equating using and , we obtain
[TABLE]
Note that is independent of for a photon-noise limited MKID, because the NEP scales with .
As discussed in the main text, an on-chip filterbank spectrometer with an instrument optical efficiency of yields a NEP of . Here we have taken and , where the factor is the area under a Lorentzian curve whose peak amplitude and full-width-half-maximum are both unity. According to Eq. 6, this NEP would correspond to a of 22 K, which is close to the standard quantum limit for coherent detection[8].
Disclosures
The authors have no relevant financial interests in the manuscript and no other potential conflicts of interest to disclose.
Acknowledgements.
We thank Peter Hargrave for suggesting promising applications of the on-chip spectrometer to atmospheric sciences, and Klaas Keizer for the precise mechanical work on the cryostat. This research was supported by the Netherlands Organization for Scientific Research NWO (Vidi grant No. 639.042.423, NWO Medium Investment grant No. 614.061.611 DESHIMA), the European Research Counsel ERC (Consolidator grant No. 648135 MOSAIC), and the Japan Society for the Promotion of Science JSPS (KAKENHI Grant Numbers JP25247019 and JP17H06130). P.J. de V. is supported by the NWO (Veni Grant 639.041.750). T.M.K. is supported by the ERC Advanced Grant No. 339306 (METIQUM) and the Russian Science Foundation (Grant No. 17-72-30036). N.L. is supported by ERC (Starting Grant No. 639749). J.S. and M.N. were supported by the JSPS Program for Advancing Strategic International Networks to Accelerate the Circulation of Talented Researchers (Program No. R2804). B.M. was supported by the European Union’s Horizon 2020 research and innovation program under grant agreement No 730562 (RadioNet).
The reference list from the paper itself. Each links out to its DOI / PubMed record.
- 1[1] C. Kulesa, “Terahertz Spectroscopy for Astronomy: From Comets to Cosmology,” IEEE Trans. T Hz Sci. Technol. 1 (1), 232–240 (2011).
- 2[2] P. Hargrave, S. Withington, S. A. Buehler, et al. , “T Hz spectroscopy of the atmosphere for climatology and meteorology applications,” Proc. SPIE , 1021010 (2017).
- 3[3] C. Prigent, J. R. Pardo, and W. B. Rossow, “Comparisons of the millimeter and submillimeter bands for atmospheric temperature and water vapor soundings for clear and cloudy skies,” J. Appl. Meteorol. Climatol. 45 (12), 1622–1633 (2006).
- 4[4] C. K. Walker, Terahertz astronomy , CRC Press, Boca Raton, 1 ed. (2015).
- 5[5] U. U. Graf, C. E. Honingh, K. Jacobs, et al. , “Terahertz Heterodyne Array Receivers for Astronomy,” J. Infrared Millim. Terahertz Waves 36 , 896–921 (2015).
- 6[6] N. Erickson, G. Narayanan, R. Goeller, et al. , “An Ultra-Wideband Receiver and Spectrometer for 74–110 G Hz,” in From Z-Machines to ALMA: (Sub)Millimeter Spectroscopy of Galaxies , A. J. Baker, J. Glenn, A. I. Harris, et al. , Eds., Astronomical Society of the Pacific Conference Series 375 , 71 (2007).
- 7[7] R. A. Primiani, K. H. Young, A. Young, et al. , “SWARM: A 32 G Hz Correlator and VLBI Beamformer for the Submillimeter Array,” J. Astron. Instrum. 05 , 1641006 (2016).
- 8[8] G. J. Stacey, “T Hz Low Resolution Spectroscopy for Astronomy,” IEEE Trans. T Hz Sci. Technol. 1 , 241–255 (2011).