Surveys of Clumps, Cores, and Condensations in Cygnus X: I. a New Catalog of ~0.1 pc Massive Dense Cores
Yue Cao, Keping Qiu, Qizhou Zhang, Yuwei Wang, Bo Hu, and Junhao Liu

TL;DR
This study presents a comprehensive catalog of ~0.1 pc massive dense cores in Cygnus X, revealing their physical properties, classifications, and potential as initial high-mass star formation sites, significantly expanding previous surveys.
Contribution
It provides the largest, most complete catalog of MDCs in Cygnus X, with new classifications and insights into their role in high-mass star formation.
Findings
Identified 151 MDCs with detailed physical properties.
Discovered a high proportion of IR-quiet MDCs, suggesting different star formation stages.
Found 26 starless MDCs as potential initial high-mass star formation sites.
Abstract
Using infrared to (sub)millimeter data from Spitzer, Herschel, the James Clerk Maxwell Telescope, and the IRAM 30-m telescope, we conducted an unbiased survey of the massive dense cores (MDCs) in the Cygnus X molecular cloud complex, aimed at characterizing the physical conditions of high-mass star formation (HMSF) at ~0.1 pc scales. We created 5 deg times 6 deg images of the 70-1200 um dust continuum, gas column density, and dust temperature of Cygnus X. A spatial relation between the dense regions (Av > 15) and the developed HII regions was found, indicating the impact of the latter on the global structures of Cygnus X. With a 35-Msun mass threshold implied by HMSF signposts, we identified 151 MDCs with sizes of ~0.1 pc, masses of 35-1762 Msun, and temperatures of 8-35 K. Our MDC sample is statistically complete in Cygnus X and is three times larger than that in Motte et al. (2007).…
Click any figure to enlarge with its caption.
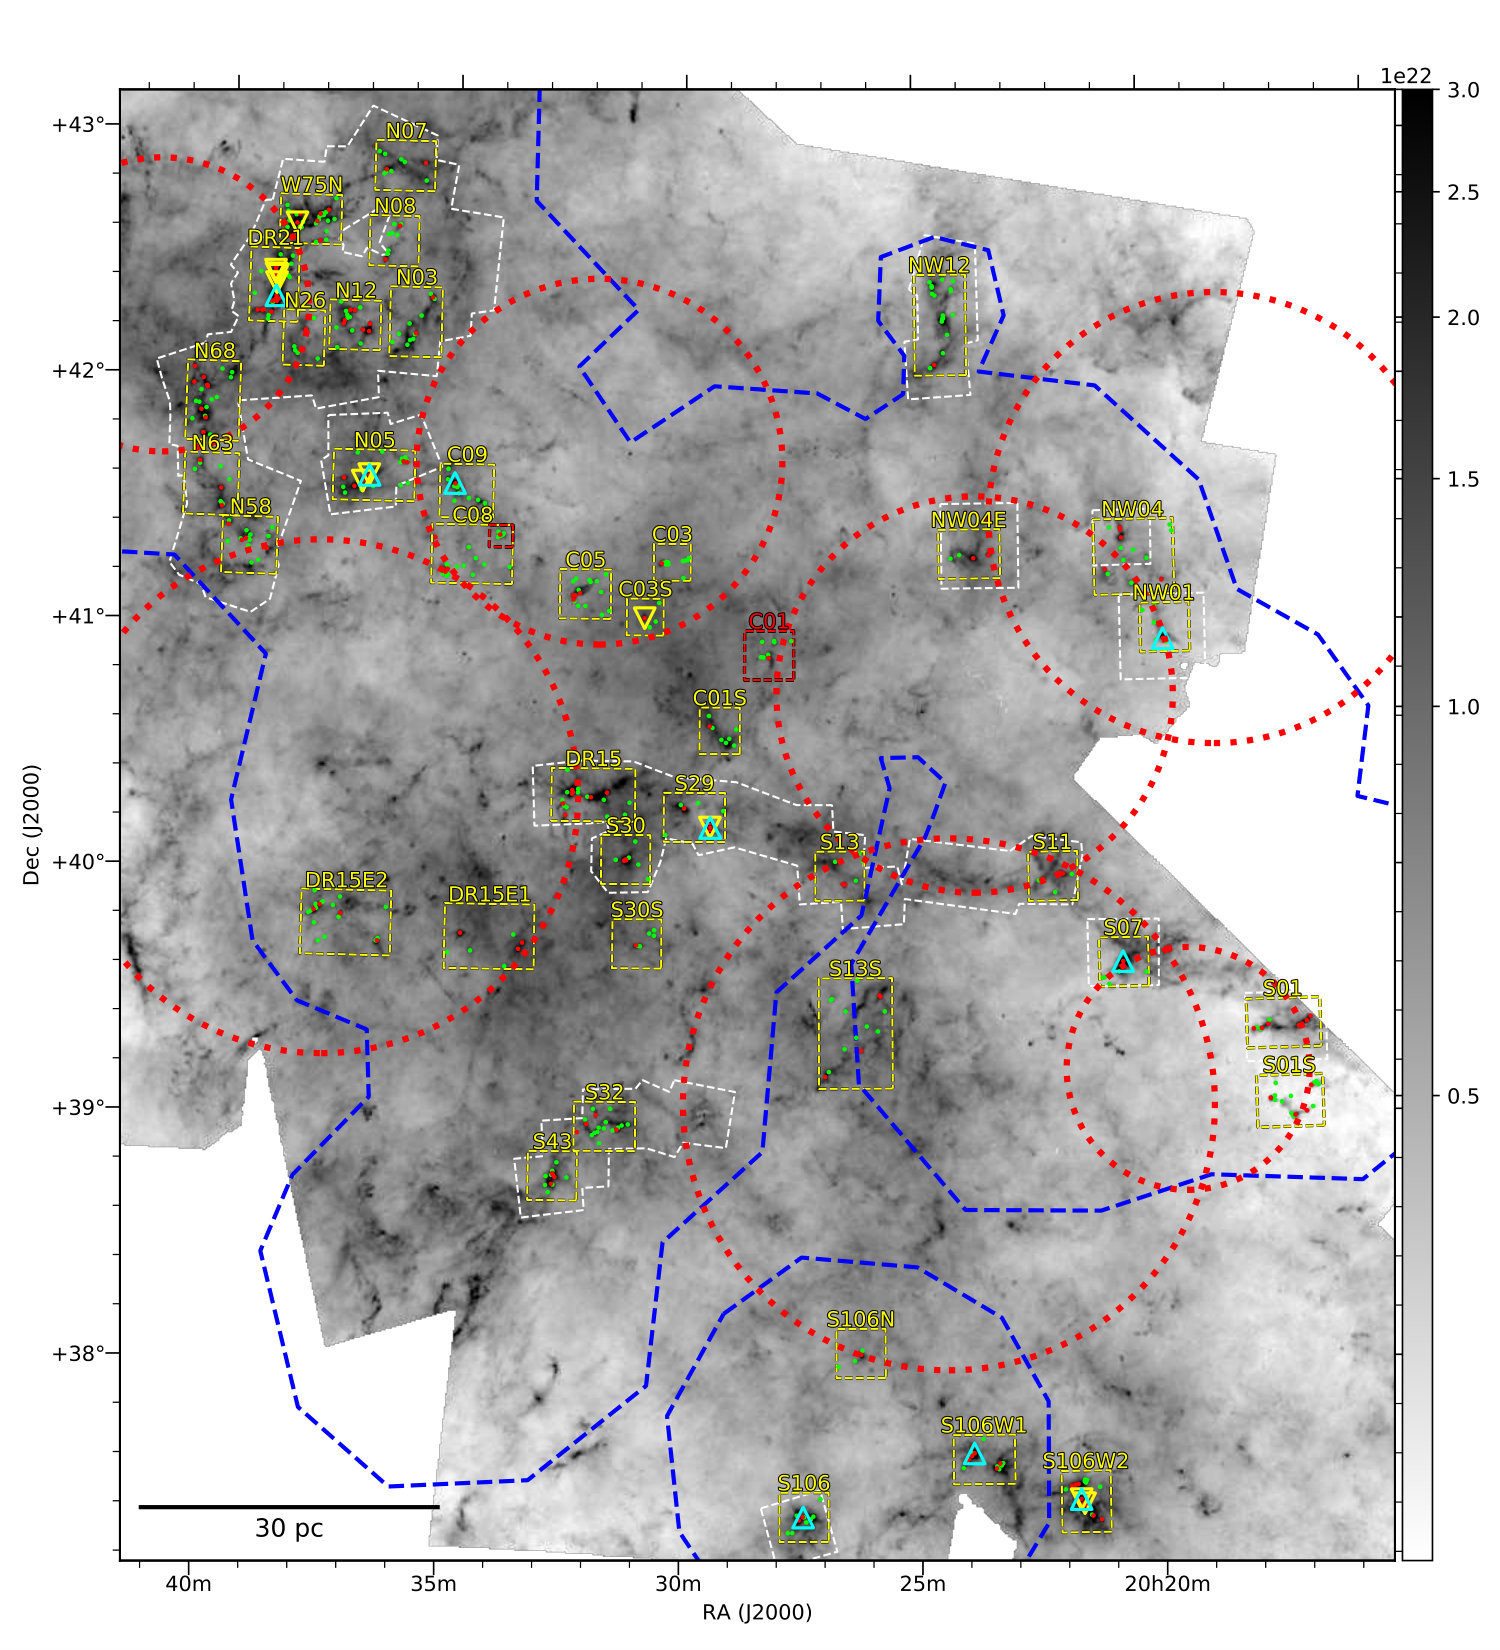 Figure 1
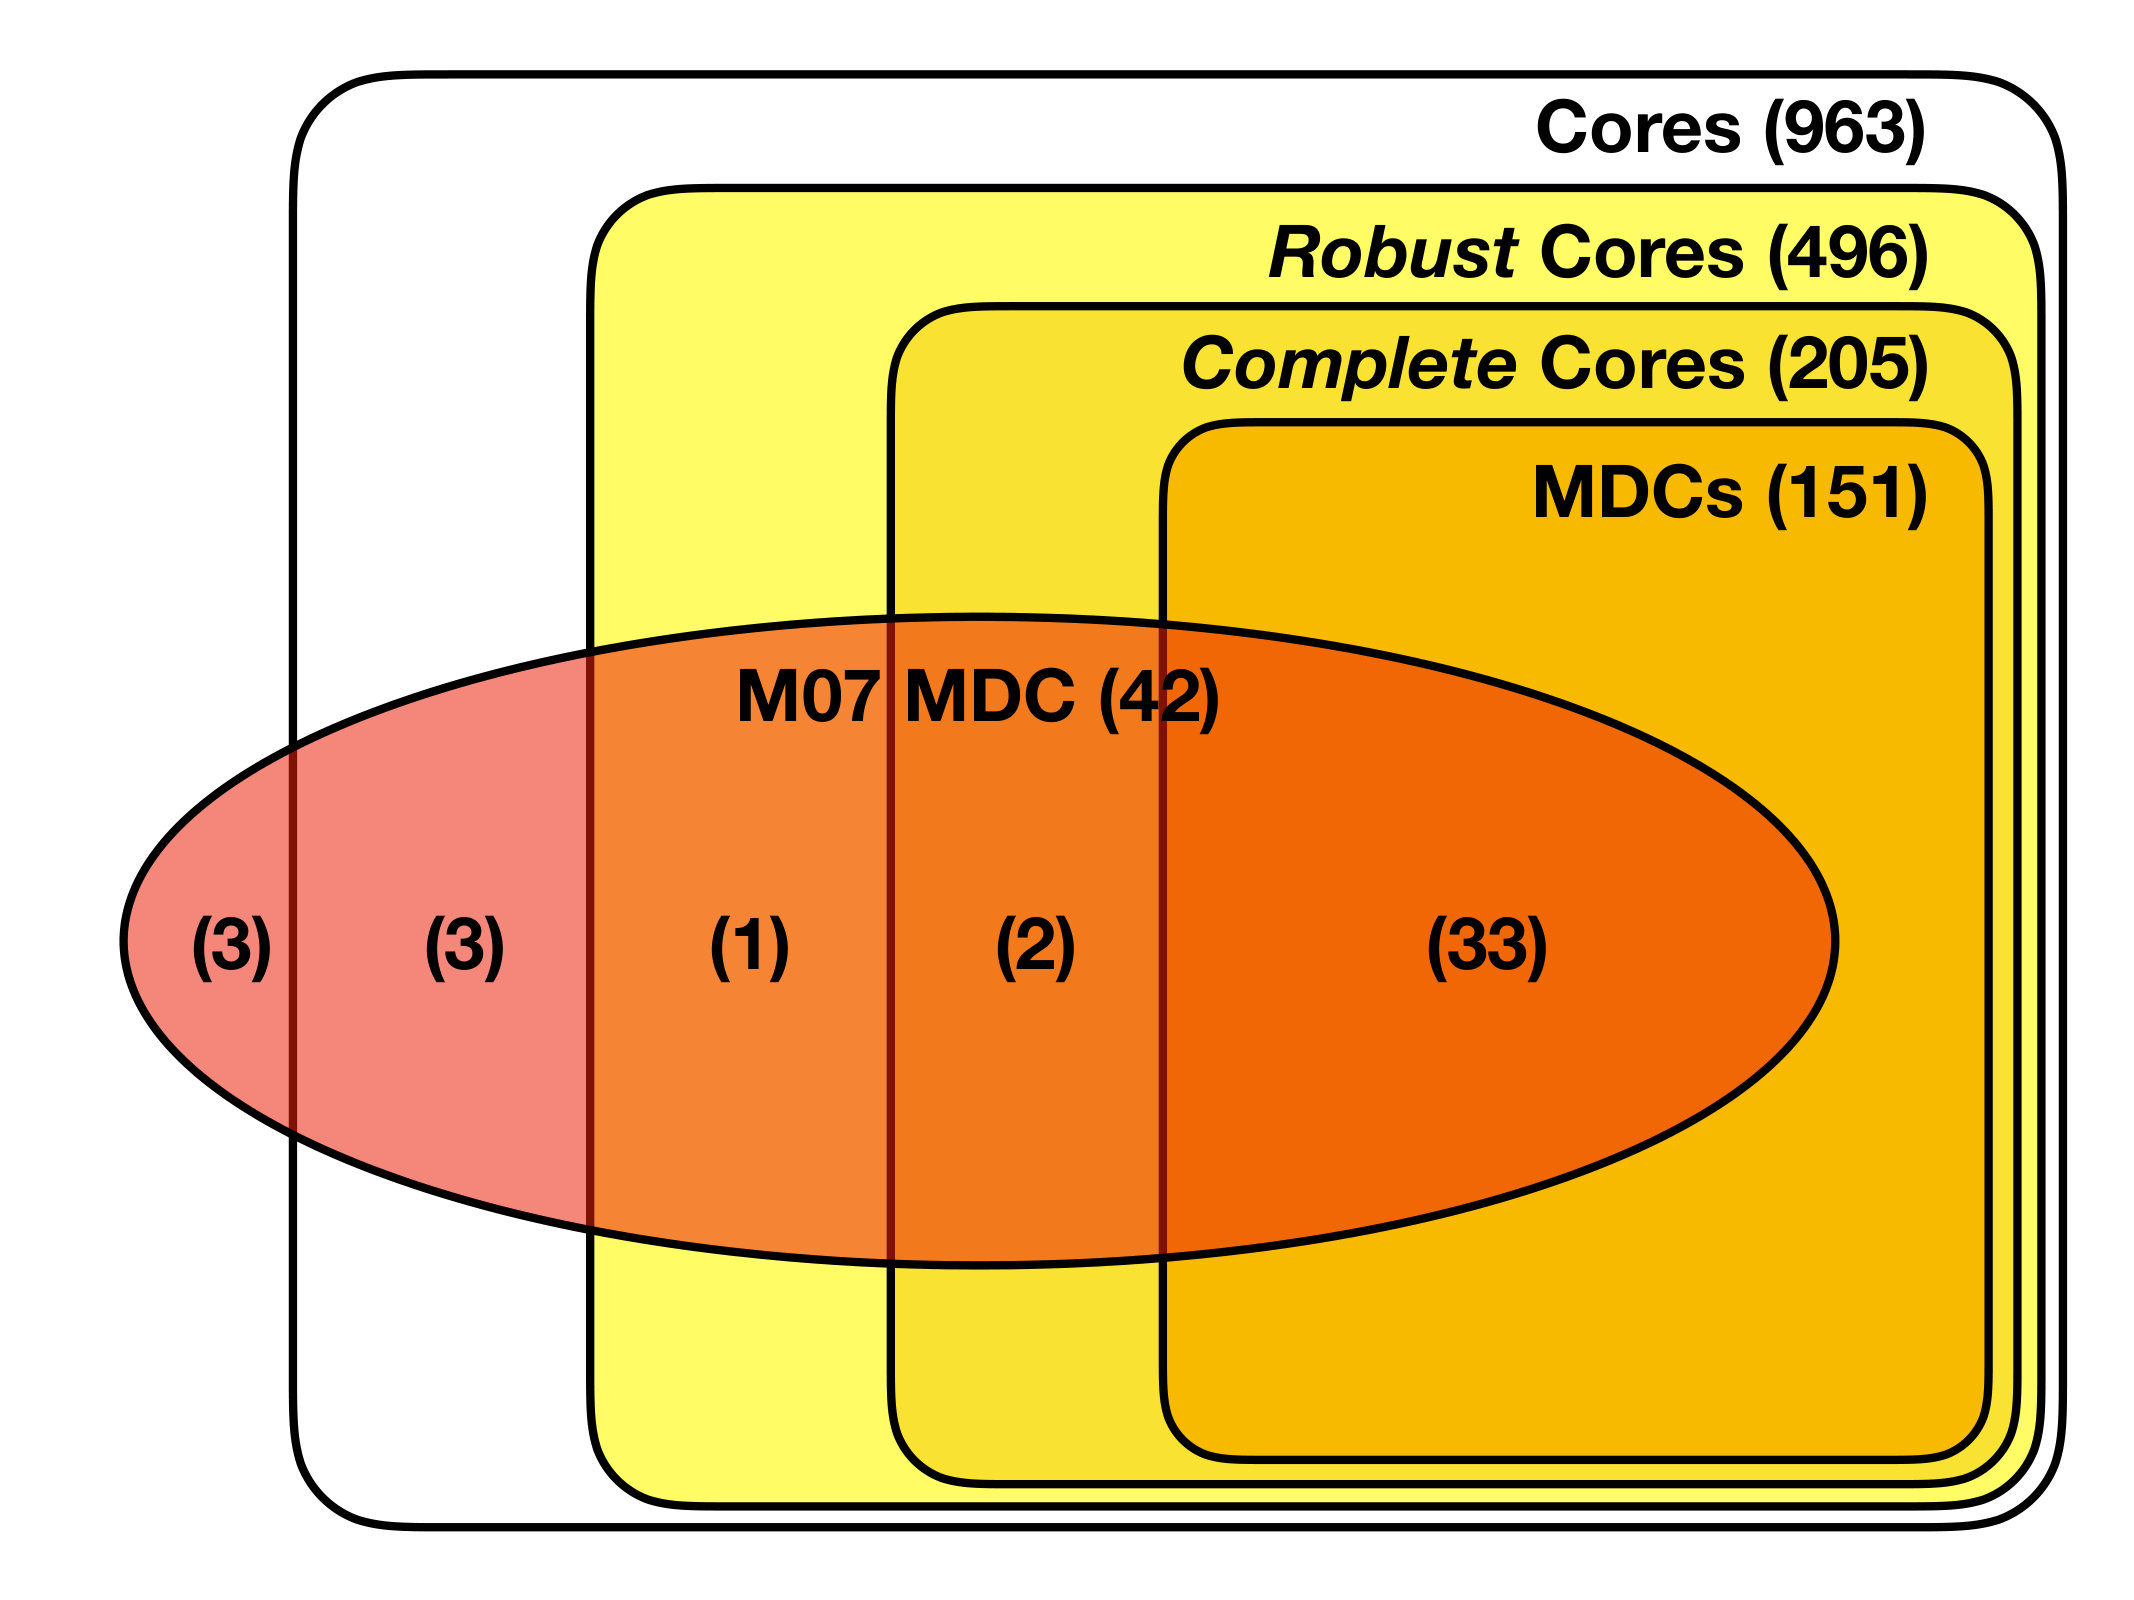 Figure 2
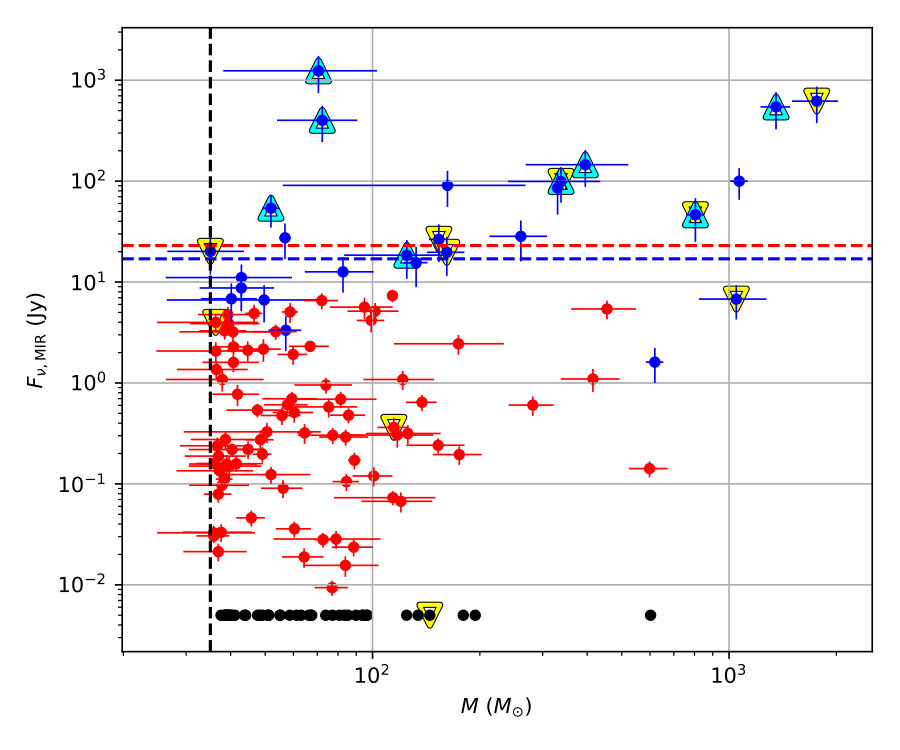 Figure 3
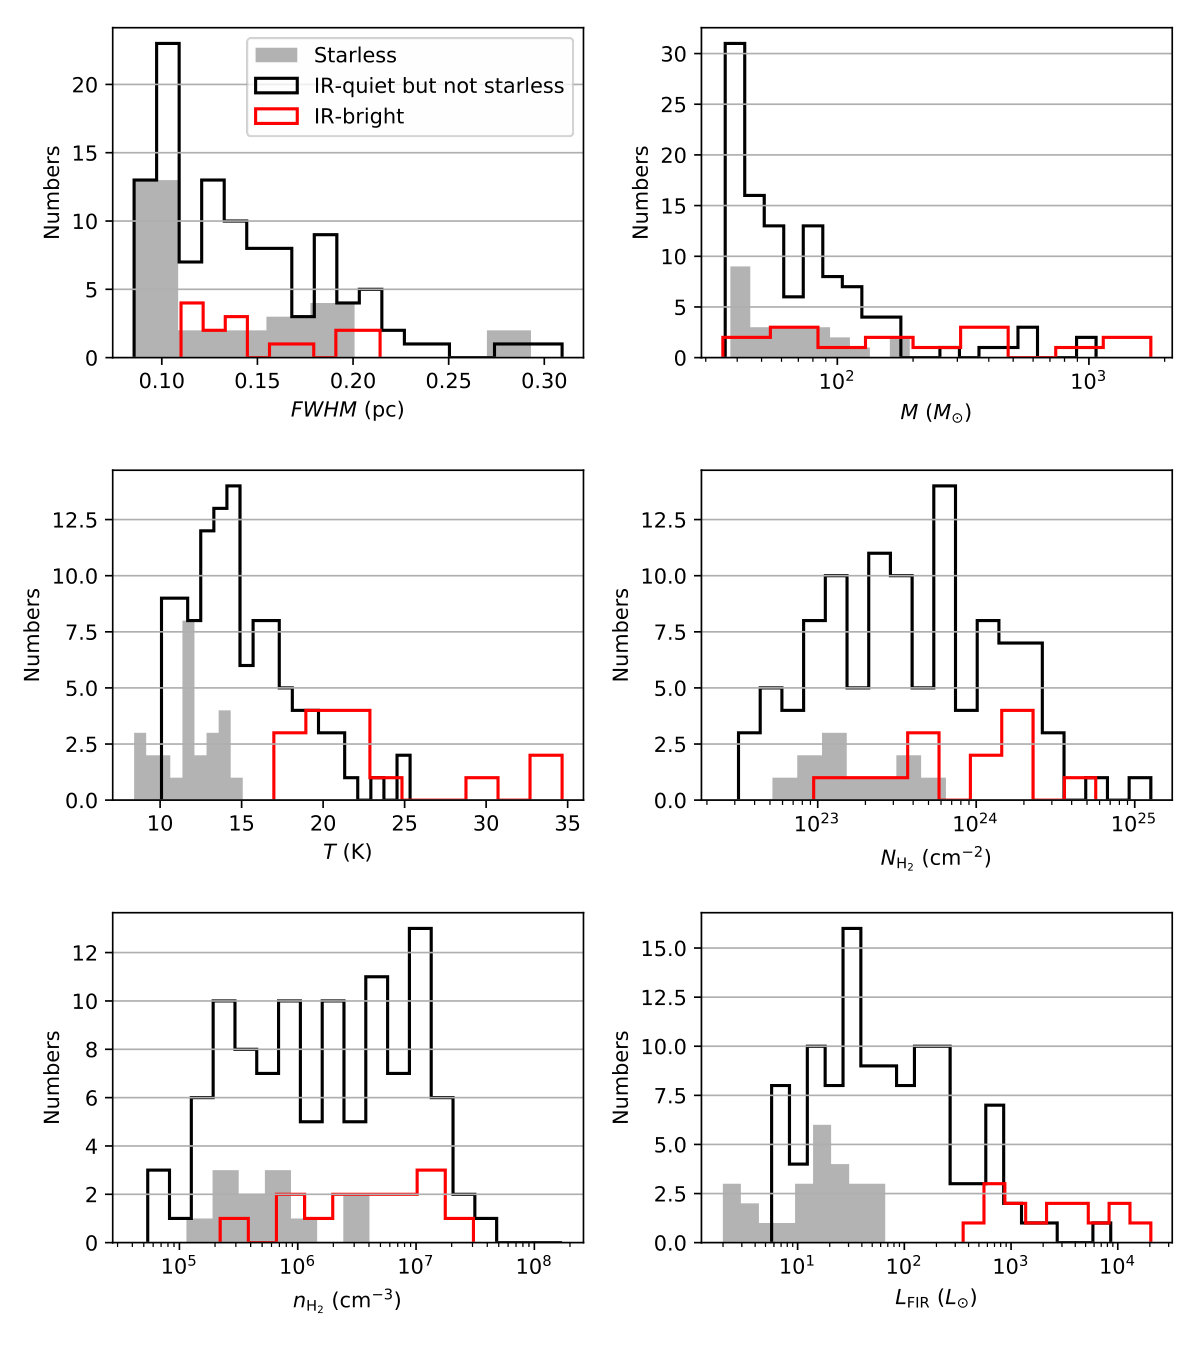 Figure 4
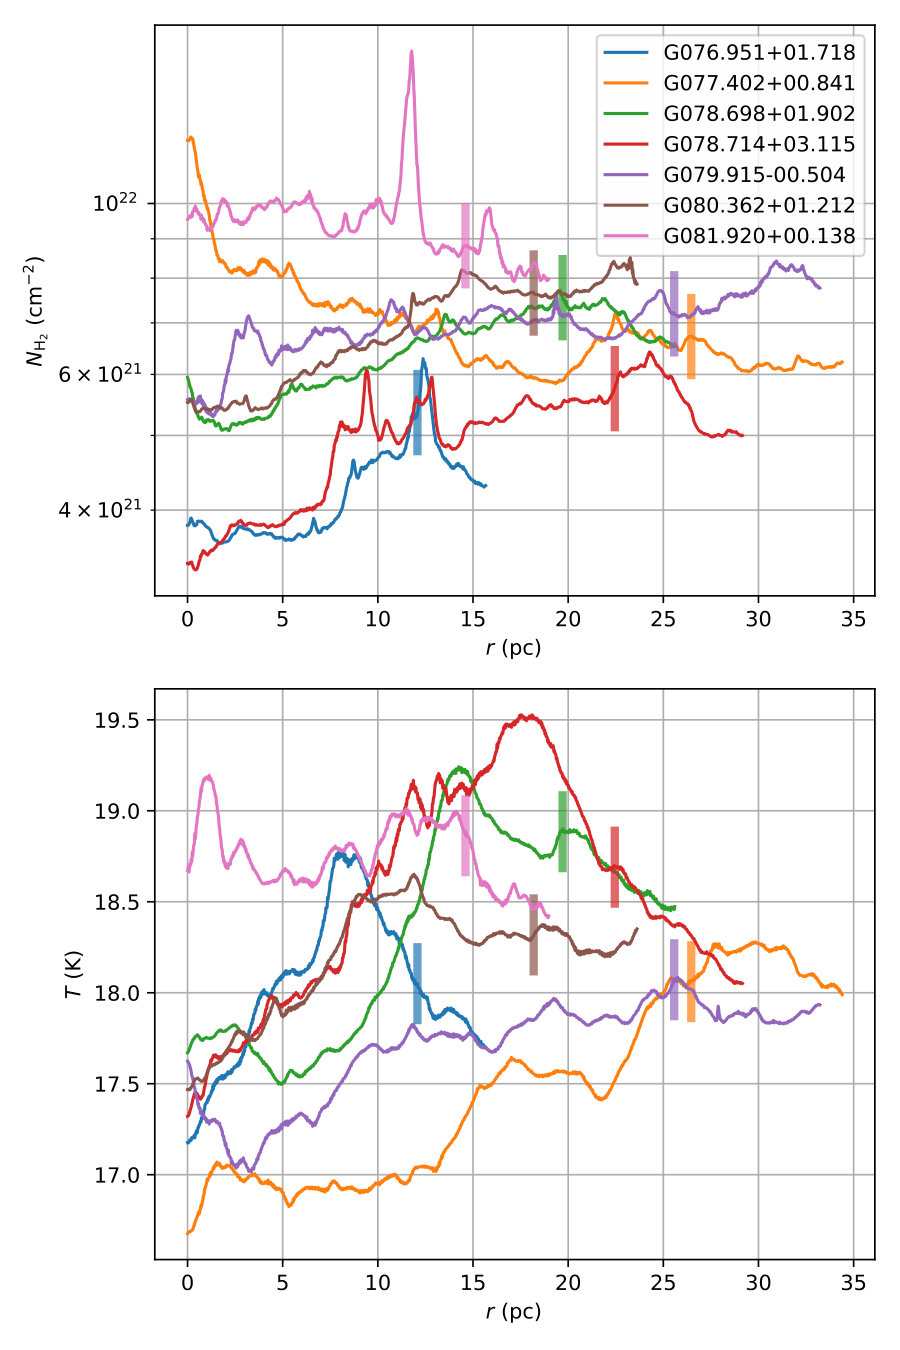 Figure 5
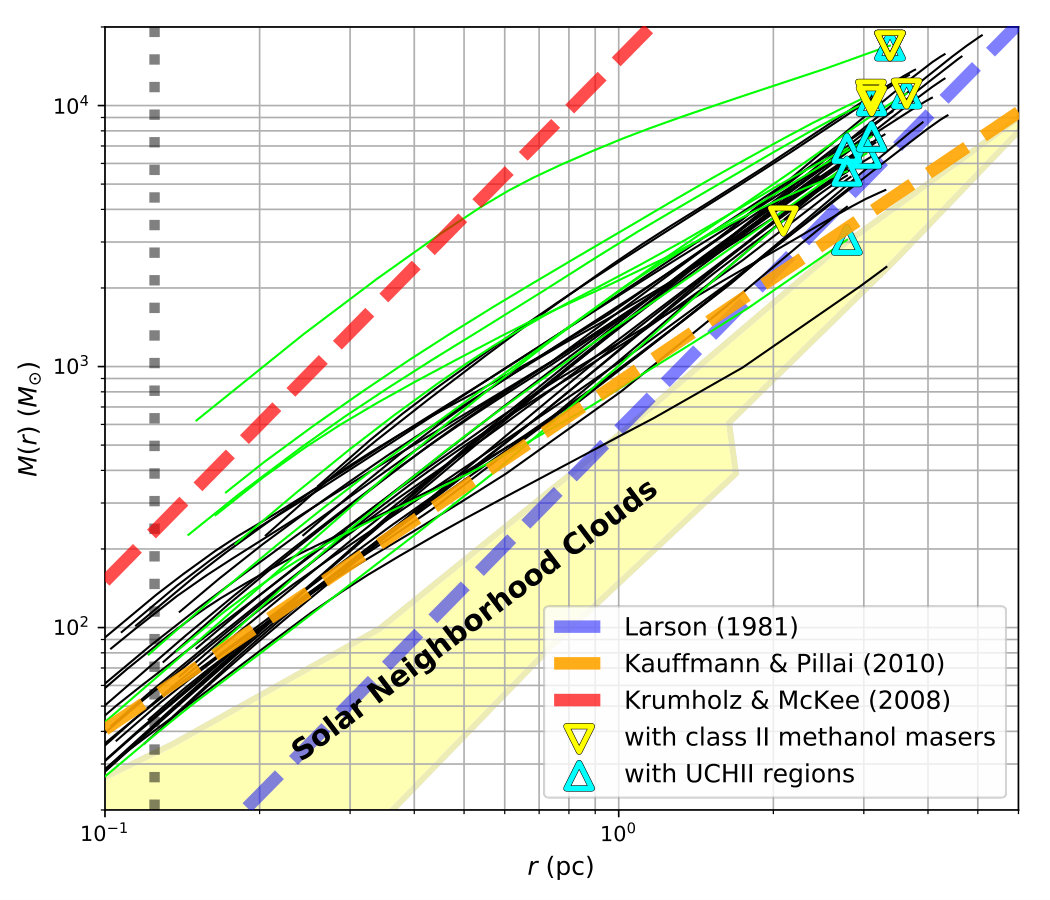 Figure 6
 Figure 7
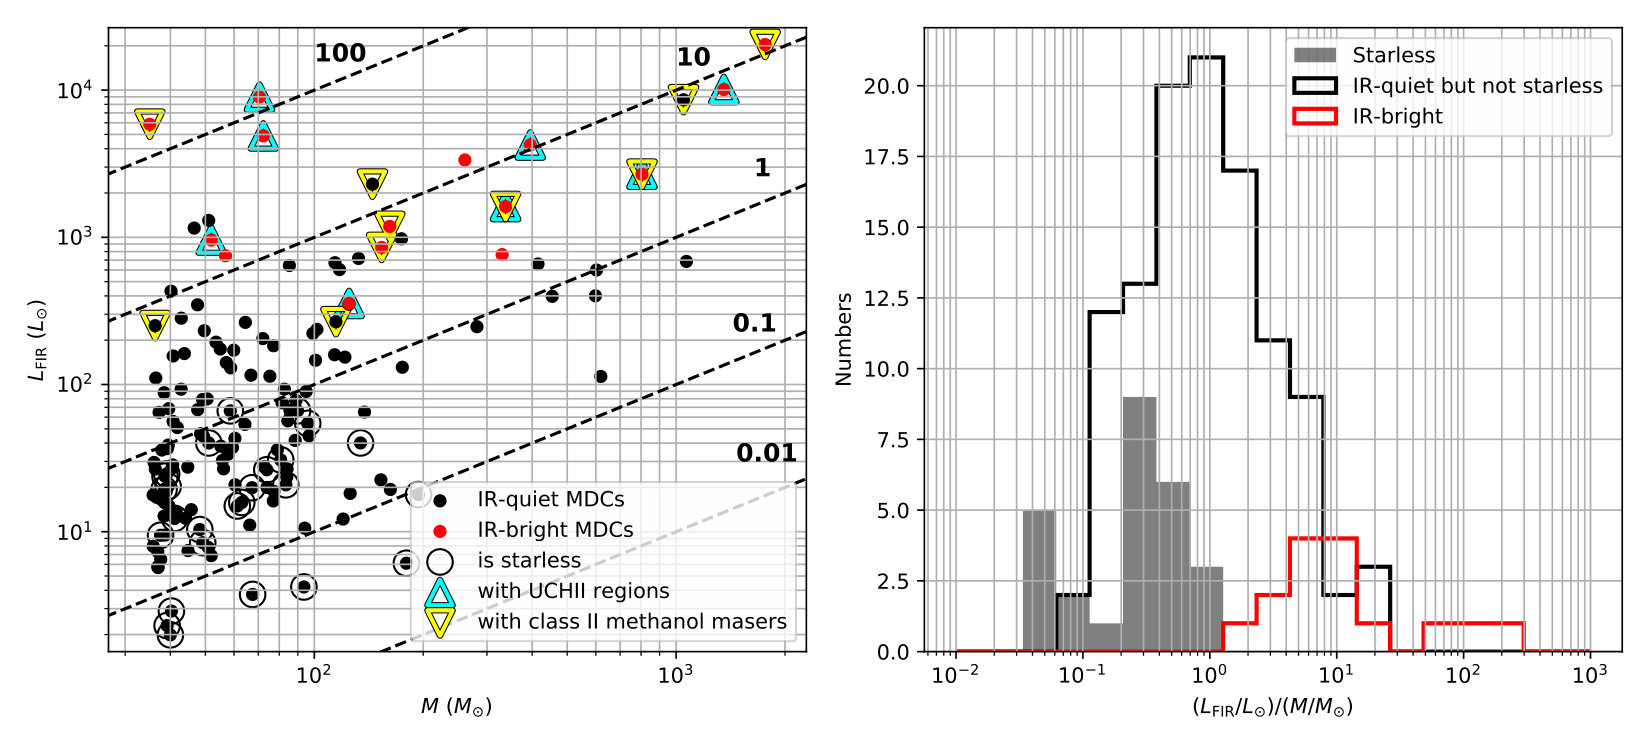 Figure 8
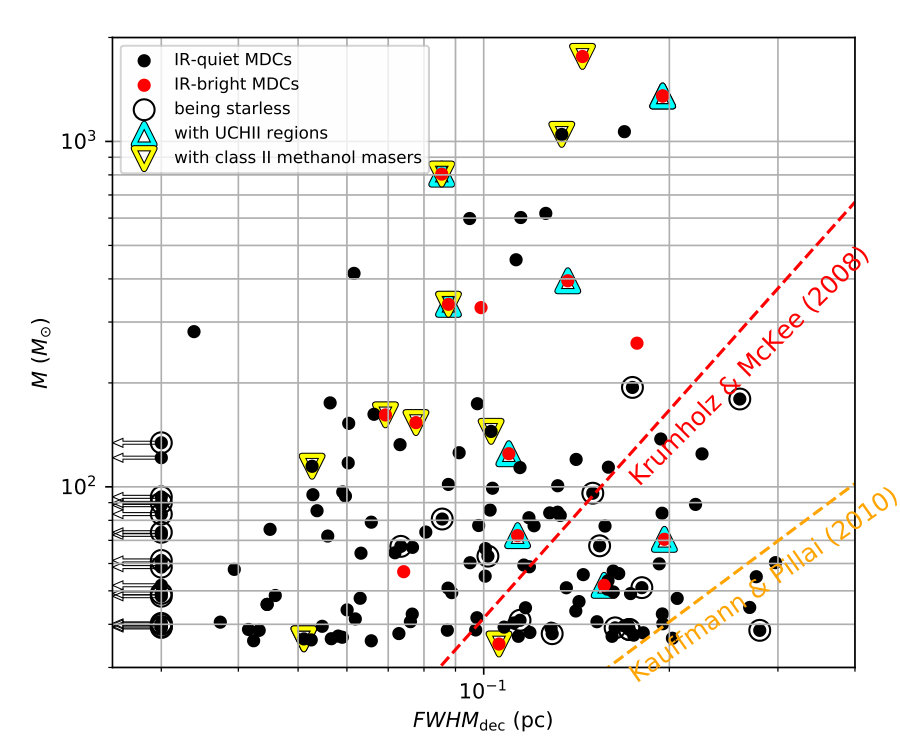 Figure 9
 Figure 10
 Figure 11
 Figure 12
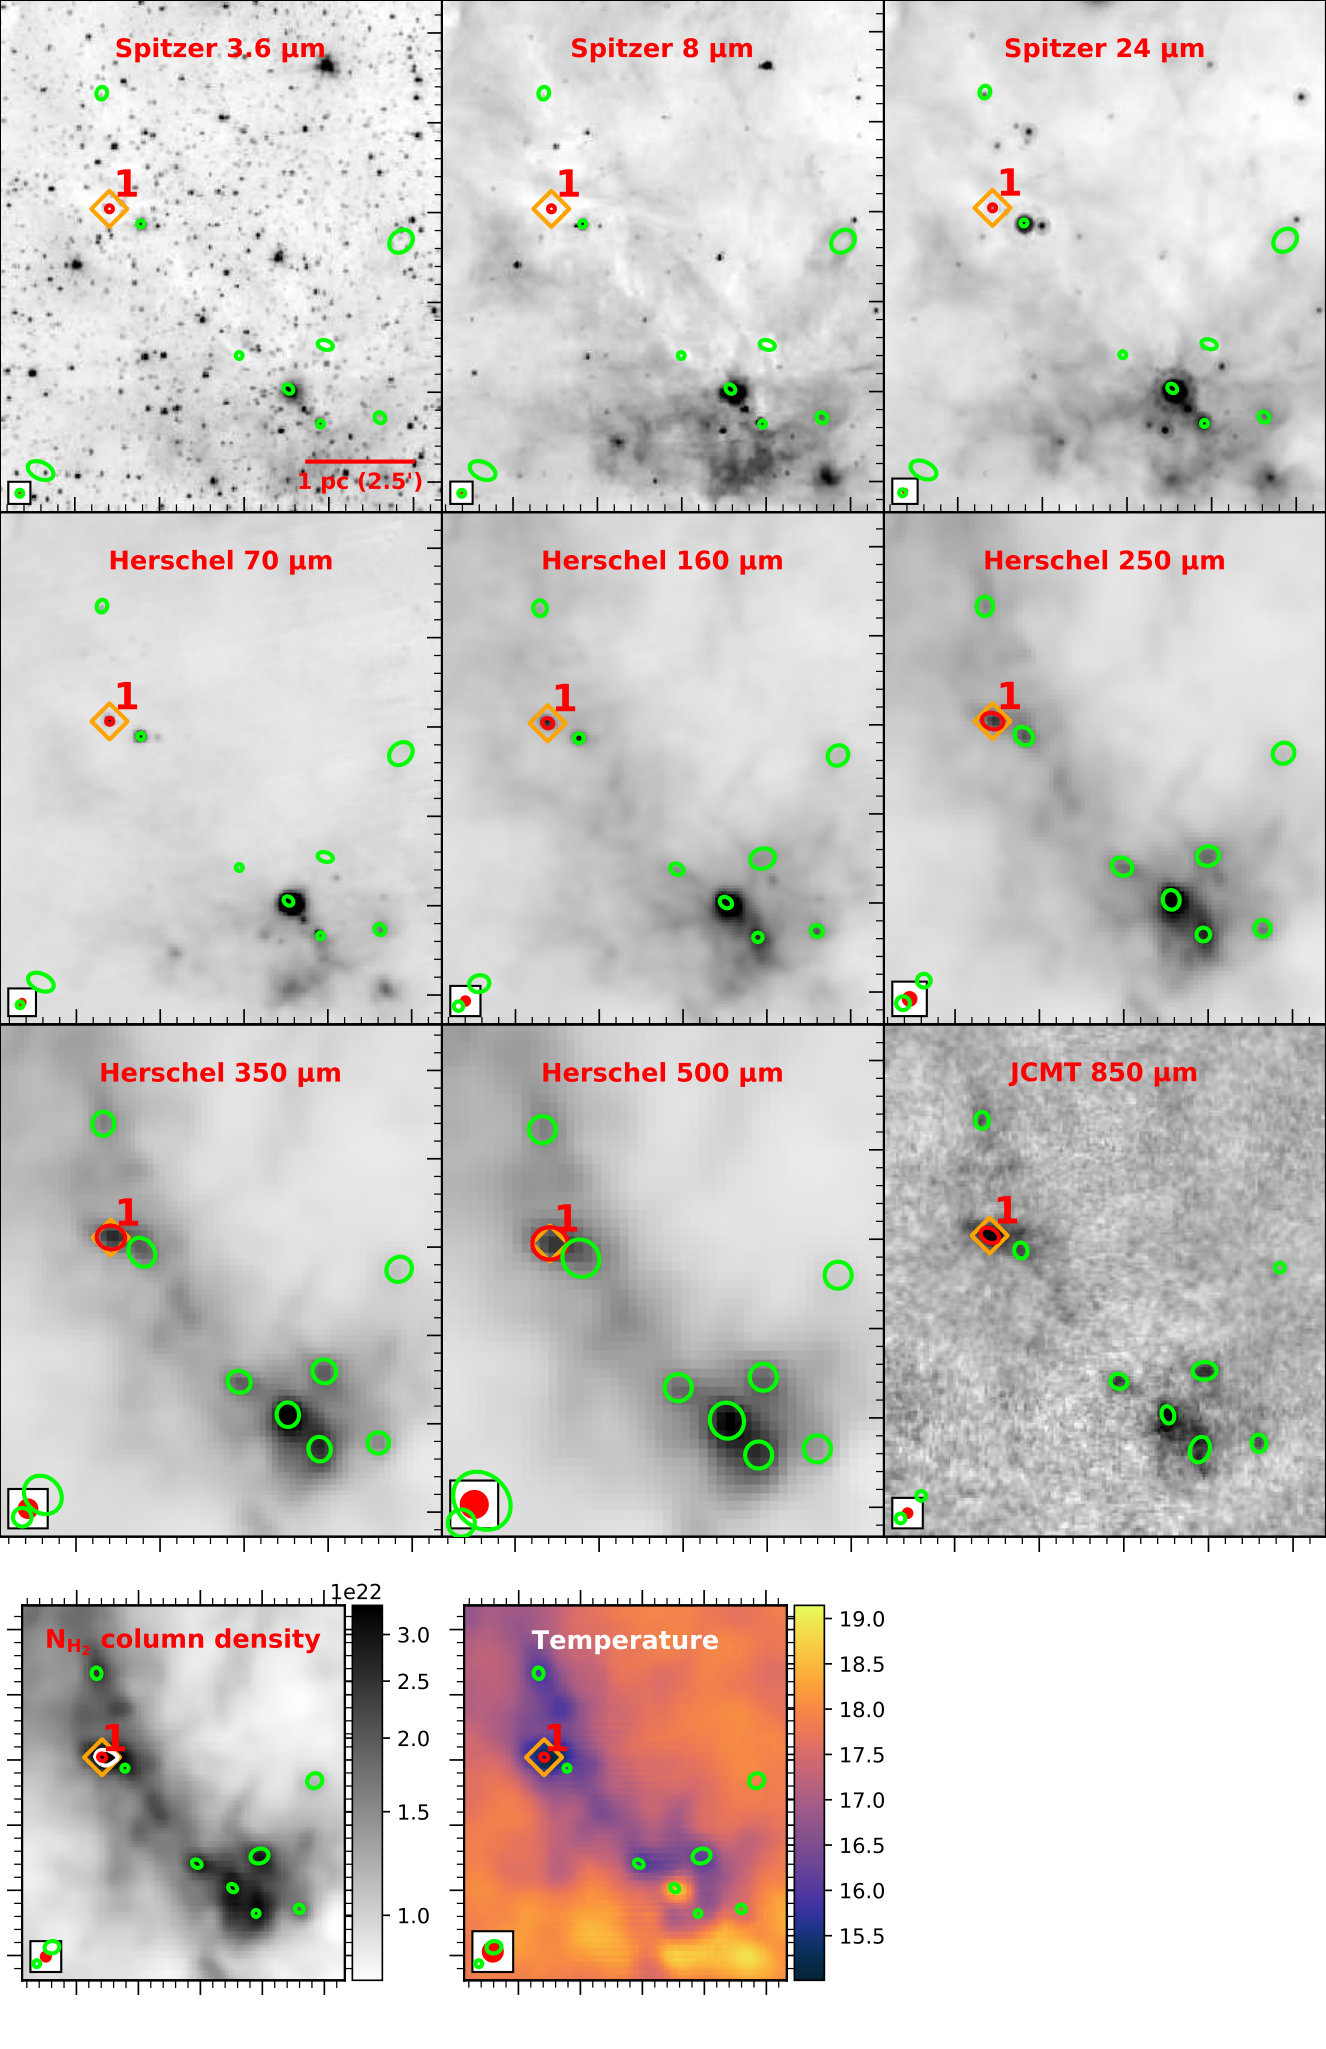 Figure 13
 Figure 14
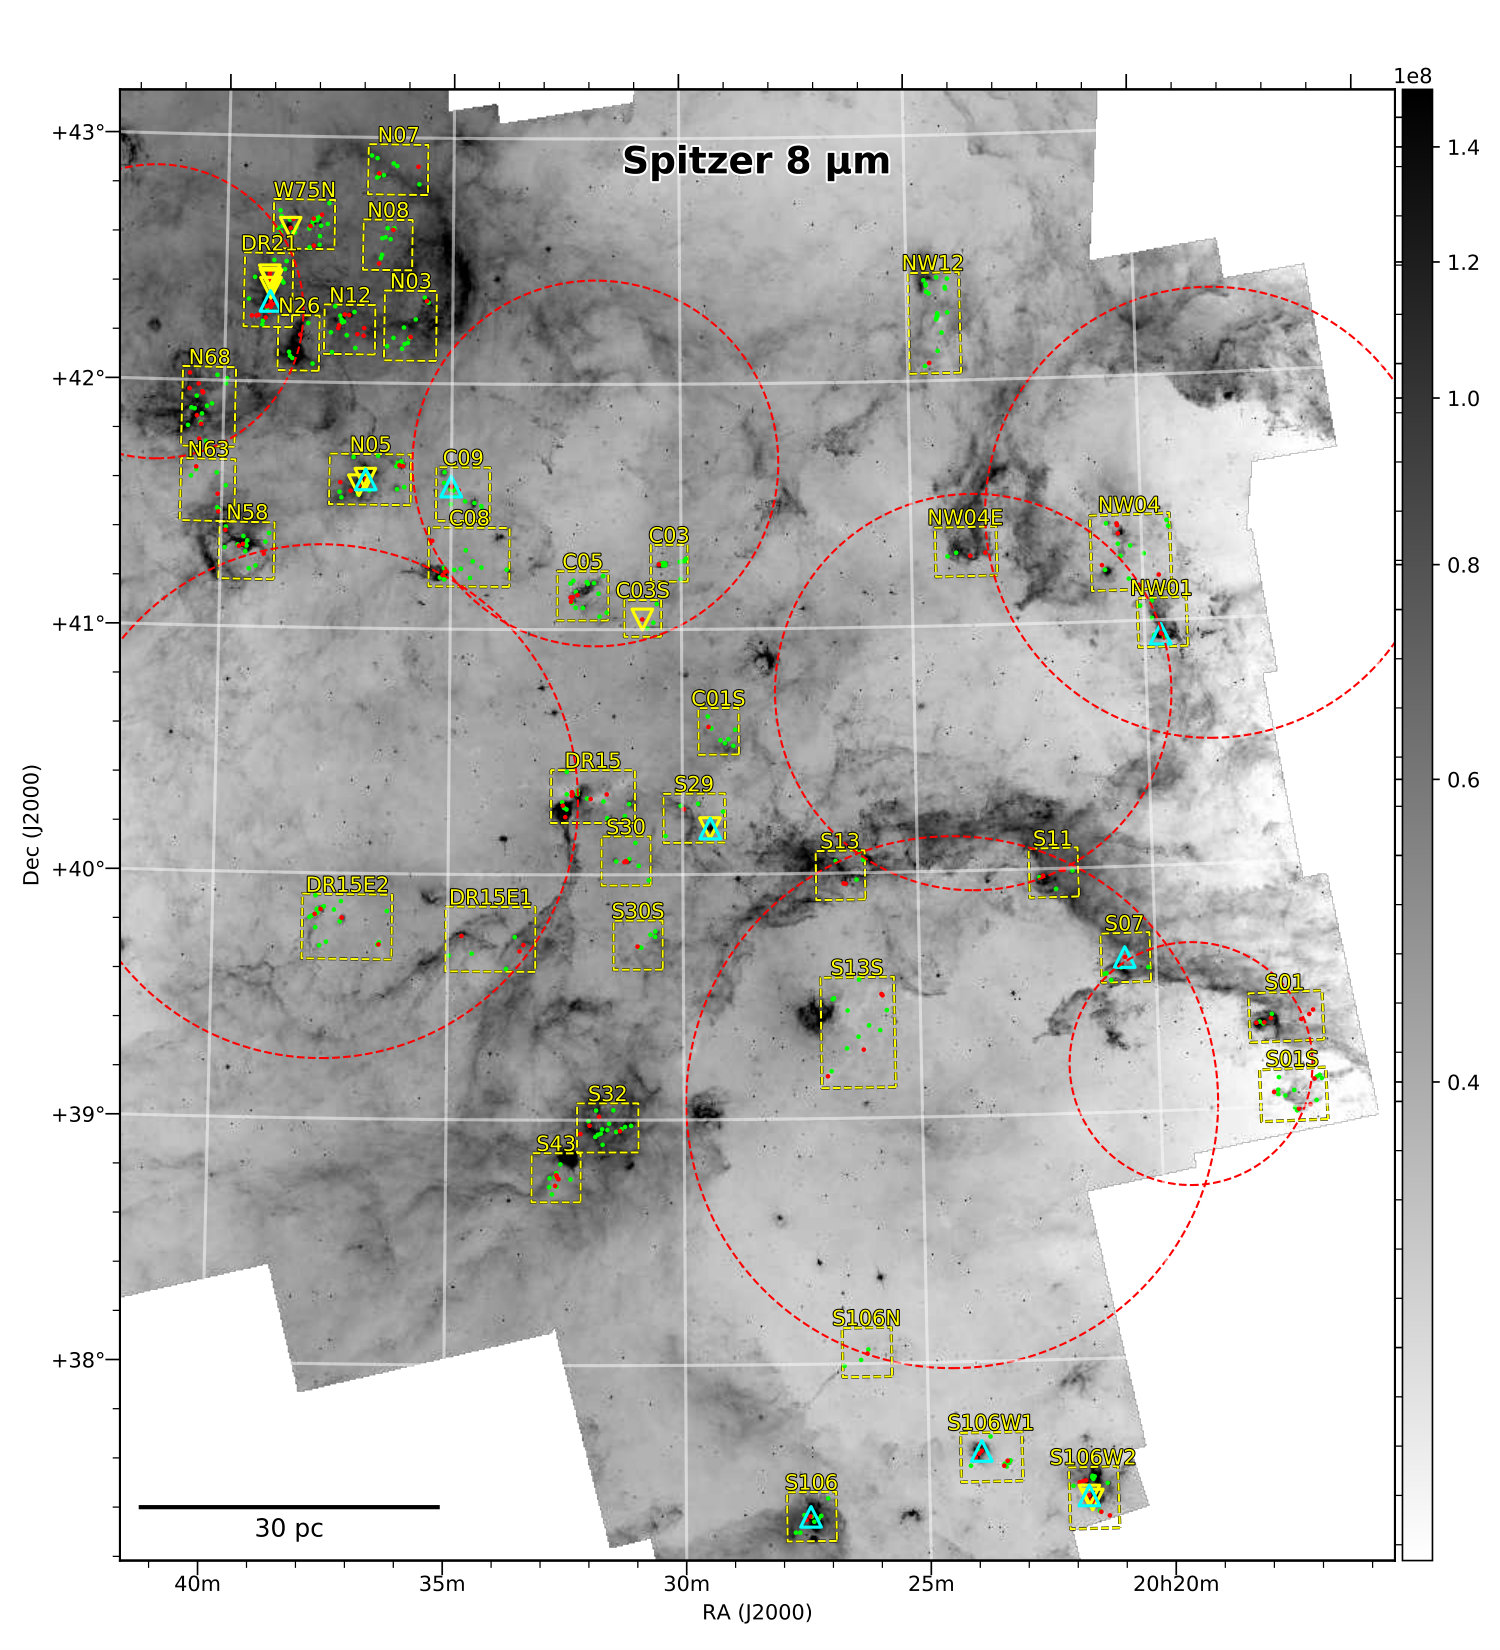 Figure 15
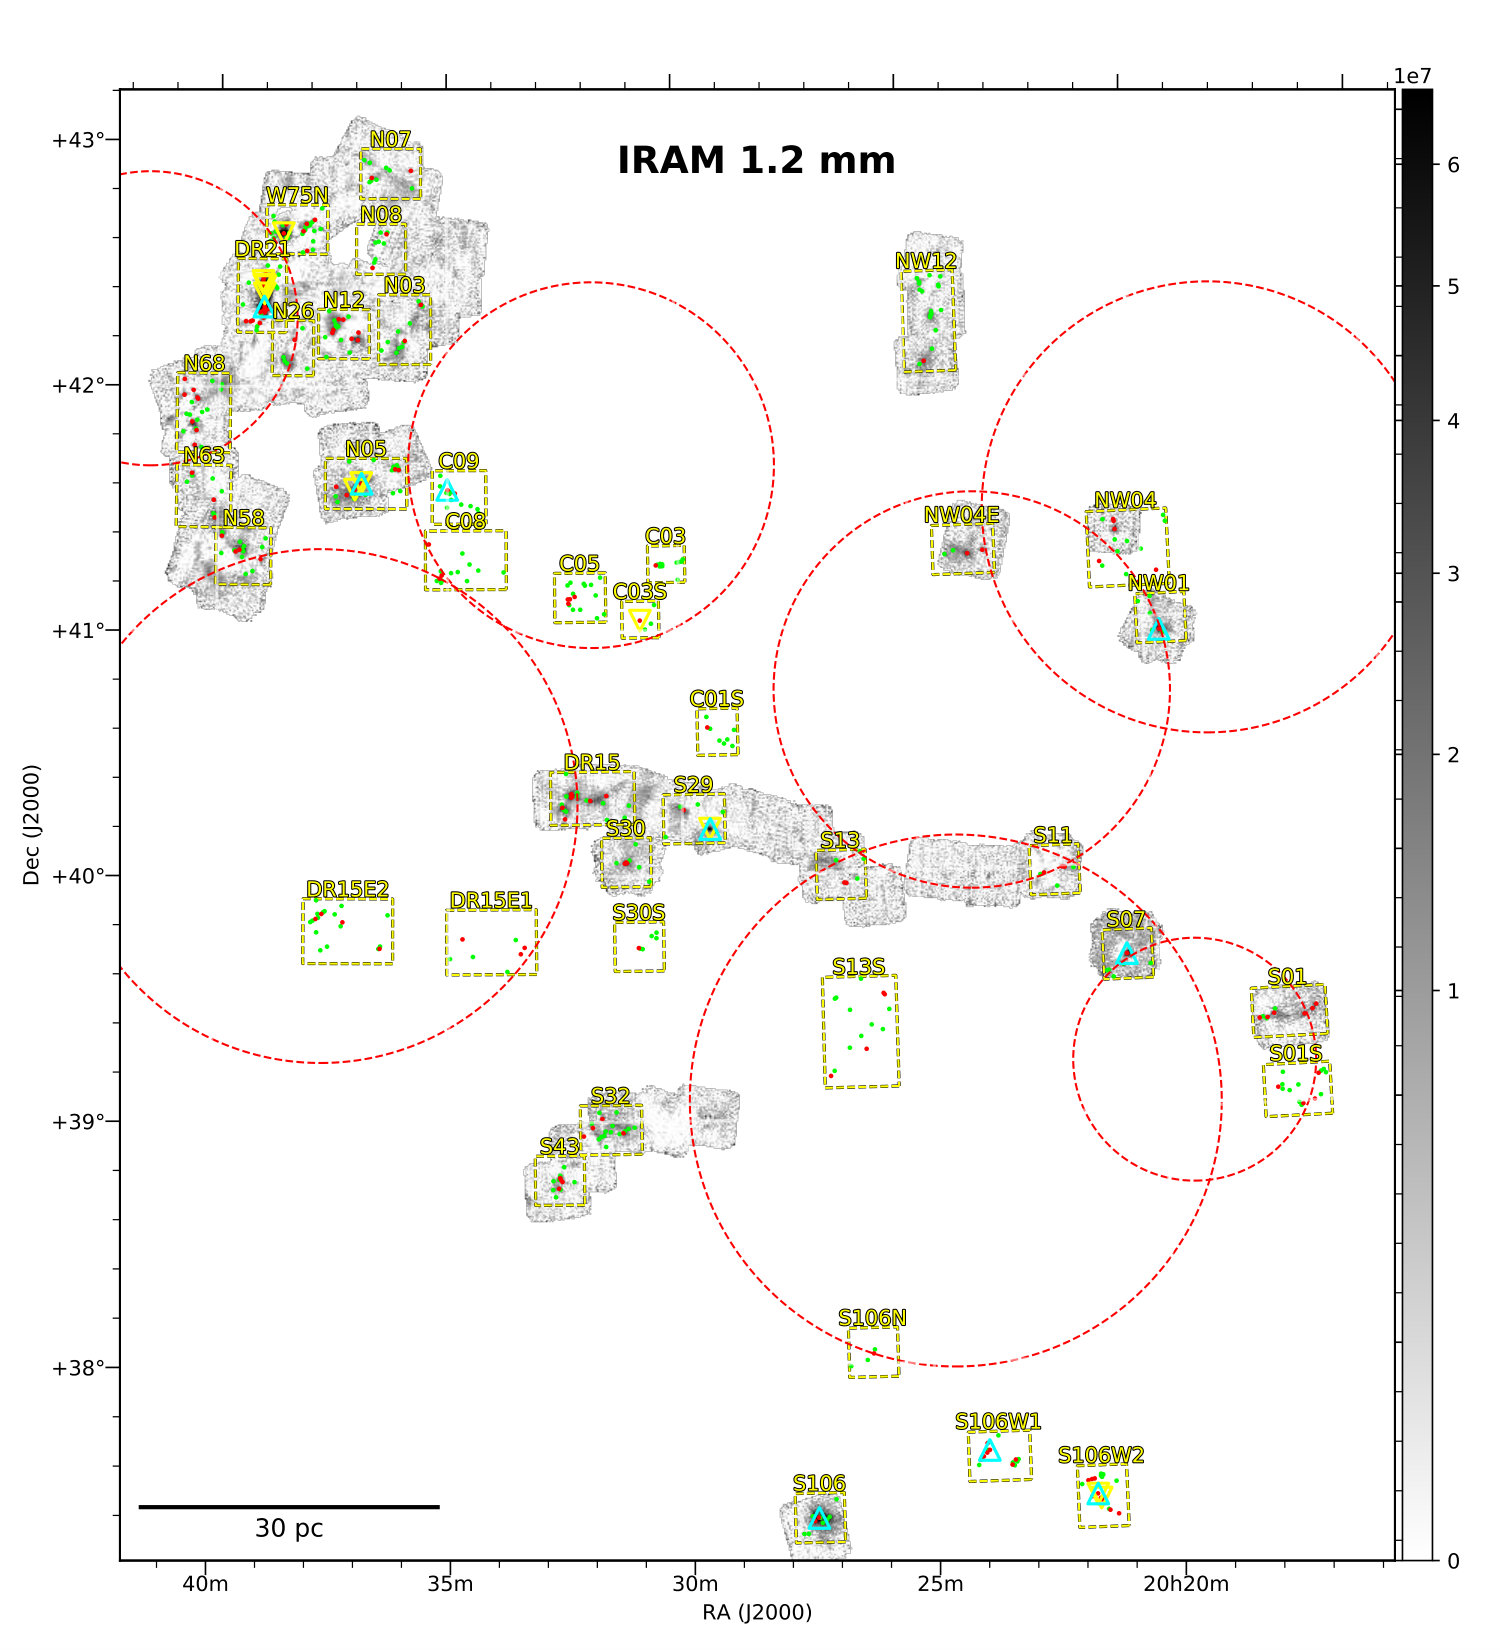 Figure 16
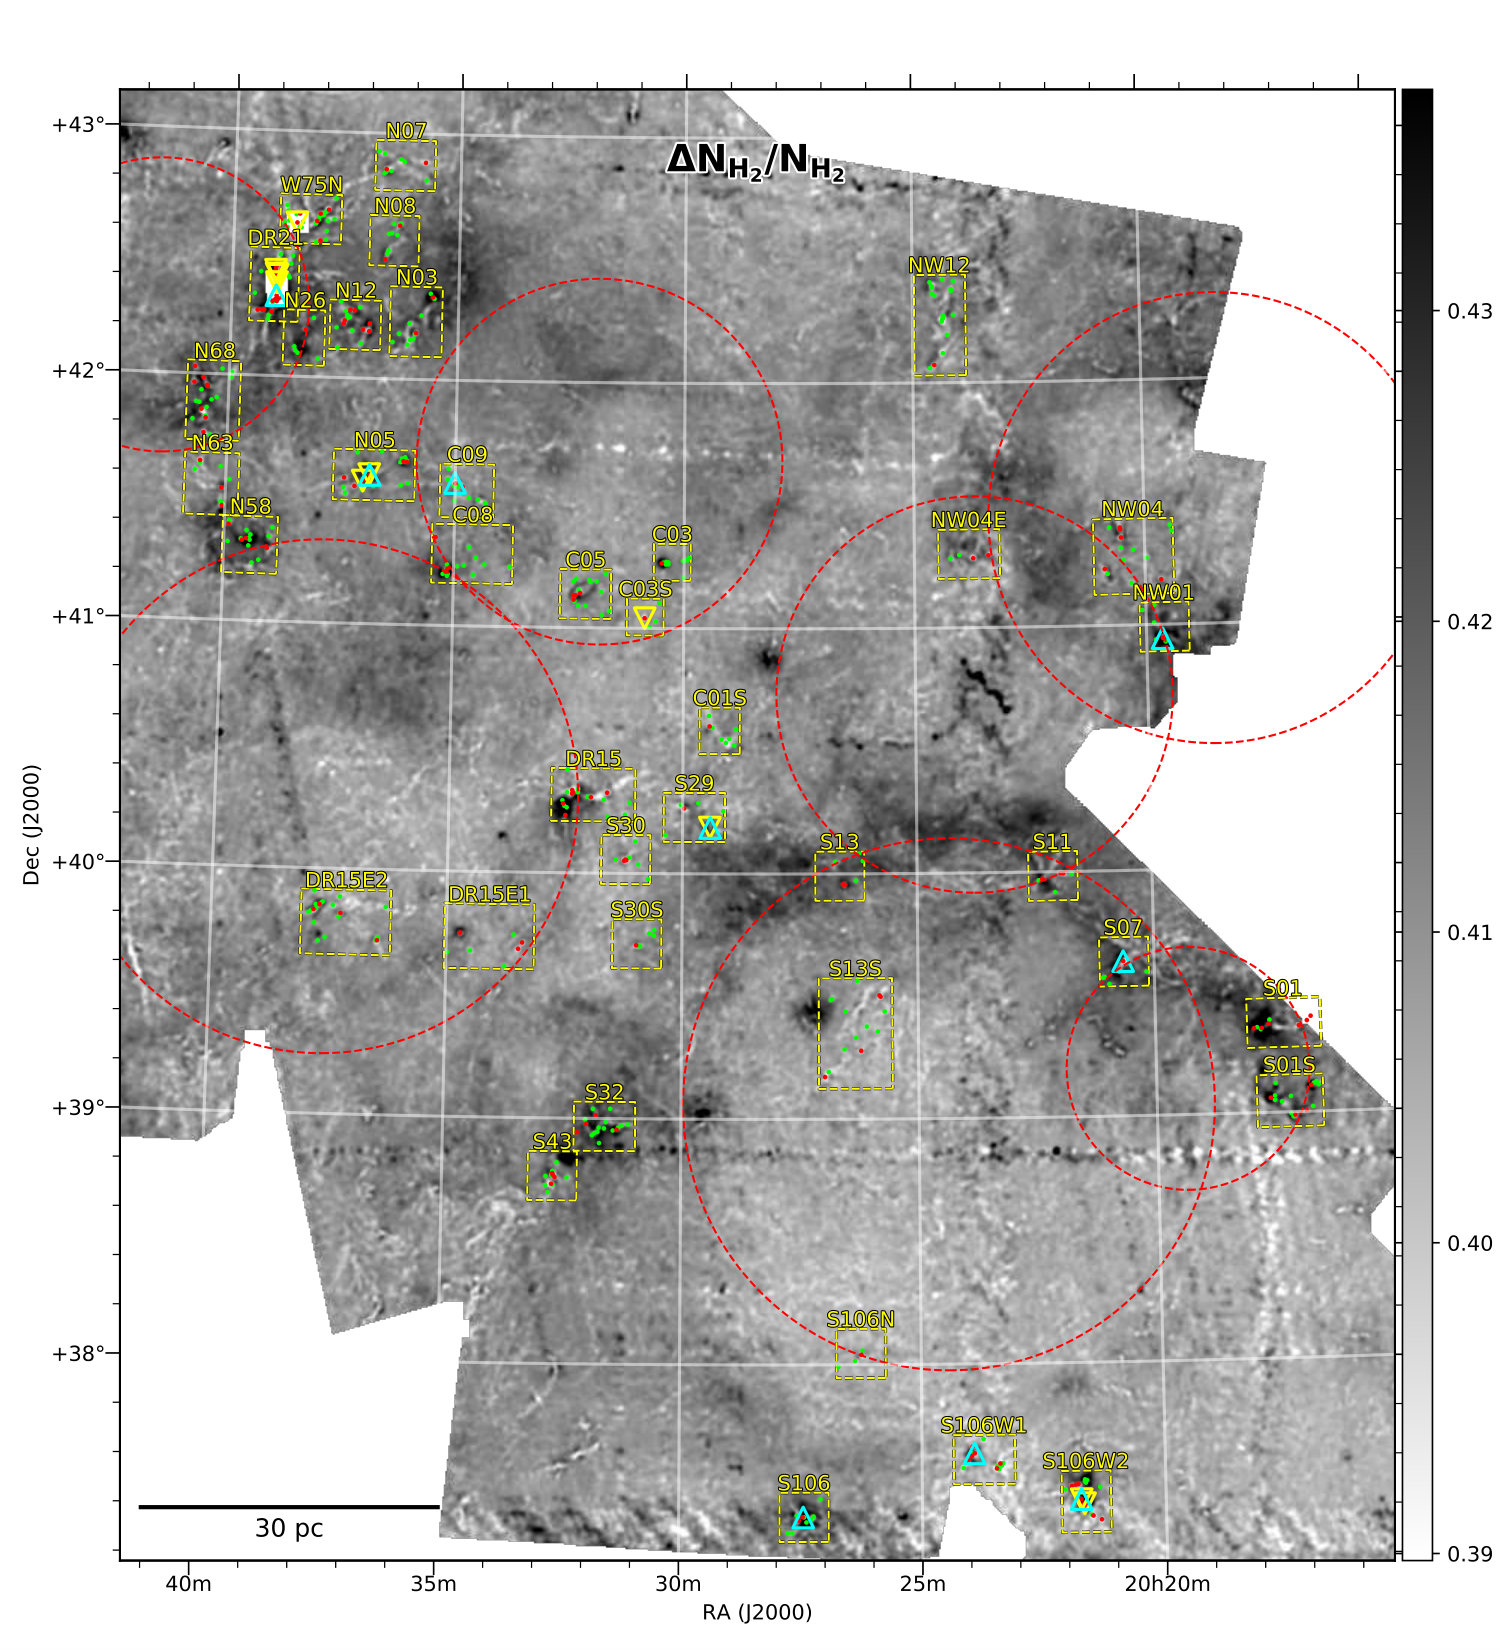 Figure 17
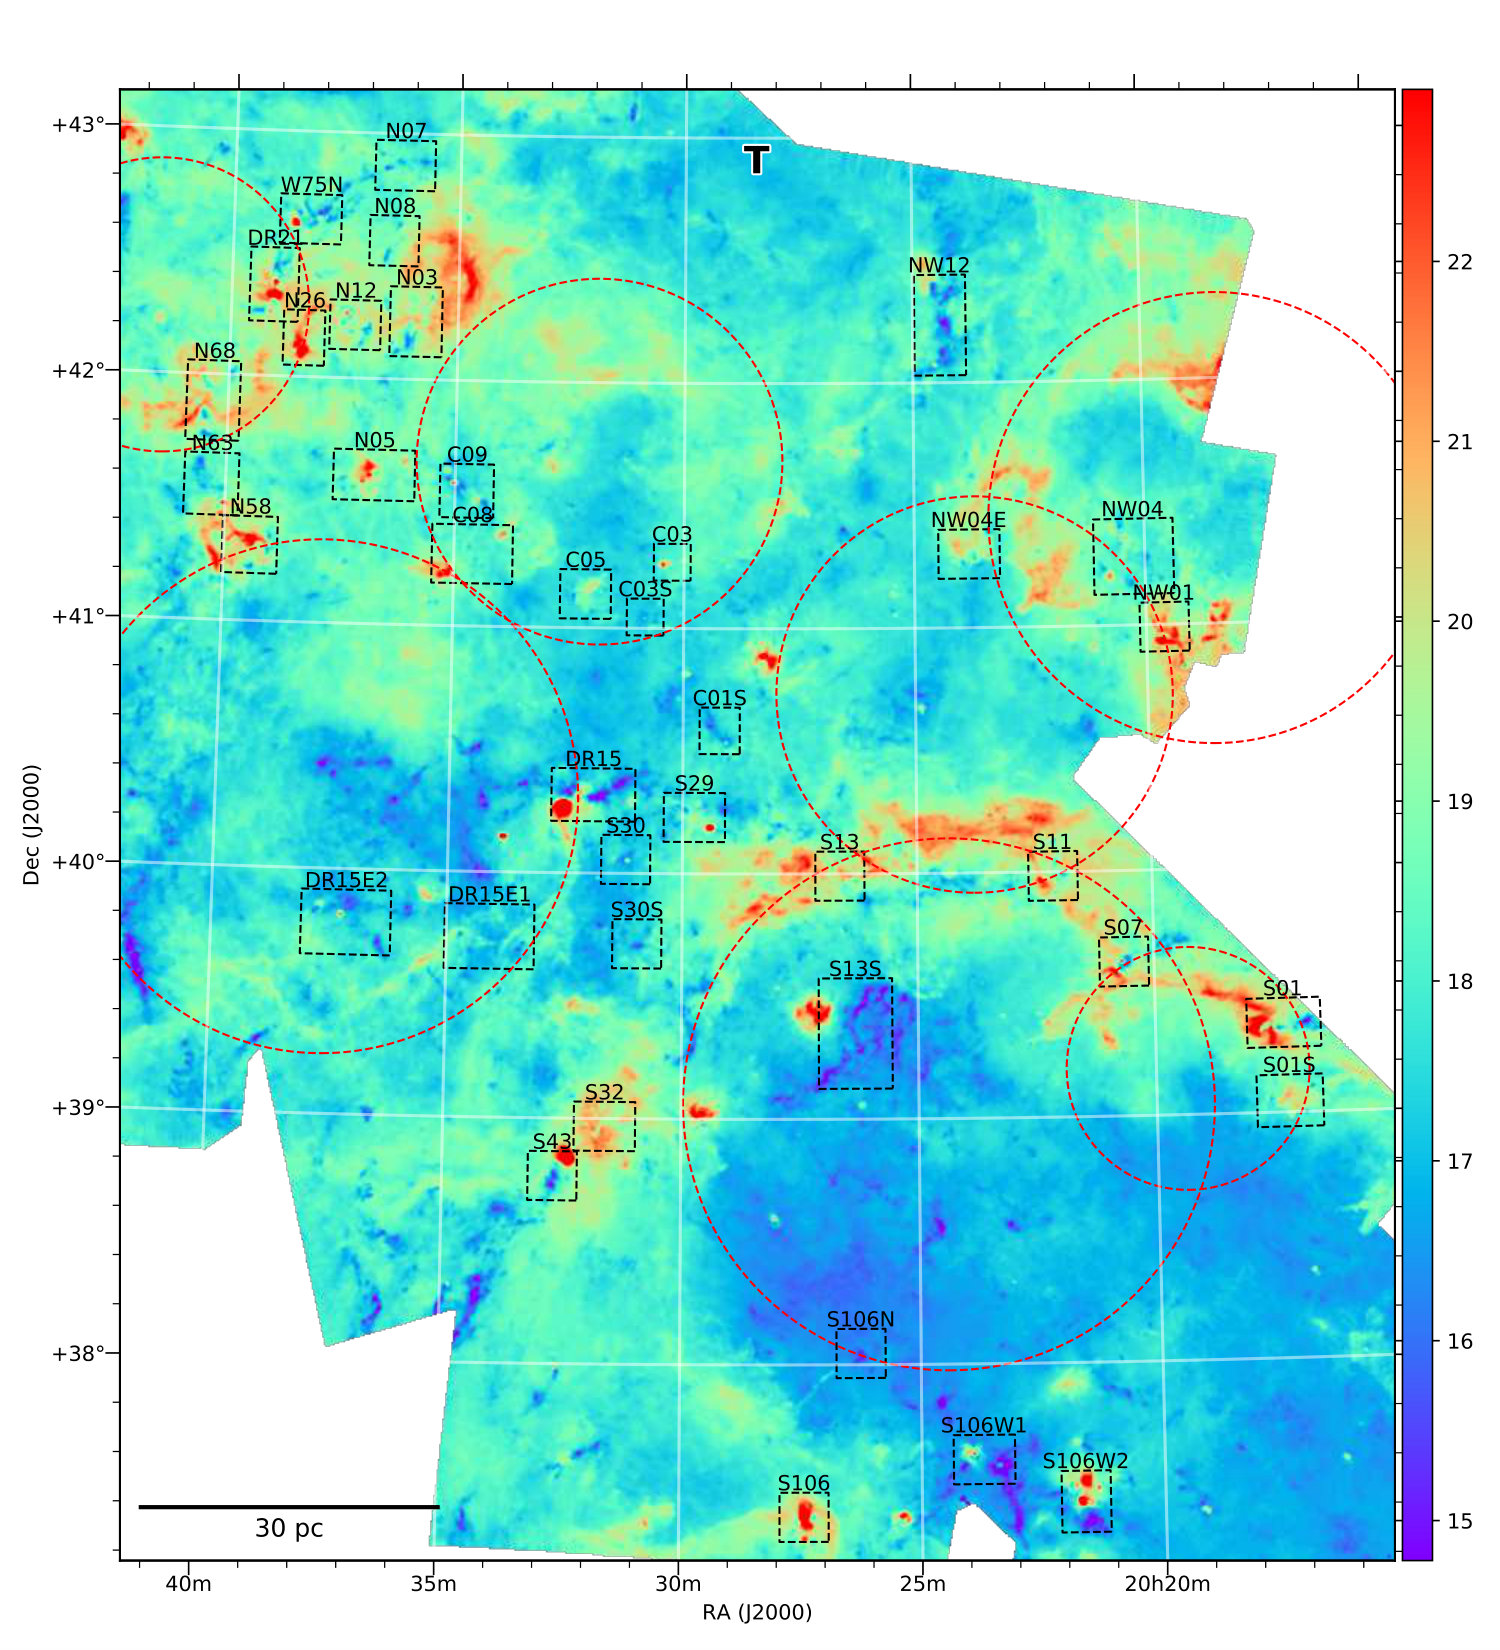 Figure 18
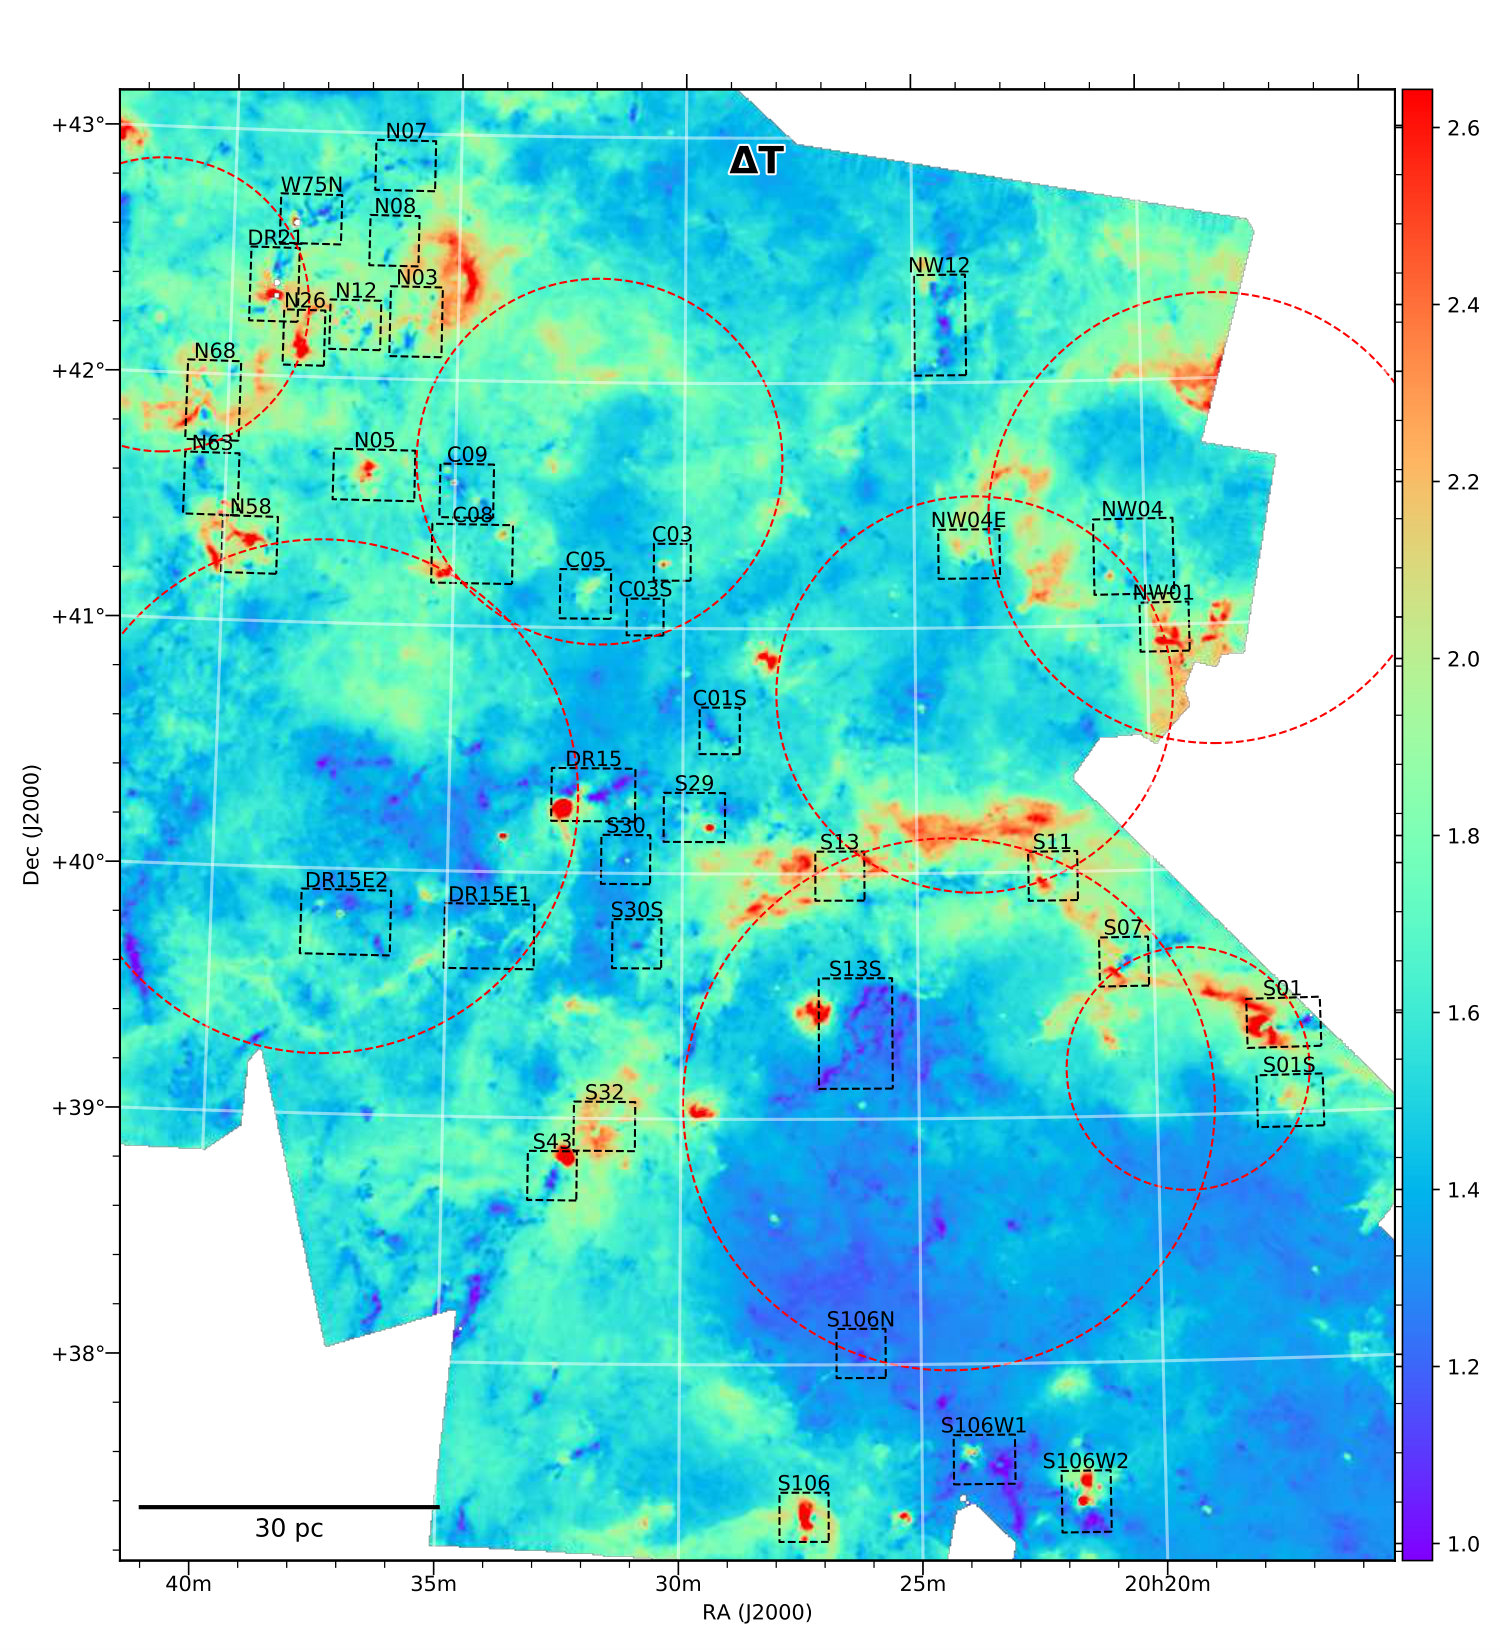 Figure 19
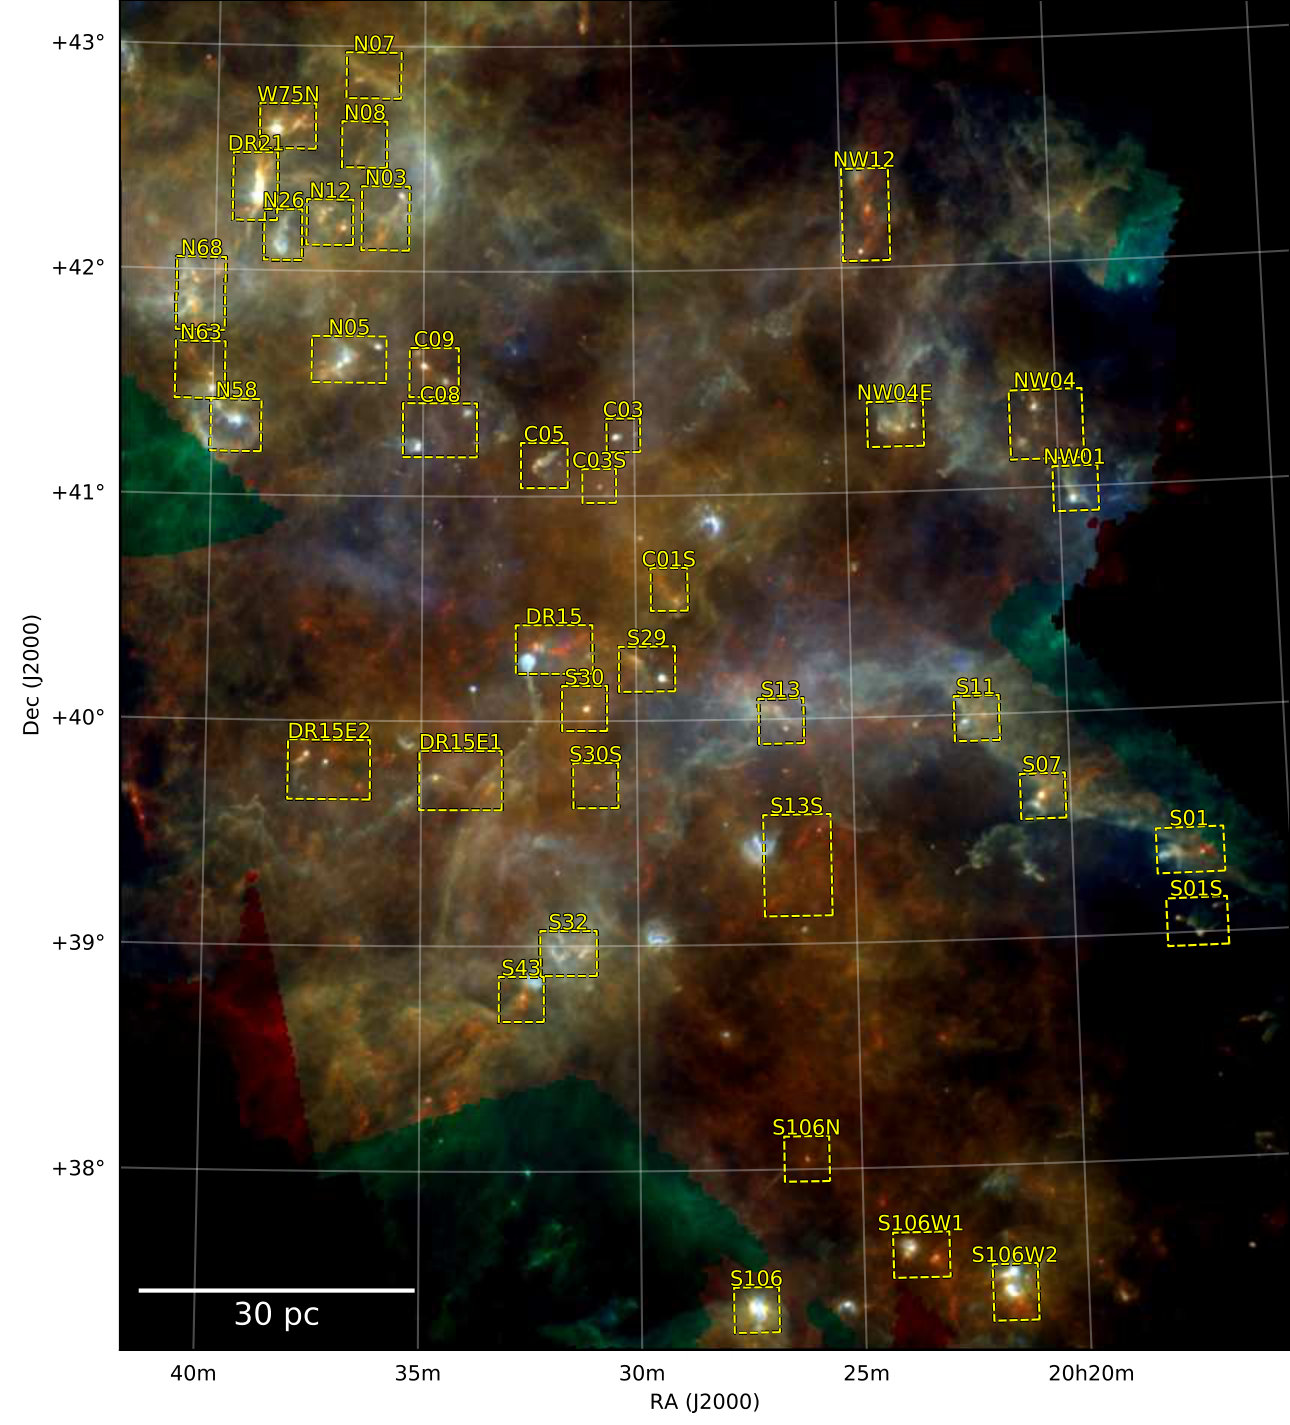 Figure 20
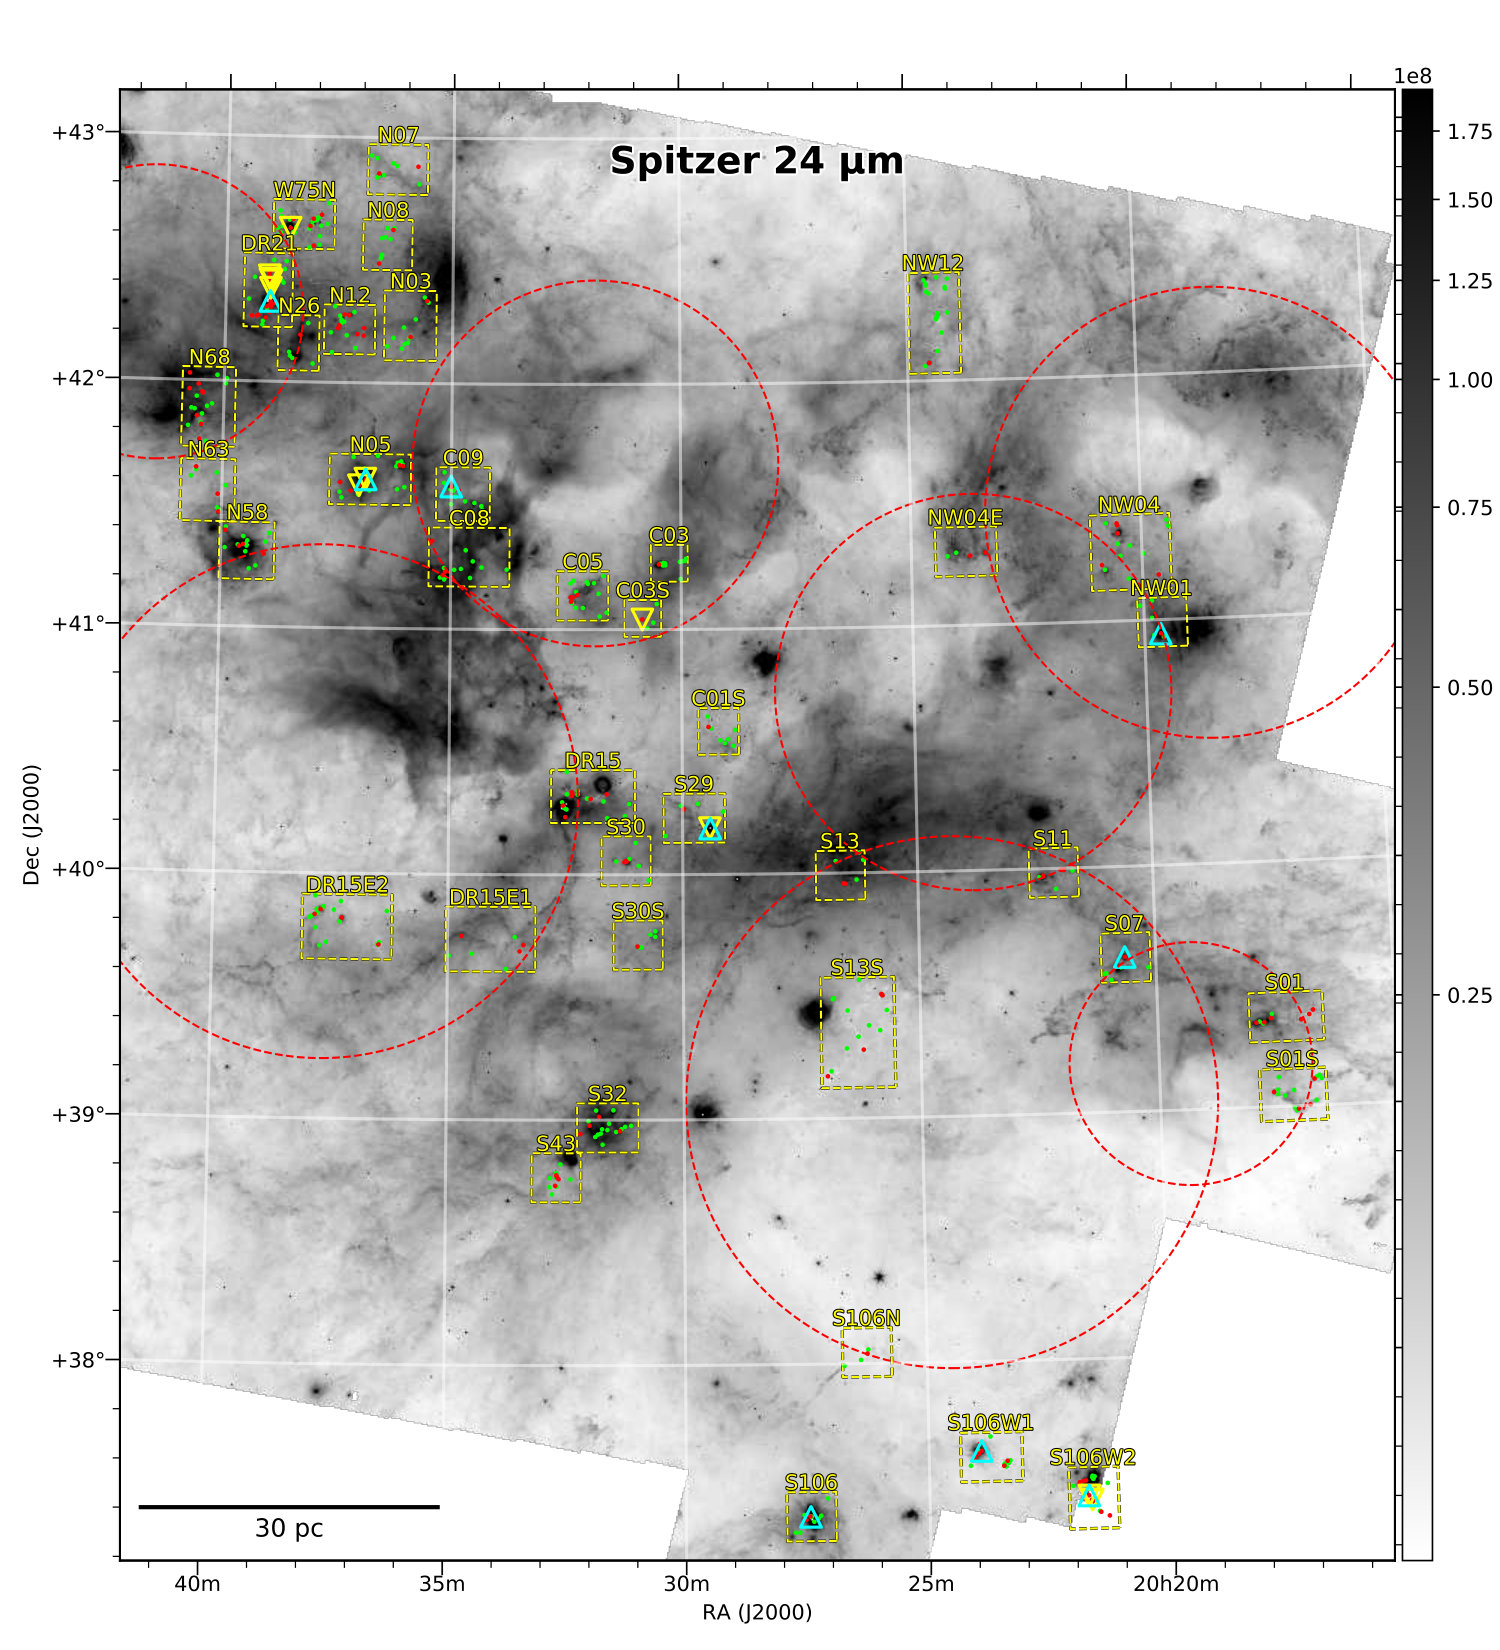 Figure 21
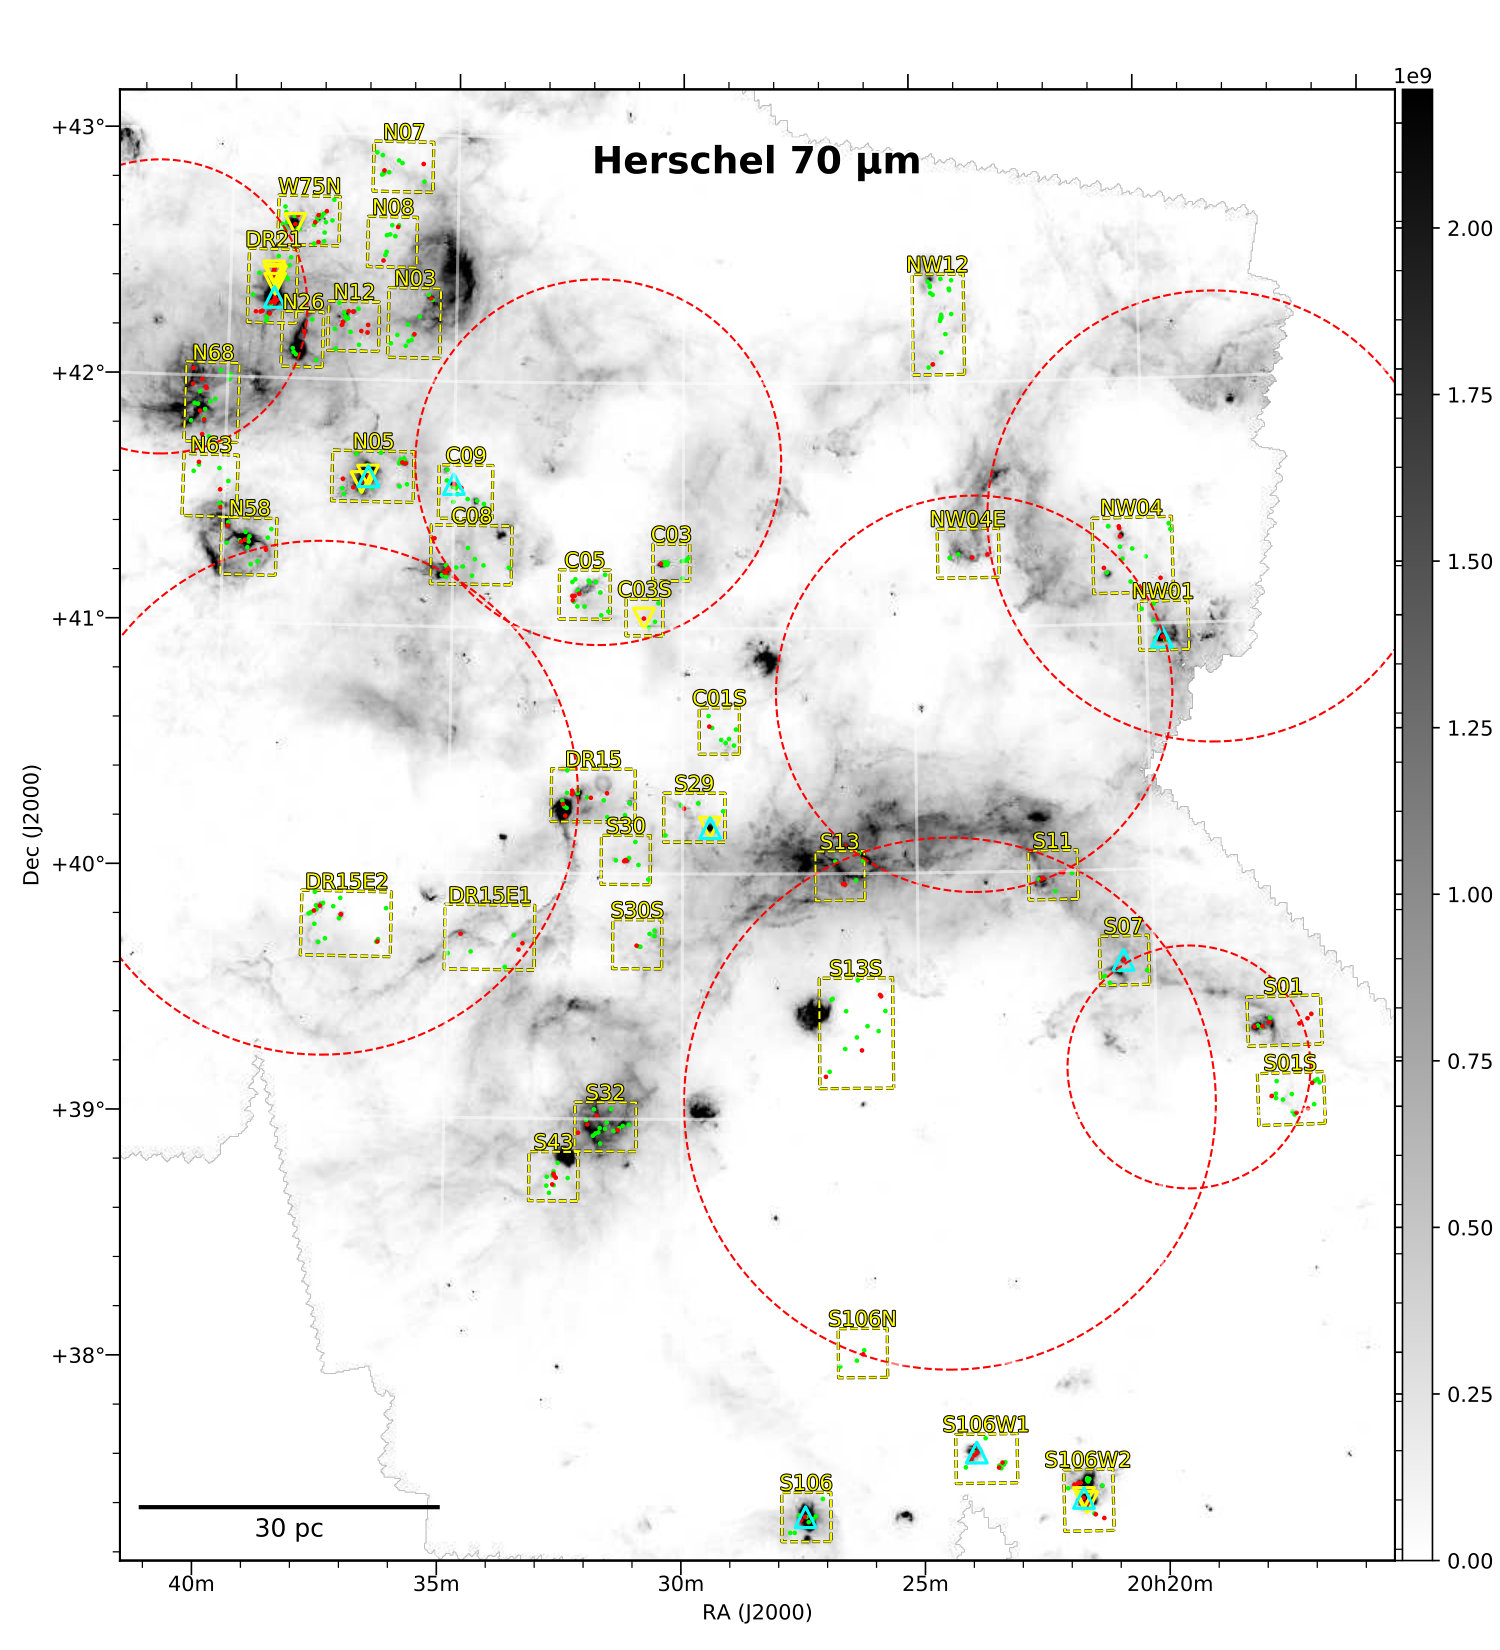 Figure 22
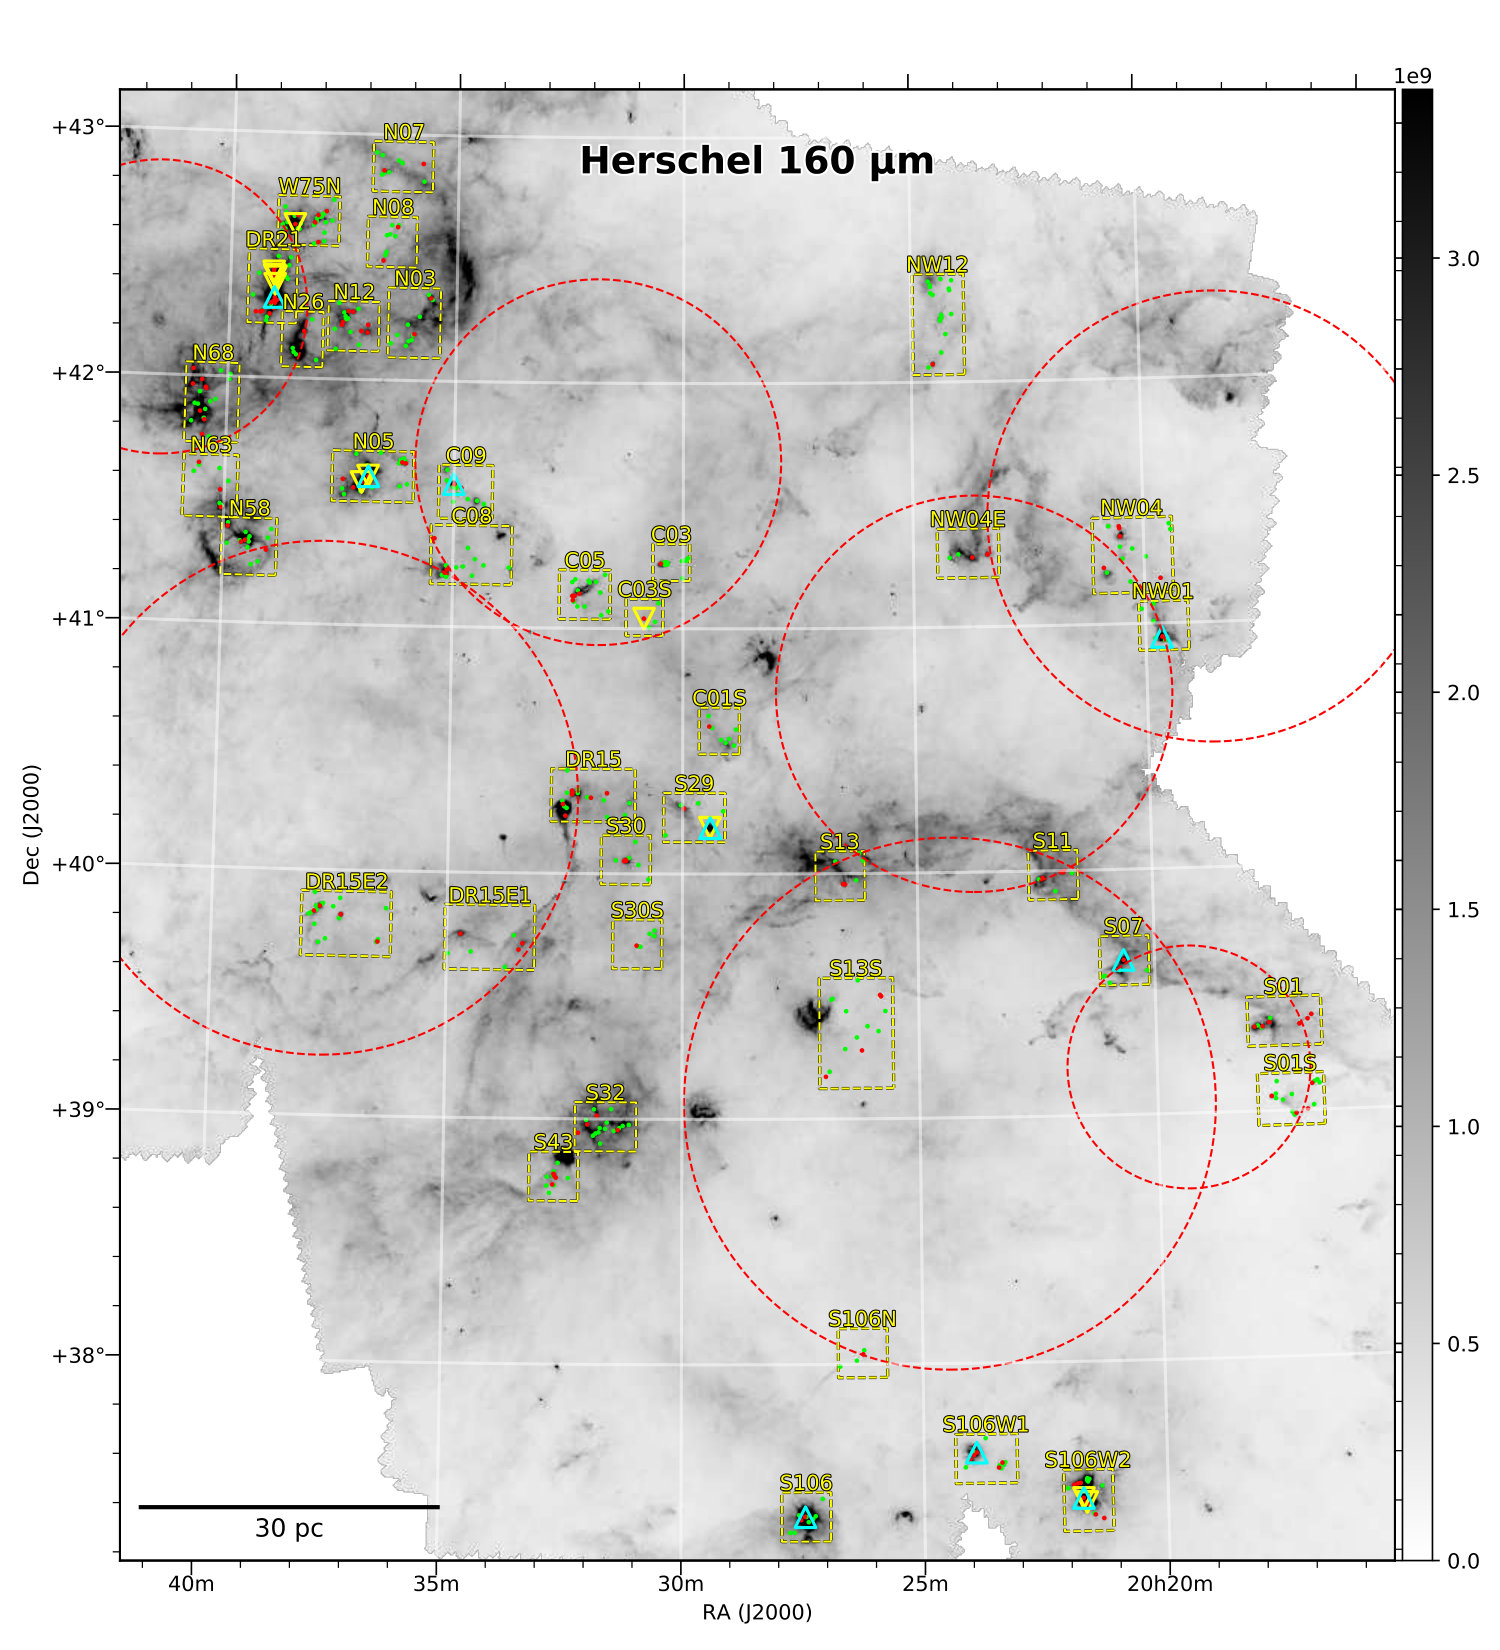 Figure 23
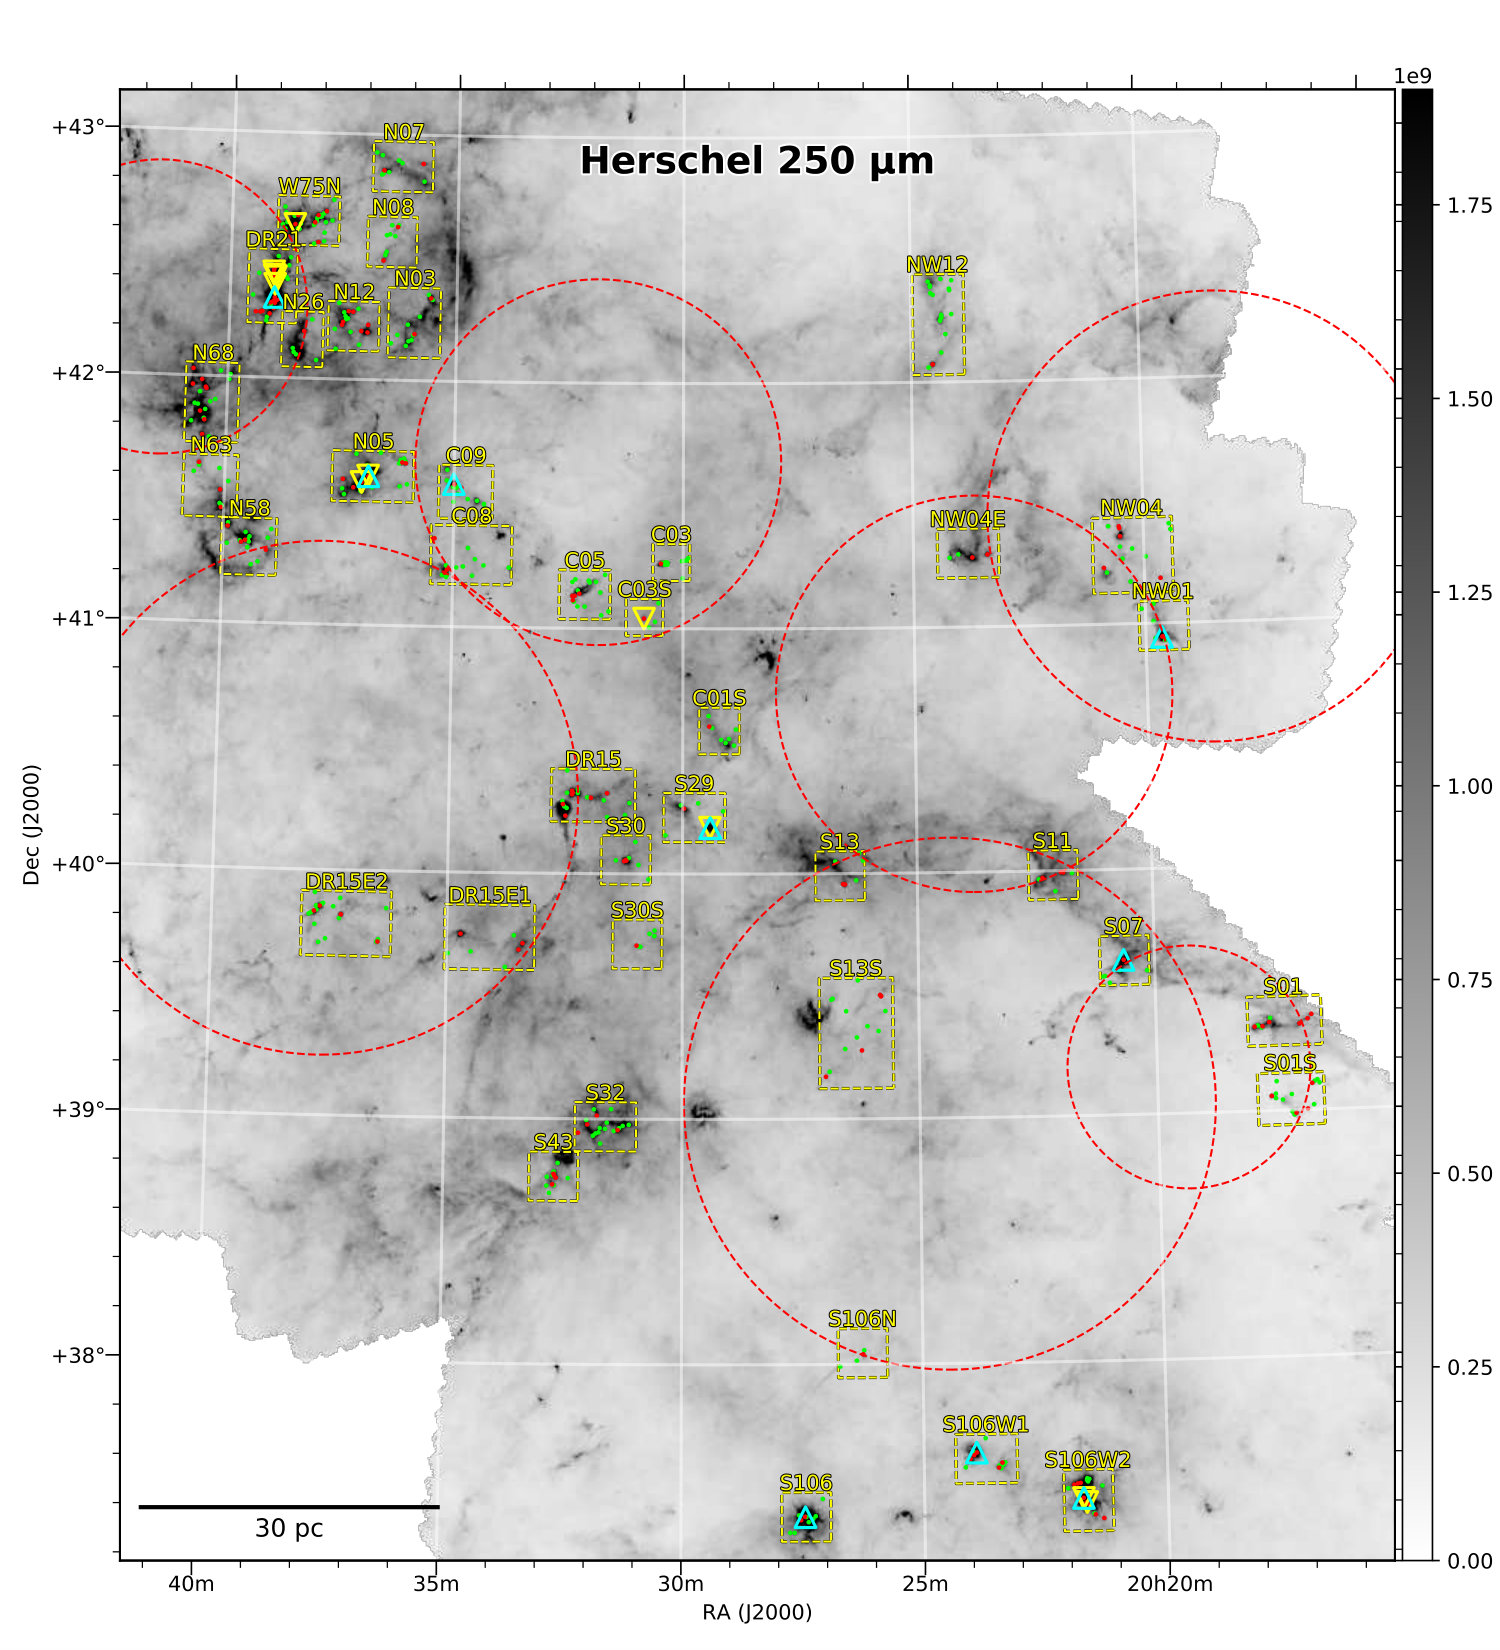 Figure 24
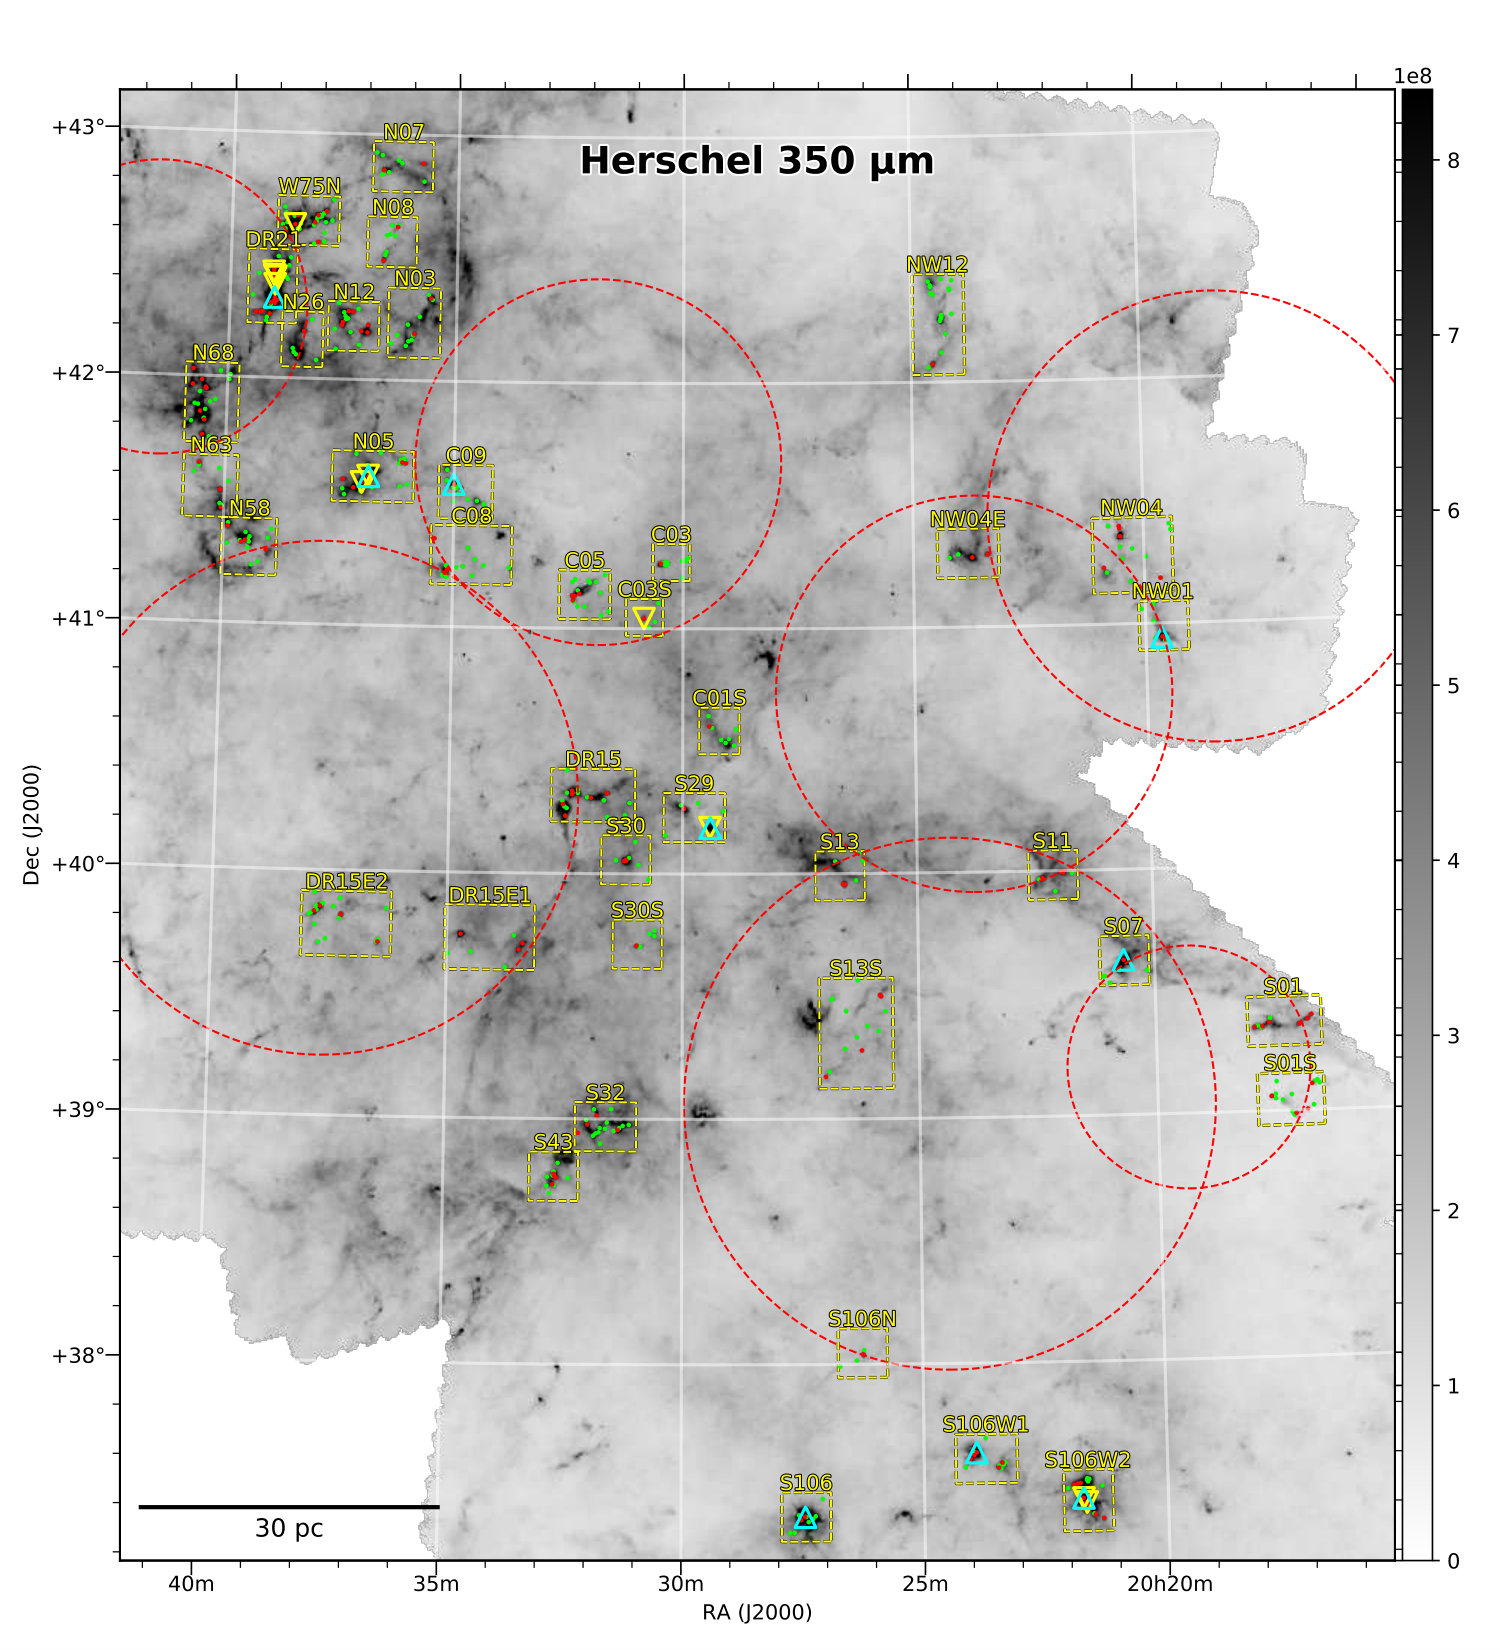 Figure 25
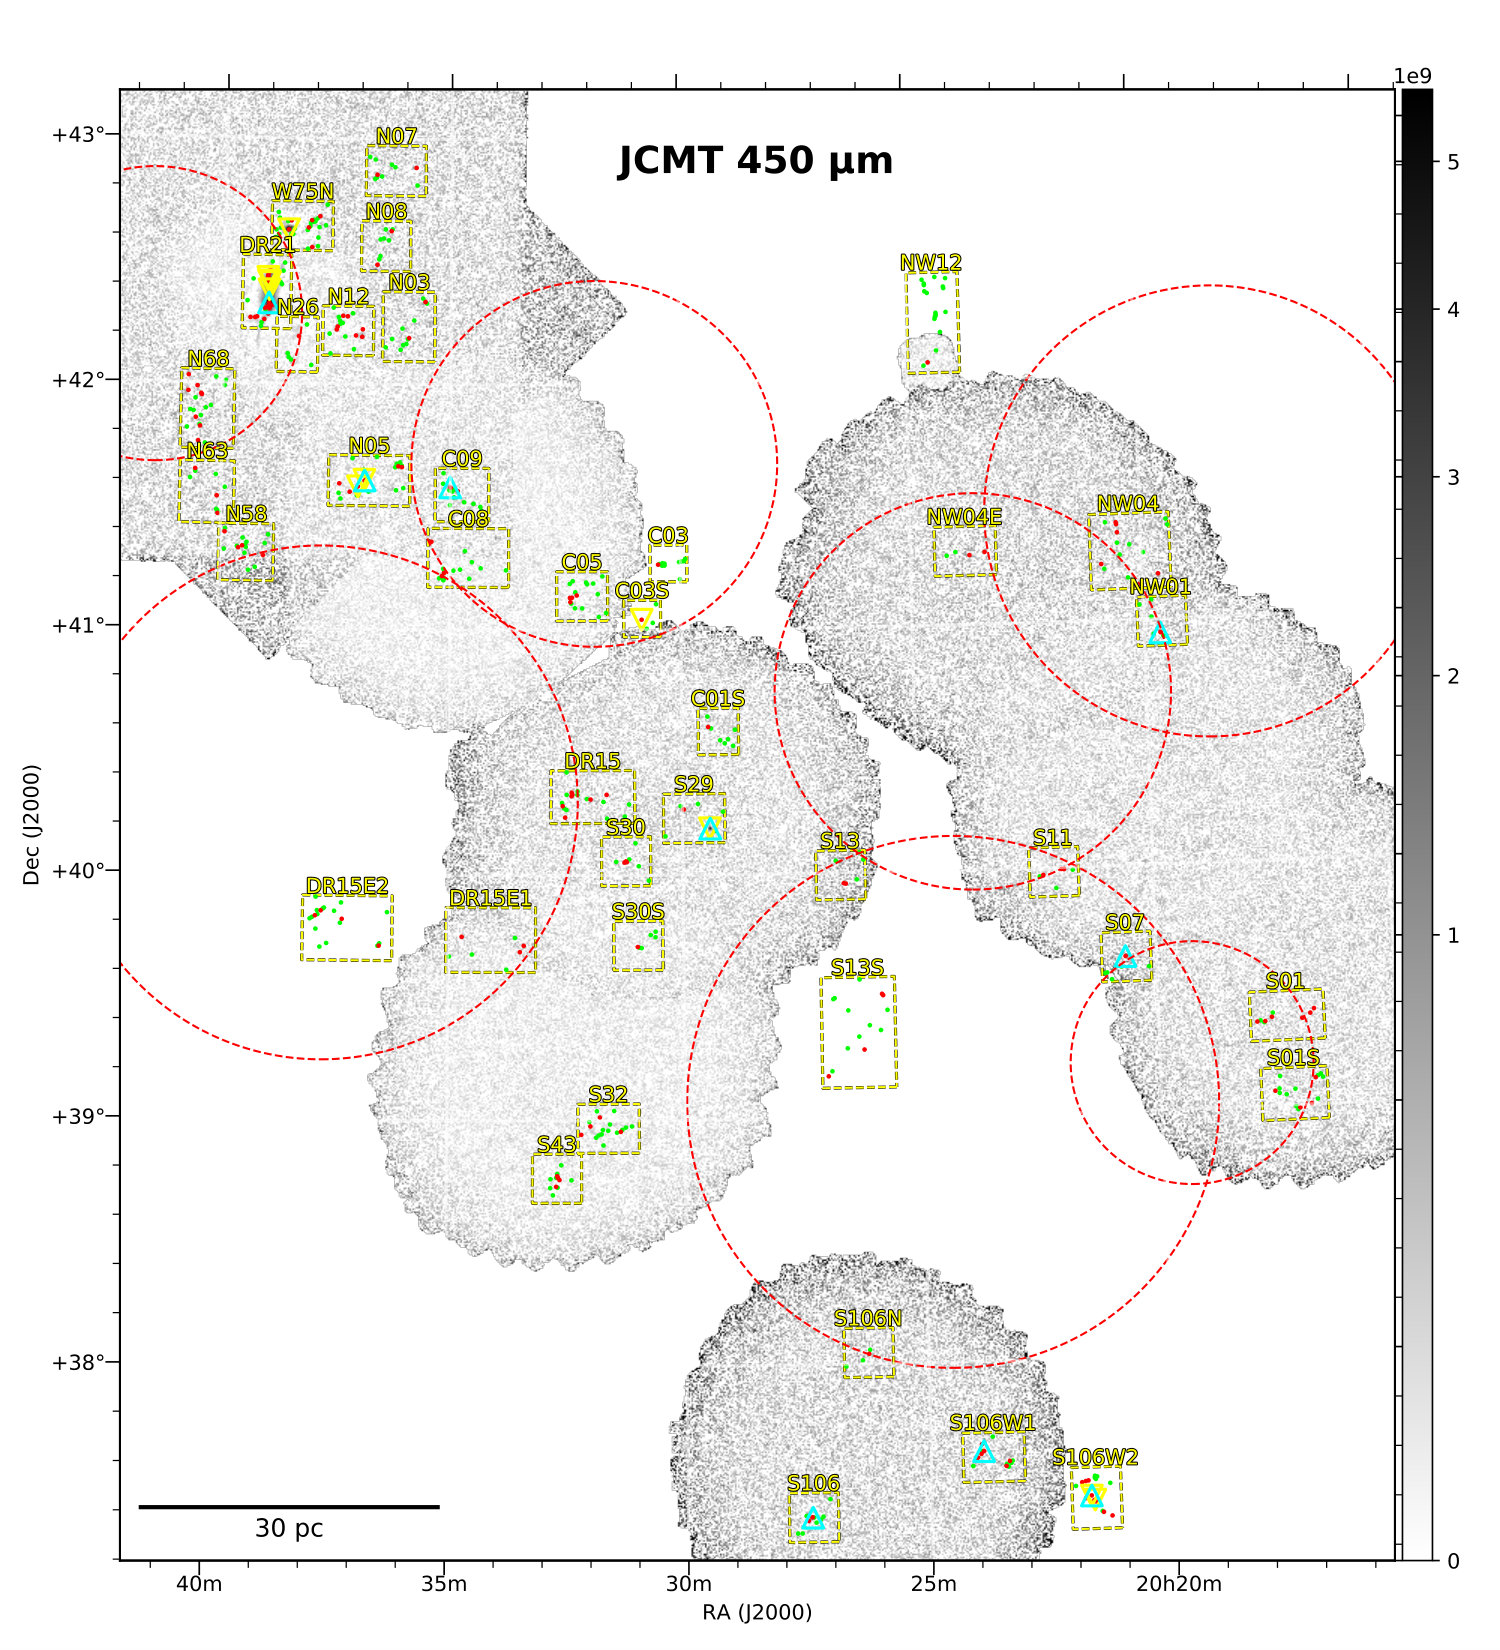 Figure 26
 Figure 27
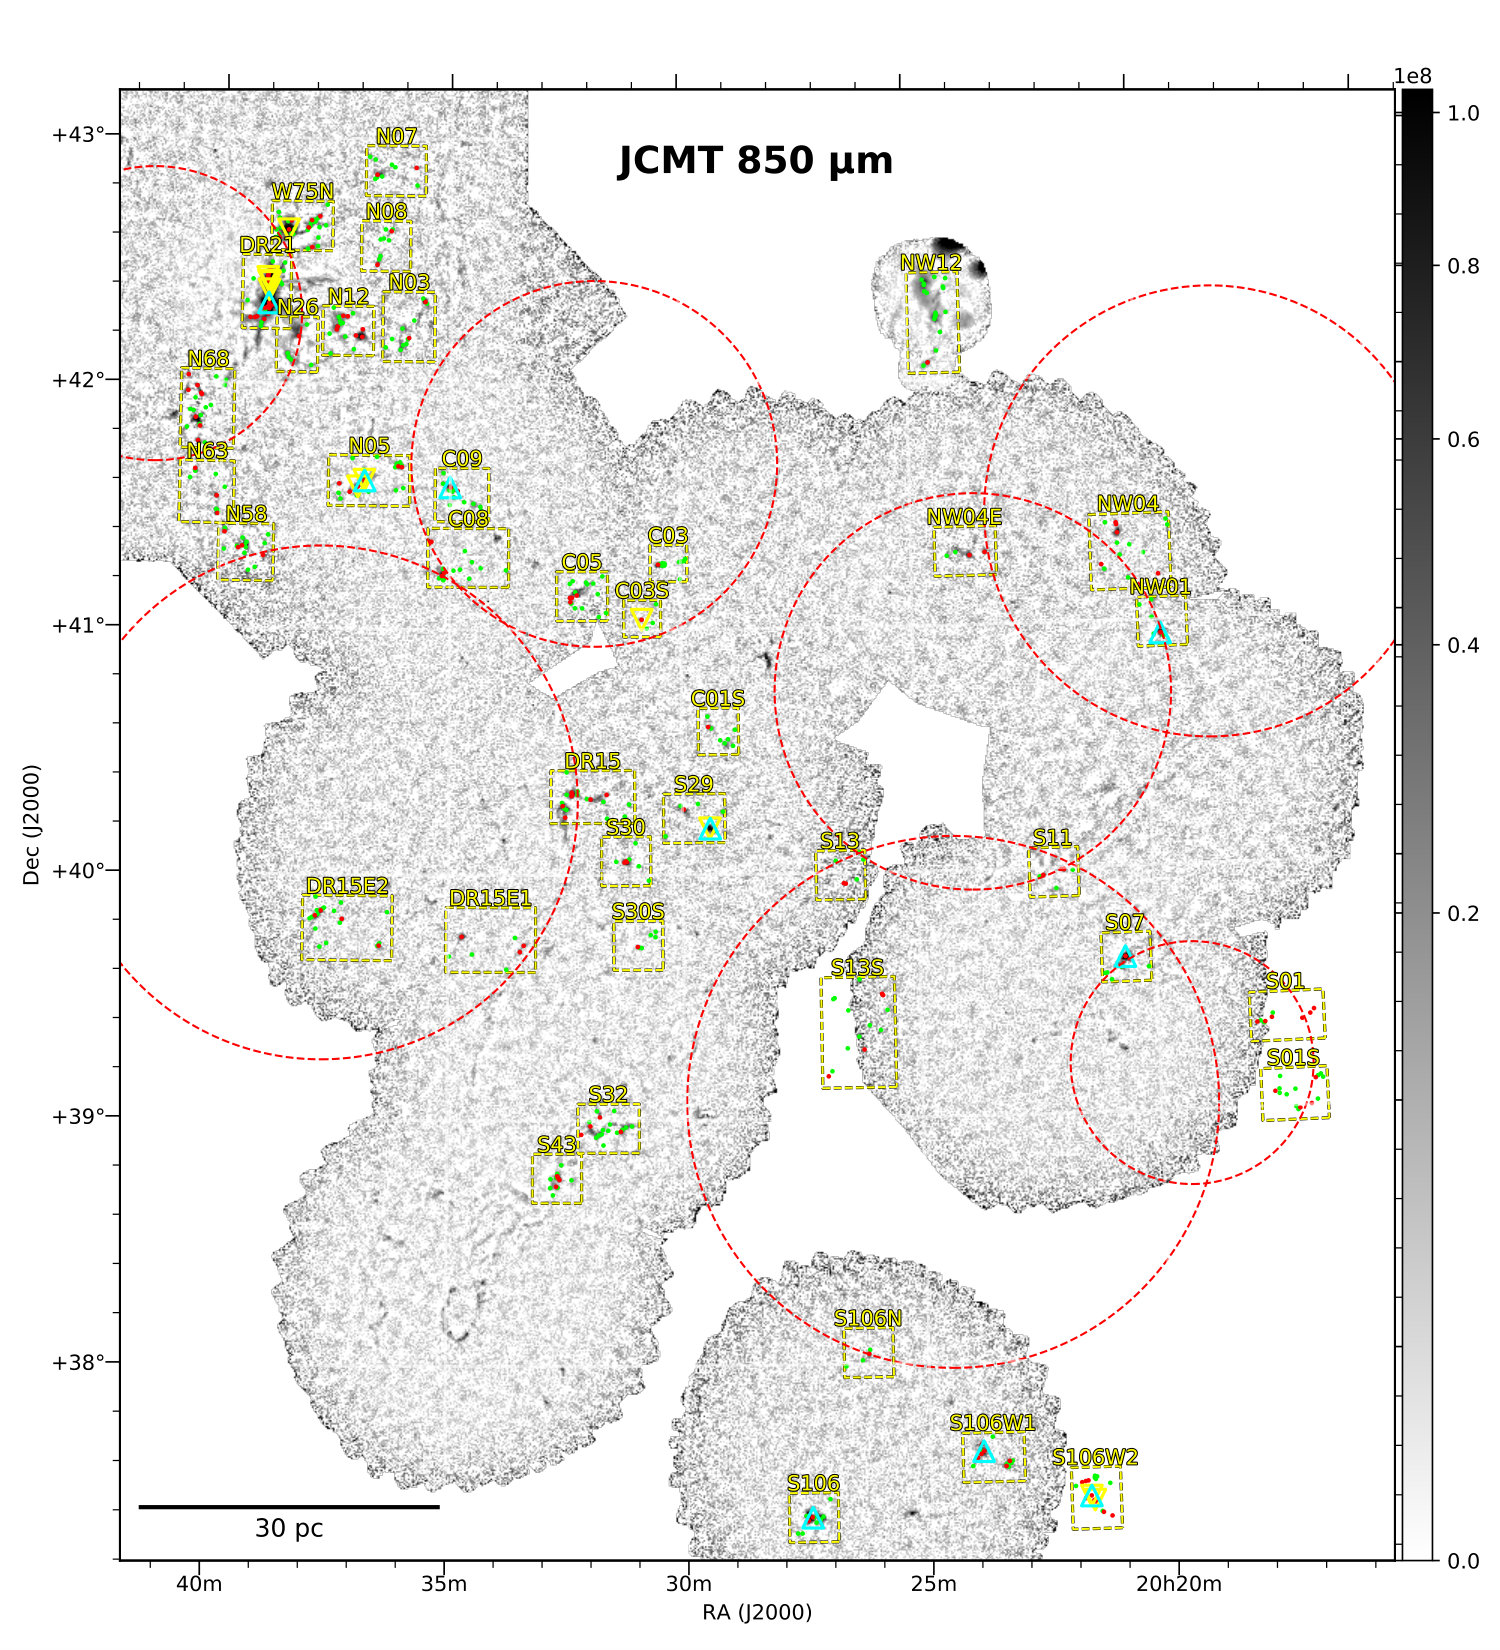 Figure 28
| Telescopes | Instruments | Bands | rms | |
|---|---|---|---|---|
| () | (″) | () | ||
| Spitzer | IRAC | 8 | 1.98 | 47.9 |
| MIPS | 24 | 6 | 5.2 | |
| Herschel | PACS | 70 | 9.2 | 16.5 |
| 160 | 12.6 | 12.0 | ||
| SPIRE | 250 | 18.4 | 4.97 | |
| 350 | 25.2 | 3.29 | ||
| 500 | 36.7 | 0.91 | ||
| JCMT | SCUBA-2 | 450 | 7.9 | 204 |
| 850 | 13 | 7.6 | ||
| IRAM | MAMBO/MAMBO-2 | 1200 | 11 | 4.0 |
| Band | FluxaaPercentages of cores that getsources successfully extracted their fluxes in this band. | SED fittingbbPercentages of cores of which the fluxes in this band were used for SED fitting. The Herschel 70 fluxes were not used intentionally (see Sect. 3.2.2). |
|---|---|---|
| 54.1% | 0.0% | |
| 68.3% | 66.7% | |
| 64.3% | 61.6% | |
| 62.2% | 57.1% | |
| 22.8% | 12.2% | |
| 56.0% | 49.4% | |
| 47.9% | 46.7% | |
| 21.8% | 21.5% |
Peer Reviews
No public reviews on file for this paper yet. If you reviewed it on a platform where reviews are public (OpenReview, ICLR, NeurIPS, ICML), you can paste yours below so the community can read it here.
Videos
No videos yet. Explain this paper in a talk, walkthrough, or lecture? Add one.
Surveys of Clumps, Cores, and Condensations in Cygnus X:
I. a New Catalog of 0.1 pc Massive Dense Cores
School of Astronomy and Space Science, Nanjing University, 163 Xianlin Avenue, Nanjing 210023, P.R.China
Key Laboratory of Modern Astronomy and Astrophysics (Nanjing University), Ministry of Education, Nanjing 210023, P.R.China
School of Astronomy and Space Science, Nanjing University, 163 Xianlin Avenue, Nanjing 210023, P.R.China
Key Laboratory of Modern Astronomy and Astrophysics (Nanjing University), Ministry of Education, Nanjing 210023, P.R.China
Harvard-Smithsonian Center for Astrophysics, 60 Garden St., MS 42, Cambridge, MA 02138 USA
School of Astronomy and Space Science, Nanjing University, 163 Xianlin Avenue, Nanjing 210023, P.R.China
Key Laboratory of Modern Astronomy and Astrophysics (Nanjing University), Ministry of Education, Nanjing 210023, P.R.China
School of Astronomy and Space Science, Nanjing University, 163 Xianlin Avenue, Nanjing 210023, P.R.China
Key Laboratory of Modern Astronomy and Astrophysics (Nanjing University), Ministry of Education, Nanjing 210023, P.R.China
School of Astronomy and Space Science, Nanjing University, 163 Xianlin Avenue, Nanjing 210023, P.R.China
Key Laboratory of Modern Astronomy and Astrophysics (Nanjing University), Ministry of Education, Nanjing 210023, P.R.China Keping Qiu [email protected]
(Received - -, –; Revised - -, –; Accepted - -, –)
Abstract
Using infrared to (sub)millimeter data from Spitzer, Herschel, the James Clerk Maxwell Telescope, and the IRAM 30-m telescope, we conducted an unbiased survey of the massive dense cores (MDCs) in the Cygnus X molecular cloud complex, aimed at characterizing the physical conditions of high-mass star formation (HMSF) at 0.1 pc scales. We created 5∘6∘ images of the 70–1200 dust continuum, gas column density, and dust temperature of Cygnus X. A spatial relation between the dense regions () and the developed H II regions was found, indicating the impact of the latter on the global structures of Cygnus X. With a 35- mass threshold implied by HMSF signposts, we identified 151 MDCs with sizes of 0.1 pc, masses of 35–1762 , and temperatures of 8–35 K. Our MDC sample is statistically complete in Cygnus X and is three times larger than that in Motte et al. (2007). The MDCs were classified into IR-bright/IR-quiet ones based on their mid-infrared fluxes and a large “IR-quiet” proportion (90%) was found in our sample. Two possible scenarios were proposed to interpret this: accelerated HMSF and the incapability of HMSF of the IR-quiet MDCs. We also found 26 starless MDCs by their lack of compact emissions at 21–70 wavelengths, of which the most massive ones are probably the best candidates of initial HMSF sites in Cygnus X.
ISM: clouds — ISM: individual objects (Cygnus X) — ISM: structure — stars: formation — stars: massive
††journal: ApJS††facilities: IRAM: 30m, JCMT (SCUBA2), Herschel (PACS,SPIRE), Spitzer (IRAC,MIPS), MSX, WISE††software: getsources, Astropy
1 Introduction
High-mass stars ( ) play an important role in physical and chemical evolution of interstellar medium and energy budget of galaxies. Studies on their formation have made significant progress over the past decades (see Tan, & McKee, 2002; Hoare et al., 2007; Zinnecker, & Yorke, 2007; Tan et al., 2014; Motte et al., 2017; Schilke, 2017; Tan, 2018). Observational studies have confirmed that high-mass stars form in massive dense cores (MDCs), which are 0.1 pc dense entities in molecular clouds with masses of tens to hundreds of solar masses (e.g., Motte et al., 2007; Beuther et al., 2010; Csengeri et al., 2011; Hennemann et al., 2014; Tigé et al., 2017; Ching et al., 2018). The physical conditions of high-mass star formation (HMSF) are closely related to the formation and dynamical evolution of MDCs.
One of the key arguments in HMSF is whether high-mass stars form as a scaled-up version of the classic low-mass star formation paradigm (Shu et al., 1987). Two theoretical models have been developed in this context: the core accretion model (McKee & Tan, 2002; Krumholz et al., 2007) and the competitive accretion model (Bonnell et al., 2001; Bonnell & Bate, 2006). In the core accretion scenario, high-mass stars form through the monolithic collapse of high-mass analogs of low-mass prestellar cores (McKee & Tan, 2002; Krumholz et al., 2007). While in the competitive accretion scenario, “seeds” of high-mass stars accrete and grow competitively in massive cores or clumps (Bonnell et al., 2001; Bonnell & Bate, 2006; Zhang et al., 2009; Hartmann et al., 2012). Whether high-mass prestellar cores exist, is then an essential observable distinction of the two models. So far there have been quite a number of millimeter/submillimeter surveys and case studies targeting massive clumps and cores (Motte et al., 2007; Bontemps et al., 2010; Wang et al., 2012; Duarte-Cabral et al., 2013; Cyganowski et al., 2014; Zhang et al., 2015; Tigé et al., 2017; Cheng et al., 2018), and infrared-dark clouds (IRDCs) (Rathborne et al., 2006; Butler & Tan, 2012; Tan et al., 2013; Peretto et al., 2014; Wang et al., 2014; Lu et al., 2015; Ohashi et al., 2016; Kong et al., 2017), yet no bona fide high-mass prestellar cores have been identified.
In this paper we focus on Cygnus X, one of the most massive and active high-mass star-forming regions in our Galaxy. Lying at a distance of 1.4 kpc (Rygl et al., 2012), it harbors numerous H II regions (Wendker et al., 1991), OB associations (Uyanıker et al., 2001), and high-mass star-forming sites, including W75N, DR21, DR21(OH), and S106 (Schneider et al., 2002; Shepherd et al., 2004). Motte et al. (2007) (hereafter M07) carried out a dust continuum survey covering a 3-square-degree area in Cygnus X, and detected a total of 129 dense cores, of which 42 cores are considered as probable precursors of high-mass stars (i.e., MDCs). Here we take the advantage of a newly available large data set from Spitzer, Herschel, and the James Clerk Maxwell Telescope (JCMT), and perform a detailed multi-wavelength survey of the MDCs in Cygnus X with a spatial coverage one order of magnitude larger than that of M07.
The distance of Cygnus X has been debated over decades. Due to its location on the tangent point of the Galaxy rotation, Cygnus X has been once considered as a superposition of various objects (e.g., Dickel et al., 1969; Pipenbrink & Wendker, 1988; Uyanıker et al., 2001). However, recent CO surveys toward Cygnus X suggested that it is more likely to be located at a coherent distance (e.g., Schneider et al., 2006; Gottschalk et al., 2012); Rygl et al. (2012) measured the parallaxes of five maser sites in Cygnus X and concluded that Cygnus X North is a physically connected region at kpc; Xu et al. (2013) provided a comprehensive result of parallax measurement of the Local Arm, of which eight out of nine maser sites in Cygnus X have distances within 1.3–1.6 kpc, except AFGL 2591 (3.3 kpc). We therefore will assume that most of the objects in Cygnus X share a coherent distance of 1.4 kpc, except a few regions, e.g., AFGL 2591 (see Sect. 3.2.1). It should be noticed that M07 adopted a distance value of 1.7 kpc in their analysis, which was derived by the study of Schneider et al. (2006). Since this value has been updated to 1.4 kpc, we will modify their results to match the new distance before any comparisons are made, and the corrected results will hereafter be referred to as “M07” unless otherwise specified.
As the first paper of our project, Surveys of Clumps, CorEs, and CoNdenSations in CygnUS-X (CENSUS111CENSUS project (PI: Keping Qiu) is dedicated to a systematic study of the 0.01–10 pc hierarchical cloud structures and high-mass star formation in the Cygnus X complex. The project consists of several parallel surveys involving the SMA, JVLA, JCMT, Tianma 65m radio telescope (Shanghai 65 m Radio Telescope), as well as case studies with ALMA, NOEMA, and CARMA.), we describe our data used in Sect. 2. In Sect. 3 we discuss our data processing, including generating large maps of Cygnus X, MDC sample selection, SED fitting, classification of MDCs, and analysis on HMSF signposts. We discuss these main results in Sect. 4, including the formation and HMSF potential of large-scale cloud structures, review of the MDC sample and comparison with M07, infrared properties of the MDCs and the interpretations of HMSF, and the starless MDCs in Cygnus X. Our conclusions are summarized in Sect. 5.
2 Data
2.1 Ground-based Observations
The published 1.2 mm continuum images from the MAMBO and MAMBO-2 cameras of the 30-m telescope of Institut de Radioastronomie Millimétrique (IRAM) in M07 were used for our analysis. The 3 spatial coverage of these images are shown in Figure 1. The beam size is 11″ and the mean rms level is 12.9 (see Table 1). Detailed observational parameters and data processing can be found in M07.
The JCMT SCUBA-2 continuum data at 450 and 850 toward Cygnus X were obtained from the Canadian Astronomy Data Centre222http://www.cadc-ccda.hia-iha.nrc-cnrc.gc.ca/en/, which have not been published before. The observations were made in scan mode during 2011–2015 and the average integration time of each map is 0.5 h. The FWHM beam sizes are 7.9″ and 13″ and the rms levels are 340 and 34 for 450 and 850 , respectively. See Figure 1 for the coverage of the images. The related program IDs are M11BEC30, M12BU30, M13AD03, M13AU03, M13BU29, M15AI133, and M15AI144.
2.2 Space Telescope Observations
Continuum images in the wavelengths of Herschel PACS (70 and 160 ) and SPIRE (250, 350, and 500 ) were obtained from the Herschel Science Archive333http://archives.esac.esa.int/hsa/whsa/. These data are from the HOBYS444Herschel imaging survey of OB Young Stellar objects, http://www.herschel.fr/cea/hobys/en/index.php project (Motte et al., 2010), the Hi-GAL555The Herschel Infrared Galactic Plane Survey, https://hi-gal.ifsi-roma.inaf.it/higal/ project (Molinari et al., 2010), and open-time observations toward Cygnus X by Hora (2011). See the corresponding references for their observational configurations and data processing. The beam sizes are 5.2″, 12″, 17.6″, 23.9″, and 35.2″, and the rms levels are , , , , and , respectively in the order of increasing wavelengths (Table 1).
The Spitzer IRAC 8- and MIPS 24- maps from the Spitzer Legacy Survey of the Cygnus X Complex666https://www.cfa.harvard.edu/cygnusX/ (Kraemer et al., 2010) were obtained from the NASA/IPAC Infrared Science Archive777IRSA is chartered to curate the science products of NASA’s infrared and submillimeter missions, providing access to more than 20 billion astronomical measurements, including all-sky coverage in 24 bands. http://irsa.ipac.caltech.edu/frontpage/. Both maps cover the entire Cygnus X region (see Figure F and F). The resolutions are 2″ and 6″, and the 1 rms noise levels are 47.9 and 5.2 respectively for 8 and 24 .
\startlongtable
3 Analysis
3.1 Mosaic Maps of Cygnus X
We generated mosaic images of the whole Cygnus X region in the bands of Herschel (70, 160, 250, 350, and 500 ), JCMT (450 and 850 ), and the IRAM 30 m telescope (1.2 mm) using the Montage package888http://montage.ipac.caltech.edu/ (Jacob et al., 2010) (see Figures F to F). The procedures include re-projection, re-gridding, and merging of the original data in each band. For the Herschel data, the zero-level offset correction was conducted with the Planck (217, 353, 545, and 857 GHz) and IRAS (100 ) data following the procedure of Bernard et al. (2010). All the mosaic maps are 5∘6∘ in size with resolutions presented in Table 1. An RGB color image made out of three Herschel mosaics was also created (see Figure F).
High-resolution column density map (Figure 1) and temperature map (Figure F) of Cygnus X were generated from the 160, 250, 350, and 500 mosaic images using the hirescoldens command in the getsources999http://www.herschel.fr/cea/gouldbelt/en/getsources/ (v2.180813) procedure (Men’shchikov et al., 2012). This command decomposed the continuum images into single-spatial-scale components and pixel-by-pixel fitted the SEDs at each scale using a modified blackbody model fully described in Sect. 3.2.2. The column density map was then constructed by combining the column density “components” at each scale, and its final resolution was set by that of the second shorted wavelength (18.4″@250 ). The temperature map is nevertheless not addable and was generated using the same SED fitting routine with the images convolved to the lowest resolution (36.7″@500 ). The 70 data were not used since the emission traces warm dust and a single-temperature model is no longer applicable (see Motte et al., 2010). For parameter settings, we used a dust-opacity spectral index and a gas-to-dust ratio of 100. We conservatively estimated the relative flux uncertainties in each band as 0.2. The uncertainty maps of column density and temperature (Figure F and F) were generated by hirescoldens, which considered both the flux uncertainties and the fitting errors.
3.2 Complete Sample of Massive Dense Cores
In principle, our target sample should contain all the MDCs in Cygnus X which are massive enough to be able to form high-mass stars. We will describe the procedure for generating our MDC sample in this subsection.
3.2.1 Selection of High-column-density Fields
High-mass stars form preferentially in high-column-density regions, both proposed by theoretical works (Krumholz & McKee, 2008) and verified by observations (e.g., Motte et al., 2007; Kauffmann & Pillai, 2010). To find regions in Cygnus X with potential of HMSF, i.e., regions where MDCs reside, we selected 40 rectangular fields on the column density map that cover regions where N_{\rm H_{2}}\geq$$3.5\times 10^{22}\rm cm^{-2} (see Figure 1 and E). Informations of the fields are listed in Table A. The column density threshold (, corresponding to , Güver & Özel, 2009) guarantees that all the cores with masses above certain value can be selected in our sample. Specifically, assuming that cores have 2D Gaussian profiles in the column density map with FWHM sizes and peak column densities , their masses can be estimated as:
[TABLE]
where is the mean molecular weight per hydrogen molecule, is the mass of hydrogen atom, and is the source distance. Cores with N_{\rm H_{2},p}\geq$$3.5\times 10^{22}\rm cm^{-2} and typical sizes of 0.1 pc, or 0.15 pc convolved with the 18″ beam, will have masses above 23.3 . In other words, our core sample to be extracted in the selected fields will be statistically complete for the cores with 23.3 .
To rule out the regions of which the distances are not coherent with 1.4 kpc, we used the JVLA K-band observation of ammonia inversion lines toward the fields in Cygnus X (proposal ID: VLA/17A-107, PI: Keping Qiu, Zhang et al. in prep.) and found that the systematic velocities of the field C01 and part of the field C08 are -41 and -65 , respectively, which correspond to BeSSeL101010Bar and Spiral Structure Legacy survey, https://www3.mpifr-bonn.mpg.de/staff/abrunthaler/BeSSeL/index.shtml kinematic distances of 6.1 and 9.1 kpc, respectively. We excluded the whole C01 field and part of the C08 field, as well as AFGL 2591 in field S29 from the regions for core extraction. See Figure 1 and the corresponding sub-figures in Figure E for the excluded regions.
To select MDCs in Cygnus X, Motte et al. (2007) used a criterion of mag and selected deg2 high-extinction regions (see the white dashed polygons in Figure 1). Compared with their coverage, our new fields have a total area of 2.2 deg2 but are focused on denser regions. In addition, 14 out of 39 fields are newly added compared with M07. These fields have peak column densities comparable to those of the regions in M07 but were not covered in their IRAM observations. This indicates that our sample of MDCs represents great improvements on statistical completeness.
3.2.2 Core Extraction and SED Fitting
\startlongtable
The reference list from the paper itself. Each links out to its DOI / PubMed record.
- 1Alves et al. (2007) Alves, J., Lombardi, M., & Lada, C. J. 2007, A&A, 462, L 17
- 2Anderson et al. (2014) Anderson, L. D., Bania, T. M., Balser, D. S., et al. 2014, Ap JS, 212, 1
- 3Anglada et al. (2018) Anglada, G., Rodríguez, L. F., & Carrasco-González, C. 2018, Astronomy and Astrophysics Review, 26, 3.
- 4Astropy Collaboration et al. (2013) Astropy Collaboration, Robitaille, T. P., Tollerud, E. J., et al. 2013, A&A, 558, A 33
- 5Baldeschi et al. (2017) Baldeschi, A., Elia, D., Molinari, S., et al. 2017, MNRAS, 466, 3682.
- 6Behrend & Maeder (2001) Behrend, R., & Maeder, A. 2001, A&A, 373, 190
- 7Bernard et al. (2010) Bernard, J.-P., Paradis, D., Marshall, D. J., et al. 2010, A&A, 518, L 88
- 8Bernasconi & Maeder (1996) Bernasconi, P. A., & Maeder, A. 1996, A&A, 307, 829