The Milky Way like galaxy NGC 6384 and its nuclear star cluster at high NIR spatial resolution using LBT/ARGOS commissioning data
Iskren Y. Georgiev, Nadine Neumayer, Wolfgang Gaessler, Sebastian, Rabien, Lorenzo Busoni, Marco Bonaglia, Julian Ziegleder, Gilles Orban de, Xivry, Diethard Peter, Martin Kulas, Jose Borelli, Gustavo Rahmer, Michael, Lefebvre, Holger Baumgardt

TL;DR
This study demonstrates high-resolution near-infrared imaging of NGC 6384 using LBT/ARGOS AO, revealing detailed structures of its nuclear star cluster and central regions, and deriving their properties through combined imaging and photometry.
Contribution
It showcases the capability of ground-layer adaptive optics to analyze galaxy nuclei at distances previously only accessible from space, providing detailed structural and stellar population insights.
Findings
Nuclear star cluster has an effective radius of ~10 pc.
Identified surrounding structures with effective radii of ~100 pc and ~400 pc.
Derived stellar population properties including age, metallicity, and mass ratios.
Abstract
We analyse high spatial resolution near infra-red (NIR) imaging of NGC6384, a Milky Way like galaxy, using ARGOS commissioning data at the Large Binocular Telescope (LBT). ARGOS provides a stable PSF AO correction of the ground layer across the LUCI2 NIR camera field by using six laser guide stars (three per telescope) and a natural guide star for tip-tilt sensing and guiding. Enabled by this high spatial resolution we analyse the structure of the nuclear star cluster (NSC) and the central kiloparsec of NGC6384. We find via 2D modelling that the NSC (pc) is surrounded by a small (pc) and a larger Sersi\'c (pc), all embedded within the NGC\,6384 large-scale boxy/X-shaped bulge and disk. This proof-of-concept study shows that with the high spatial resolution achieved…
Click any figure to enlarge with its caption.
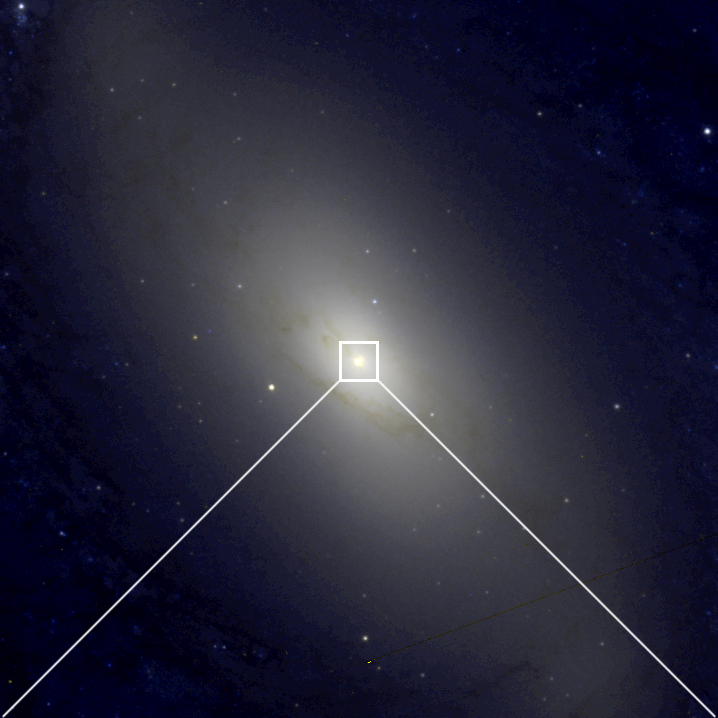 Figure 1
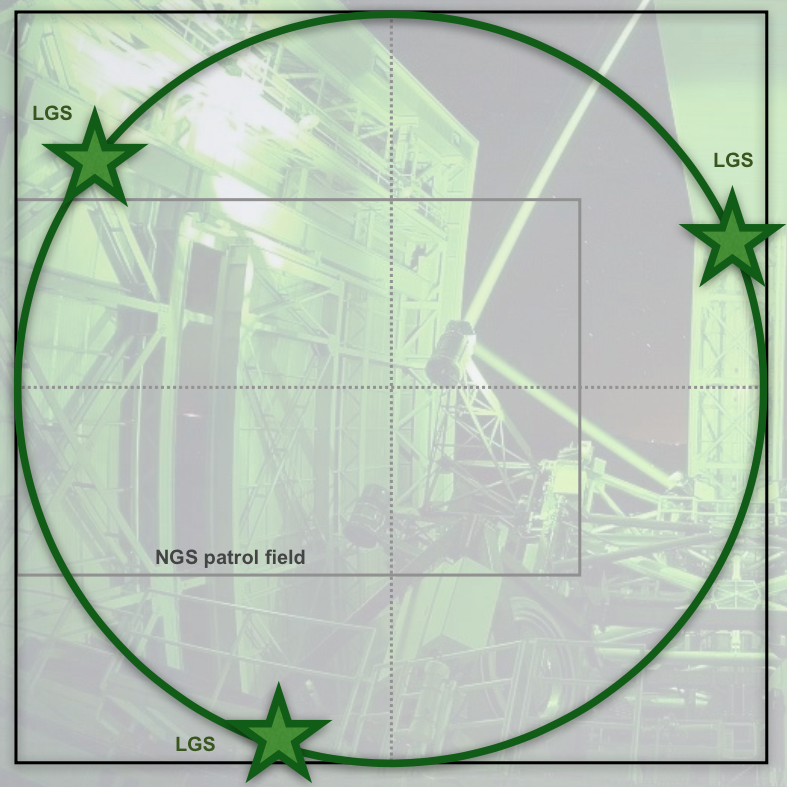 Figure 2
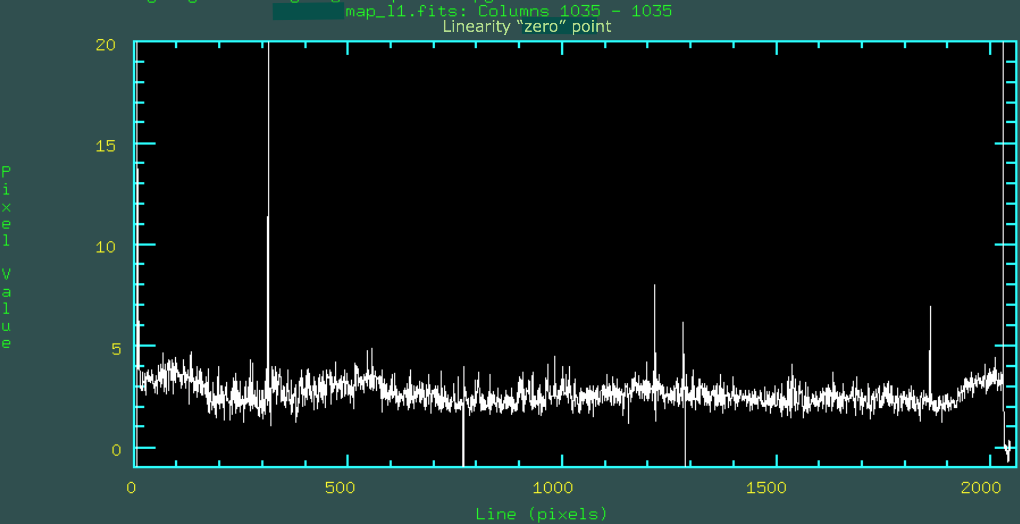 Figure 3
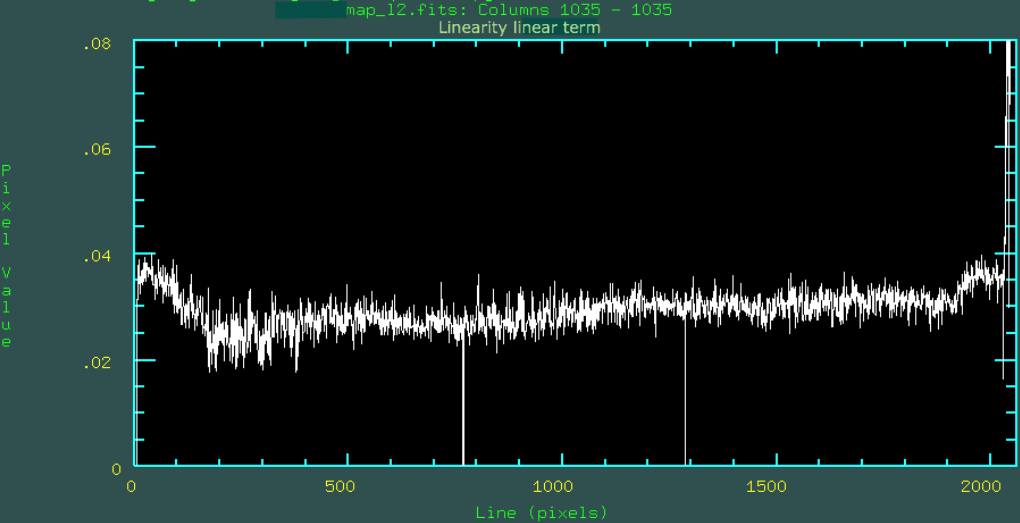 Figure 4
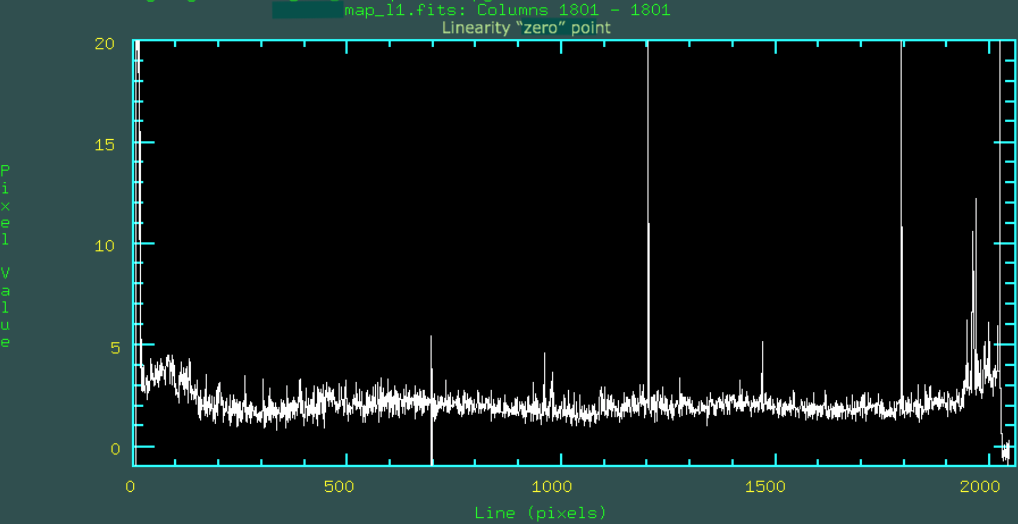 Figure 5
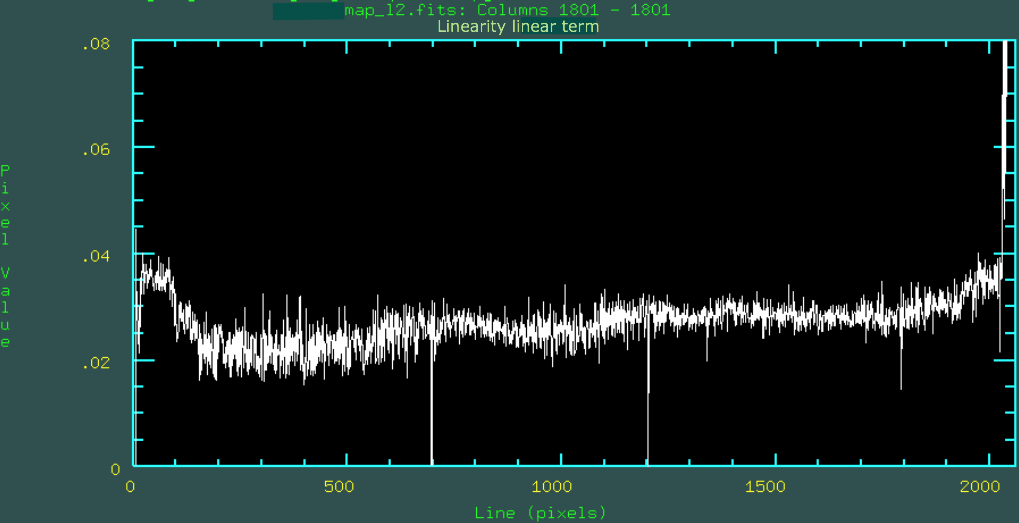 Figure 6
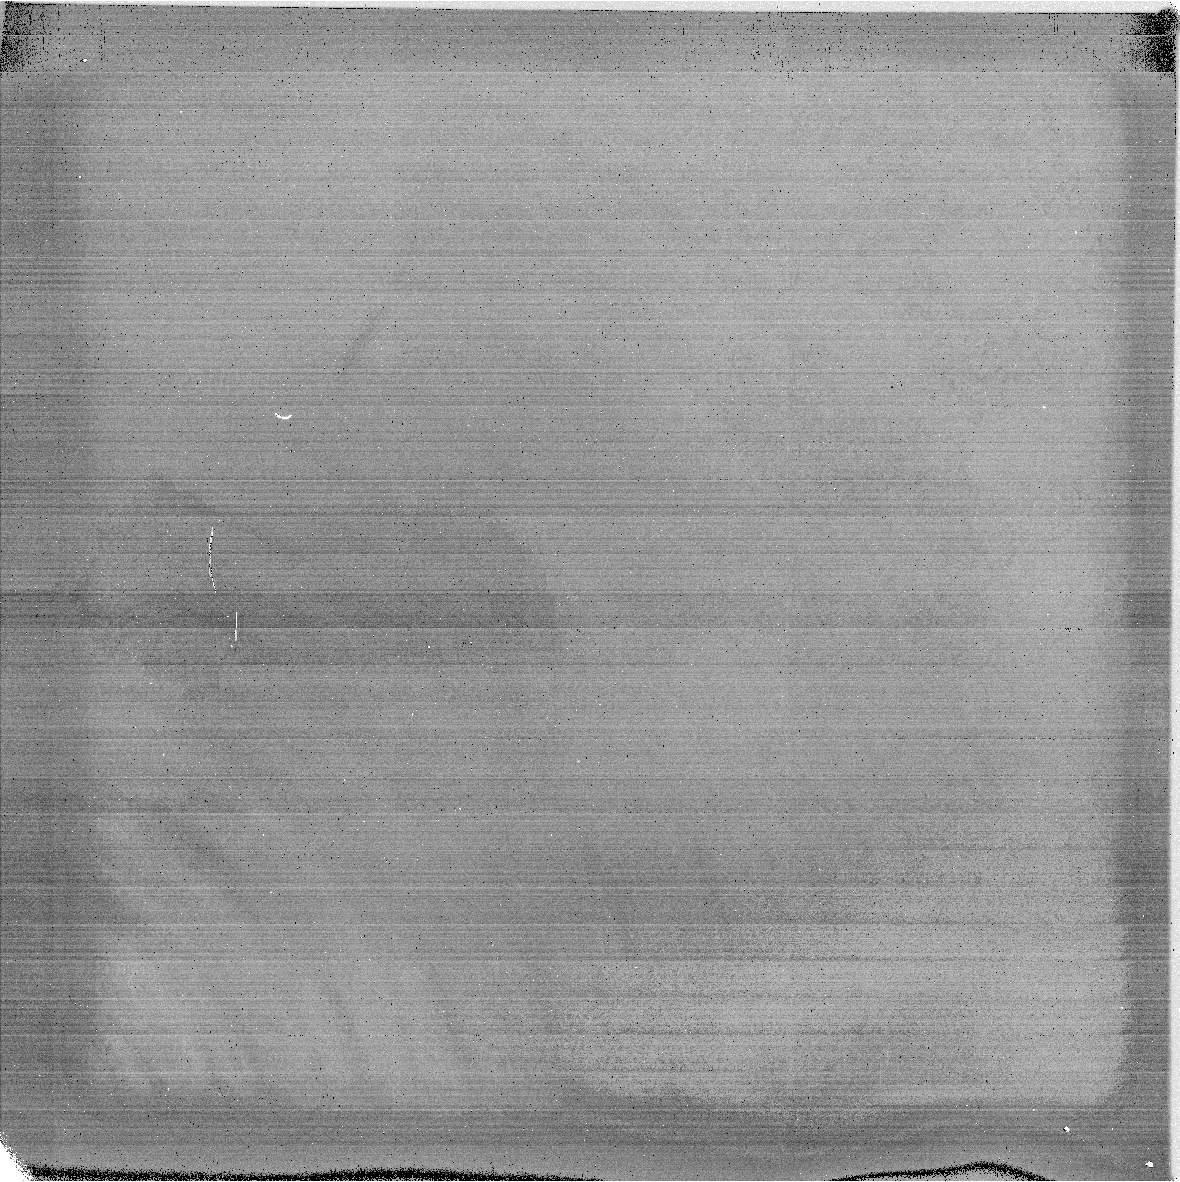 Figure 7
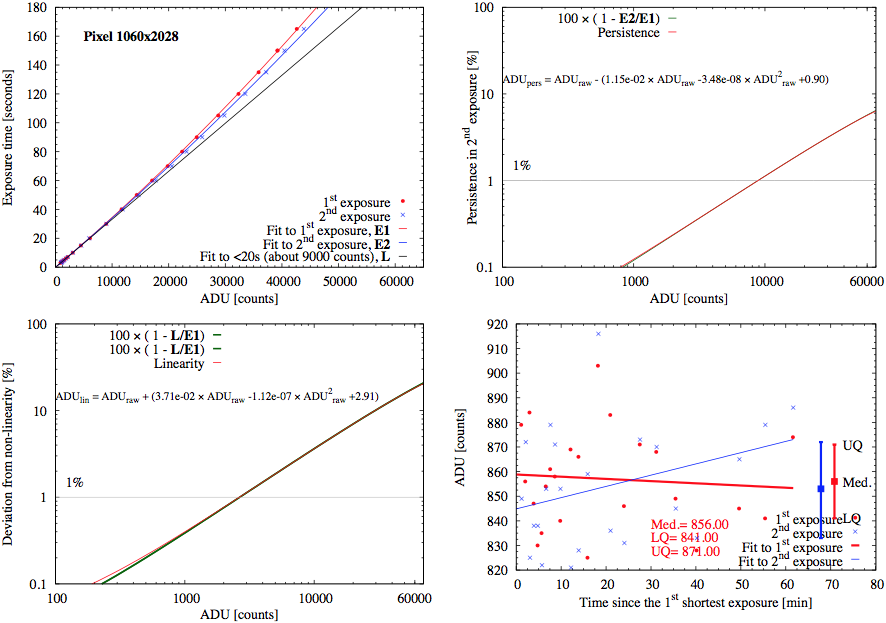 Figure 8
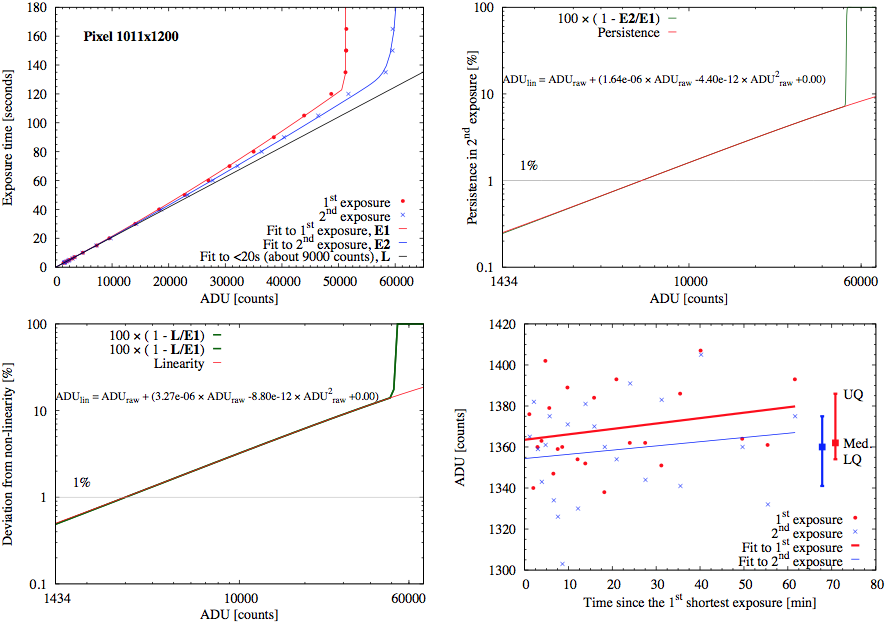 Figure 9
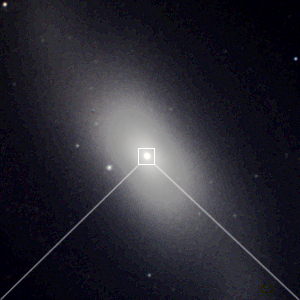 Figure 10
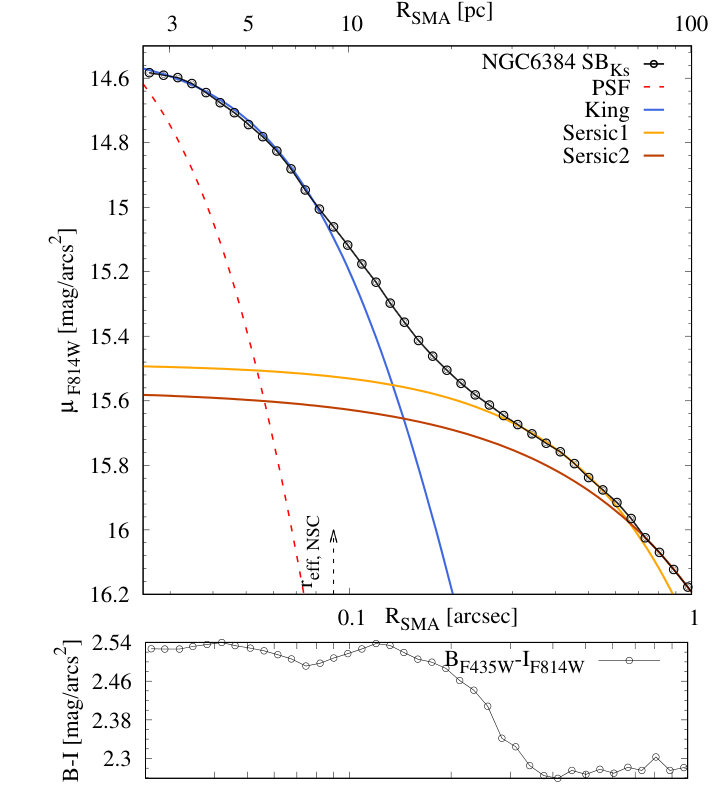 Figure 11
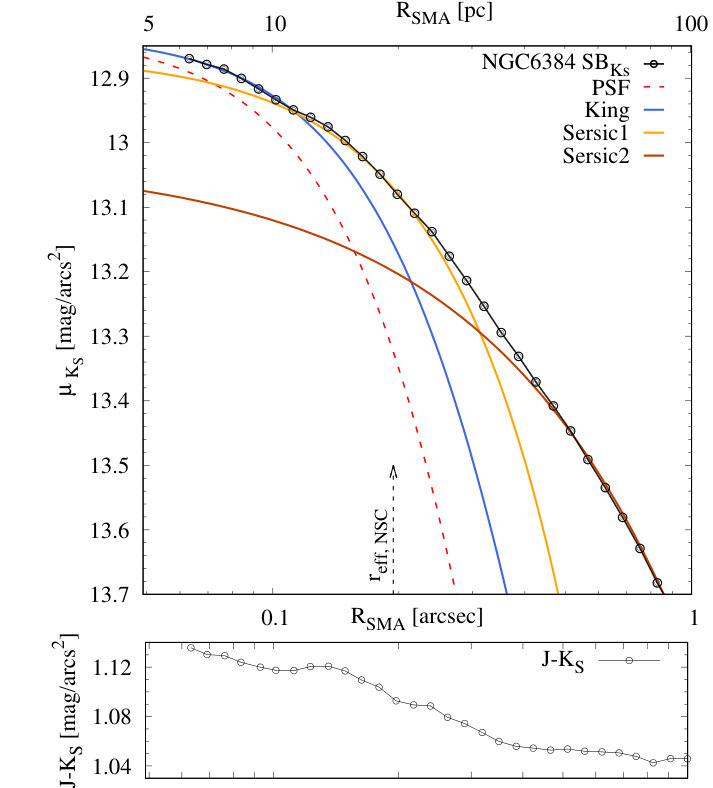 Figure 12
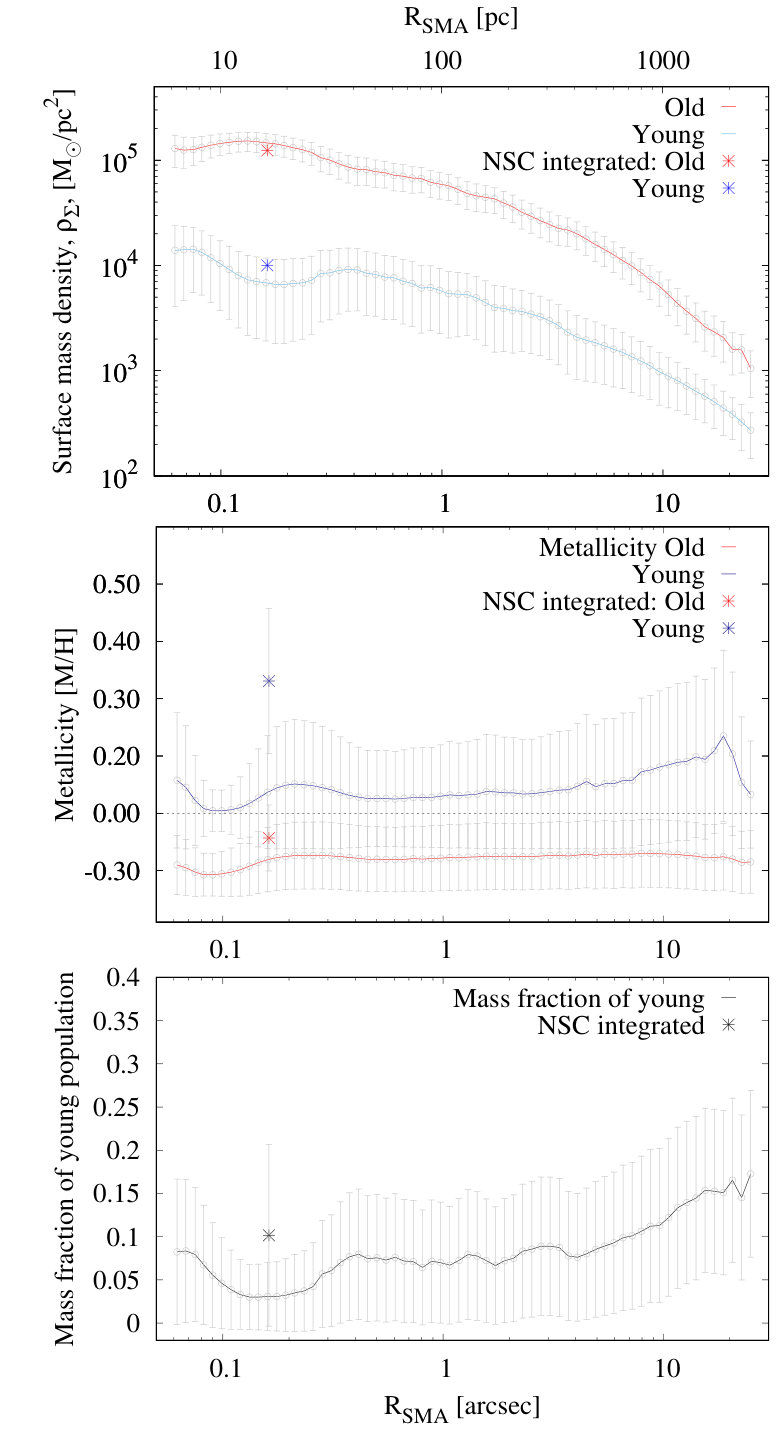 Figure 13
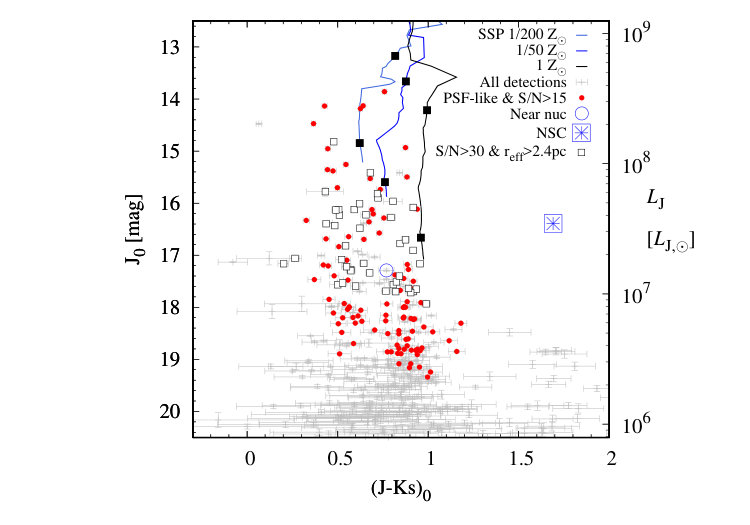 Figure 14
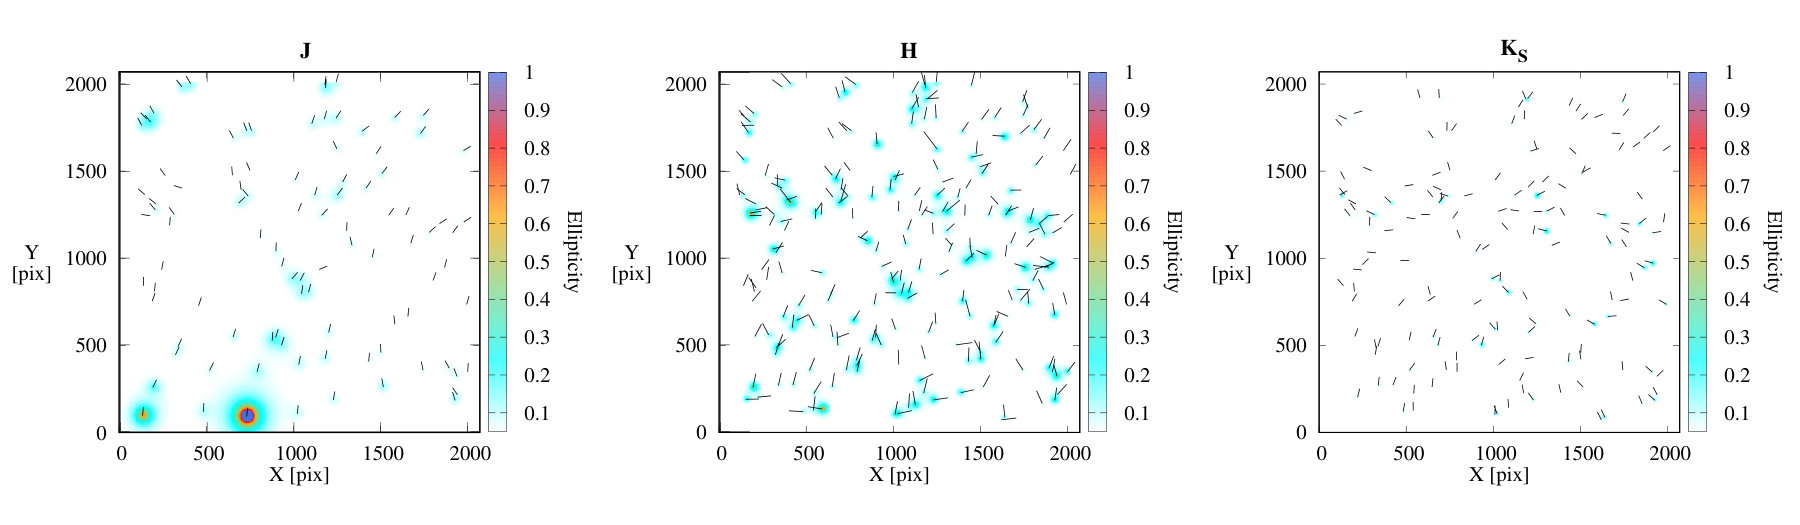 Figure 15
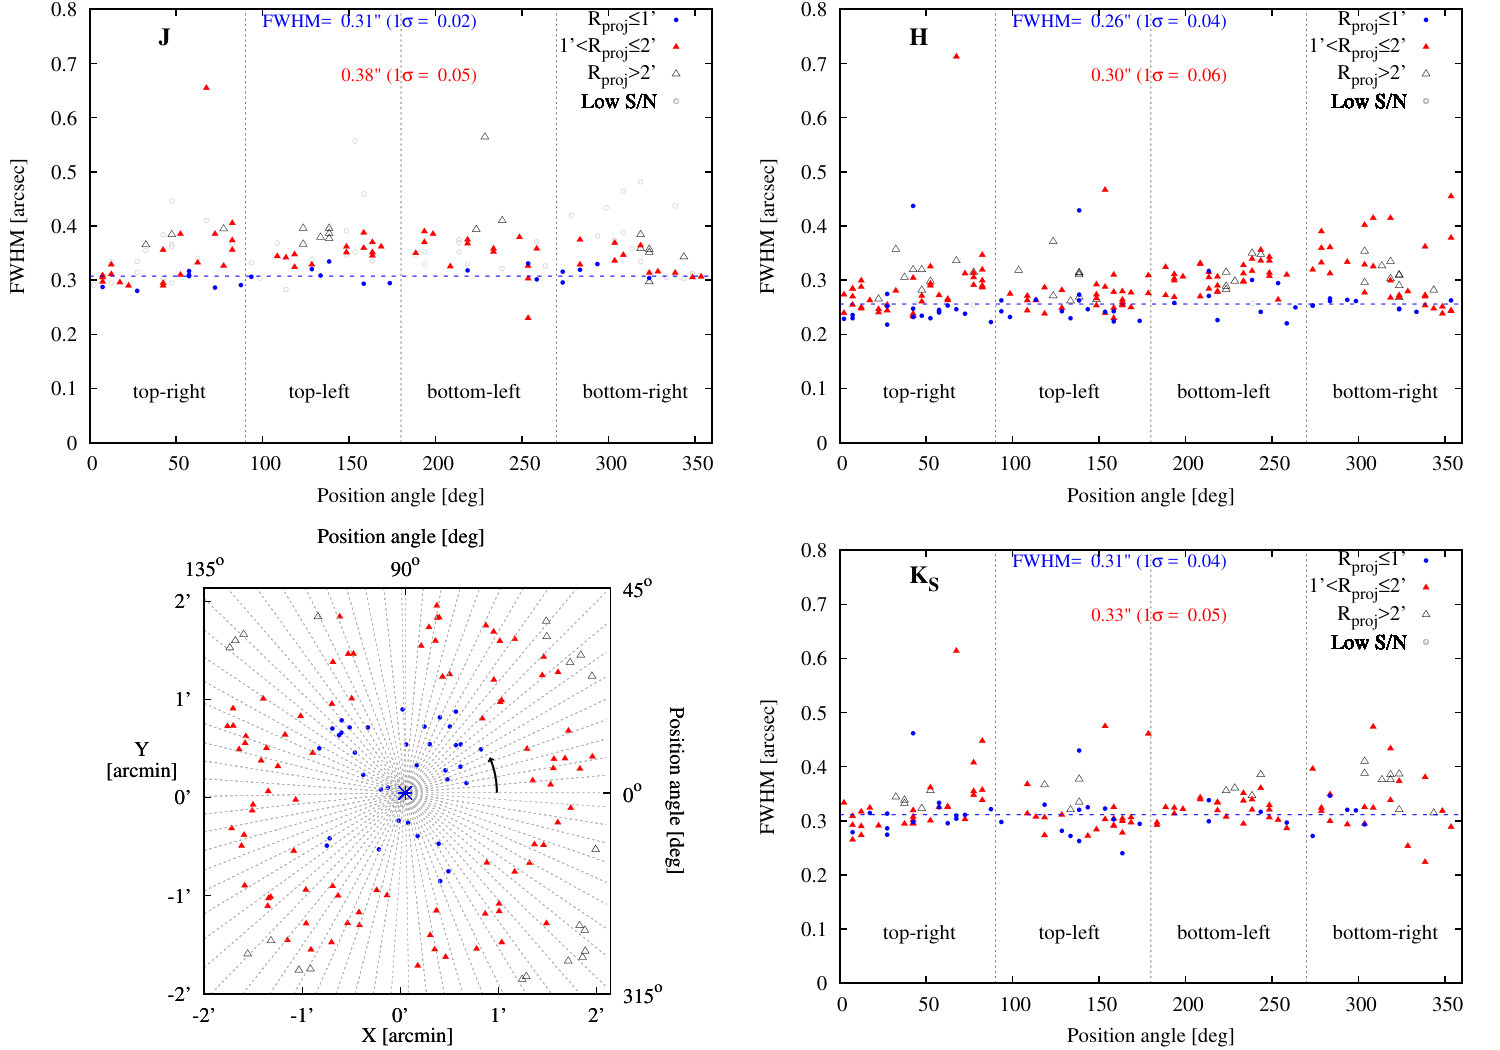 Figure 16
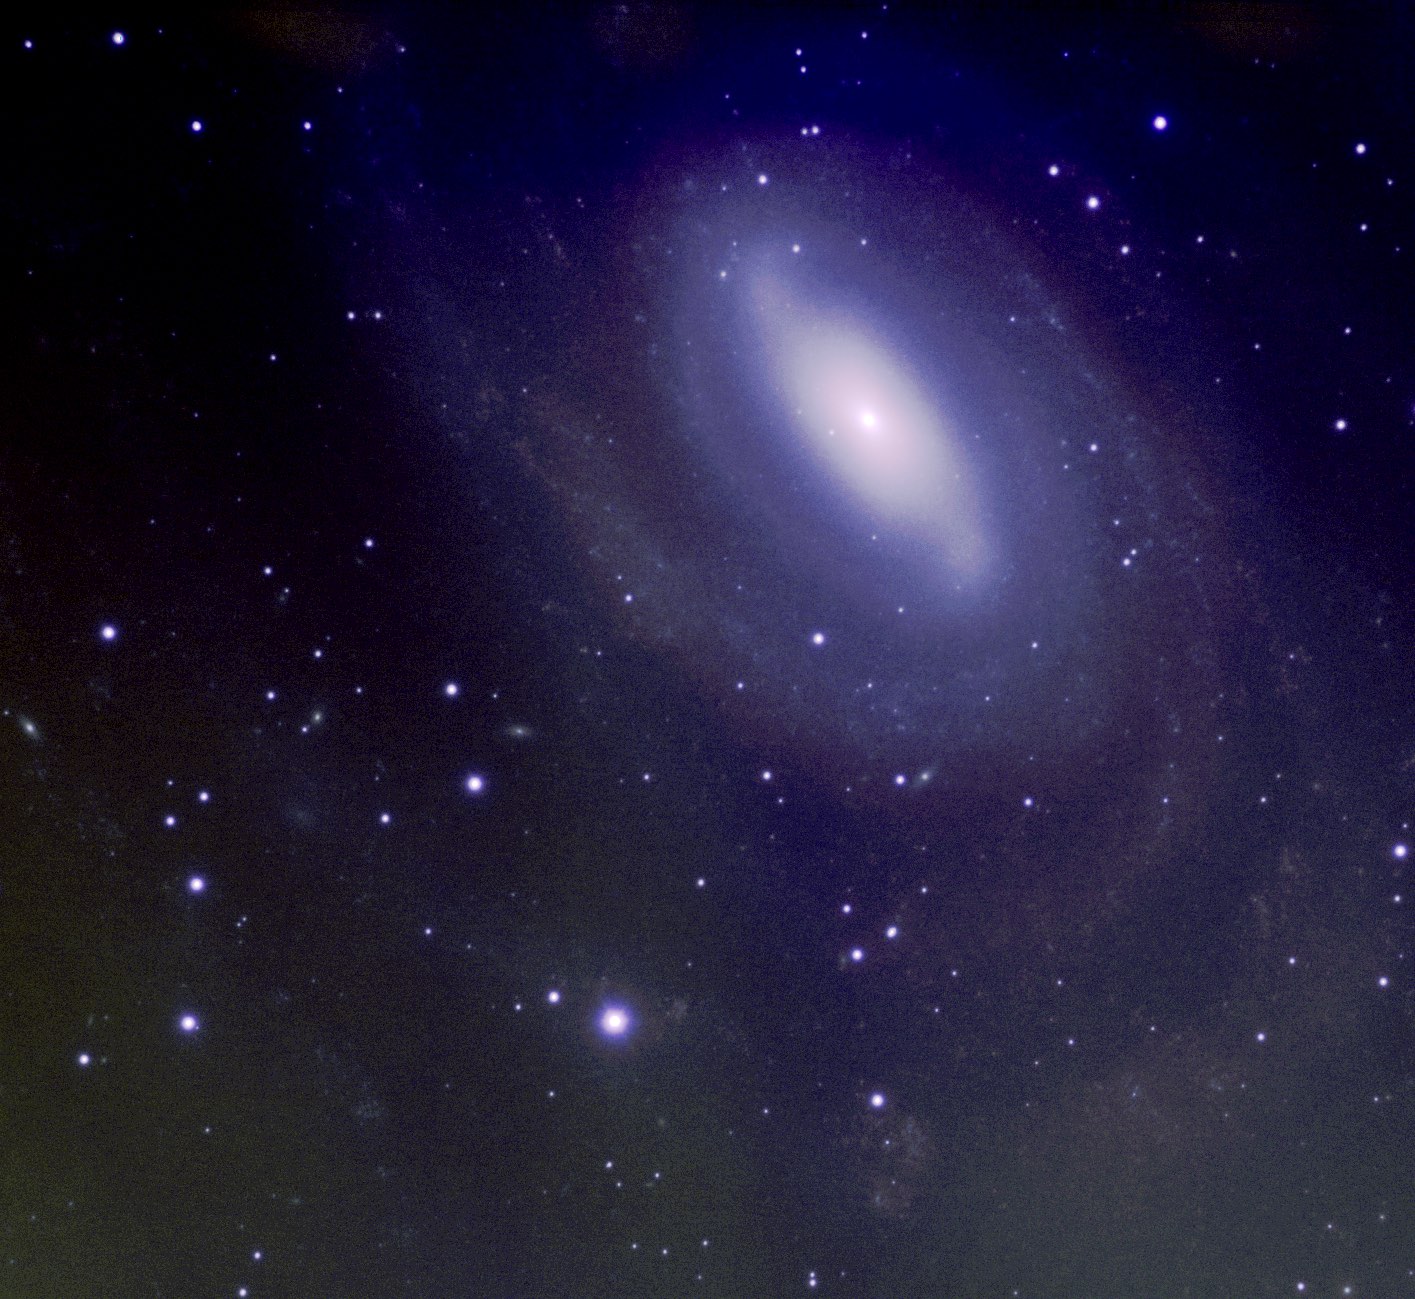 Figure 17
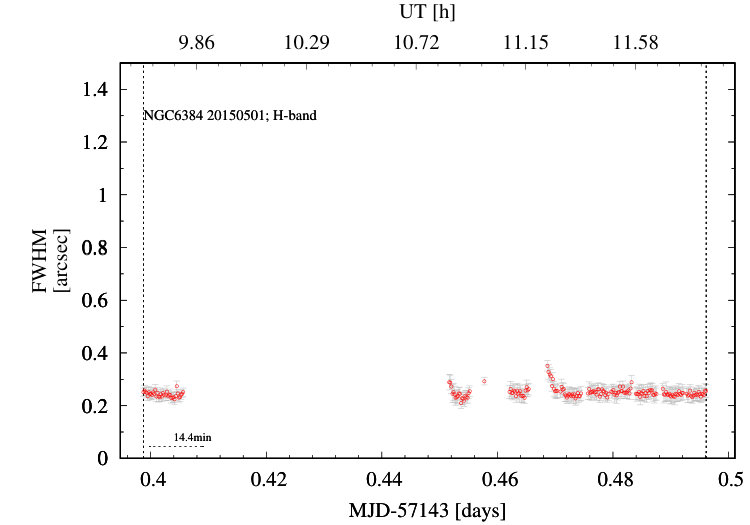 Figure 18
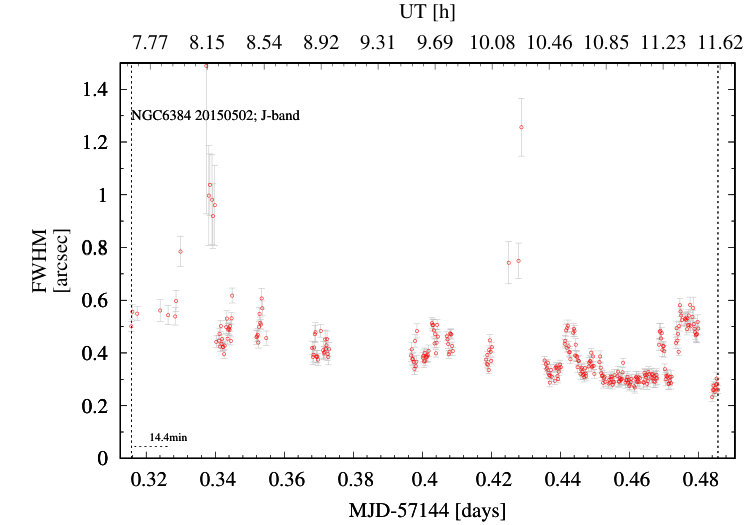 Figure 19
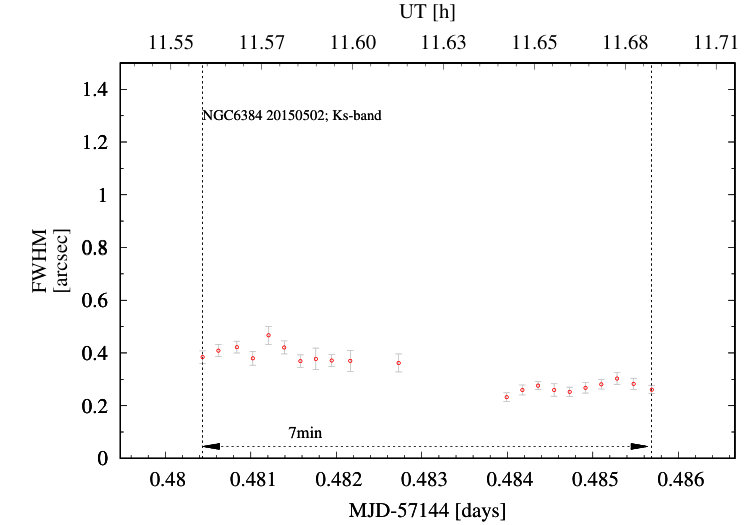 Figure 20
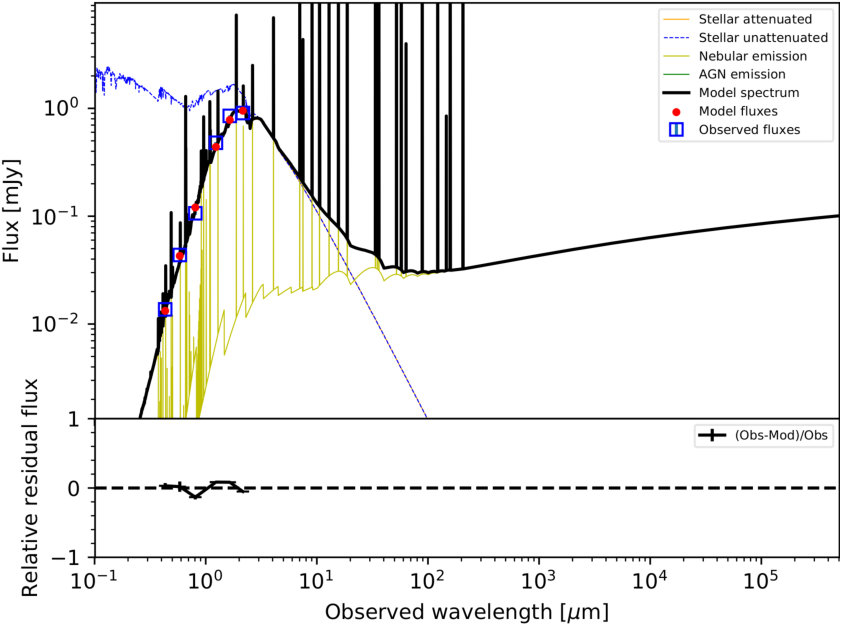 Figure 21
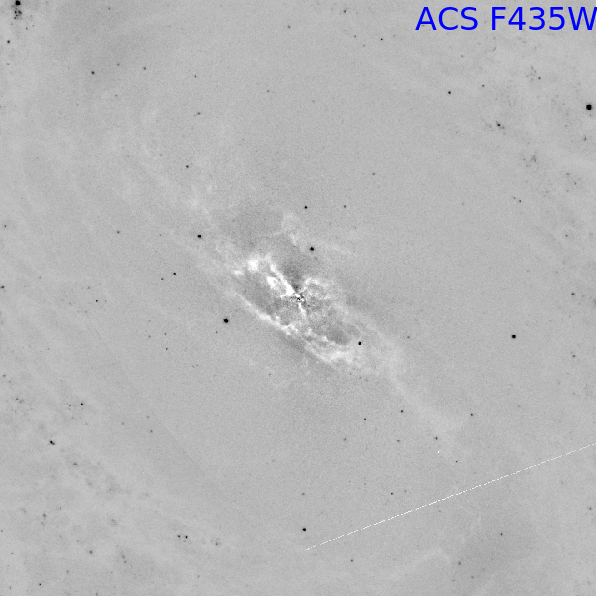 Figure 22
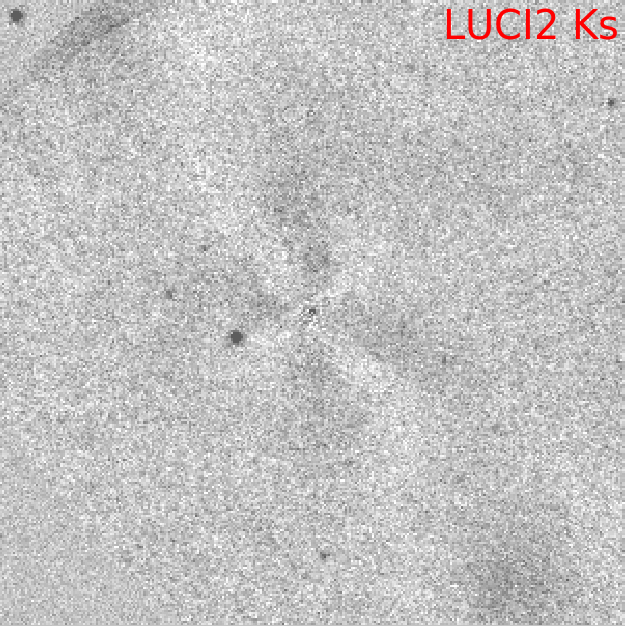 Figure 23
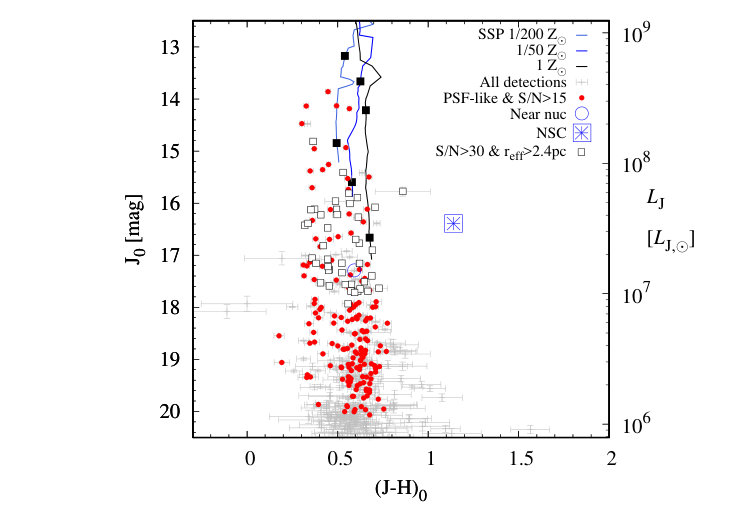 Figure 24
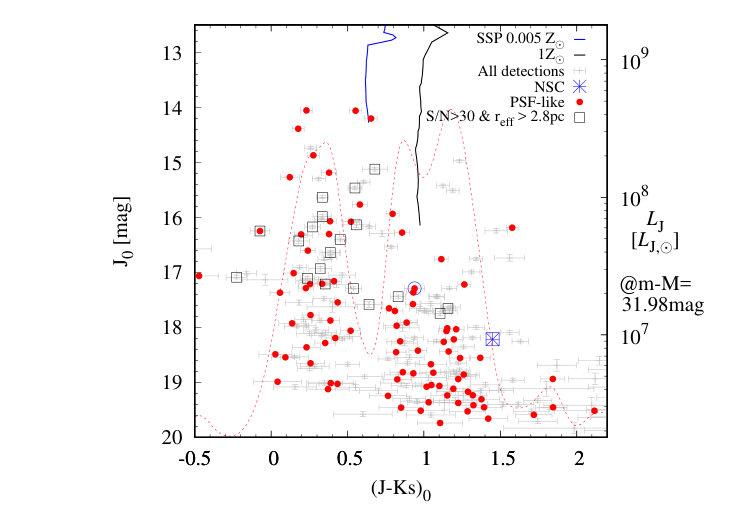 Figure 25
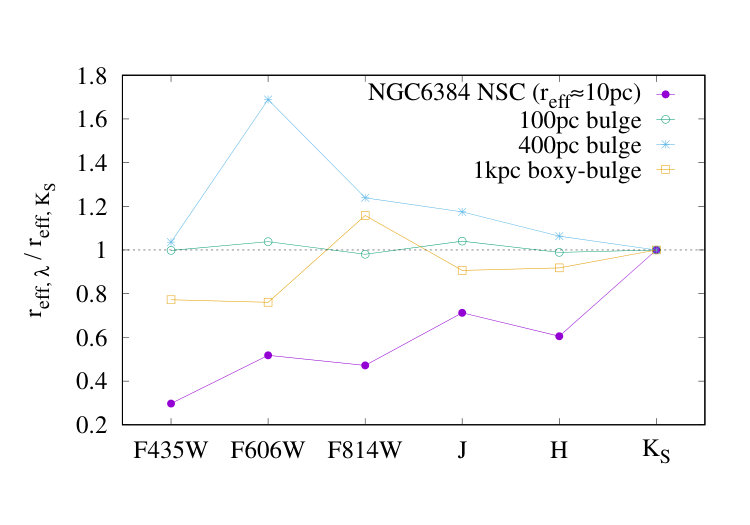 Figure 26
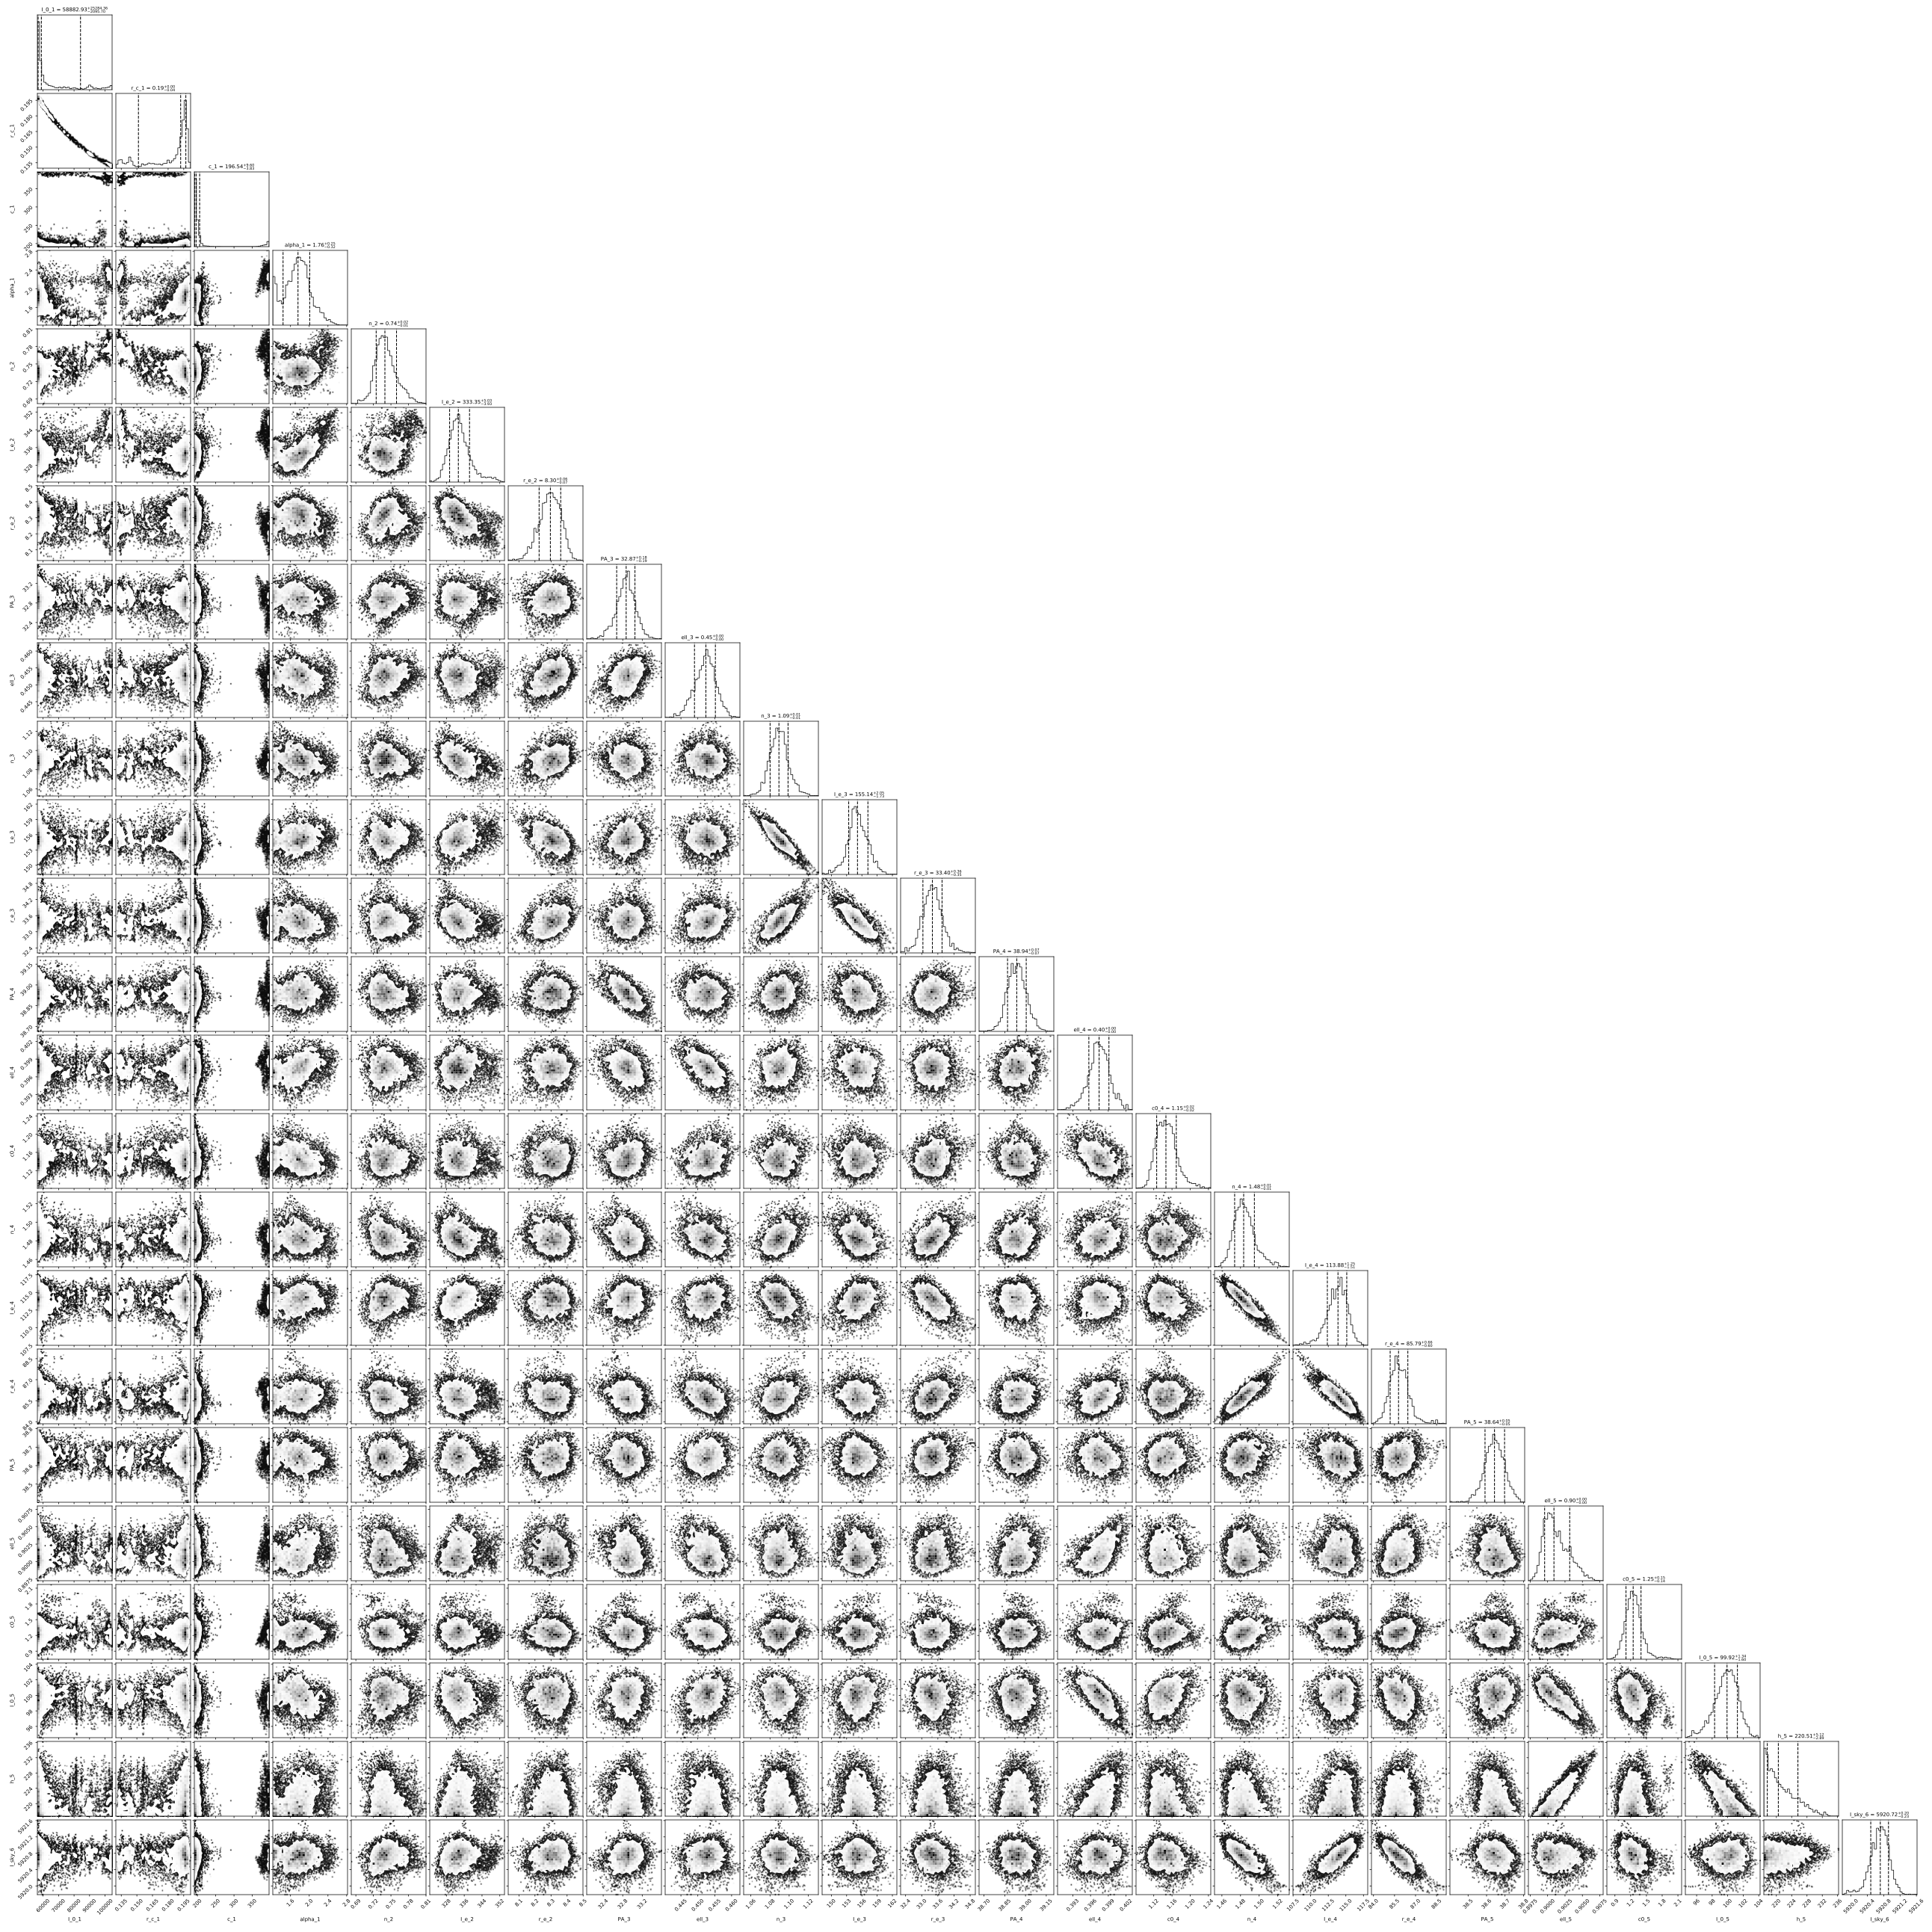 Figure 27
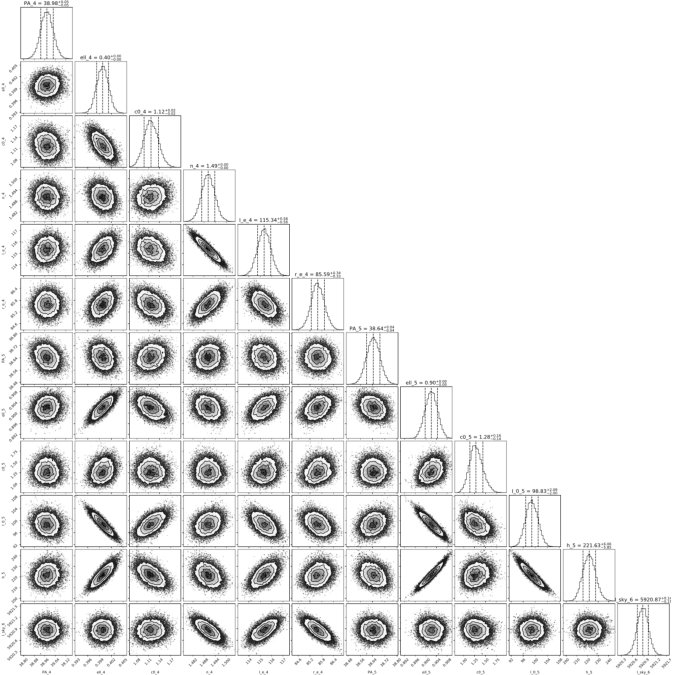 Figure 28
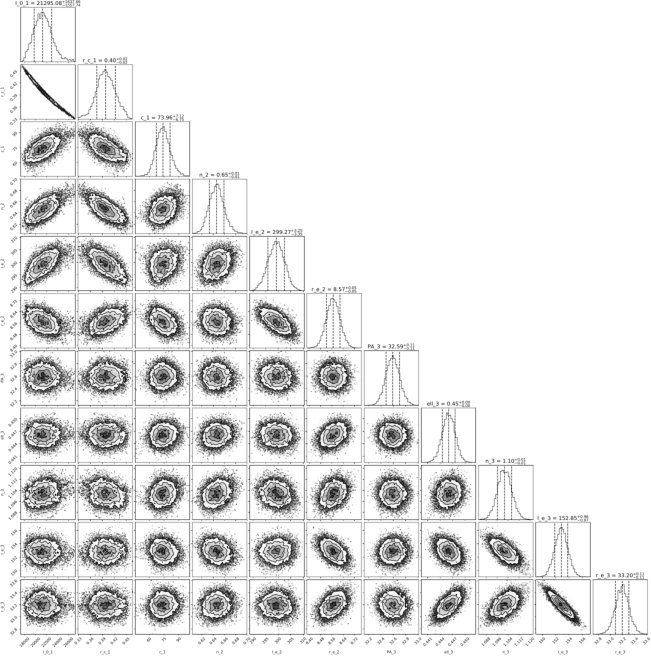 Figure 29
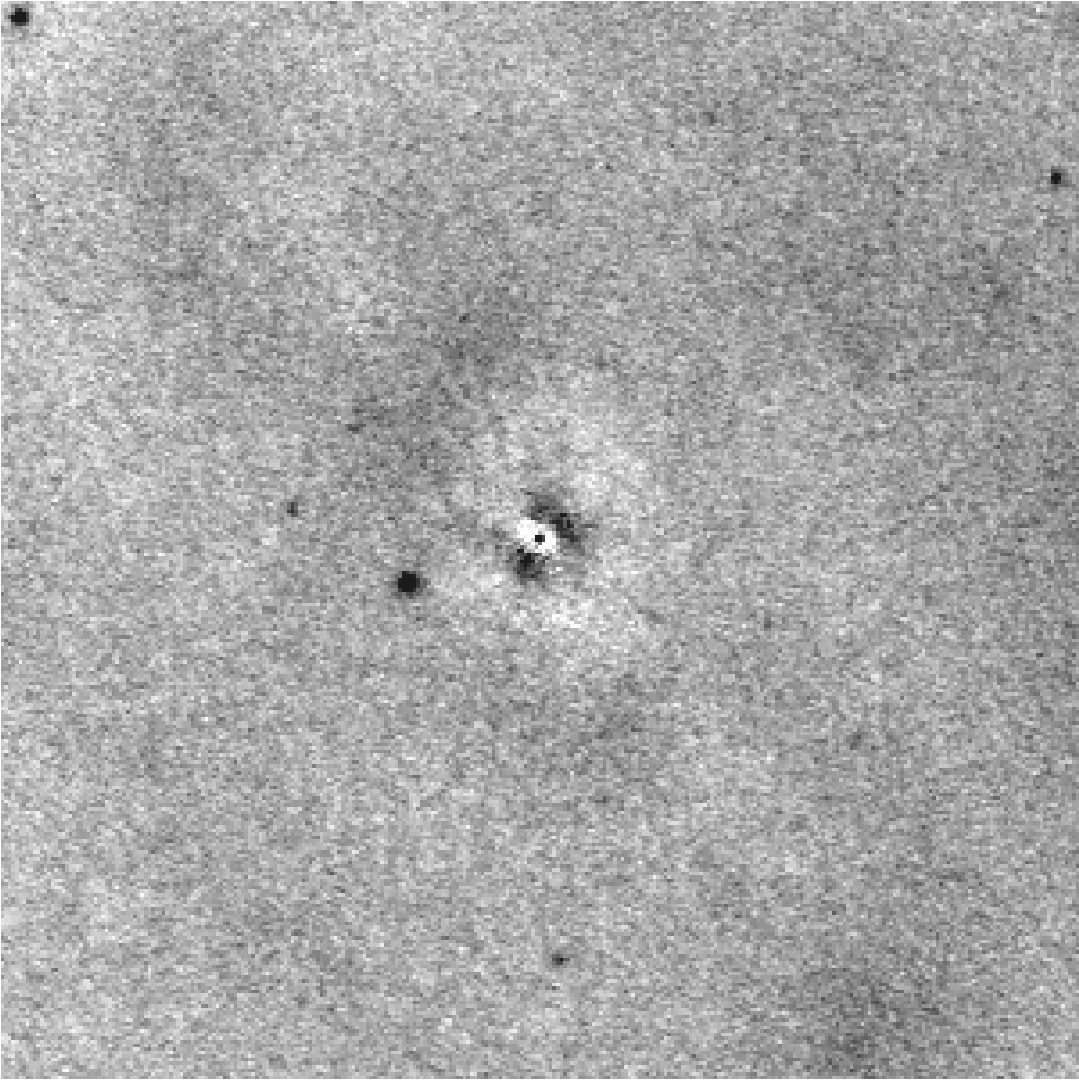 Figure 30
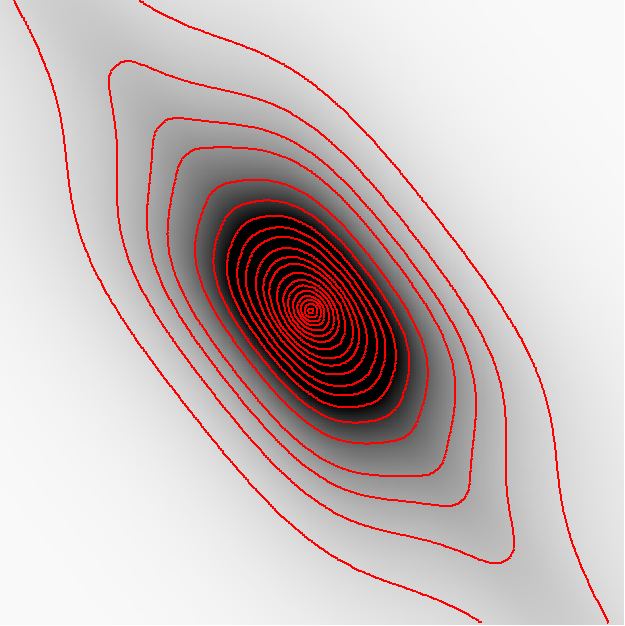 Figure 31
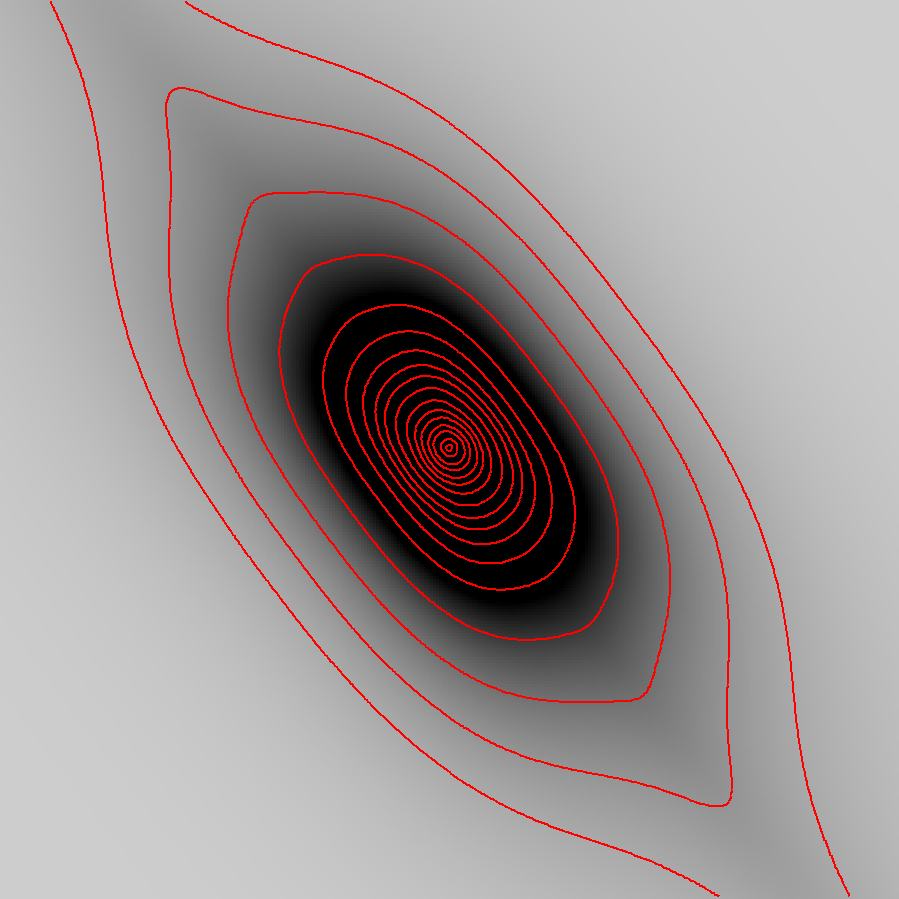 Figure 32
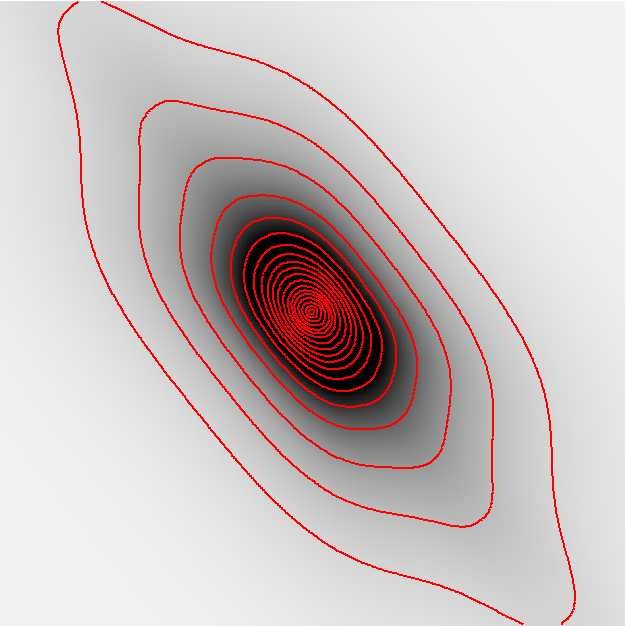 Figure 33
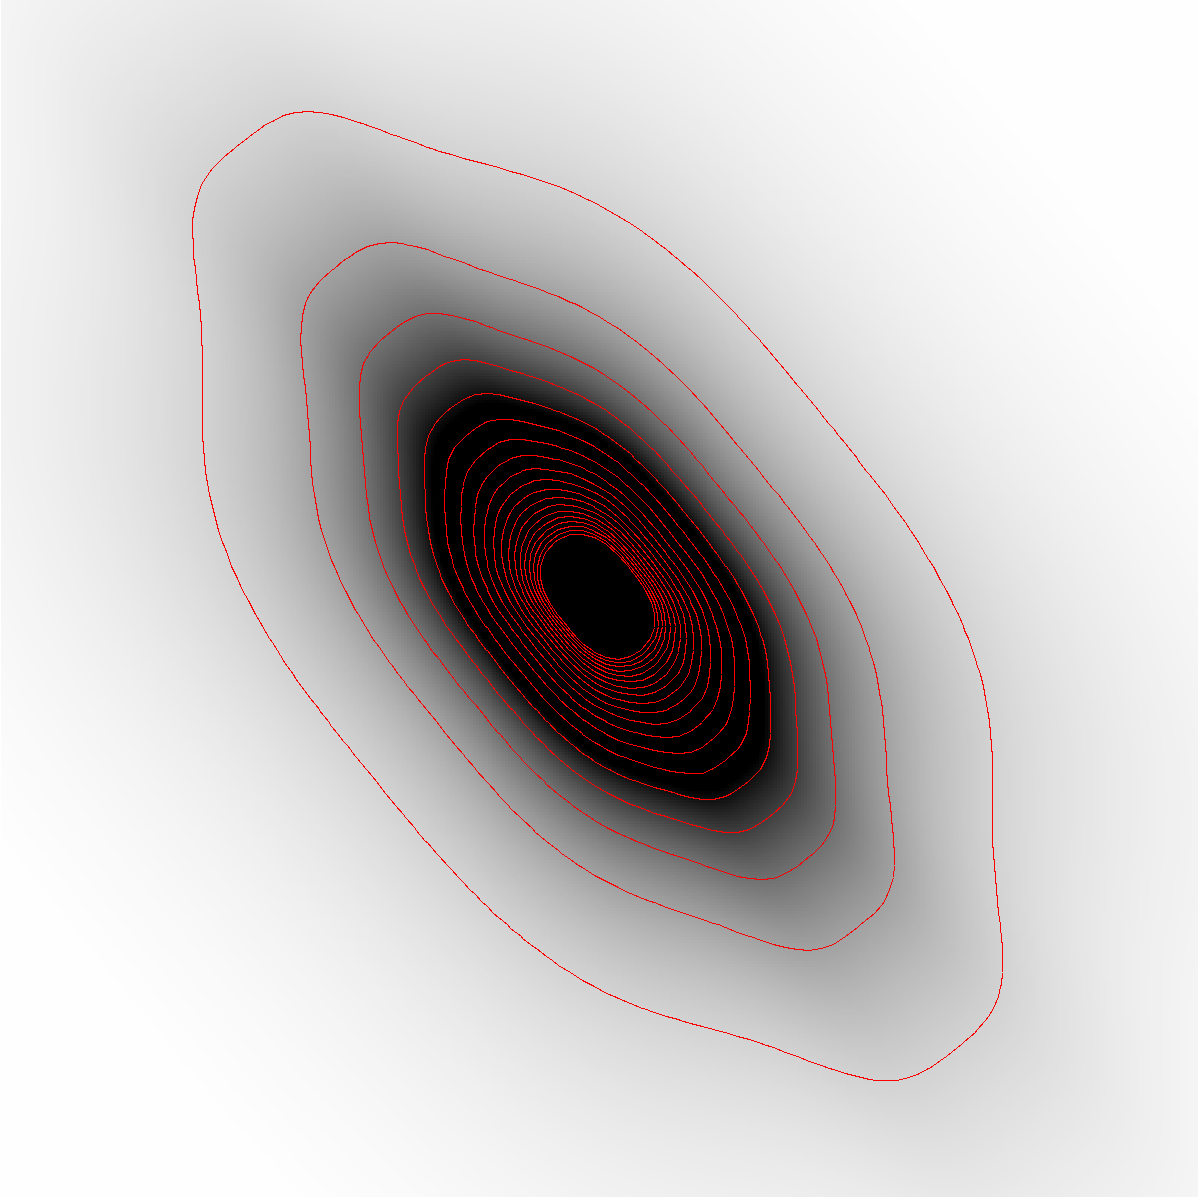 Figure 34
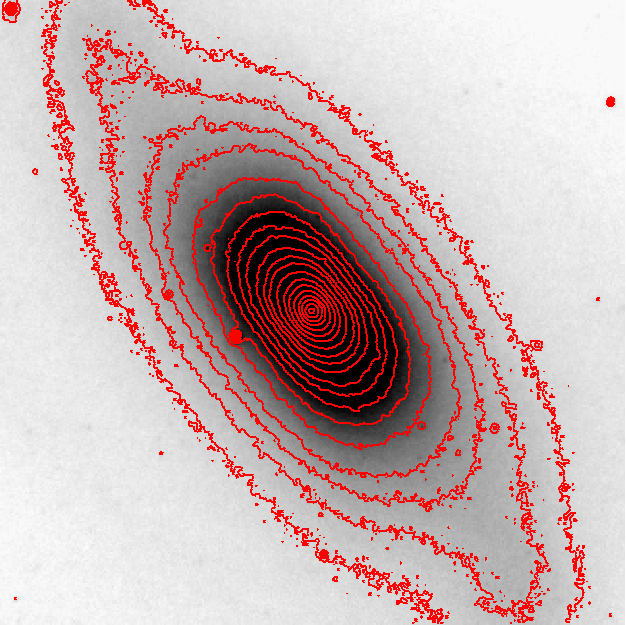 Figure 35
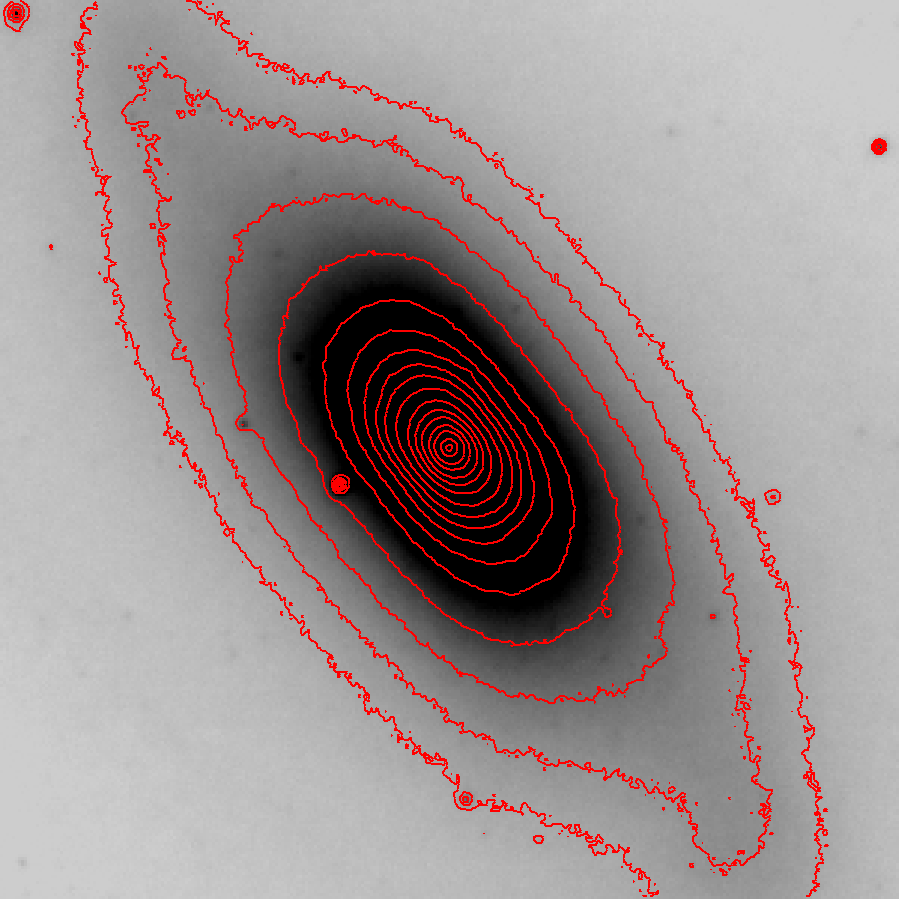 Figure 36
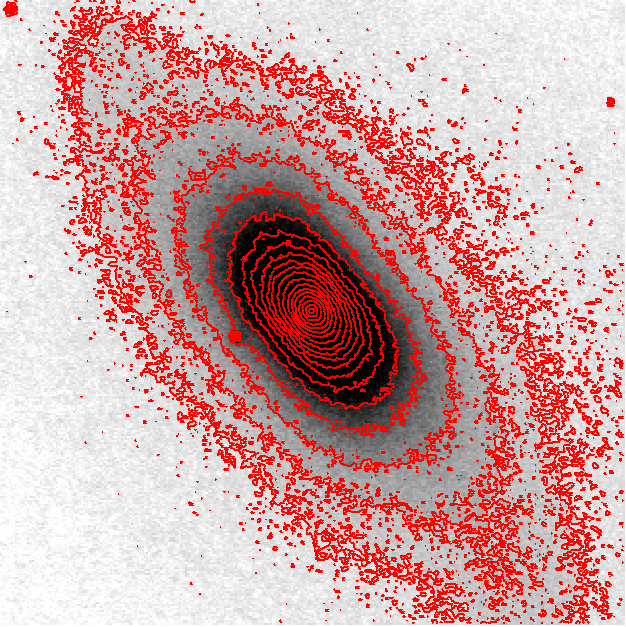 Figure 37
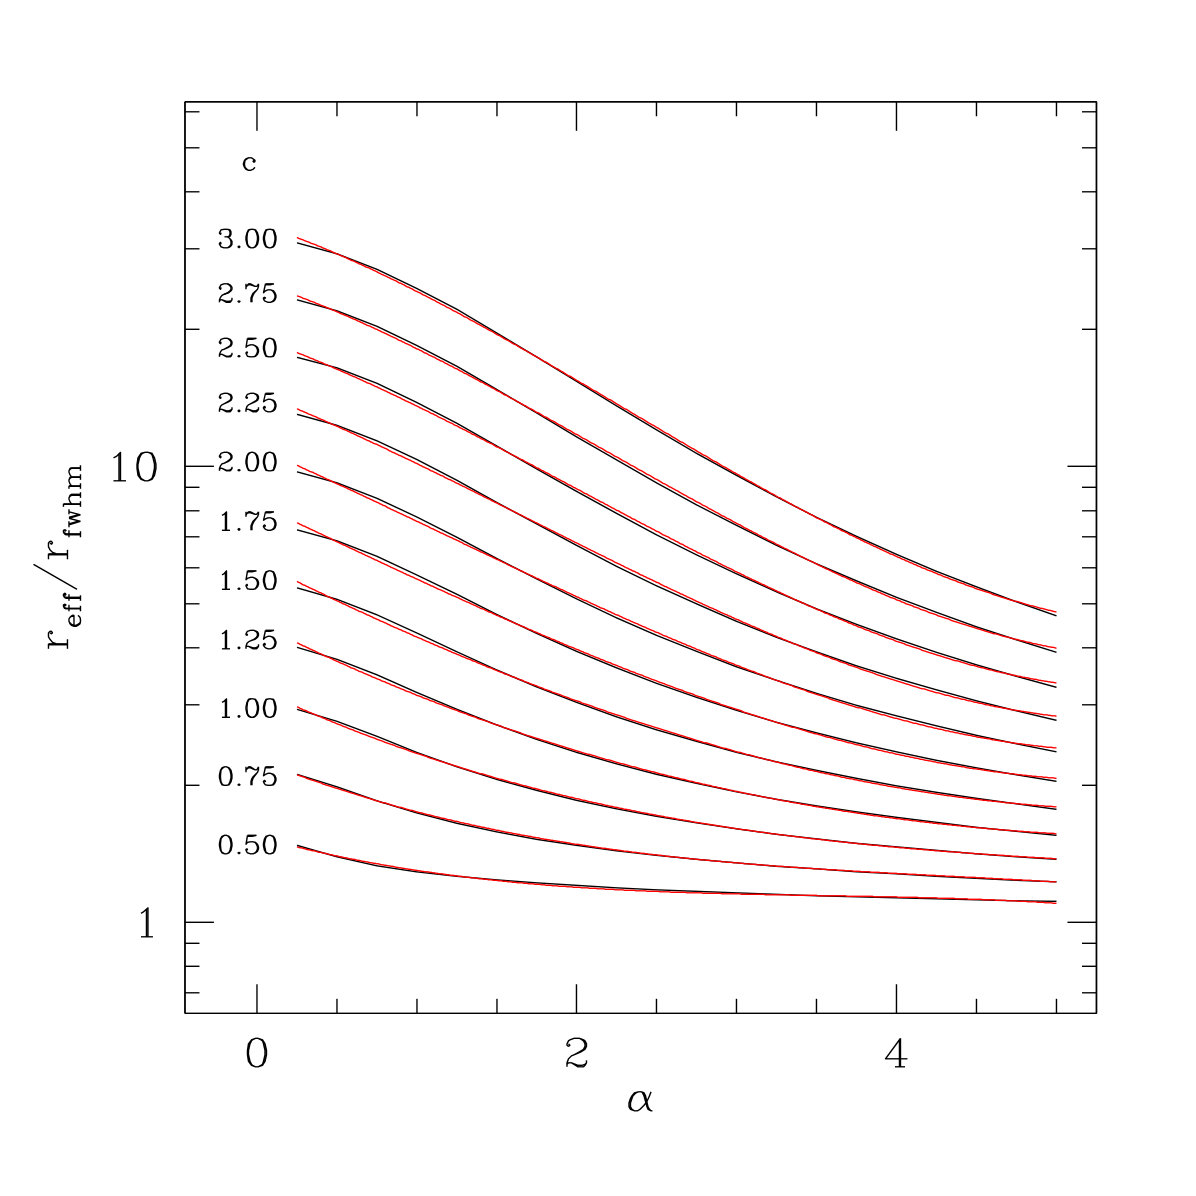 Figure 38
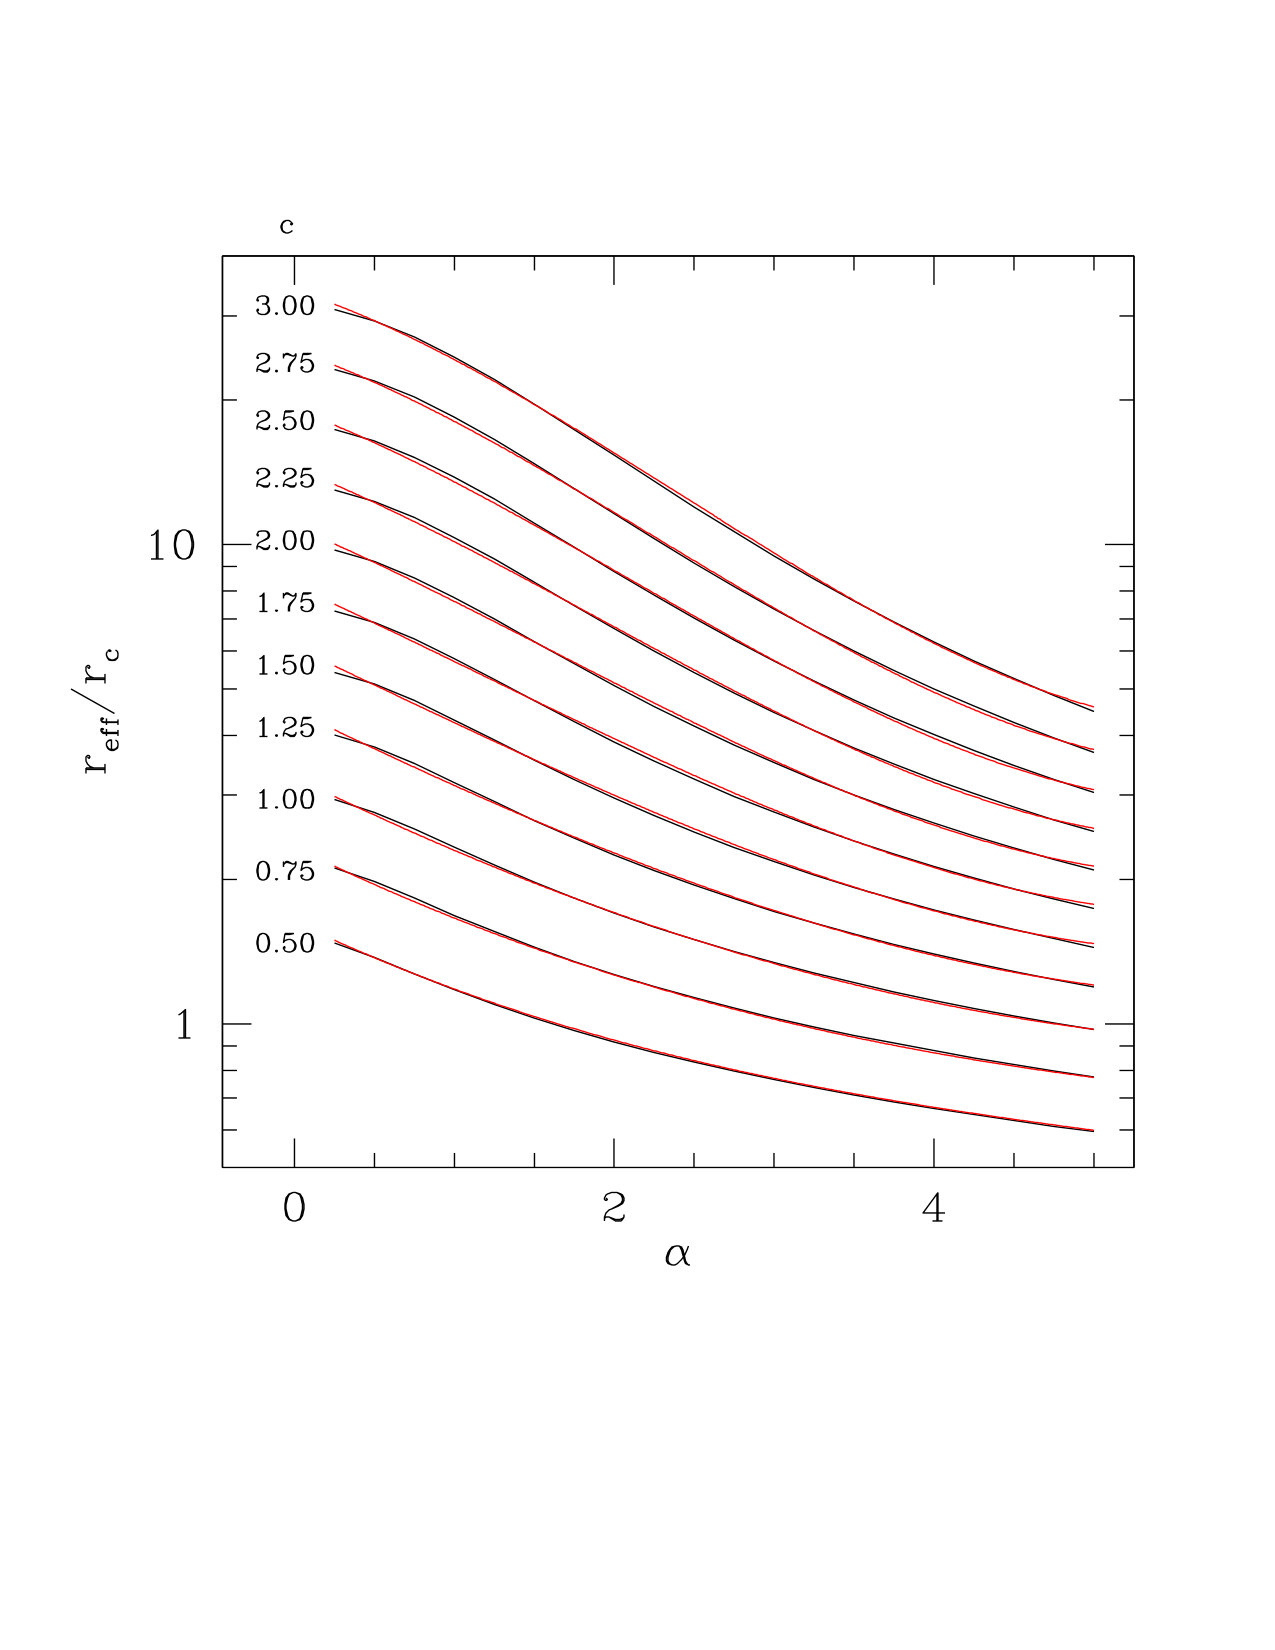 Figure 39
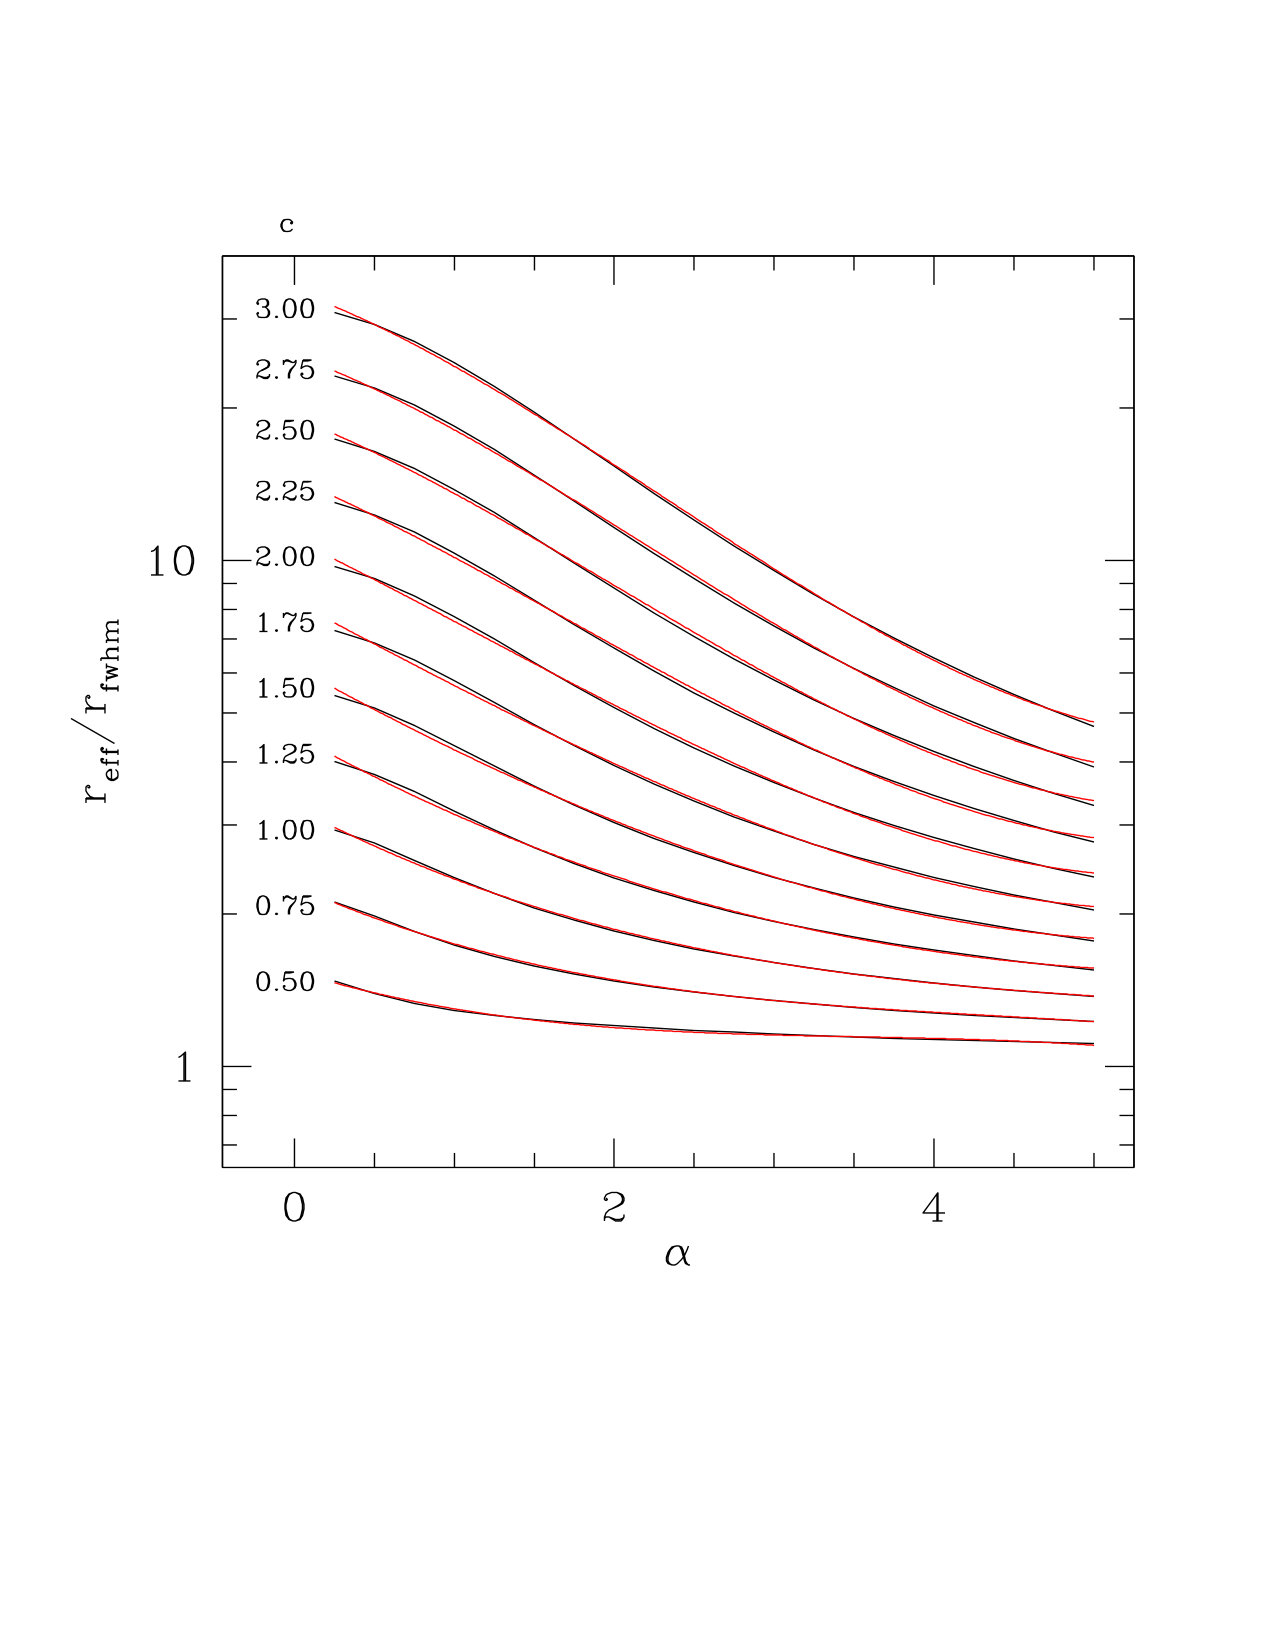 Figure 40
| Profile | ||||||
|---|---|---|---|---|---|---|
| (1) | (2) | (3) | (4) | (5) | (6) | (7) |
| King (the nuclear star cluster) | ||||||
| Mag999Magnitudes are corrected for Galactic reddening only. Intrinsic self-absorption values are obtained via SED fitting in § 3.3. | 21.61 | 19.98 | 18.56 | 16.39 | 15.25 | 14.70 |
| [pc]101010Size given in pc or kpc is for an assumed distance of 20.7 Mpc. We calculate of the modified King model as given in § D. | ||||||
| [pc] | ||||||
| Sersić (disk/bulge?) | ||||||
| Mag | 17.30 | 16.00 | 15.35 | 14.21 | 13.59 | 13.22 |
| n | ||||||
| [pc] | ||||||
| Sersić (disk/bulge?) | ||||||
| Mag | 15.04 | 13.59 | 13.55 | 13.01 | 11.73 | 11.47 |
| PA111111If PA or ellipticity is not given, their values are 0. If a parameter has no uncertainty, its value is below 1%. | ||||||
| ell | ||||||
| n | ||||||
| [pc] | ||||||
| Sersić GenEllipse (boxy bulge) | ||||||
| Mag | 14.85 | 13.06 | 11.39 | 10.32 | 9.84 | 9.35 |
| PA | ||||||
| ell | ||||||
| c0 | ||||||
| n | ||||||
| [pc] | ||||||
| Exponential GenEllipse (disk) | ||||||
| Mag | 13.66 | 11.84 | 11.71 | 10.17 | 9.62 | 10.35 |
| PA | ||||||
| ell | ||||||
| c0 | ||||||
| [kpc]121212We caution that due to fitting only the inner 1 kpc, the exponential disk scale height might not be truly representative for the actual extent of the disk. |
| Population | Age | Metallicity, [M/H] | Mass | |
|---|---|---|---|---|
| [Gyr] | [dex] | [mag] | [] | |
| Old | ||||
| Young |
Peer Reviews
No public reviews on file for this paper yet. If you reviewed it on a platform where reviews are public (OpenReview, ICLR, NeurIPS, ICML), you can paste yours below so the community can read it here.
Videos
No videos yet. Explain this paper in a talk, walkthrough, or lecture? Add one.
The Milky Way like galaxy NGC 6384 and its nuclear star cluster at high NIR spatial resolution using LBT/ARGOS commissioning data
Iskren Y. Georgiev1, Nadine Neumayer1, Wolfgang Gässler1, Sebastian Rabien2 e-mail: [email protected]
Lorenzo Busoni3, Marco Bonaglia3, Julian Ziegleder2, Gilles Orban de Xivry5, Diethard
Peter1, Martin Kulas1, Jose Borelli1, Gustavo Rahmer4, Michael Lefebvre4, Holger Baumgardt6
1Max-Planck Institut für Astronomie, Königstuhl 17, 69117 Heidelberg
2Max-Planck Institut für Extraterrestrische Physik, Giessenbachstrasse 1, 85748 Garching, Germany
3Arcetri Astrophysical Observatory, Largo Enrico Fermi 5, 50125 Florence, Italy
4LBT Observatory, University of Arizona, 933 N. Cherry Ave, Tucson, AZ 85721, USA
5Université de Liège, Institut d’Astrophysique et de Géophysique (Bât. B5c), Quartier Agora, Allée du 6 août, 19C, B-4000 Liège 1 (Sart-Tilman), Belgique
6University of Queensland, St. Lucia, QLD 4068, Australia
(Last updated yyyy/mm/dd; in original form yyyy/mm/dd)
Abstract
We analyse high spatial resolution near infra-red (NIR) imaging of NGC 6384, a Milky Way like galaxy, using ARGOS commissioning data at the Large Binocular Telescope (LBT). ARGOS provides a stable PSF AO correction of the ground layer across the LUCI 2 NIR camera field by using six laser guide stars (three per telescope) and a natural guide star for tip-tilt sensing and guiding. Enabled by this high spatial resolution we analyse the structure of the nuclear star cluster (NSC) and the central kiloparsec of NGC 6384. We find via 2D modelling that the NSC ( pc) is surrounded by a small ( pc) and a larger Sersić ( pc), all embedded within the NGC 6384 large-scale boxy/X-shaped bulge and disk. This proof-of-concept study shows that with the high spatial resolution achieved by ground-layer AO we can push such analysis to distances previously only accessible from space. SED-fitting to the NIR and optical HST photometry allowed to leverage the age-metallicity-extinction degeneracies and derive the effective NSC properties of an young to old population mass ratio of with , Age Gyr and 226 Myr , metallicity [M/H] and dex, and and 1.44 mag.
keywords:
galaxies: nuclei – galaxies: star clusters
††pubyear: 2018††pagerange: The Milky Way like galaxy NGC 6384 and its nuclear star cluster at high NIR spatial resolution using LBT/ARGOS commissioning data –D
1 Introduction
The development of current telescope technology is essential to increase the efficiency of scientific output. In particular, high spatial resolution over a large field of view is one such domain that was recently commissioned at the Large Binocular Telescope (LBT111http://www.lbto.org/, Hill, 1994; Hill et al., 2012) on Mount Graham in Arizona. The Advanced Rayleigh guided Ground layer adaptive Optics System, ARGOS222http://www.mpe.mpg.de/ir/argos (Rabien et al., 2018), equips the LBT with six green light (532 nm) lasers (three on each side situated on a circle with 2′ radius (see Fig. 1).
ARGOS corrects the ground layer turbulence by using artificial laser stars focused at 12 km and a tip-tilt star for wave front sensing and guiding. This improves the near infra-red (NIR) natural seeing by a factor of 2 – 3, and provides a stable Point Spread Function (PSF) over a field of view with increase toward the detector edges. Together with the NIR cameras LUCI 1 & 2 (see § 2) this makes LBT uniquely equipped for high-spatial resolution NIR science. A dedicated ARGOS paper describing its technical aspects, performance and commissioning results is published by Rabien et al. (2018). The aim of this paper is to utilize the large field of view AO correction and push the limits to study the structure of compact star clusters beyond distances accessible for ground based seeing limited observations.
Here we focus on the spatial analysis of the nuclear star cluster (NSC) and its host galaxy NGC 6384 at a distance of 20.7 Mpc ( mag, Sorce et al., 2014). In a forthcoming paper we will present the analysis of the star cluster population of NGC 6384. This galaxy was selected as a first scientific commissioning target due to the large amount of Galactic stars suitable for performance testing. In addition, its stellar mass (, Georgiev et al., 2016) and boxy/peanut bulge structure (Erwin & Debattista, 2013) makes it appear very similar to the Milky Way (MW). Its NSC is more extended but of comparable mass ( pc, , Georgiev & Böker, 2014; Georgiev et al., 2016, and found here in the NIR) to that of the MW nuclear cluster ( pc, , Schödel et al., 2014). The similar mass might suggest that it is possible to host a similarly massive black hole (MBH) of (Gravity Collaboration et al., 2018; Feldmeier-Krause et al., 2017). A potential MBH would also explain its classification as a LINER galaxy (Ho et al., 1997). This makes it a good test case in studying the NSC NIR properties of a MW analogue at Mpc. The main difference to the MW, however, is its very low galaxy density environment. To within km/s of its systemic velocity (1664 km/s)333Velocity information has been retrieved from the HyperLeda database (Makarov et al., 2014). the nearest bright galaxy is NGC 6509 (1813 km/s, mag fainter than NGC 6384) at a projected separation of Mpc () and is also twice less massive (, Georgiev et al., 2016).
Due to the high density nature of NSCs (compact pc and massive, , e.g. Böker et al., 2002, 2004; Walcher et al., 2005; Georgiev & Böker, 2014; Georgiev et al., 2016; Ordenes-Briceño et al., 2018; Sánchez-Janssen et al., 2018), obtaining high spatial resolution data in the NIR is crucial to break the age-metallicity-reddening degeneracies present in the optical alone (e.g. de Meulenaer et al., 2014). This is very important for studying their properties, where young stellar populations and high extinction are expected to be present. Spatially resolving these provides important constraints on our understanding of how galactic nuclei and NSCs build up, e.g. via cluster migration and merging (e.g. Tremaine et al., 1975; Capuzzo-Dolcetta, 1993; Oh & Lin, 2000; Bekki et al., 2004; Antonini et al., 2012; Tsatsi et al., 2017) or in situ from gas accretion (e.g. Böker et al., 2003; Milosavljević, 2004; Schinnerer et al., 2003, 2006; Bekki, 2007) or most likely a combination of both (e.g. Neumayer et al., 2011; Hartmann et al., 2011; Antonini et al., 2015; Cole et al., 2017; Kacharov et al., 2018). In addition, studies of NSCs have shown that their size increases with wavelength (Georgiev & Böker, 2014; Carson et al., 2015), which is consistent with earlier findings that NSCs contain morphologically distinct young and old stellar populations (Seth et al., 2008), where the young one is more centrally concentrated. From numerical simulations is known that due to energy equipartition and orbital relaxation merging of clusters typically leads to a final cluster with larger effective radius () (e.g. Fellhauer & Kroupa, 2002; Bekki et al., 2004). On the other hand NSC growth dominated by episodic gas accretion will lead to a more compact clusters (e.g. Tsang & Milosavljević, 2018).
Optical-NIR Spectral Energy Distribution (SED) modelling of diffuse light (e.g. Carson et al., 2015; Dale et al., 2016) at high spatial resolution can provide a map of the spatial variation and composition of the main stellar population components of the NSC, as well as their host galaxy. Such analysis can also unveil (an additional) contribution to the optical-NIR light from accretion onto an obscured nuclear MBH and/or nuclear star formation activity (e.g. Noll et al., 2009; Drouart et al., 2016). To understand NSC formation, it is therefore critical to be able to disentangle such degeneracies. For example, follow-up spectroscopic observations aiming at decomposing the main stellar populations and the dynamical imprint of a MBH rely on a good mass model to predict the stellar population velocity profile (e.g. Häring-Neumayer et al., 2006; Seth et al., 2010; Neumayer et al., 2011; Neumayer & Walcher, 2012; Nguyen et al., 2018). Observations of NSCs have shown that although they contain young stellar populations and extended star formation histories (SFHs), the most dominant one by mass is the oldest ( Gyr), where more than 50% of the mass of the cluster has formed (e.g. Walcher et al., 2006; Kacharov et al., 2018, from spectral modelling in the optical). Therefore, characterising the spatial structure of NSCs in the NIR is of particular importance, because that is where most of the stellar light of the old stellar population is emitted that allows us to trace most of the gravitating mass. Therefore, characterizing NSCs in the NIR can provide additional constraints as to which of the leading NSC formation scenarios had a major role in the formation of particular NSC. However, to be able to achieve this for a larger sample and of more distant galaxies, efficient high spatial resolution observations are required, such as with the presented here wide-field ground-layer AO NIR observations in the NIR with ARGOS at the LBT.
Here we first present the observations, data reduction and calibrations in § 2. In § 3 we present our analysis of the data with the colour-magnitude diagram (CMD, in § 3.1) of all sources in the LUCI 2 field of view of NGC 6384 and in § 3.2 we present the structural analysis of the NSC and NGC 6384. In § 3.3 we combine the optical photometry from archival HST data and the LUCI 2 NIR photometry to derive via SED fitting the NSC effective age, luminosity weighted mass, metallicity and reddening. Finally, in § 4 we discuss and summarize our findings.
2 Observations, reduction and calibration
2.1 Near infar-red LBT/LUCI 2 data and PSF photometry
NGC 6384 imaging data was obtained during the ARGOS commissioning run on 2015-05-01 and 02. The total integration time in closed loop with the LBT/LUCI 2 NIR camera (Seifert et al., 2003) and a Detector Integration Time (DIT)=5 s is , i.e. 155, 172 and 14 frames per filter, respectively. Due to constraints from commissioning tasks, the -band data was not fully completed. Nevertheless, as we will show later (§ 3.1), the depth was sufficient enough for our analysis of the NSC and the brightest GCs. The latter will be investigated in a forthcoming study, while here we focus our analysis only on the NSC and the central kiloparsec of NGC 6384. A colour composite image of NGC 6384 shown in Figure 2 is zoomed at the central . The intensity scaling is adjusted such that it better shows various galactic structures (nucleus, bar, bulge, spiral arms). The brightest star (middle-bottom) is the used as the tip-tilt star (a Natural Guide Star, NGS, for Wave Front Sensing, WFS). The LUCI 2 plate scale of pix corresponds to 12 pc/pix at the distance to NGC 6384 of 20.7 Mpc. We used a rectangular dither pattern within to eliminate detector cosmetics (bad pixels). The dither pattern is also chosen such that the NGS stays within the field of view of the NGS camera board, shown with gray solid rectangle in Figure 1. In this schematic representation one can see that the ARGOS LGSs are situated on a circle with a radius of , where their exact location depends on the field orientation. Off-target sky frames beyond the galaxy extent were unfortunately not obtained due to technical limitations during this first science commissioning run. Nevertheless, we are able to obtain a good global photometric calibration by using about 30 stars in common with the 2 MASS point source catalogue (details follow below).
Image reduction was performed with tasks in IRAF444IRAF is the Image Reduction and Analysis Facility, a general purpose software system for the reduction and analysis of astronomical data. IRAF is written and supported by the National Optical Astronomy Observatories (NOAO) in Tucson, Arizona. NOAO is operated by the Association of Universities for Research in Astronomy (AURA), Inc. under cooperative agreement with the National Science Foundation. We first correct all data frames for pixel non-linearity and persistence (see § A). Although LUCI 2 is cryogenically cooled, we create a master dark frame to account for the low level thermal dark current. Flats taken at the end of the observation were used to obtain a normalized master flat to correct for pixel-to-pixel differences in quantum efficiency, illumination and sensitivity across the detector. We create a bad pixel map from the ratio between low and high count flats. From each science exposure we subtracted the master dark and divided by the normalized flat. The final image registration and coaddition was performed in identical manner as in Georgiev et al. (2008, 2012); Georgiev & Böker (2014) with a self developed IRAF procedure555A wrapper routine for the IRAF procedures daofind, daophot, allstar, geomap, geotran, imcombine.. It matches stars across all exposures, computes geometric distortions, uses the bad pixel map to flag pixels and a pixel image statistic region to compute zero level offsets with respect to a reference exposure. Using pixel statistic region guarantees minimum biases and introduction of noise to objects’ fluxes due to eventual residuals from imperfect background sky subtraction. This way we obtained the final coadded images in each band. We note that the same physical location of the statistic region was adopted for all filters. This is important in order to minimize biases in the final photometric colours.
Thanks to the ARGOS ground layer atmospheric correction, our final combined images achieved an excellent resolution of from the central tip tilt star to at the detector borders (see details in § B). To properly account for the variable PSF across the detector, we used the large number of Galactic foreground stars () to build a spatially variable PSF model in each filter. The model666The empirical PSF was best fit by a single Moffat function, unlike the complex PSF of full AO systems. is used to perform a PSF photometry on all detections above threshold with a PSF model radius of 9 pix . The aperture correction is derived from curve of growth aperture photometry of the PSF stars.
The photometric zeropoints are obtained from the error weighted least squares fit through the difference between the 2MASS and instrumental magnitude against 2MASS magnitude and colour that yield the photometric zeropoints in and of and mag, respectively. We also checked for colour dependence, and found it to be negligible compared to the photometric uncertainties, which is driven by the faintest stars with worst 2MASS photometry and most affected by the background noise. Finally, the magnitudes are corrected for foreground Galactic reddening mag based on mag Schlafly & Finkbeiner (2011) recalibration of the Schlegel et al. (1998) Galactic dust maps and assuming Fitzpatrick (1999) reddening law with .
2.2 Optical HST data reduction and PSF model
We retrieved from the HST archive WFPC 2 () and ACS/WFC () data from Cycle 6 and 11 programs SNAP-6359 (PI: M. Stiavelli) and GO-9395 (PI: M. Carollo), respectively. We used the latest version of the astrodrizzle routine in PyRAF777PyRAF is a product of the Space Telescope Science Institute, which is operated by AURA for NASA. PyRAF is python environment for running IRAF tasks to reprocess the archival data in order to achieve optimal drizzling pixel fraction and final pixel scale. Since the central kpc of NGC 6384 are fully covered by the higher resolution WFPC PC chip (0.05″/pix), we restricted our analysis to only this WFPC 2 detector. Its resolution is nearly identical to that of the ACS WFC (0.04″/pix), therefore we chose to drizzle the WFPC2/PC1 and the ACS images to the same final pixel scale of 0.05″/pixel. We did not go for a smaller pixel scale due to the limited number of only two single exposures. We found that the optimal drizzle pixel fraction to be 0.85. Due to the large extent of the galaxy, we did not allow astrodrizzle to automatically derive the sky value, instead, we provided our own. This value was obtained from the outermost galaxy sections on the ACS detectors. We obtained camera, detector, filter and position specific PSF model with the tinytim software packge (Krist et al., 2011), which we drizzled with the identical astrodrizzle set up for the science images. Similarly to § 2.1, the filter specific Galactic reddening toward NGC 6384 is mag, mag, mag.
3 Analysis
In this section we present the derived photometric properties of all sources in the LUCI 2 field of NGC 6384, including candidate star clusters whose detailed analysis we will present in a forth coming study. We derive the structure of the nuclear star cluster by fitting simultaneously its surroundings ( kpc). We also analyse in identical manner the archival HST/ACS images. Using SED fitting of the NIR-optical best fit model magnitudes we derive luminosity weighted integrated properties of the NSC (e.g. stellar populations mass, age, metallicity, etc.). Similarly, we also compute a 1D projected of the surface mass density, metallicity, stellar population composition (young and old).
3.1 Colour-magnitude diagram of the NGC 6384 field
First, to illustrate the importance of the -band in stellar population analysis in Figure 3 left and right we compare and colour-magnitude diagrams (CMDs), respectively, of all three filter matched sources with PSF photometry. Due to technical and time limitations during the ARGOS commissioning run, the band data did not reach as deep as in the and bands. Although shallower, the colour index is scientifically more informative for the metallicity distribution of the sources, because it largely sensitive to the stellar effective temperature, which in turn is sensitive to metallicity. This can be appreciated by the comparison with Single Stellar Population (SSP) model tracks from Bruzual & Charlot (2003) shown with lines in Figure 3 for three metallicities indicated in the figure legend. Evidently, the dynamical range in the colour and separation between the SSP models of different metallicity is significantly larger than the colour uncertainty, which is important for estimating photometric metallicity.
Second, to demonstrate the achieved high spatial resolution over the entire field with solid (red) circles we show sources with and stellar PSF, i.e. their sharp value888The sharp value is roughly the difference between object and stellar PSF returned by allstar during the PSF photometry. Values close to 0 are stars, large positive bulges of background unresolved galaxies, and negative values are bad/hot pixels or cosmic rays. is within |sharp|=0.15. Open squares indicate sources with and effective radius pc as measured with the ishape code (Larsen, 1999). For high sources Larsen (1999) has shown that reliable size measurements can be performed down to of the PSFFWHM. In our case this spatial “resolution” limit corresponds to pc at the distance to NGC 6384. The size measurement with ishape was performed analogous to Georgiev et al. (2008); Georgiev & Böker (2014). In brief, ishape performs a minimization fitting of the object’s profile with an analytical function convolved with a PSF model tailored to the objects’ position on the detector (cf. § 2.2). We fitted King (1962) profiles with fixed and variable concentration index parameter . The model with the best fit was adopted to be the model for the object’s structural parameters. The analysis of the extended objects (some likely GC candidates) will be presented in a forthcoming study since our aim here is to focus on the NSC and NGC 6384’s large scale analysis. With large open circle we indicate a bright near nuclear source, which we investigate later whether it could be a star cluster or a foreground star.
The integrated magnitude and colour of the NSC is shown with asterisk in Fig. 3 (details on the NSC photometry in § 3.2). Before we model the NSC SED in § 3.3, here we perform a qualitative assessment of the expected NSC mass based on its luminosity. The NSC has a band luminosity of (cf. Fig. 3), which will correspond to a mass of , for a increasing by from low to high metallicity estimated from Bruzual & Charlot (2003) SSP models for an old ( Gyr) stellar population. For a 14 Gyr old SSP, the M/L is roughly 0.9, i.e. it would be a factor of two more massive. For comparison, the Galactic NSC has a mass of the same order ( Schödel et al., 2007, 2014; Feldmeier et al., 2014). We also note that the nuclear star cluster of NGC 6384 shows a fairly red colour compared to the rest of the sources and the SSP tracks in the CMD. Such a colour is, however, typical for a galactic nuclear source, which can be composed by a mixture of old and young stellar populations and more importantly, could be highly reddened. Therefore, to lift various degeneracies in § 3.3 we combine our NIR with the HST optical data to perform a detailed SED analysis of the NSC stellar population composition and reddening.
3.2 Structure and photometry of the NSC and NGC 6384
As it can be seen in Figure 2, NGC 6384 has a boxy bulge. An indication for an X-shape is better seen in the residual band image in Figure 5 b, which is similar to that of the MW (e.g. Dwek et al., 1995; McWilliam & Zoccali, 2010; Ness & Lang, 2016; Abbott et al., 2017) and M 31 (Beaton et al., 2007; Athanassoula & Beaton, 2006), as well as in many other galaxies (e.g. Laurikainen et al., 2011; Erwin & Debattista, 2017). The boxy bulge was also quantified from seeing limited WHT/INGRID -band data by Erwin & Debattista (2013), who expectedly were unable to resolve the nuclear cluster. Georgiev & Böker (2014) analysed the HST/WFPC 2 image of the NSC and fitted its profile with a single King (King, 1962) model using ishape and obtained a half-light radius of pc. Here we re-analyse that data too to account for the other structures that might bias the , especially in the inner . In particular, we focus on the central kpc ( region of NGC 6384, which covers the bar, the boxy bulge and parts of the galaxy disk (Fig. 4 top). We focus only on this area, because it is sufficient for the analysis of the NSC and it is fully covered by the archival HST/WFPC 2 high-resolution (0.05″/pix) PC 1 chip, and the ACS camera drizzled to identical resolution (see § 2.2). For all images, we first perform a simple isophotal fitting with the ellipse task in IRAF/PyRAF, which gives a good idea for various substructures (e.g. dust lanes) when we subtract the fitted isophotal model from the image. We note that the ellipse task does not account for the PSF during the SB extraction, therefore, the magnitude and colour SB-profiles shown here are merely for illustration purposes and should not be considered for quantitative analysis by the reader for radii smaller or comparable to the PSF radius (). We show an example of the residual images from subtracting the ellipse model in Figure 5, for the two filters more and less affected by extinction: the ACS/ (B) and the LUCI 2 , respectively. It is evident that there is a prominent dusty disk/lane swirling around the nuclear zone (), which expectedly is completely transparent in the NIR -band. From these images for all filters we create a pixel mask, which we use in a next iteration with ellipse and later on during the 2 D fitting. In Figure 4 (middle) we present the -band 1 D surafce brightness (SB) profile (line connected open circles), because it is least affected by extinction, has the sharpest PSF of our NIR data and traces the old stellar population that dominates the mass. In the figure we only show the inner pc) to illustrate the high spatial resolution achieved with ARGOS and the resolved nature of the NSC. Clearly, the NSC is well resolved beyond the PSF (dashed, red line in Fig. 4) and it is well represented by a King profile (solid, blue curve), whose parameters we derived as explained below. A second component immediately surrounding the NSC is also clearly seen at pc, which is featured by a small bump in colour shown in the bottom panel of Figure 4. This feature is less prominent in the SB-profile from the HST/ACS image shown in Figure 6, which is likely pointing to the fact that it is an old structure or/and more obscured in the optical. However, we see that a different component is becoming more prominent starting at around , which suggests that it must be composed of younger stellar population. To avoid over interpretation of the colour profiles shown in Figures 4 and 6 we note at this point that due to the fact that ellipse does not account for the PSF, the apparent marginal trend of redder colour (if any) in the core are mainly due to the sharper PSF in the redder filter. We further discuss these components and colour trends in § 4. The point is that in order to extract correctly the properties of the NSC, we need to simultaneously fit for all these components in 2 D and on larger scale in all filters with their respective PSFs.
We model the light profile of the central kpc ( of NGC 6384 and its NSC with imfit131313http://www.mpe.mpg.de/$\sim$erwin/code/imfit/ (Erwin, 2015). This software package performs a 2D profile fitting using the image PSF, a large choice of analytical profiles, iterative fitting minimization techniques (, maximum-likelihood), bootstrapping and MCMC modules for exploring and deriving more reliable values of the fitted parameters and their uncertainties. The high of the NSC, allows us to use a oversampled PSF to fit the central 10 x 10 pixels ( pc). We experimented with a wide range of analytical models available in imfit and found that a five component model described best the fitted area (see Table 1). Namely, the NSC at the very centre was best fit by a modified King (1962) model with concentration, core radius and as fitted parameters (Elson, 1999; Peng et al., 2010). The inner pc required two Sérsic components for the fit around the NSC (cf. Fig. 4), while the large scale boxy bulge and disk were fitted with generalized elliptical Sérsic and Exponential profiles (see Erwin, 2015, and imfit manual). We experimented with other functions, including nuclear ring and disk, pure Gaussian and Core-Sérsic models, however, we achieved worse fits. It was clear from this exploration that the aforementioned components gave the smallest residuals and best fit values compared to choosing others or using less or more fitting functions. To illustrate the need for using more components, in Figure 7 we show the -band residual image fitted either without the inner Sérsic ( pc) or the outer Sérsic ( pc). It is evident that strong residuals arise due to averaged profile resulting from the fit, which highlights the need for having both. Finally, we used the imfit-mcmc module to explore a wider region for the range of the fitted parameters via MCMC. From the posterior distributions we obtained their best values and uncertainties. An example is shown in Appendix C, Figure 18 for the -filter. The results from fitting NGC 6384 inner 3.6 kpc in the filters are illustrated in Figure 8 and the best fit parameter values for all, including ACS and WFPC 2 filters, are given in Table 1. The different blocks in the table indicate the different components. The left column of Figure 8 shows the image in each band (from top to bottom), in the middle is the best fit model and in the right is the residual image (model minus data). The dust lane is completely transparent in the image (Fig. 8 bottom-right), becomes more opaque with decreasing wavelength toward and -bands and is well visible in the optical ACS filters (cf. Fig. 5, left). This dusty, disk-like structure is not drastically obscuring the NSC, as it can be seen in Figure 6 (top), to require severe pixel masking that can hamper the fit of the optical profile (cf Fig. 6 middle). This is further supported by the lack of strong colour gradient (cf Fig. 6 bottom). The colour and its gradient as well as the structure of the various components given in Table 1 is discussed in § 4.
3.3 SED analysis of the central kiloparsec
Here we analyse the SED of NGC 6384 of the overlapping region between our NIR images and the archival HST optical data. To closely account for the extended nature and evidently varying structure of the NSC as a function of wavelength, we use its six filter model magnitudes, which unlike fixed aperture magnitudes, should not only account for the varying PSF with wavelength, the varying structure of the cluster, but also minimize contamination from flux coming from the other underlying galactic components. We also model the SED of the SB profile of the inner kiloparsec of NGC 6384 in the six filters, which should well represent its stellar population properties on scales as PSF effects are not taken into account by the Ellipse extraction (see § 3.2).
Our SED fitting uses a mixture of old and young stellar populations, including nebular emission, fitting for dust extinction and testing for a weak AGN component. The latter is motivated by the fact that NGC 6384 is similar by mass to the MW and M 31 and its NSC could similarly harbour a MBH of 1-10 million solar mass, which might be more active. Thus, a certain fraction of the flux in the core might be coming from a weak AGN component. NGC 6384 is also classified as a transitional type (T2) LINER (Ho et al., 1997), which further support the need to probe for an AGN. To test for all these components contributing to the SED, we use the CIGALE141414We used version 0.12.1 cigale.lam.fr code (Boquien et al., 2018; Noll et al., 2009; Roehlly et al., 2014; Burgarella et al., 2005). It has been developed to fit the SED of galaxies using various models of the SFH (double exponential, delayed, periodic and user specified), a choice of SSP model (Bruzual & Charlot, 2003; Maraston, 2005) with a given IMF, adding dust attenuation (Calzetti et al., 1994, 2000, single or double power law) and possible nebular, AGN (Fritz et al., 2006; Dale et al., 2014) and dust emission (Casey, 2012; Dale et al., 2014; Draine & Li, 2007; Draine et al., 2014). We first fitted with CIGALE the SED of the NSC using the six band model magnitudes given in Table 1. We assumed a double exponential SFH to test for the presence of more than one stellar population. Although NSC may experience a prolonged SFH with many episodic bursts of star formation, typically, they host two main stellar populations which contribute, if not to all, to the majority of their current mass and light, i.e. an old (metal-poorer) and a younger and more metal-rich Walcher et al. (2006); Rossa et al. (2006); Seth et al. (2006); Kacharov et al. (2018). Under this assumption of two main bursts of star formation, we modified the bc03 module of CIGALE to allow for the old and young population to be constructed from SSPs with different metallicity.
Allowing for a wide range of possible parameter values for all aforementioned SED components, resulted in the synthesis of 403200 SEDs. CIGALE analyses all these models compared to the observed SED in a Bayesian framework, i.e. calculating the probability of each model given the data, and constructing posterior distributions for each model parameter from which their best value and uncertainties are obtained (details in Burgarella et al., 2005; Boquien et al., 2018). We show the best fit SED of the NSC in Figure 9, where all fitted components are given in the figure legend. The main properties from the six band optical-NIR SED fitting are summarised in Table 2. We did not include the AGN fraction of the fit into the table, as its contribution (if any) is very small, (), and a geometry of a minimum to maximum radii of the dusty torus of with an opening angle and an angle between the AGN and the line of sight of . We further comment on this in § 4.
As a consistency check, instead of using the NSC model magnitudes, we used a fixed aperture NSC magnitudes with a diameter of 0.35″. This is large enough to avoid PSF effects, contain light mostly from the NSC whose diameter is smaller than that, as well as it is small enough to minimize contaminating flux from the underlying structures. The result from fitting the NSC SED using the aperture magnitudes is that the NSC age of both populations remained unchanged (1% lower); the NSC total mass decreased by , largely driven by the lower mass of the old population (by 52%) due to the inclusion of contaminating flux from the likely younger underlying disk stellar population that lower the . Respectively, the metallicity and attenuation values also lowered by up to . To conclude, the stellar population values for both populations obtained from fixed aperture are within the measurement uncertainties given in Table 2, however, as expected, there is a systematic bias due to the contaminating flux from the underlying disk/bulge components in direction of their respective stellar population properties. This result will hold true only for aperture magnitudes obtained from high spatial resolution observations allowing the extraction of NSC photometry from an aperture big enough to avoid PSF effects across different filters, but small enough to minimize contamination. Obviously, the latter will also strongly depend on the structure and profile of the underlying components.
To obtain a radial map of the stellar population properties, we also fit the SED at each radial location along the SB profile of all filters extracted with ellipse. A summary from this fitting we show in Figure 10 of the one dimensional projection along the semi-major axis of the main properties of the two stellar populations: stellar surface mass density, metallicity, and fraction of the young stellar population, from top to bottom, respectively. For comparison, with an asterisk in Figure 10 we also show the integrated values of the NSC from Table 2, at the mean radial location of its effective radius from all filters of 10 pc. All other relevant parameters (, age, e-folding time of the two stellar population) from the SED fitting did not show significant (or interesting) radial gradients. We note that although we extracted the radial SB beyond the 10% of the PSFFWHM, the very central 2-3 radial points () in Figure 10 might not be fully representative and still suffer from differential PSF effects between the HST and the LUCI+ARGOS images.
4 Discussion
Here we discuss our main findings on the properties of the nuclear star cluster of NGC 6384, a Milky Way like galaxy. Enabled by the sharp (0.25″) and stable PSF provided by ARGOS across the LUCI 2 field of view (§ B) we analyse the central kpc ( overlap region between our NIR LBT and archival optical HST data. The high spatial resolution in the NIR is crucial for breaking age-metallicity-reddening degeneracies when combined with the optical HST data.
4.1 The NSC embedded in nuclear (disk) components
The 2D image fitting of the high spatial resolution NIR LUCI 2 and optical HST images allowed us to uncover the presence of two inner Sersić components (§ 3.2, Fig. 4) with effective radii of and 400 pc in which the NSC with pc is embedded. We also successfully fitted for the large scale boxy bulge ( kpc) and disk ( kpc). The properties of these multiple components are given in Table 1. The two inner Sersić profiles have low Sersic indices ( and ), which suggests that these might be nuclear disks. Similar central disks are observed in the Milky Way as well as in other galaxies. For example, stellar line-of-sight velocity distributions of stars in the MW reveals a nuclear disk of a truncation radius of 150 pc (e.g. Schönrich et al., 2015). In other galaxies, observations with sufficiently high spatial resolution shows that their central zones also contain nuclear disks (e.g. Balcells et al., 2003; Balcells et al., 2007; Seth et al., 2006; Ganda et al., 2009; Méndez-Abreu et al., 2017). Their formation, in the case of the Milky Way, is reproduced by N-body+smooth particle hydrodynamics simulations (Debattista et al., 2015, 2018), which form a nuclear disk (or ring) during bar-induced gas inflows (Cole et al., 2014). In other galaxies, similar process of star formation in nuclear rings is suggested to form nuclear disks (e.g. Kormendy & Kennicutt, 2004). This implies that the (few) hundred parsecs components around the NSC of NGC 6384 are common in galaxies. However, the fact that we observe two in NGC 6384 might hint at specific events in the formation past of its central regions and their eventual timing. For example, star cluster merger simulations do form nuclear disks of similar scales, which are also suggested to be useful for timing past merger events (e.g. Portaluri et al., 2013; Sarzi et al., 2016; Arca-Sedda & Capuzzo-Dolcetta, 2016, 2017).
4.2 NSC effective radius varying with wavelength
We observe that the effective radius of NGC 6384 NSC is larger at longer wavelengths. This is illustrated in Figure 11, alongside with the other fitted components, except for the large-scale exponential disk, which extent is well beyond our fitting area and thus might not be fully representative. Figure 11 shows the ratio between the effective radius in the -band, as a base, and that in the other filters. Especially for the NSC, we see that it becomes significantly more compact in (B-band) which suggests for a more centrally concentrated younger stellar population, as observed also in other studies (Seth et al., 2008; Georgiev & Böker, 2014; Carson et al., 2015). On average, the 100 pc bulge size is fairly invariant, while the 400 pc bulge size is increasing with decreasing wavelength peaking in . This filter also contains the line, which could be driving its very large size. Its very compact size in supports the presence of more centrally concentrated young population. The NGC 6384 boxy-bulge also shows steadily decreasing effective radius with decreasing wavelength. This implies that it is mainly composed of old stellar population. As the main focus of this paper is on the NSC of NGC 6384 would like to not extend our discussion to the bulge/pseudo-bulge topic.
The structural reanalysis of the HST WFPC 2 image, which we presented in Georgiev & Böker (2014), showed that not accounting for the inner components led to an overestimate of the NSC effective radius by and its magnitude by mag. Overall, this might not represent a drastic bias (roughly 0.4 dex biased mass estimate), however, the ability to resolve and model all components in the central regions is essential for the correct mass and dynamical modelling of the NSC and its surroundings when future spectroscopy is included.
4.3 NSC stellar population from the SED analysis
Using the six band photometry, we perform in § 3.3 an SED fitting to the model magnitudes of the NSC (Fig. 9) as well as the to the SB-profile of NGC 6384 (§ 10). We find that the NIR and optical data helped to leverage the age-metallicity-extinction degeneracies and derive the effective NSC stellar population properties (cf. Table 2). As typically observed in NSCs most of the mass/light is contained in two populations of young and old age, the latter by mass (e.g. Seth et al., 2006), we find for the NGC 6384 NSC an old component with an age of Gyr and a stellar mass of . The a young component has an age of Myr, which is of the mass of the old population. The e-folding time for the old and young population is 2.3 and 0.14 Gyr, respectively. The old and young stellar populations have slightly sub- and super-solar metallicity, which is in line with spectroscopic metallicity measurements of other extragalactic NSCs. However, because our SED fitting can report only for the total metal content (Z/H), therefore the metallicity values in Table 1 are strong upper limits to the -abundance.
The radial map of the NSC surface mass density, age, metalicity and reddening (cf. Fig 10) follow trends consistent with the afore mentioned breakdown of the stellar population of the NSC. The extinction value of mag, i.e. mag is expectedly, much lower than that toward the Galactic center, due to the lower inclination of NGC 6384 nucleus, compared to the line of sight toward the MW NSC. The reddening values found here are in agreement with the range found for the nuclear regions of other galaxies from optical-NIR photometric analysis (e.g. Ganda et al., 2009; Carson et al., 2015).
4.4 Insufficient evidence for AGN activity
The SED fitting resulted in negligible, % fraction of the light ( erg/s), to be coming from a weak AGN activity. This would be the upper limit on the possible AGN contribution to the NSC SED. We have only six SED points, which still leaves the possibility of a weak AGN component, however, its geometry has to have a more extreme configuration than the one found here (cf § 3.3). Any present degeneracies should be reflected in the uncertainty ranges obtained from the posteriors by CIGALE. Also, if the AGN fraction is higher, instead of a contribution from younger stellar population, this would lead to a steeper SED continuum shape in the NIR (redder colour), and will require lower reddening. However, this will be inconsistent with the overall optical-NIR SED shape, as investigated observationally by SED studies at pc scales to identify AGN contributions (e.g. Prieto et al., 2010). This highlights the power of combining optical and NIR that covers one of the most important wavelength ranges for minimising various of the afore mentioned degeneracies. Therefore, the current data can not support an active MBH in the NSC of NGC 6384. This, however, does not exclude the presence of a MBH, because it might not be in an active state, just like the one in the MW and M 31. A follow up high spatial and spectral resolution NIR spectroscopy is needed to measure the NSC and its central velocity dispersion to assess the presence of a MBH. The lack of clear AGN component in our SED fitting and the indications for very centrally concentrated young stellar population as discussed earlier (cf. Fig. 11) suggests that the LINER emission of the nucleus of NGC 6384 measured in low-spatial resolution ( spectra) is likely due to the young star formation activity in its central regions rather than an AGN activity.
4.5 Implications for the formation of NGC 6384 NSC
Finally, the evidences from our measurements of the NGC 6384 NSC having an effective radius as extended as pc and varying with wavelength, two circum nuclear Sersić components of 100 and 400 pc scales and low indices consistent with being nuclear disks, the non negligible by mass young stellar component and the clear detection of disk-like dust lane spiralling into the cluster shares features of the two main scenarios of NSC formation: cluster merging, which leads to larger effective radii and possible formation of nuclear disks (see § 4.1) repetitive gas accretion which leads to the presence of young stellar population (see § 4.3). This finding for NGC 6384 NSC adds to the growing body of evidence in the literature that supports not a single formation channel during the build up of galactic nuclei, but a complex and individual mixture of both. A larger, representative sample of galactic nuclei analysed in such manner can allow for a more systematic and statistically meaningful conclusions about the build up of galactic nuclei depending on galaxy mass, type, environment, and whether the nucleus is co-inhabited by a MBH.
5 Summary
Here we presented the analysis of the first science data taken during the commissioning of the ARGOS system in 2015-05-01 and 02. It provides adaptive optics correction of the ground atmospheric layer at the LBT. The target for this commissioning run, NGC 6384 was mainly selected because it has a suitable on-axis AO reference star and a large number of MW stars to measure system performance. The fact that this galaxy was at a large distance of 20.7 Mpc allowed us to also demonstrate that star cluster science can be conducted successfully, where ground based seeing limited observations lack the needed spatial resolution to study such compact stellar systems.
For the proper analysis of the NIR images with the LUCI 2 camera, which suffers from persistence and non-linearity effects, we created pixel-to-pixel maps that we used to preprocess and correct the raw images (details in § A). Following standard data reduction steps (§ 2.1) and calibration, we were able to achieve excellent image registration resulting in a sharp and stable PSF of 0.25″ over the entire LUCI 2 field of view. The PSF size only increases by out to the detector edges (§ B). This superb spatial resolution enables to resolve the star cluster candidates and bring down contamination from background galaxies to a minimum. In a forthcoming paper we will present the detailed analysis of the star cluster system of NGC 6384 (cf § 3.1), while in this paper we mainly focus our analysis to the central kpc ( overlap region between our NIR LBT and archival optical HST data. The high spatial NIR imaging is crucial for breaking age-metallicity-reddening degeneracies when combined with the optical HST data. We reprocessed the HST/ACS and WFPC 2 data to the same plate scale resolution of 0.05″/pix (cf. § 2.2).
We performed a 2D MCMC image fitting with imfit (Erwin, 2015) by using a PSF model built from stars in the image for both the LUCI 2 and HST images, as well as a TinyTim (Krist et al., 2011) PSF model drizzled in identical manner as the science images. We also used a pixel mask of the central obscuring disk-like dust lane (§ 3.2, Fig. 5).
Our main findings can be summarizes as:
We uncover the presence of two inner Sersić (low index, disk?) components (§ 3.2, Fig. 4 and § 4.1) with effective radii of and 400 pc in which the NSC with pc is embedded. NGC 6384 has a large scale boxy bulge ( kpc) and disk ( kpc).
The effective radius of NGC 6384 NSC increases with wavelength (cf. Fig. 11, which suggests for a more centrally concentrated younger stellar population (see § 4.2).
The NSC effective radius is smaller in size by and magnitude/mass by mag/dex compared to Georgiev & Böker (2014) due to the unaccounted inner Sersić components. This highlights the need to resolve and model well the central regions for the correct mass and dynamical modelling of the NSC when follow up spectroscopy is included.
The NSC SED is described by an old population ( Gyr) with a stellar mass of , and a young population of Myr, which is of its mass. Both populations have slightly sub- and super-solar metallicity, respectively (cf. Table 2,§ 3.3 and § 4.3).
We obtained the SED radial surface mass density, age, metalicity and reddening (cf. Fig 10, § 3.3, § 4.3)
We find negligible, % fraction of the light, to be coming from a weak AGN (§ 4.4). If a MBH in the NSC of NGC 6384 is present, then it might not be accreting, similarly to those in the MW and M 31.
All structural and stellar population evidences suggest that the NGC 6384 NSC for a formation contributed from the two main scenarios of NSC formation: cluster merging and repetitive gas accretion.
Acknowledgements
We thank the anonymous referee for their constructive and useful comments that helped to improve parts of the discussion in the paper. Based on observations collected at the Large Binocular Telescope (LBT). The LBT is an international collaboration among institutions in the United States, Italy and Germany. LBT Corporation partners are: The University of Arizona on be- half of the Arizona Board of Regents; Istituto Nazionale di Astrofisica, Italy; LBT Beteiligungsgesellschaft, Germany, representing the Max-Planck Society, The Leibniz Institute for Astrophysics Potsdam, and Heidelberg University; The Ohio State University, and The Research Corporation, on behalf of The University of Notre Dame, University of Min- nesota and University of Virginia.
Appendix A LUCI 2 linearity and persistence maps
The first linearity and persistence analysis of the LUCI 2 N 3.75 detector was performed by David Thompson (at LBTO) that is available at the LUCI 2 webpage151515http://scienceops.lbto.org/sciops_cookbook/luci2-vs-luci1/#L2vL1_Nonlinearity. This linearity correction needs to be applied to the counts of all raw data prior any data reduction. The coefficients for this correction are estimated for the detector average pixel values, which can be a good overall correction. However, often (if not exclusively), science measurements are made on a small pixel area of the detector, which could (significantly) deviate from the detector average linearity coefficients and compromise scientific flux and position measurements. Therefore, we performed a new pixel-by-pixel linearity, and not quantified so far, persistence analysis of the LUCI 2 N 3.75 camera. For that we used linearity data taken and kindly provided to us by David Thompson. The data consists of a sequence of images with increasing exposure time until detector saturation is reached. Two consecutive frames are taken at the same exposure time to allow to analyse detector persistence. For the analysis, we extract the count value of every pixel and exposure and fit curves to the 1st and 2nd exposures as a function exposure time.
We confirm results from earlier analysis that departures from linearity occur at around 9000 counts. Therefore, to set the linearity reference line we perform a least squares fit of a linear form to the count values of the 1st exposure smaller than 9000 counts. The ratio between the curves of the 1st exposure and that of the linear region provides the linearity correction relation. The ratio between the fitted curves for the 1st and 2nd exposure sets as a function of the count rate provides the relation for the persistence correction. Each of these fits and ratios, for the persistence and linearity, are shown in Figure 12. To demonstrate the
ranging behaviour of different pixels, in the figure we show the fits for two pixels at different position on the detector. Each pixel is represented by a four panel figure showing the fits and linearity and persistence correction equations and their coefficients, as described in the figure legend. In the bottom-right panel we show the pixel noise statistics and the fit through it as a function of the duration time of the entire calibration sequence. The latter plot shows that there are no strong trends as a function of time, which might be expected to accumulate due to the persistence.
The zero point, linear and quadratic coefficients from the linearity and persistence fits, performed to each pixel of the detector, are stored as six fits image maps. An example of one such map is presented in Figure 13, which shows the map of the coefficient of the linear term. With this map one can appreciate the large and small scale variation of this coefficient. A number of detector features are visible such as groups of bad, hot or cold pixels and a horizontal stripes pattern from the detector electronics which repeats every 64th column. To appreciate the pixel-to-pixel variation in Figure 14 we show cuts through the zero point and linear term maps at two different x-pixel locations, 1035 and 1801. As already visible in Fig. 13, the large and small scale trend and noise, is well visible in Fig. 14. Positive and negative spikes show hot and cold or bad pixels.
Appendix B ARGOS PSF performance
To correct the ground layer turbulence, ARGOS uses a constellation of three lasers per telescope evenly situated on a circle with radius of 2’, which also corrects for the strong anisoplanatism as a function of distance from the natural guide star (NGS). For this particular first science data observation, the NGS was located at the image center, therefore, it is expected that the effects on the image PSF (elongation, orientation) should be symmetric. We use the measurements from our PSF modelling and photometry described in detail in § 3.1. The field of NGC 6384 contains a large number ( of foreground Galactic stars. To analyse the angular and radial variation of the ARGOS corrected image PSF, in Figure 15 we show the FWHM of the PSF (PSFFWHM) as a function of the position angle (PA) and the observed filters in the top row and bottom-right panels. With different symbols and colours we show the three different radial bins, as indicated in the figure legend. The bottom left panel of Fig. 15 illustrates the direction of the position angle shown in the other panels and the spatial position of the high- sources on the detector. We fitted the FWHM of the sources within 1’ and between 1’ and 2’ distance from the NGS, which are shown as labels for the respective filter in the different panels. Due to the relatively large LUCI 2 field of view for adaptive optics correction, it is expected that some anisoplanatism could still be present as a function of the distance from the NGS to the LGSs, which are situated on a circle of radius 2’. We see from Figure 15 that the FWHM fits to sources within 1’ and between 1’ and 2’ distance from the NGS differ by up to . Sources outside the 2’ radius in the image corners are also seen to be slightly more extended (often with the highest FWHM value), however, due to their relatively low number, we can not fully quantify the FWHM degradation outside the LGSs circle from this data alone. Overall, for this first commissioning science data and sky quality during the observations, the achieved FWHM correction provided by ARGOS in the NIR is around 0.25”-0.3”, which is also very stable across the detector to within .
We examine the elongation and orientation of the PSFFWHM in Figure 16. The vectors in the figure show the direction of orientation of the PSF for high- sources, which are also colour coded according to their ellipticity. Measured PSF orientation makes sense only for sources with ellipticity larger than about 0.05 (axis ratio ). We can indeed see that most of the sources toward the detector corners, more apparent in -band (Fig. 16 left panel), show more radially aligned orientation.
The absolute value of the corrected PSFFWHM is also a function of the natural seeing and sky conditions (e.g. passing high altitude clouds, variable direction and strength of wind), which obviously can change within the night or from one night to the other. In addition, for such a first commissioning run the ARGOS system performance is not yet optimal and improvement was in progress. To analyse these temporal variations of the image FWHM in Figure 17 we show the image FWHM for the three filters ( top to bottom) as a function of the time when an exposure was taken. We have limited here our analysis only to the datasets which were (partly) used to select the sharpest images for the scientific analysis of the data as described in the main text of this paper. Therefore, we are not showing here the FWHM variation during various phases of the commissioning testing, which is presented in a dedicated ARGOS commissioning paper by Rabien et al. (2018). As it can be seen, the best and most stable image quality (FWHM) was achieved on the night of 2015-05-01 in the -filter (Fig. 17 middle panel). The following night of 2015-05-02 is showing a larger FWHM variation, but improving as a function of time (compare Fig. 17 top and bottom panels). This large scale FWHM improvement (besides its absolute value due to the difference in the and PSFFWHM) is attributed to the improving sky conditions (decreasing wind, improving natural seeing). The variations on small temporal scales are due to broken laser loops, which are either caused by commissioning tests or often by a system pause due to satellite or an airplane passing overhead. The latter two requires lasers shut down and opening the loops. Images taken during that phase often show the natural seeing value in the respective filter. This can be seen in the top panel of Figure 17 in the -band, where loops were broken/paused about three times at around 8.15, 10.2 and 11.4 UT time. Apparently, the night quality was improving and the open loops FWHM value is decreasing. There were few filter changes between and at between 11.5 and 11.62 UT time, but most of the -band observations (Fig. 17 bottom) followed the -band data. The combination between improving sky quality and sharper PSF in the provided a nearly diffraction limited sampling of the PSF of pix, as seen in Figure 17 bottom panel and from the fits in Figure 15 bottom-right panel.
Overall, in this section we showed that ARGOS provides LBT with spatially and temporary stable PSFFWHM in the NIR over field of view, which is unique for a ground based observatory.
Appendix C MCMC exploration of model parameters and their uncertainties
As described in § 3.2, we tested a wide variety, and number, of fitting functions that best describe the nuclear cluster and inner regions of NGC 6384. A quick analysis was performed with minimisation, while the detailed parameter and their uncertainty exploration we conducted with the imfit MCMC module. Here we show as an example of this analysis for the -band and how we obtained the structural parameters and uncertainties for the NSC and NGC 6384 inner kpc (. Figure 18 shows the corner plot created with the corner module (Foreman-Mackey, 2016) of the Astropy channel (Astropy Collaboration et al., 2013; The Astropy Collaboration et al., 2018). We explored in total 35 model parameters shared between the five functions - a modified King (Elson, 1999; Peng et al., 2010) which for reduces to the original King (1962); two Sérsic and two generalized elliptical 2D Sérsic and Exponential profiles. Their functional forms are given in the imfit manual161616http://www.mpe.mpg.de/erwin/resources/imfit/imfit_howto.pdf. As it can be seen from Figure 18, we obtained good convergence and uncertainty estimates for all parameters.
Appendix D related to King model parameters
For the original King (1962) model there is no simple analytical connection between the effective radius containing half the mass/light in projection and the parameters of the King profile (core radius, , concentration, and ). Here, we derive this connection through direct integration of King (1962) profiles and fitting the resulting values by a polynomial fit. The coefficients of the polynomials have been determined through minimization. Our fit between was derived for values of between and between . This resulted in the following fit:
[TABLE]
where the coefficients are given by:
[TABLE]
We used this relation to calculate the nuclear star cluster given in Table 1. These relations are good to within a percent. Often, fitting can report the measured FWHM, therefore, similarly, we also obtained the relation between the effective radius and the FWHM as:
[TABLE]
with the following values for the coefficients :
[TABLE]
An illustration of these relations we show in Figure 19 for few fixed concentration indexes. As it can be seen from the figure, the achieved precision is much less than 1%.
The reference list from the paper itself. Each links out to its DOI / PubMed record.
- 1Abbott et al. (2017) Abbott C. G., Valluri M., Shen J., Debattista V. P., 2017, MNRAS , 470, 1526 · doi ↗
- 2Antonini et al. (2012) Antonini F., Capuzzo-Dolcetta R., Mastrobuono-Battisti A., Merritt D., 2012, Ap J , 750, 111 · doi ↗
- 3Antonini et al. (2015) Antonini F., Barausse E., Silk J., 2015, Ap J , 806, L 8 · doi ↗
- 4Arca-Sedda & Capuzzo-Dolcetta (2016) Arca-Sedda M., Capuzzo-Dolcetta R., 2016, ar Xiv e-prints, p. ar Xiv:1601.04861
- 5Arca-Sedda & Capuzzo-Dolcetta (2017) Arca-Sedda M., Capuzzo-Dolcetta R., 2017, MNRAS , 471, 478 · doi ↗
- 6Astropy Collaboration et al. (2013) Astropy Collaboration et al., 2013, A&A , 558, A 33 · doi ↗
- 7Athanassoula & Beaton (2006) Athanassoula E., Beaton R. L., 2006, MNRAS , 370, 1499 · doi ↗
- 8Balcells et al. (2003) Balcells M., Graham A. W., Domínguez-Palmero L., Peletier R. F., 2003, Ap J , 582, L 79 · doi ↗