Model-independent observation of exotic contributions to $B^0\to J/\psi K^+\pi^-$ decays
LHCb collaboration: R. Aaij, C. Abell\'an Beteta, B. Adeva, M., Adinolfi, C.A. Aidala, Z. Ajaltouni, S. Akar, P. Albicocco, J. Albrecht, F., Alessio, M. Alexander, A. Alfonso Albero, G. Alkhazov, P. Alvarez Cartelle,, A.A. Alves Jr, S. Amato, S. Amerio, Y. Amhis, L. An

TL;DR
This study performs a model-independent angular analysis of B0 decays to J/psi, K+, and pi-, revealing significant exotic contributions beyond known K* resonances, with potential new structures near 4200 and 4600 MeV.
Contribution
It introduces a minimal-assumption, model-independent method to detect exotic contributions in B0 decay angular distributions, challenging the K* resonance-only hypothesis.
Findings
Rejection of the K* resonance-only hypothesis with high significance.
Evidence of exotic contributions in B0 decay channels.
Identification of potential new structures near 4200 and 4600 MeV.
Abstract
An angular analysis of decays is performed, using proton-proton collision data corresponding to an integrated luminosity of 3~ collected with the LHCb detector. The spectrum is divided into fine bins. In each bin, the hypothesis that the three-dimensional angular distribution can be described by structures induced only by resonances is examined, making minimal assumptions about the system. The data reject the -only hypothesis with a large significance, implying the observation of exotic contributions in a model-independent fashion. Inspection of the versus plane suggests structures near ~MeV and 4600~MeV.
Click any figure to enlarge with its caption.
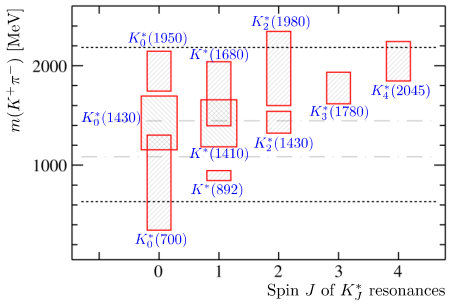 Figure 1
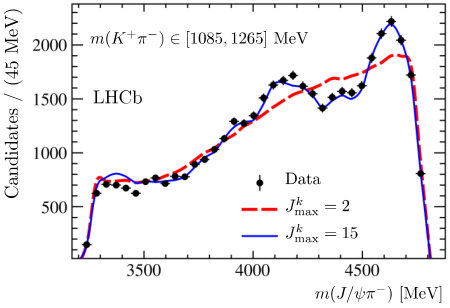 Figure 2
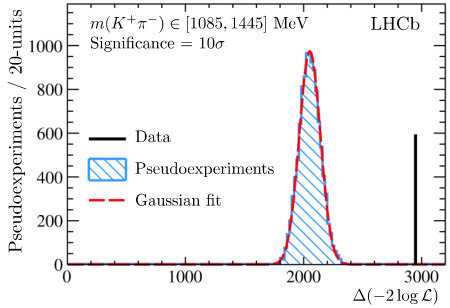 Figure 3
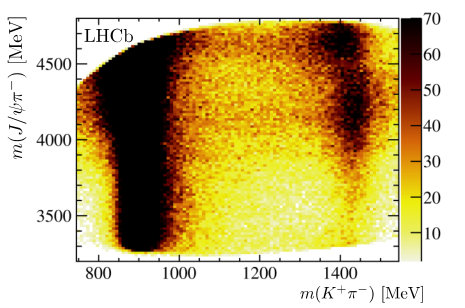 Figure 4
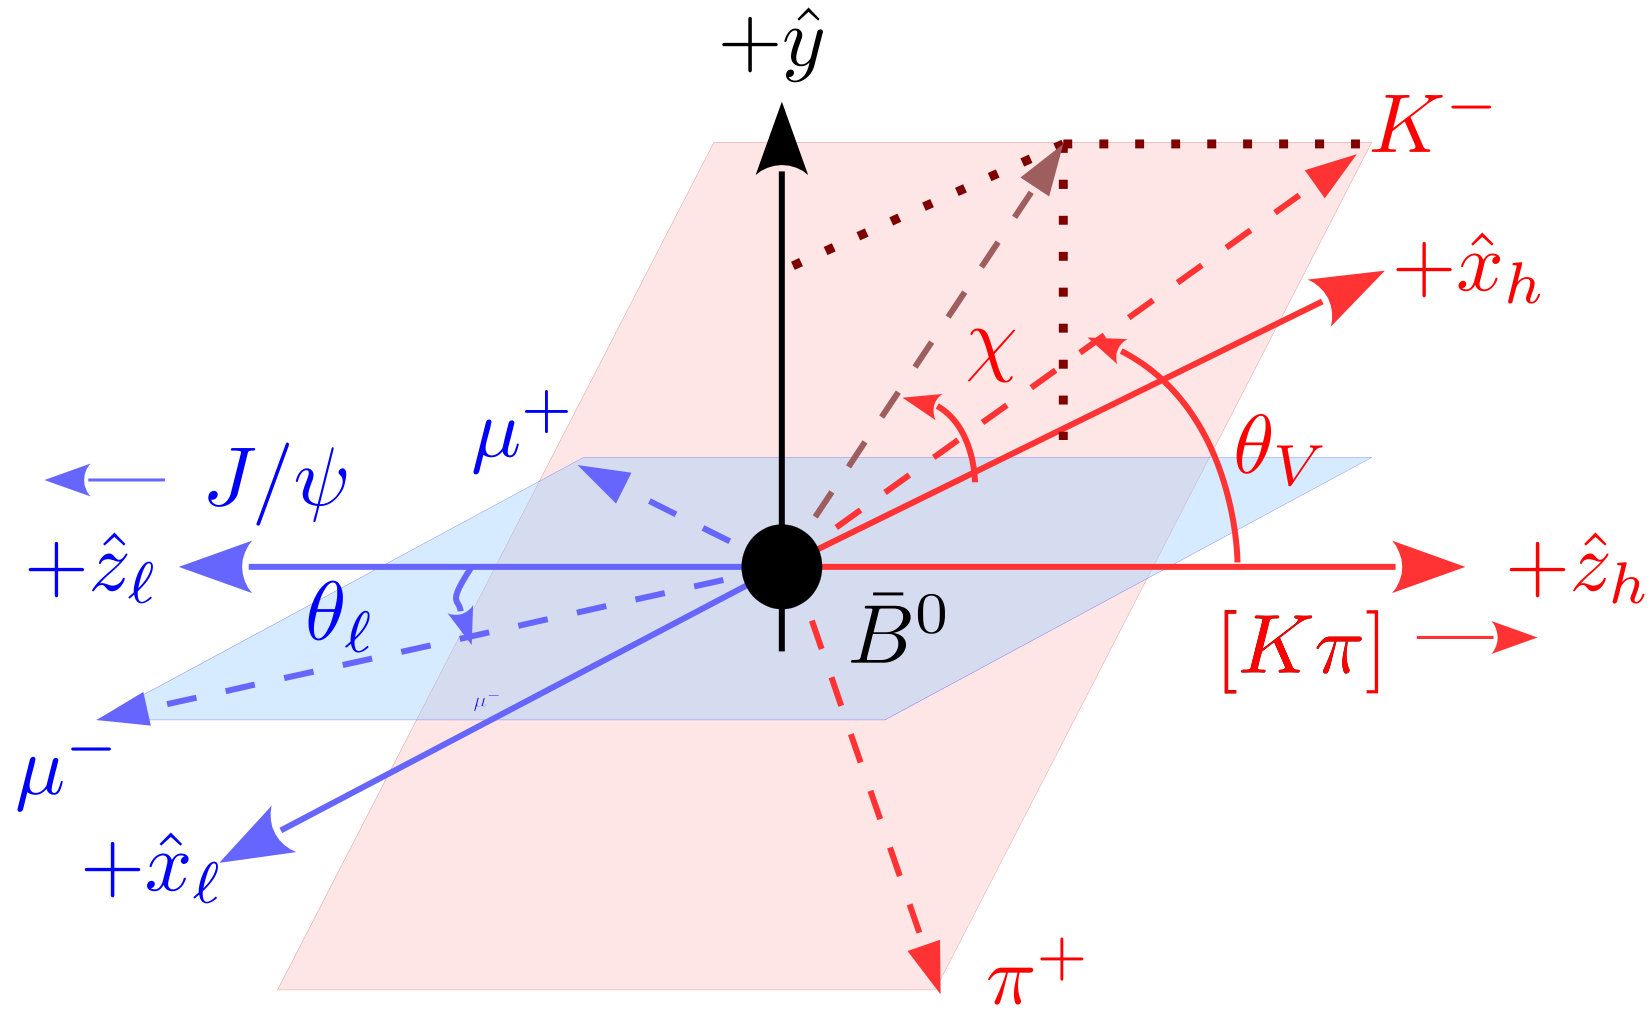 Figure 5
 Figure 5
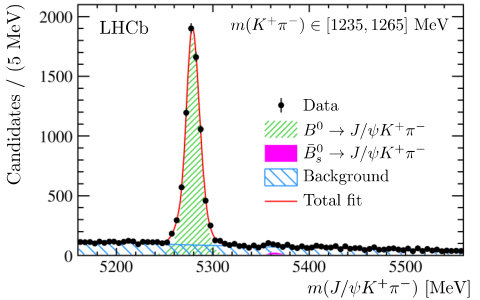 Figure 6
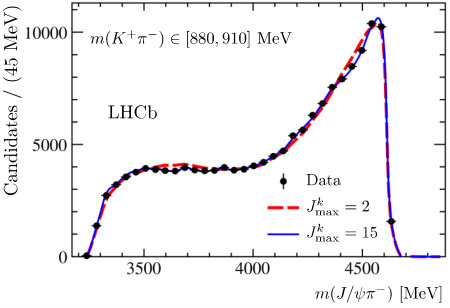 Figure 7
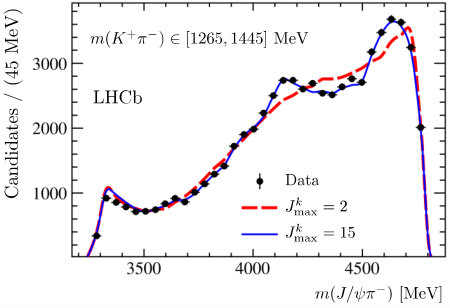 Figure 8
| 1 | ||
| 2 | ||
| 3 | ( + ) - ( + ) + + + | |
| 4 | ||
| 5 | ||
| 6 | ||
| 7 | ||
| 8 | ||
| 9 | ||
| 10 | ||
| 11 | ||
| 12 | ||
| 13 | ||
| 14 | ||
| 15 | ||
| 16 | ||
| 17 | ||
| 18 | ||
| 19 | ||
| 20 | ||
| 21 | ||
| 22 | ||
| 23 | ||
| 24 | ||
| 25 | ||
| 26 | ||
| 27 | ||
| 28 |
Peer Reviews
No public reviews on file for this paper yet. If you reviewed it on a platform where reviews are public (OpenReview, ICLR, NeurIPS, ICML), you can paste yours below so the community can read it here.
Videos
No videos yet. Explain this paper in a talk, walkthrough, or lecture? Add one.
EUROPEAN ORGANIZATION FOR NUCLEAR RESEARCH (CERN)
CERN-EP-2018-330
LHCb-PAPER-2018-043
**Model-independent observation of exotic contributions to **decays
LHCb collaboration†††Authors are listed at the end of this paper.
An angular analysis of decays is performed, using proton-proton collision data corresponding to an integrated luminosity of 3 collected with the LHCb detector. The spectrum is divided into fine bins. In each bin, the hypothesis that the three-dimensional angular distribution can be described by structures induced only by resonances is examined, making minimal assumptions about the system. The data reject the -only hypothesis with a large significance, implying the observation of exotic contributions in a model-independent fashion. Inspection of the versus plane suggests structures near MeV and 4600 MeV.
Published in Phys. Rev. Lett. 122, 152002 (2019)
© 2024 CERN for the benefit of the LHCb collaboration. CC-BY-4.0 licence.
In the Standard Model, the quark model allows for hadrons comprising any number of valence quarks, as long as they are colour-singlet states. Yet, after decades of searches, the reason why the vast majority of hadrons are built out of only quark-antiquark (meson) or three-quark (baryon) combinations remains a mystery. The best known exception is the resonance with spin-parity and width MeV [1, 2],111Natural units with are used throughout the document. which has minimal quark content , and is therefore manifestly exotic, i.e., has components that are neither quark-antiquark or three-quark combinations. The only confirmed decay of the state is via , as seen in decays [1].222The inclusion of charge-conjugate decay modes is implied throughout. The corresponding decay rate is suppressed by at least a factor of ten [3]. The authors of Ref. [4] surmise that in a dynamical diquark picture, this is because of a larger overlap of the radial wavefunction with the excited state than with the ground state . For the channel, the Belle collaboration [3] has reported the observation of a new exotic resonance decaying to , that might correspond to the structure in seen in Ref. [1] at around the same mass.
A generic concern in searches for broad exotic states like the resonance is disentangling contributions from non-exotic components. For decays,333Here denotes the ground state and denotes the excited state . the latter comprise different resonances with spin , that decay to . Figure 1 shows the spectrum, which has multiple, overlapping, and poorly measured states. The bulk of the measurements come from the LASS scattering experiment [5]. In particular, the decay is known to be dominated by resonances, with an exotic fit fraction of only [3], compared to a contribution from the for [6]. This smaller exotic fit fraction for the case makes it pertinent to study the evidence of exotic contributions in a manner independent of the dominant but poorly understood spectrum.
The BaBar collaboration [8] has performed a model-independent analysis of decays making minimal assumptions about the spectrum, using two-dimensional (2D) moments in the variables and the helicity angle, . The key feature of this approach is that no information on the exact content of the states, including their masses, widths and -dependent lineshapes, is required. An amplitude analysis would require the accurate description of the lineshapes which depend on the underlying production dynamics. The model-independent procedure bypasses these problems, requiring only knowledge of the highest spin, , among all the contributing states, for a given bin. Within uncertainties, the spectrum in the BaBar data was found to be adequately described using just states, without the need for exotic contributions.
In this Letter, a four-dimensional (4D) angular analysis of decays with is reported, employing the Run 1 LHCb dataset. The data sample corresponds to a signal yield approximately and times larger than those of the corresponding BaBar [8] and Belle [6] analyses, respectively. The larger sample size allows analysis of the differential rate as a function of the four variables, , , and , that fully describe the decay topology. The lepton helicity angle, , and the azimuthal angle, , between the and decay planes, were integrated over in the BaBar 2D analysis [8]. The present 4D analysis therefore benefits from a significantly better sensitivity to exotic components than the previous 2D analysis.
The LHCb detector is a single-arm forward spectrometer covering the pseudorapidity range and is described in detail in Ref. [9]. Samples of simulated events are used to obtain the detector efficiency and optimise the selection. The collisions are generated using Pythia [10, *Sjostrand:2007gs] with a specific LHCb configuration [12]. Decays of hadronic particles are described by EvtGen [13], in which final-state radiation is generated using Photos [14]. Dedicated control samples are employed to calibrate the simulation for agreement with the data.
The selection procedure is the same as in Refs. [15, 16] for the rare decay , with the additional requirement that the mass is constrained to the known mass via a kinematic fit [17]. The data sample is divided into 35 fine bins in such that the -dependence can be neglected inside a given bin, and each subsample is processed independently. The bin-widths vary depending on the data sample size in a given region. Backgrounds from , and decays are reduced to a level below of the signal yield at the selection stage using the excellent tracking and particle-identification capabilities of the LHCb detector, and are subsequently removed by a background subtraction procedure. The signal lineshape in the spectrum is described by a bifurcated Gaussian core and exponential tails on both sides. A sum of two such lineshapes is used for the signal template for the mass fit, while the background lineshape is a falling exponential. The exponential tails in the signal lineshape are fixed from the simulation and all other parameters are allowed to vary in the fit, performed as a binned minimisation. An example mass fit result is given in the Appendix. The cumulative signal yield in the MeV region is .
The strategy in this analysis is to examine the hypothesis that non-exotic contributions alone can explain all features of the data. Under the approximation that the muon mass can be neglected and within a narrow bin, the -averaged transition matrix element squared is [18, 19]
[TABLE]
where are the helicity amplitudes and are Wigner rotation matrix elements. The helicities of the outgoing lepton and are and , respectively. Parity conservation in the electromagnetic decay leads to the relation . The differential decay rate of with the system including spin- partial waves with can be written as
[TABLE]
where the angular part in Eq. 1 has been expanded in an orthonormal basis of angular functions, . Here, enumerates the bin under consideration and is the angular phase space differential element. The angular basis functions, , are constructed from spherical harmonics, , and reduced spherical harmonics, , and are given in are given in the Appendix.
The moments are observables that have an overall dependence, but within a narrow bin, this dependence can be neglected. The number of moments for the bin, , depends on the allowed spin of the highest partial wave, , and is given by [19]
[TABLE]
Thus, for spin 3 onward, each additional higher spin component leads to 12 additional moments. In contrast to previous analyses, is not integrated over, which would have resulted in integrating over 10 out of these 12 moments, for each additional spin. Due to the orthonormality of the basis functions, the angular observables, , can be determined from the data in an unbiased fashion using a simple counting measurement [18]. For the bin, the background-subtracted raw moments are estimated as
[TABLE]
where refers to the set of angles for a given event in this bin. The corresponding covariance matrix is
[TABLE]
Here, and correspond to the number of candidates in the signal and background regions, respectively. The signal region is defined within MeV of the known mass, and the background region spans the range MeV. The scale factor, , is the ratio of the estimated number of background candidates in the signal region divided by the number of candidates in the background region and is used to normalise the background subtraction.
To unfold effects from the detector efficiency including event reconstruction and selection, an efficiency matrix, , is used. It is obtained from simulated signal events generated according to a phase space distribution, uniform in , as
[TABLE]
The weight factors correct for differences between data and simulation, and the summation is over simulated and reconstructed events. They are derived using the control mode, as described in Refs. [15, 16]. The efficiency-corrected moments and covariance matrices are estimated as
[TABLE]
The first moment, , corresponds to the overall rate. The remaining moments and the covariance matrix are normalised to this overall rate as and
[TABLE]
for .
The normalisation with respect to the total rate renders the analysis insensitive to any overall systematic effect not correlated with in a given bin. The uncertainty from limited knowledge of the background is included in the second term in Eq. 5. The effect on the normalised moments, , due to the uncertainty in the scale factors from the mass fit, is found to be negligible. The effect due to the limited simulation sample size compared to the data is small and accounted for using pseudoexperiments. The last source of systematic uncertainty is the effect of finite resolution in the reconstructed angles. The estimated biases in the measured moments are added as additional uncertainties.
The dominant contributions to are from the and states. To maximise the sensitivity to any exotic component, the dominant region that serves as a background for any non- component, the analysis is performed on the MeV region, as marked by the dot-dashed lines in Fig. 1. The value of depends on , with higher spin states suppressed at lower values, due to the orbital angular momentum barrier factor [20]. As seen from Fig. 1, only states with spin contribute below MeV and spin below MeV. As a conservative choice, is taken to be one unit larger than these expectations,
[TABLE]
Any exotic component in the or system will reflect onto the entire basis of partial waves and give rise to nonzero contributions from components for larger than those needed to account for resonances. From the completeness of the basis, a model with large enough also describes any exotic component in the data. For a given value of , there is a one-to-one correspondence between and the variables or . Therefore a complete basis of partial waves also describes any arbitrary shape in or , for a given bin. The series is truncated at a value large enough to describe the relevant features of the distribution in data, but not so large that it follows bin-by-bin statistical fluctuations. A value of is found to be suitable.
For the bin, the probability density function (pdf) for the model is
[TABLE]
Simulated events generated uniformly in , after incorporating detector efficiency effects and weighting by the pdf in Eq. 11, are expected to match the background-subtracted data. The background subtraction is performed using the technique [21], where the weights are determined from fits to the invariant distributions described previously. Figure 2 shows this comparison between the background-subtracted data and weighted simulated events in the MeV region. The model clearly misses the peaking structures in the data around MeV and MeV. This inability of the model to describe the data, even though the first spin 2 state, , lies beyond this mass region, strongly points toward the presence of exotic components. These could be four-quark bound states, meson molecules, or possibly dynamically generated features such as cusps.
To obtain a numerical estimate of the significance of exotic states, the likelihood ratio test is employed between the null hypothesis (-only, from Eq. 10) and the exotic hypothesis () pdfs, denoted and , respectively. The test statistic used in the likelihood ratio test is defined as
[TABLE]
for the bin, where denotes the 3-dimensional angular detector efficiency in this bin, derived from the simulation weighted to match the data in the production kinematics. The last term in Eq. S0.Ex1 ensures normalization of the relevant pdf and is calculated from simulated events that pass the reconstruction and selection criteria
[TABLE]
Results from individual bins are combined to give the final test statistic {\Delta(-2\log{\cal L})=\displaystyle\sum_{k}\Delta(-2\log{\cal L})\Big{|}_{k}}.
From Eq. 3 the number of degrees-of-freedom (ndf) increases by 12 for each additional spin- wave in each bin. From Eq. 10, for the and choices, and , respectively, between the exotic and -only pdf’s for each bin. Each additional degree-of-freedom between the exotic and -only pdf adds approximately one unit to the computed in the data due to increased sensitivity to the statistical fluctuations, and is therefore not expected to be zero even if there is no exotic contribution in the data. The expected distribution in the absence of exotic activity is evaluated using a large number of pseudoexperiments. For each bin, 11,000 pseudoexperiments are generated according to the -only model with the moments varied according to the covariance matrix. The number of signal and background events for each pseudoexperiment are taken to be those measured in the data. The detector efficiency obtained from simulation is parameterised in 4D. Each pseudoexperiment is analyzed in exactly the same way as the data, where an independent efficiency matrix is generated for each pseudoexperiment. This accounts for the limited sample size of the simulation for the efficiency unfolding. The pseudoexperiments therefore represent the data faithfully at every step of the processing.
Figure 3 shows the distribution of from the pseudoexperiments in the MeV region comprising six bins each with the or choice. A fit to a Gaussian profile gives between the null and exotic hypothesis, even in the absence of any exotic contributions. This value is consistent with the naïve expectation from the counting discussed earlier. The value of for the data, as marked by the vertical line in Fig. 3, shows a deviation of more than from the null hypothesis, corresponding to the distribution of the pseudoexperiments. The uncertainty due to the quality of the Gaussian profile fit in Fig. 3 is found to be negligible. The choice of large for , as well as the detector efficiency and calibration of the simulation, are systematically varied in pseudoexperiments, with significance for exotic components in excess of observed in each case.
In summary, employing the Run 1 LHCb dataset, non- contributions in are observed with overwhelming significance. Compared to the previous BaBar analysis [8] of the same channel, the current study benefits from a 40-fold increase in signal yield and a full angular analysis of the decay topology. The method relies on a novel orthonormal angular moments expansion and, aside from a conservative limit on the highest allowed spin for a given invariant mass, makes no other assumption about the system. Figure 4 shows a scatter plot of against in the background-subtracted data. While the model-independent analysis performed here does not identify the origin of the non- contributions, structures are visible at MeV, close to the exotic state reported previously by Belle [3], and at MeV. To interpret these structures as exotic tetraquark resonances and measure their properties will require a future model-dependent amplitude analysis of the data.
Acknowledgements
We express our gratitude to our colleagues in the CERN accelerator departments for the excellent performance of the LHC. We thank the technical and administrative staff at the LHCb institutes. We acknowledge support from CERN and from the national agencies: CAPES, CNPq, FAPERJ and FINEP (Brazil); MOST and NSFC (China); CNRS/IN2P3 (France); BMBF, DFG and MPG (Germany); INFN (Italy); NWO (Netherlands); MNiSW and NCN (Poland); MEN/IFA (Romania); MSHE (Russia); MinECo (Spain); SNSF and SER (Switzerland); NASU (Ukraine); STFC (United Kingdom); NSF (USA). We acknowledge the computing resources that are provided by CERN, IN2P3 (France), KIT and DESY (Germany), INFN (Italy), SURF (Netherlands), PIC (Spain), GridPP (United Kingdom), RRCKI and Yandex LLC (Russia), CSCS (Switzerland), IFIN-HH (Romania), CBPF (Brazil), PL-GRID (Poland) and OSC (USA). We are indebted to the communities behind the multiple open-source software packages on which we depend. Individual groups or members have received support from AvH Foundation (Germany); EPLANET, Marie Skłodowska-Curie Actions and ERC (European Union); ANR, Labex P2IO and OCEVU, and Région Auvergne-Rhône-Alpes (France); Key Research Program of Frontier Sciences of CAS, CAS PIFI, and the Thousand Talents Program (China); RFBR, RSF and Yandex LLC (Russia); GVA, XuntaGal and GENCAT (Spain); the Royal Society and the Leverhulme Trust (United Kingdom); Laboratory Directed Research and Development program of LANL (USA).
**Appendix
**
**A. Angle conventions
**
The four kinematic variables for the process are the invariant mass , and the three angles . The angle conventions for and are depicted in Fig. 5. Assuming negligible direct violation and production asymmetry, the rate expression remains the same between the charge-conjugate modes.
**B. Example mass fit result in a particular bin
**
Figure 6 shows an example mass fit result for the MeV bin.
**C. Further comparison between the and models
**
Figure 7 shows a comparison between the and moments models in the MeV bin. Since the spin-1 resonance strongly dominates here, the two models are compatible.
Figure 8 shows a comparison between the and moments models in the MeV.
**D. Angular moments definitions
**
The transversity basis amplitudes, , are defined as
[TABLE]
and the amplitudes for spin are denoted as , and , respectively. For contributions up to , there are 28 angular moments from the expansion of Eq. 1, as explicitly listed in Table 1 in terms of the transversity amplitudes. The addition of states from spin-3 onward results in 12 moments for each additional spin. The form of the moments are listed in Table 2, leading to the expression appearing in Eq. 3 of the main text. Further details can be obtained from Refs. [18, 19].
The reference list from the paper itself. Each links out to its DOI / PubMed record.
- 1[1] LH Cb collaboration, R. Aaij et al. , Observation of the resonant character of the Z ( 4430 ) − 𝑍 superscript 4430 Z(4430)^{-} state , Phys. Rev. Lett. 112 (2014) 222002 , ar Xiv:1404.1903 · doi ↗
- 2[2] Belle collaboration, S. K. Choi et al. , Observation of a resonance-like structure in the π ± ψ ′ superscript 𝜋 plus-or-minus superscript 𝜓 ′ \pi^{\pm}\psi^{\prime} mass distribution in exclusive B → K π ± ψ ′ → 𝐵 𝐾 superscript 𝜋 plus-or-minus superscript 𝜓 ′ B\rightarrow K\pi^{\pm}\psi^{\prime} decays , Phys. Rev. Lett. 100 (2008) 142001 , ar Xiv:0708.1790 · doi ↗
- 3[3] Belle collaboration, K. Chilikin et al. , Observation of a new charged charmoniumlike state in B ¯ 0 → J / ψ K − π + → superscript ¯ 𝐵 0 𝐽 𝜓 superscript 𝐾 superscript 𝜋 \bar{B}^{0}\rightarrow J/\psi K^{-}\pi^{+} decays , Phys. Rev. D 90 (2014) 112009 , ar Xiv:1408.6457 · doi ↗
- 4[4] S. J. Brodsky, D. S. Hwang, and R. F. Lebed, Dynamical picture for the formation and decay of the exotic X Y Z 𝑋 𝑌 𝑍 XYZ mesons , Phys. Rev. Lett. 113 (2014) 112001 , ar Xiv:1406.7281 · doi ↗
- 5[5] LASS collaboration, D. Aston et al. , A study of K − π + superscript 𝐾 superscript 𝜋 K^{-}\pi^{+} scattering in the reaction K − p → K − π + n → superscript 𝐾 𝑝 superscript 𝐾 superscript 𝜋 𝑛 K^{-}p\rightarrow K^{-}\pi^{+}n at 11 Ge V/c , Nucl. Phys. B 296 (1988) 493 · doi ↗
- 6[6] Belle collaboration, K. Chilikin et al. , Experimental constraints on the spin and parity of the Z ( 4430 ) + 𝑍 superscript 4430 Z(4430)^{+} , Phys. Rev. D 88 (2013) 074026 , ar Xiv:1306.4894 · doi ↗
- 7[7] Particle Data Group, M. Tanabashi et al. , Review of particle physics , Phys. Rev. D 98 (2018) 030001 · doi ↗
- 8[8] Ba Bar collaboration, B. Aubert et al. , Search for the Z ( 4430 ) − 𝑍 superscript 4430 Z(4430)^{-} at BABAR , Phys. Rev. D 79 (2009) 112001 , ar Xiv:0811.0564 · doi ↗