Discovery of a strong ionized-gas outflow in an AKARI-selected Ultra-luminous Infrared Galaxy at z = 0.5
Xiaoyang Chen, Masayuki Akiyama, Hirofumi Noda, Abdurrouf, Yoshiki, Toba, Issei Yamamura, Toshihiro Kawaguchi, Mitsuru Kokubo, Kohei Ichikawa

TL;DR
This paper reports the discovery of a powerful ionized-gas outflow in an AKARI-selected ULIRG at z=0.5, showing significant outflow velocities and extending over 4 kpc, with implications for galaxy feedback processes.
Contribution
It presents the first detailed observation of a strong outflow in an AKARI-selected ULIRG at intermediate redshift, highlighting its properties and potential impact on galaxy evolution.
Findings
The outflow velocity reaches up to 1830 km/s.
The outflow extends to approximately 4 kpc from the galaxy center.
The galaxy exhibits a high star formation rate of 990 M_sun/yr.
Abstract
In order to construct a sample of ultra-luminous infrared galaxies (ULIRGs, with infrared luminosity, L) at 0.5 < z < 1, we are conducting an optical follow-up program for bright 90-m FIR sources with a faint optical (i < 20) counterpart selected in the AKARI Far-Infrared Surveyor (FIS) Bright Source catalog (Ver.2). AKARI-FIS-V2 J0916248+073034, identified as a ULIRG at z = 0.49 in the spectroscopic follow-up observation, indicates signatures of an extremely strong outflow in its emission line profiles. Its [OIII] 5007\AA\ emission line shows FWHM of 1830 km s and velocity shift of -770 km s in relative to the stellar absorption lines. Furthermore, low-ionization [OII] 3726\AA\ 3729\AA\ doublet also shows large FWHM of 910 km s and velocity shift of -380 km s. After the removal of an unresolved nuclear component, the…
Click any figure to enlarge with its caption.
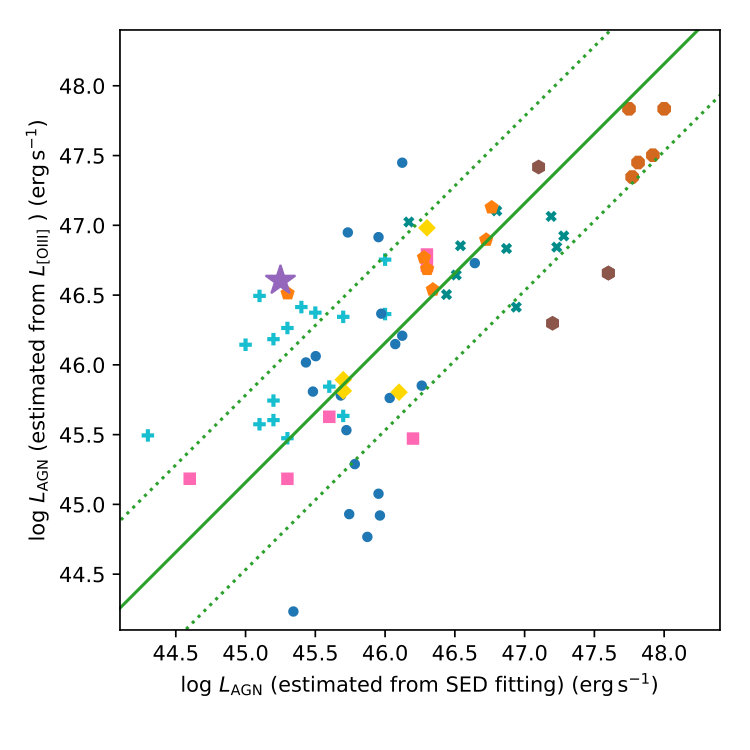 Figure 1
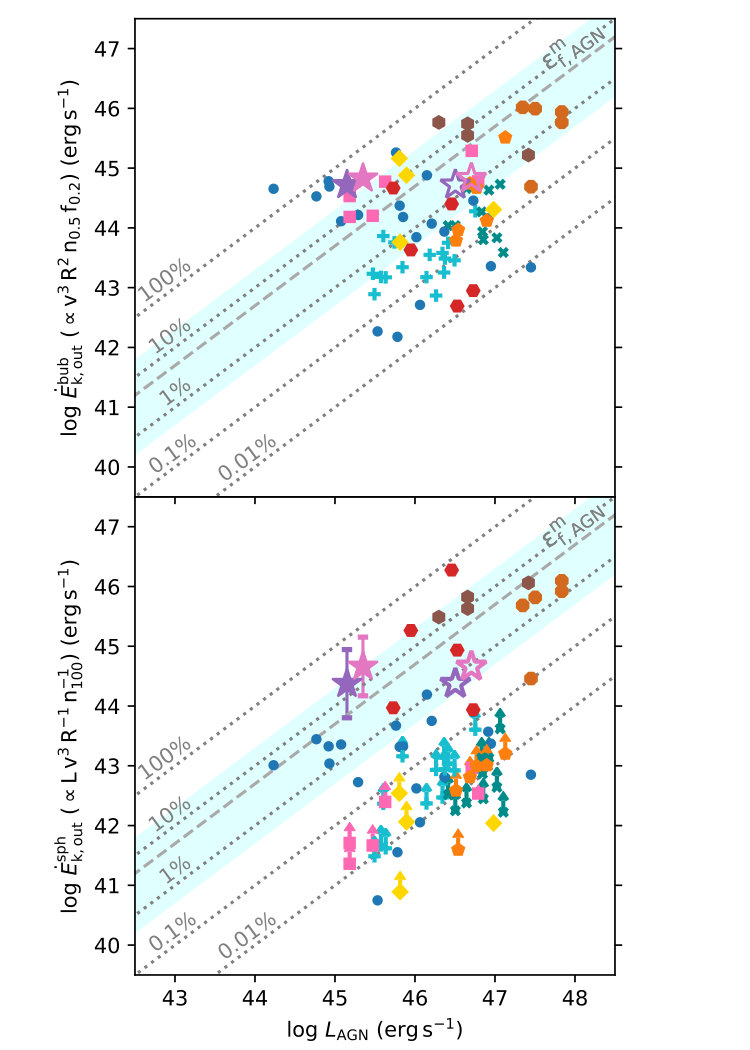 Figure 2
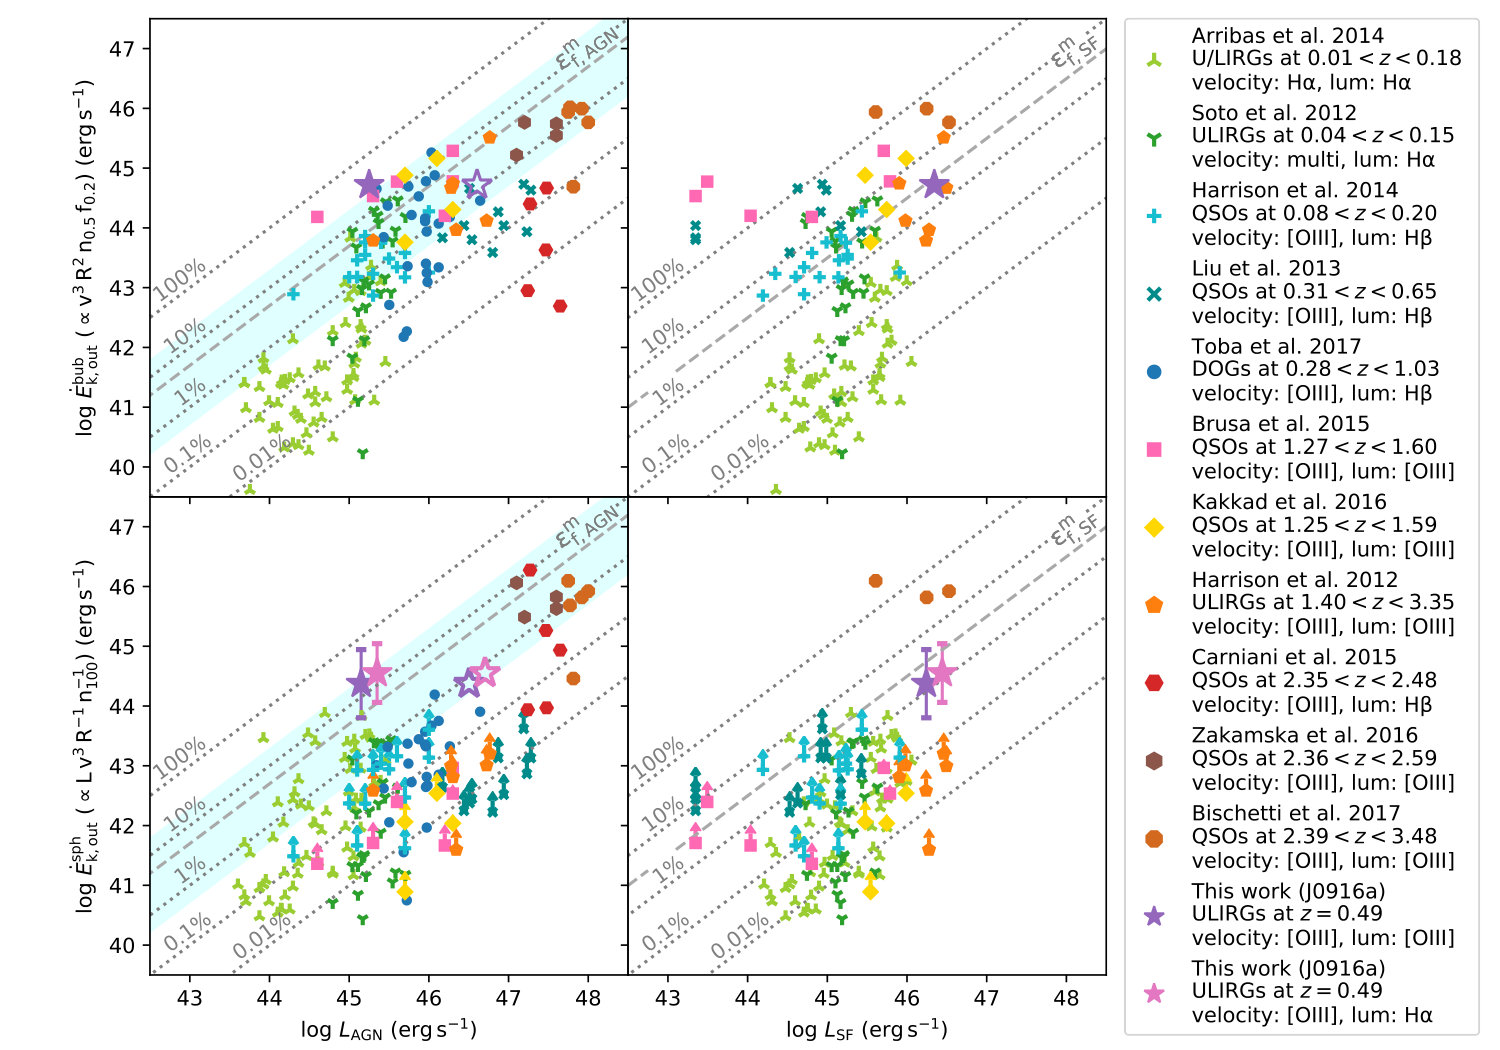 Figure 3
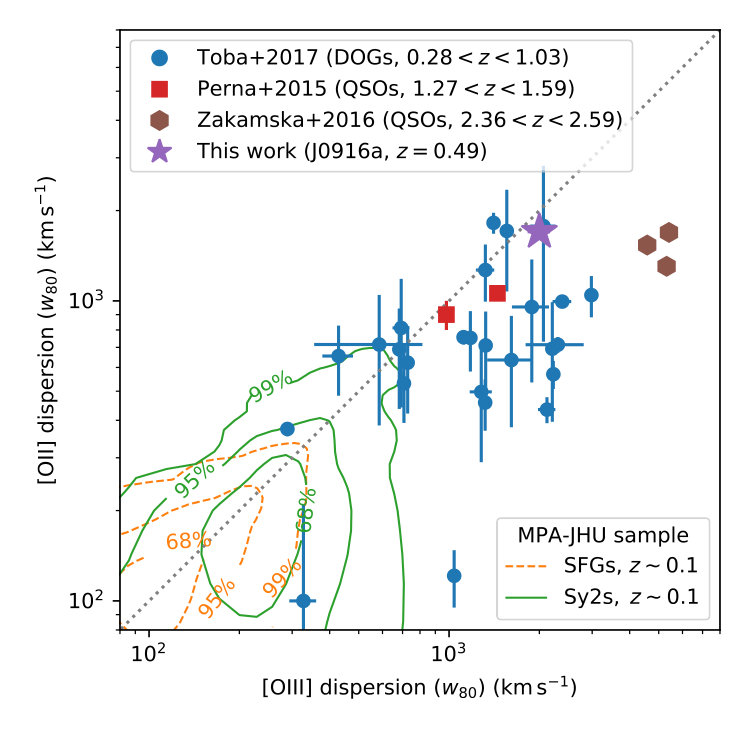 Figure 4
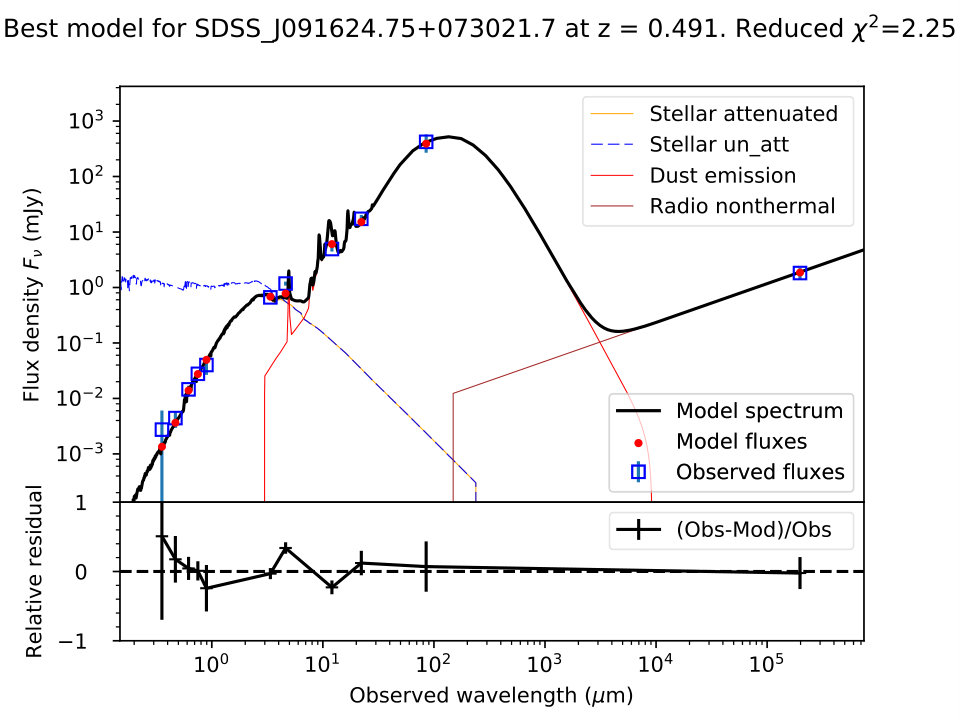 Figure 5
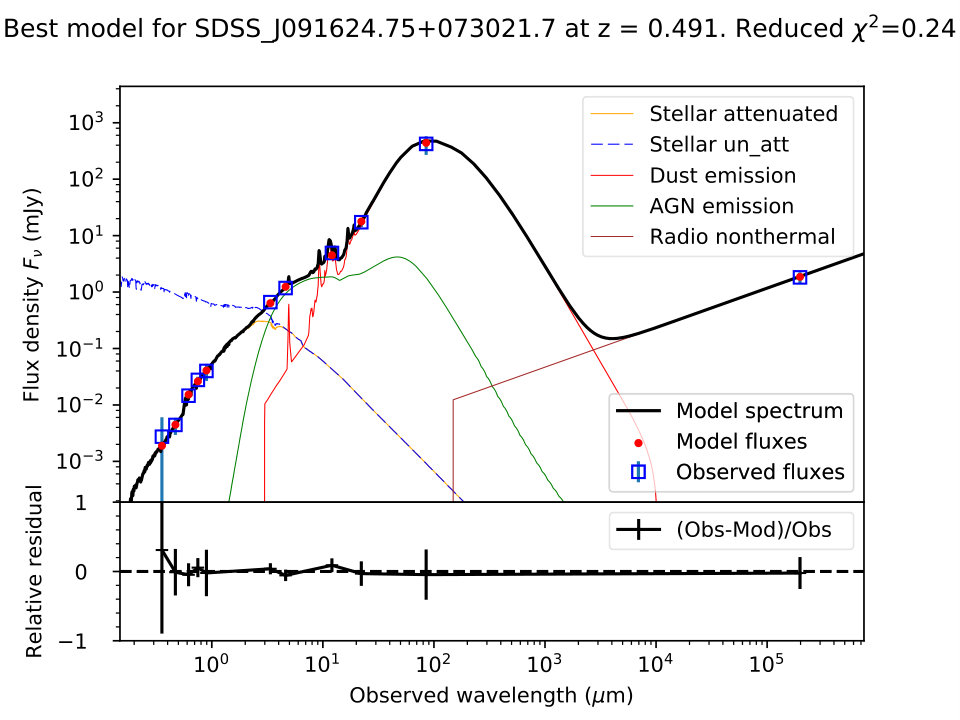 Figure 6
 Figure 7
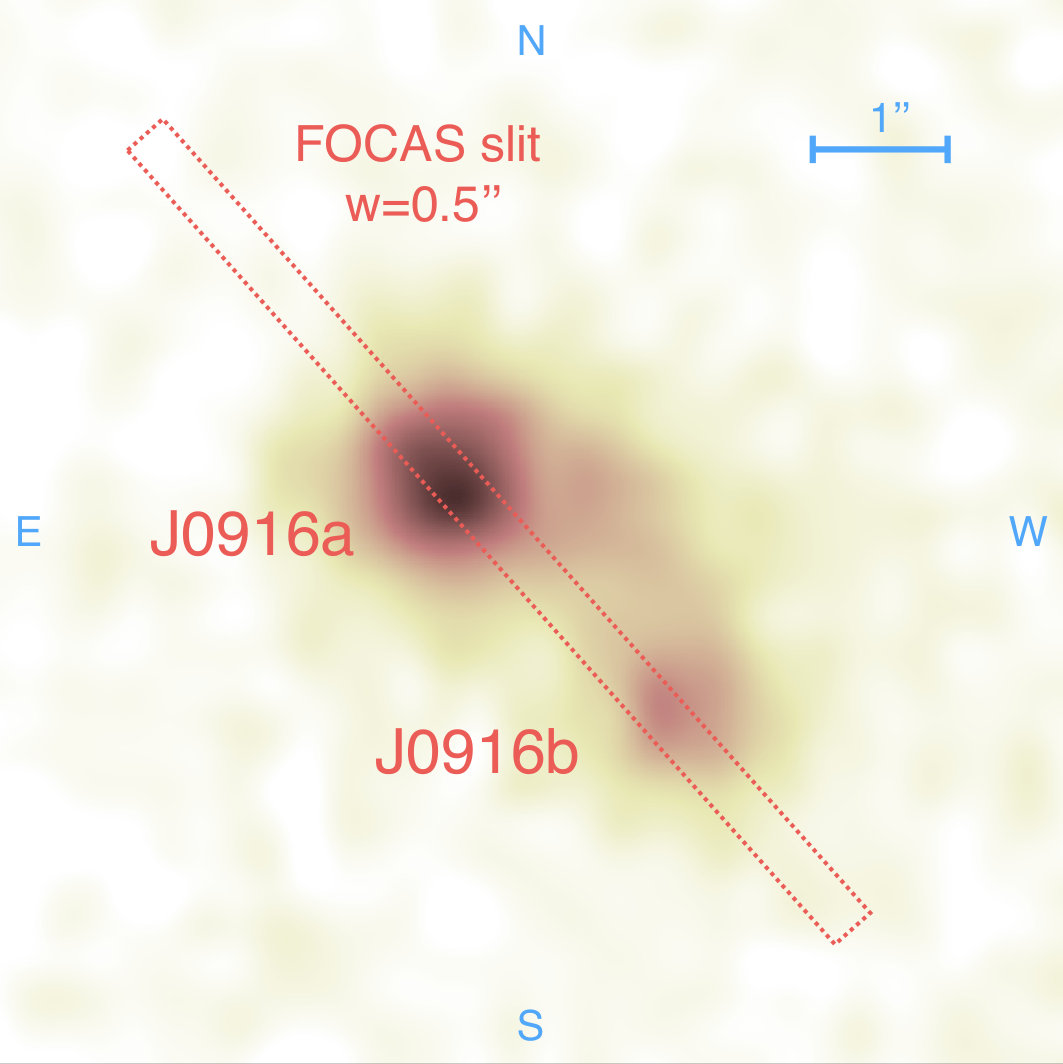 Figure 8
 Figure 9
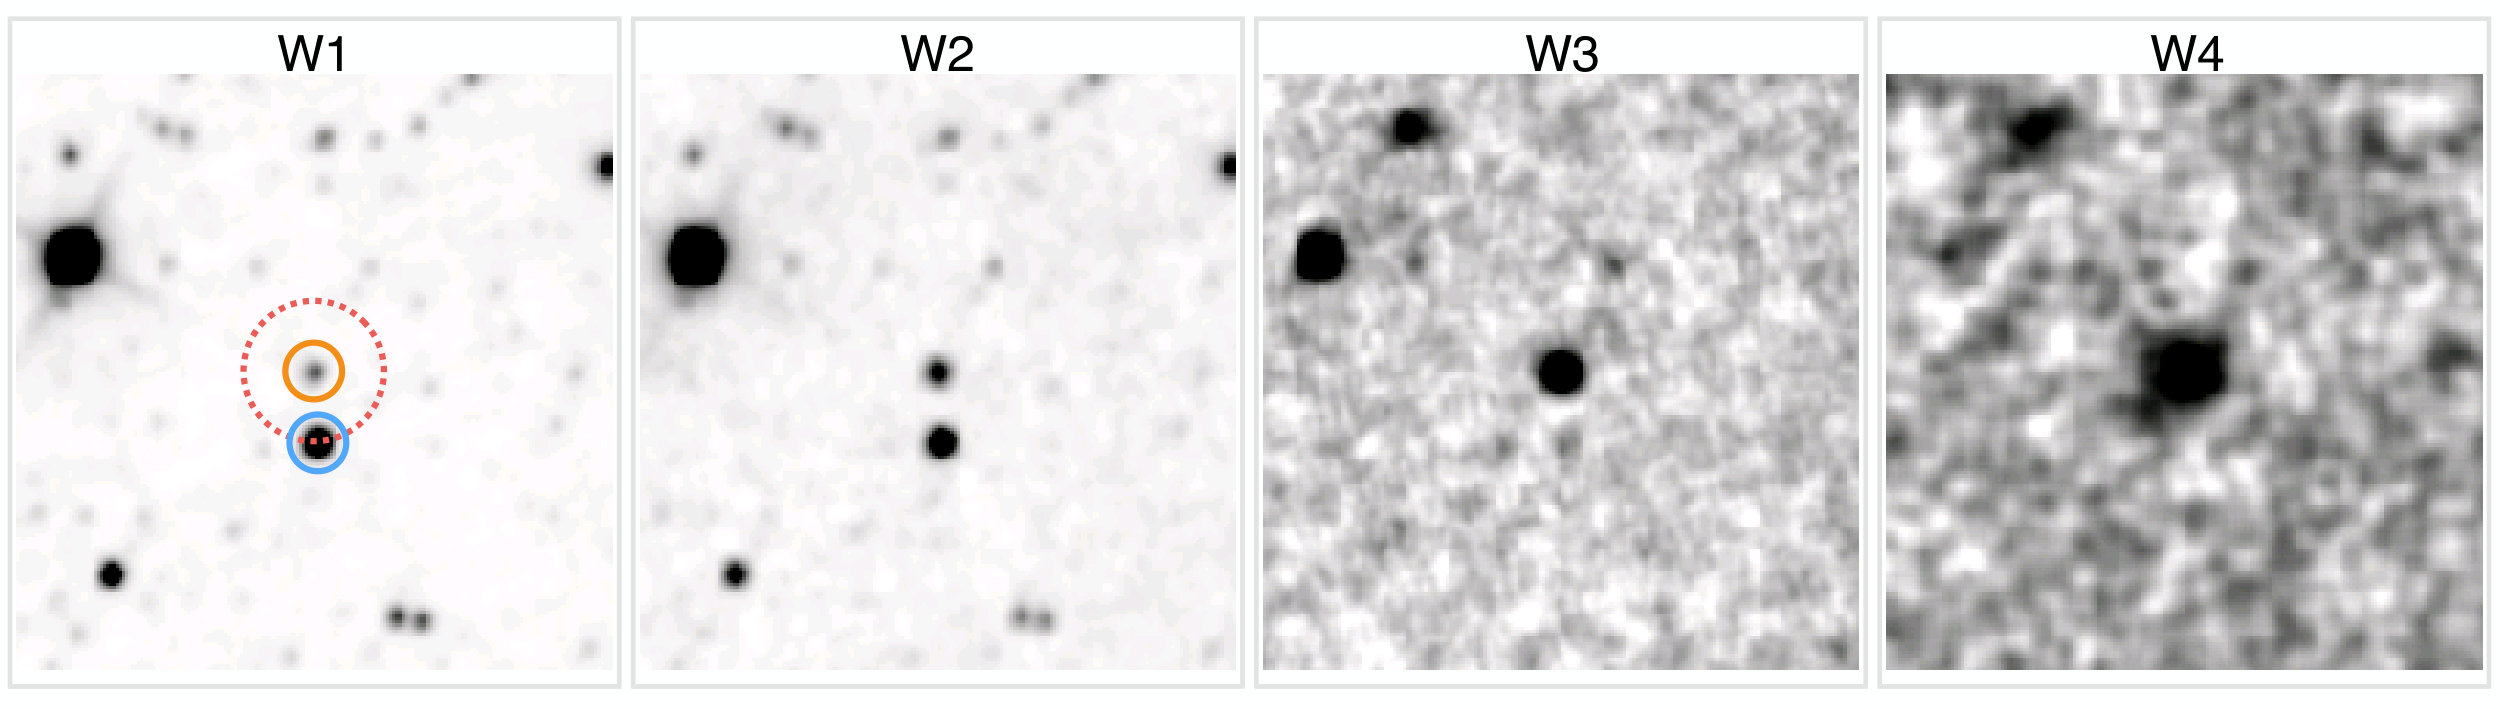 Figure 10
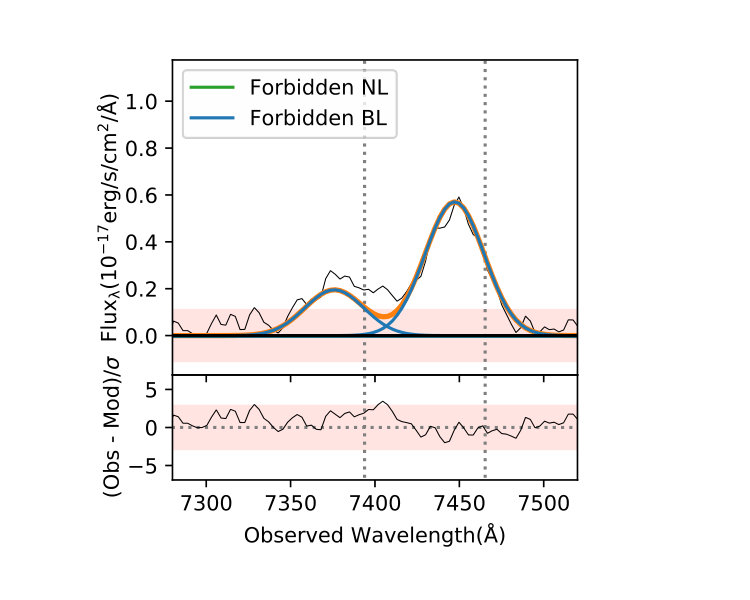 Figure 11
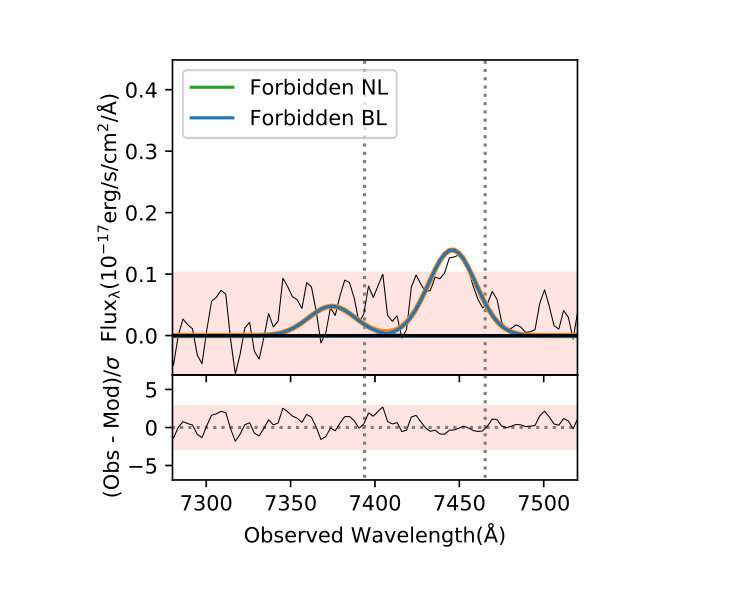 Figure 12
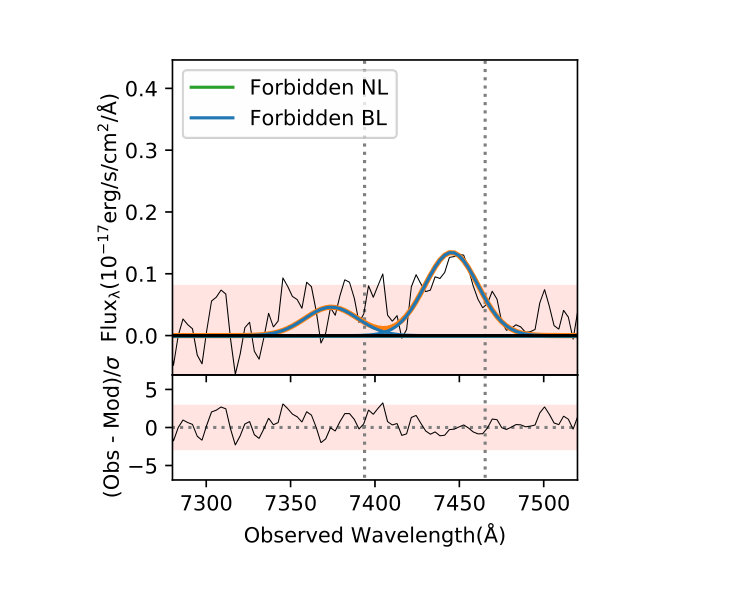 Figure 13
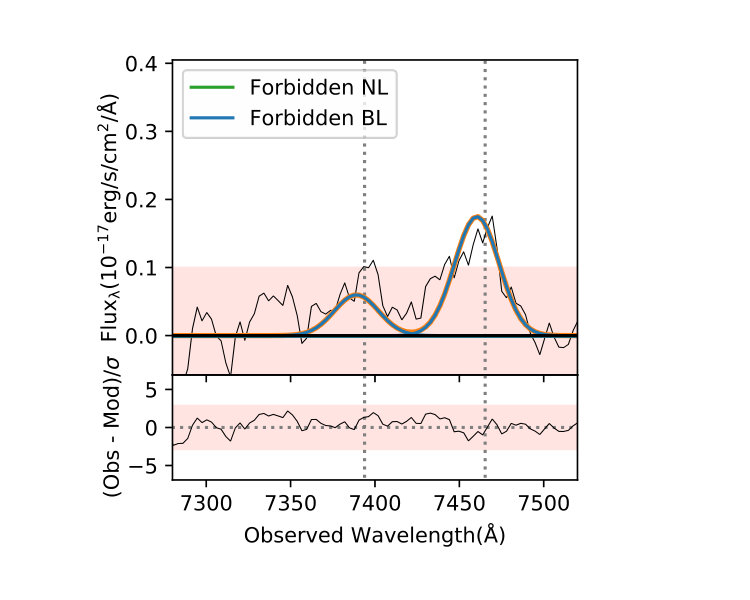 Figure 14
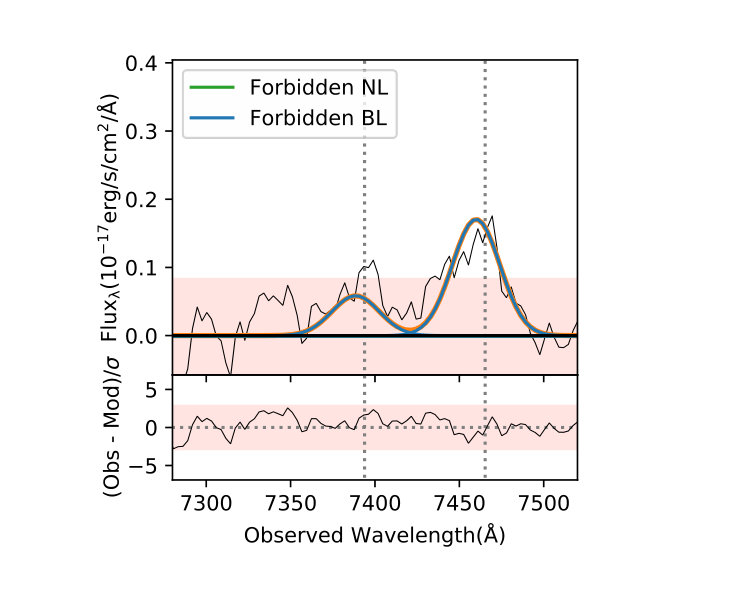 Figure 15
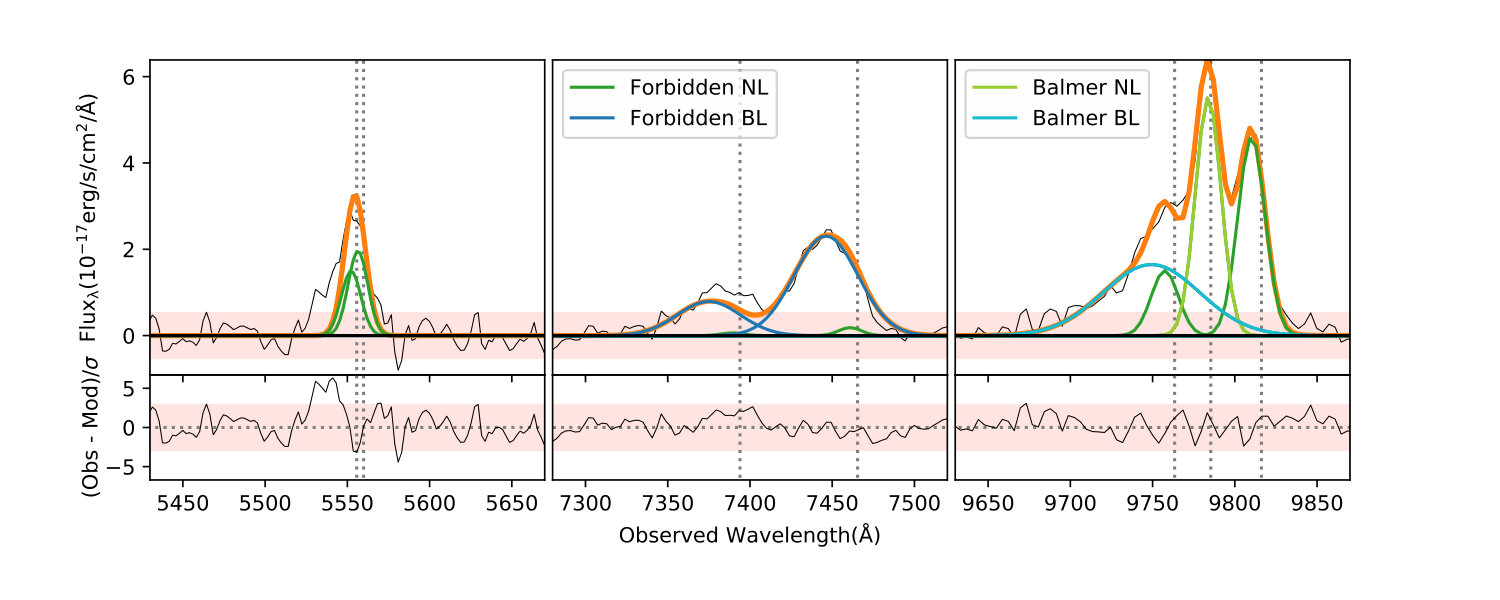 Figure 16
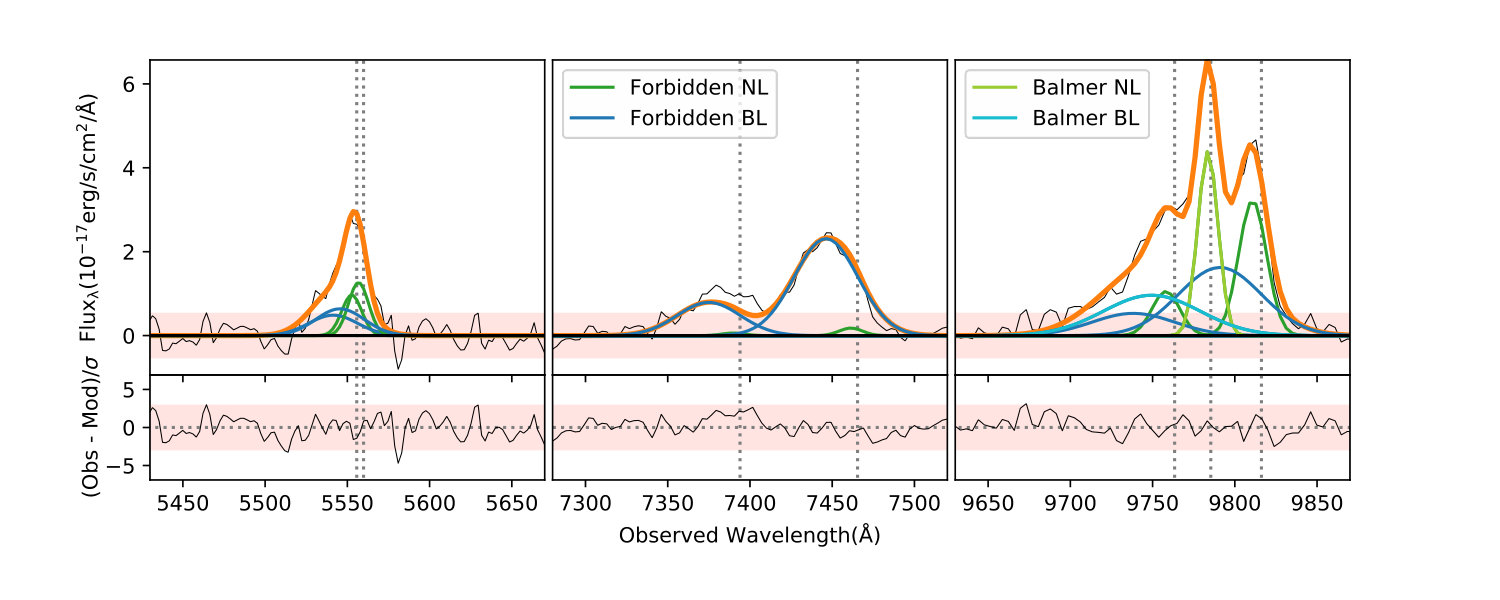 Figure 17
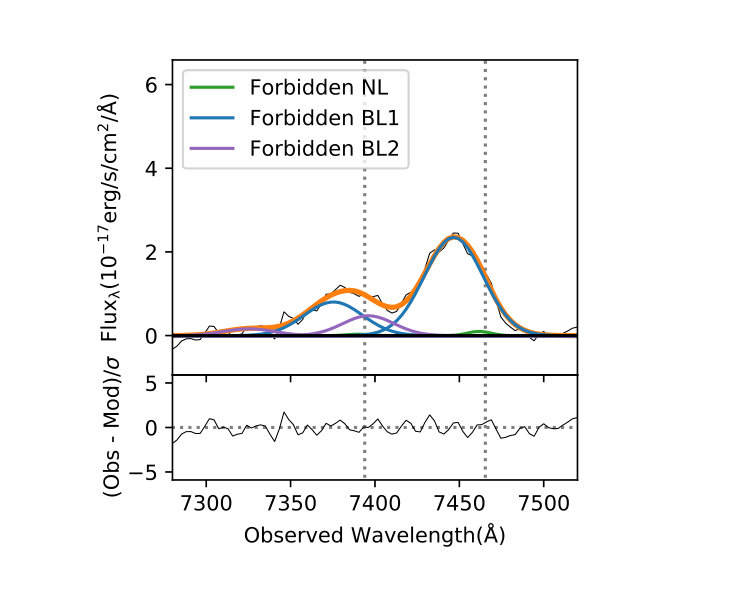 Figure 18
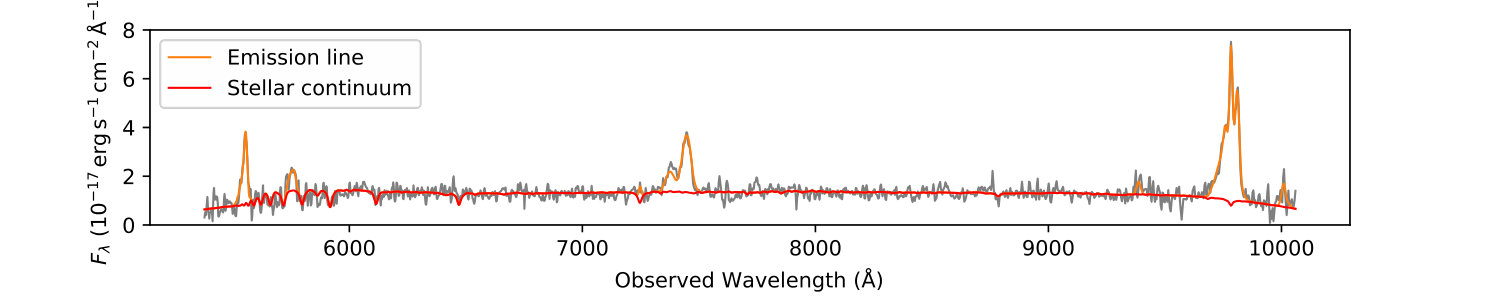 Figure 19
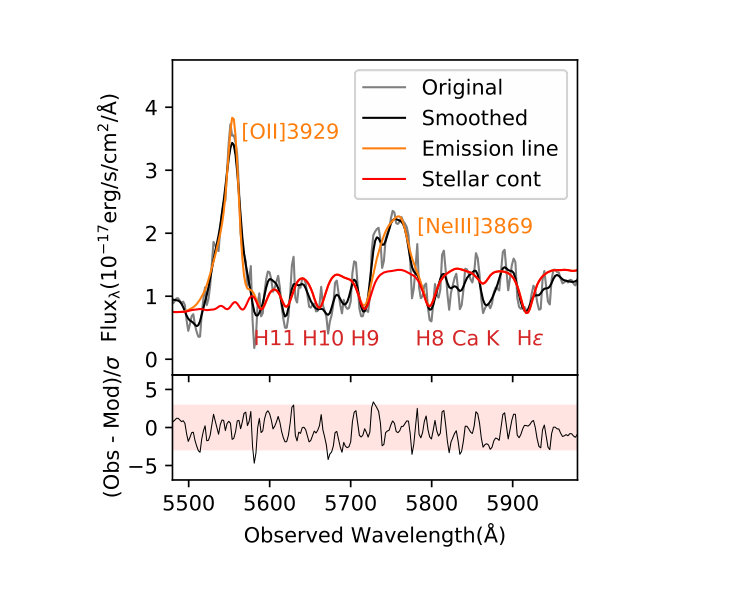 Figure 20
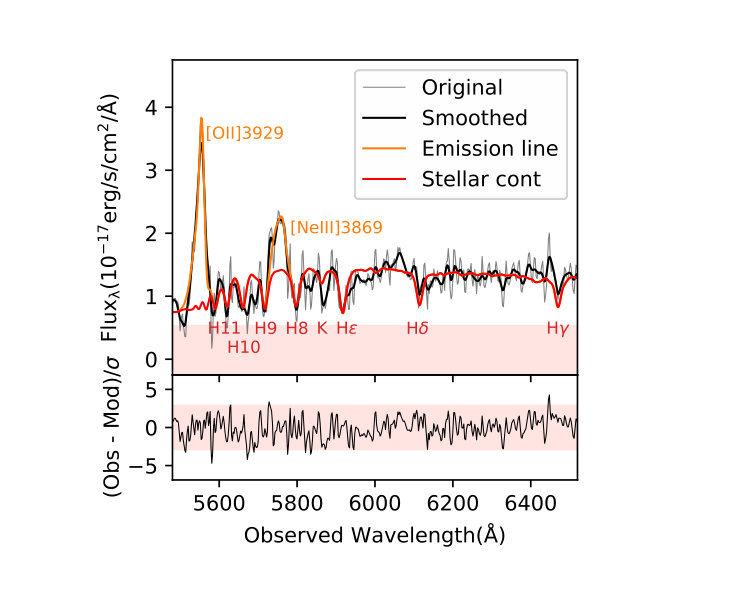 Figure 21
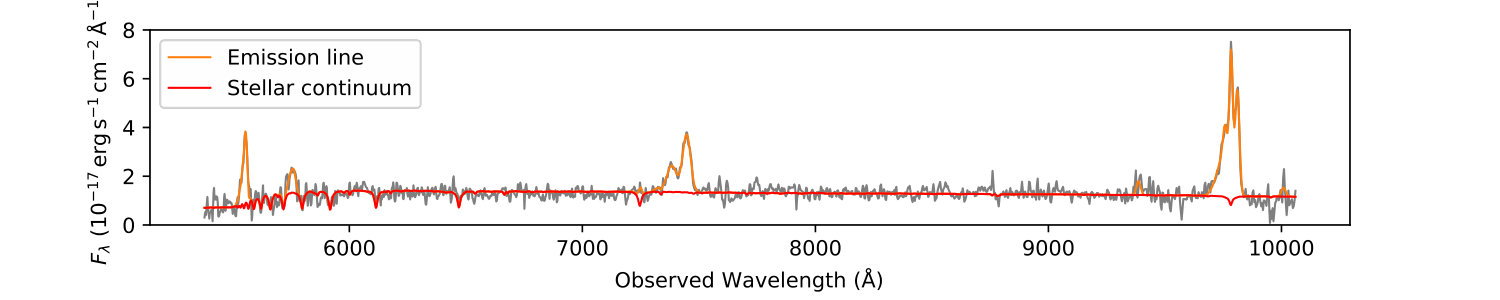 Figure 22
 Figure 23
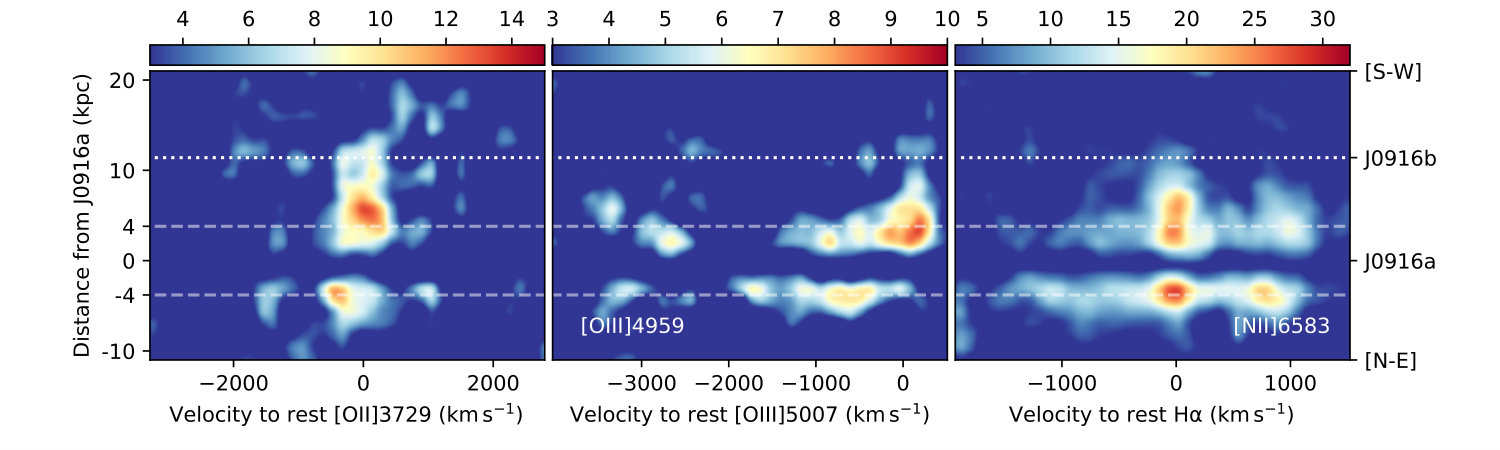 Figure 24
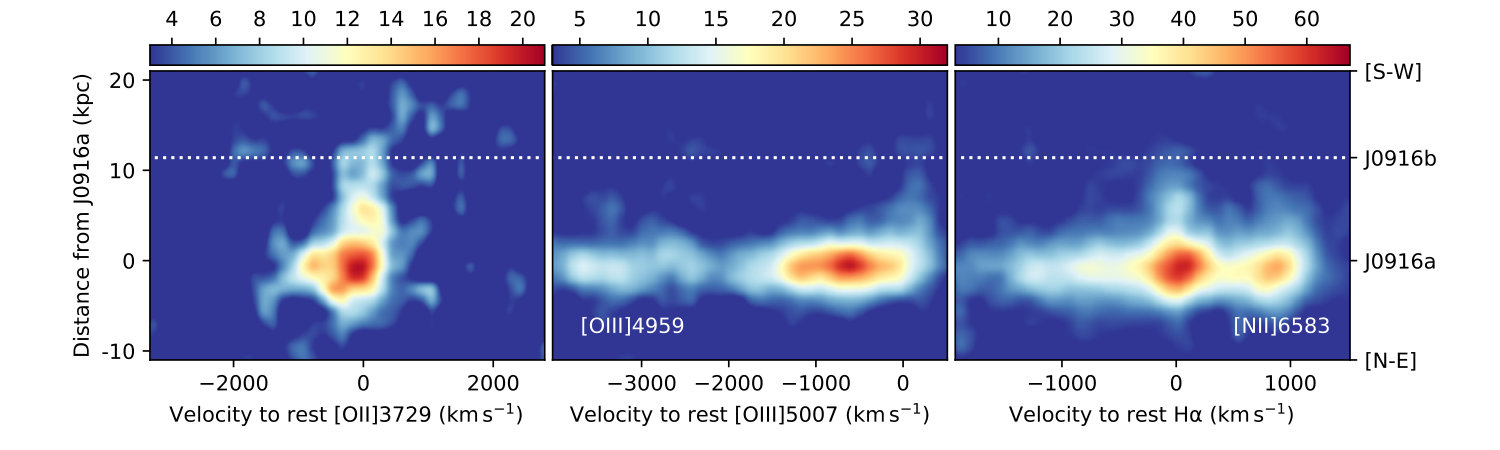 Figure 25
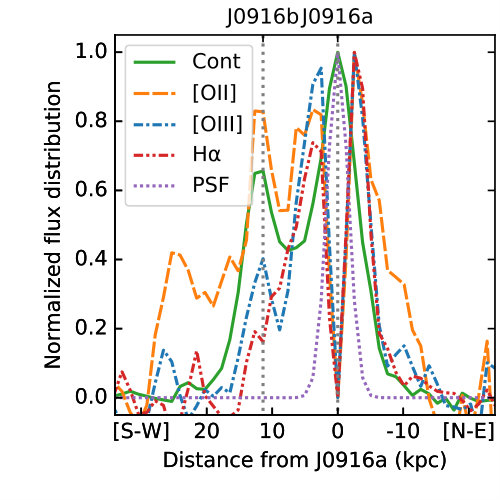 Figure 26
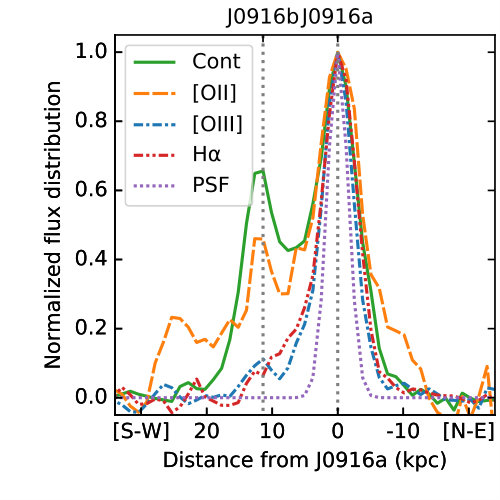 Figure 27
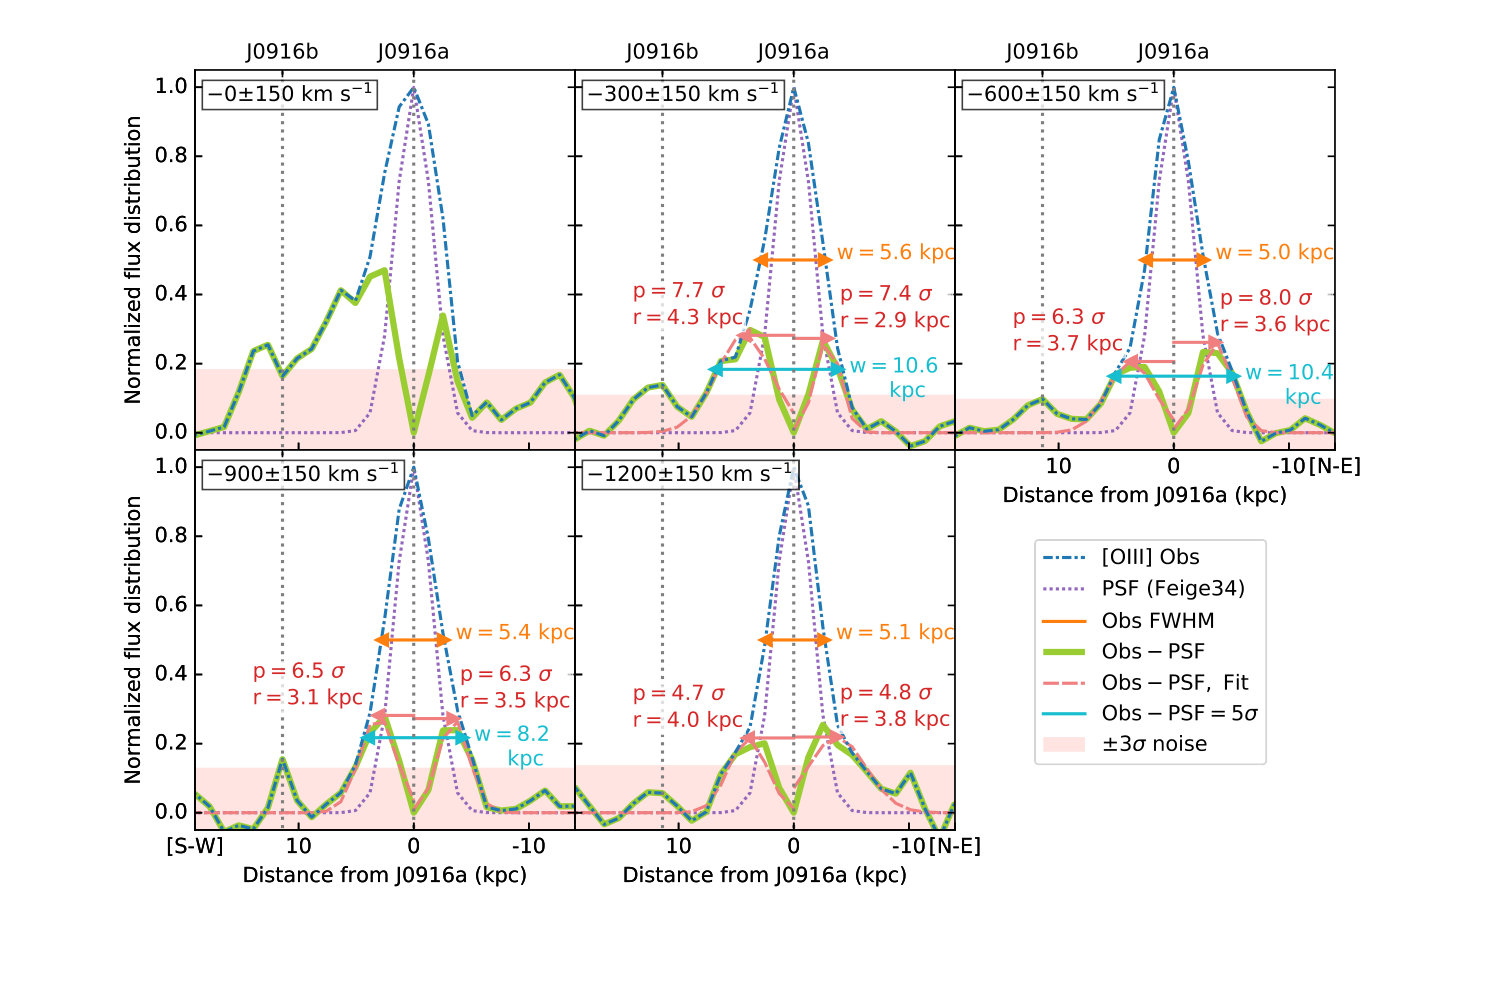 Figure 28
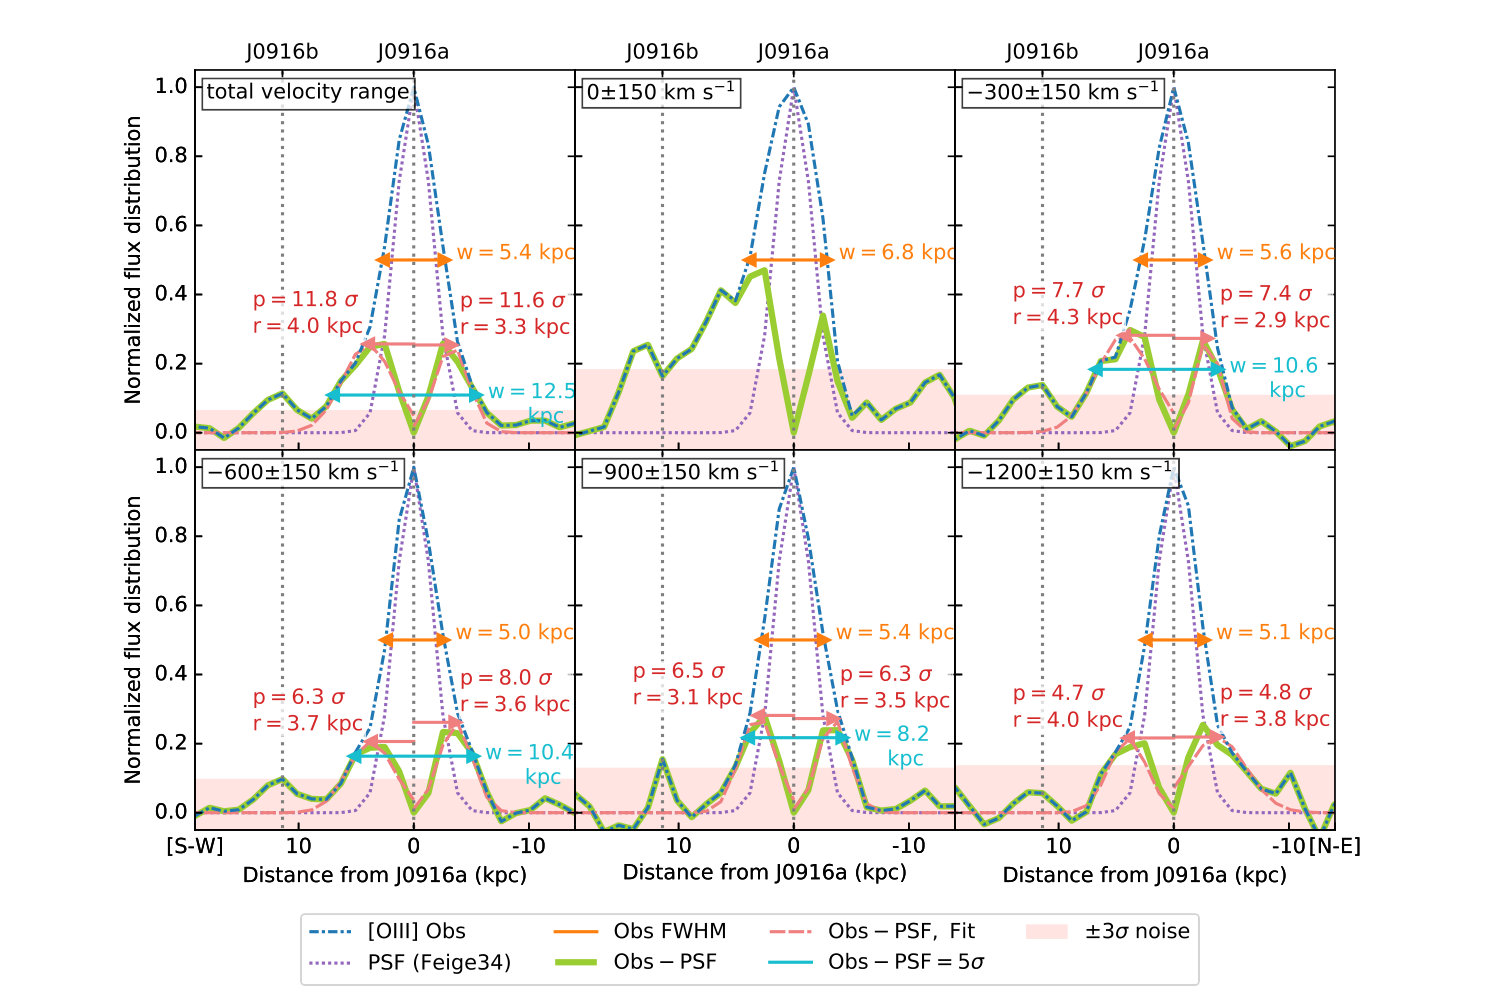 Figure 29
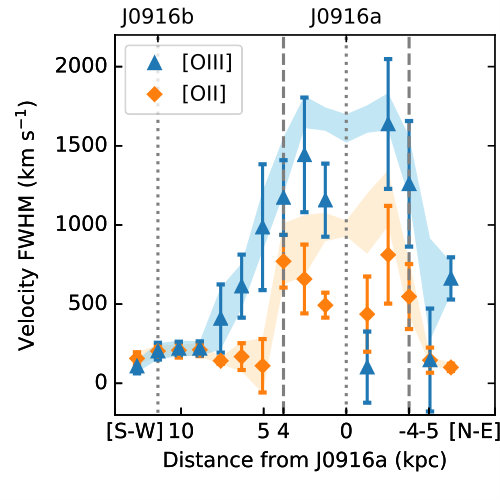 Figure 30
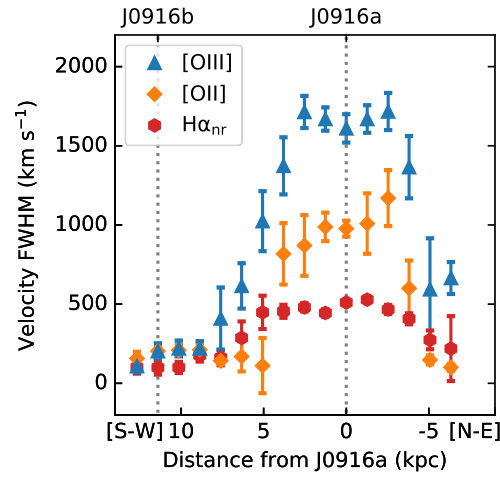 Figure 31
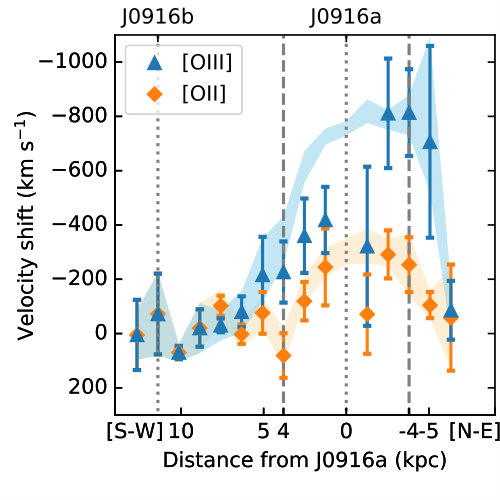 Figure 32
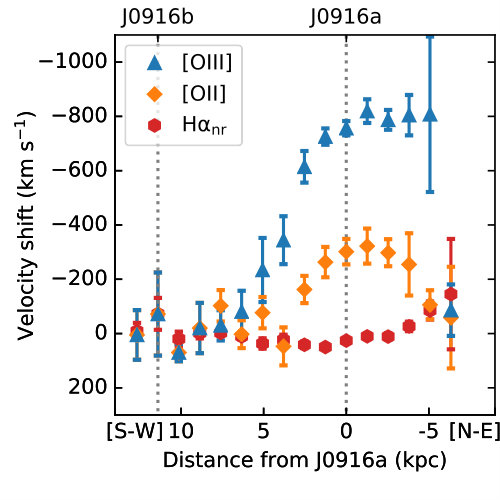 Figure 33
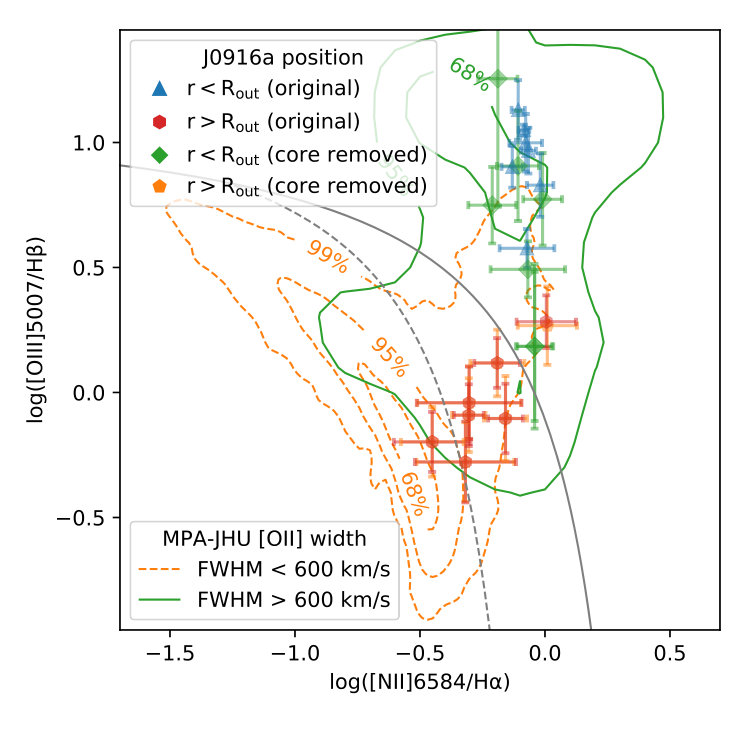 Figure 34
| Star formation history | |
|---|---|
| OSP e-folding time (Myr) | 500 |
| Age of OSP (Myr) | 100, 200, 400, 600 |
| Age of YSP (Myr) | 10, 20, 40, 80 |
| Mass fraction of YSP | 0.01, 0.03, 0.05, 0.1, 0.3, 0.5 |
| Single stellar population (Bruzual & Charlot, 2003) | |
| Initial mass function | Salpeter (1955) |
| Metallicity | 0.02 |
| Dust attenuation (Calzetti et al., 2000) | |
| E(B-V) of YSP | 0.2–2.0, per 0.2 |
| Reduction factor | 0.5 |
| Dust re-emission (Dale et al., 2014) | |
| Dust heating slope | 1.125, 1.625, 2.125 |
| AGN emission (Fritz et al., 2006) | |
| of dusty torus | 60 |
| Optical depth at 9.7 m | 1.0, 3.0, 6.0 |
| Radial dust distribution | 0.5 |
| Angular dust distribution | 0.0 |
| Opening angle of torus | 100.0∘ |
| Angle of viewing axis | 0.001∘, 89.990∘ |
| 0.01–0.09, per 0.01 | |
| 0.1–1.0, per 0.05 | |
| Radio non-thermal emission (Colina & Perez-Olea, 1992) | |
| FIR / radio coefficient | 2.58 |
| Radio power-law slope | 0.7 |
| SFR estimated from | M⊙ yr-1 |
| Stellar mass | M⊙ |
| Stellar un_att luminosity | L⊙ |
| of YSP | |
| SF IR luminosity | L⊙ |
| Total IR luminosity | L⊙ |
| AGN bolometric luminosity | L⊙ |
| ⋆in the case of and | |
Peer Reviews
No public reviews on file for this paper yet. If you reviewed it on a platform where reviews are public (OpenReview, ICLR, NeurIPS, ICML), you can paste yours below so the community can read it here.
Videos
No videos yet. Explain this paper in a talk, walkthrough, or lecture? Add one.
\Received
reception date \Acceptedacception date \Publishedpublication date
\KeyWords
Galaxy Evolution — Star formation — Outflows — Dust Emission
Discovery of a strong ionized-gas outflow in an AKARI-selected Ultra-luminous Infrared Galaxy at z = 0.5
Xiaoyang Chen11affiliation: Astronomical Institute, Tohoku University, 6-3 Aramaki, Aoba-ku, Sendai, Miyagi 980-8578, Japan
Masayuki Akiyama11affiliationmark:
Hirofumi Noda22affiliation: Department of Earth and Space Science, Graduate School of Science, Osaka University, 1-1 Machikaneyama-cho, Toyonaka-shi, Osaka 560-0043, Japan
Abdurro’uf11affiliationmark: 33affiliation: Academia Sinica Institute of Astronomy & Astrophysics, 11F of Astronomy-Mathematics Building, AS / NTU, No.1, Section 4, Roosevelt Road, Taipei 10617, Taiwan, R.O.C.
Yoshiki Toba44affiliation: Department of Astronomy, Kyoto University, Kitashirakawa-Oiwake-cho, Sakyo-ku, Kyoto 606-8502, Japan 55affiliation: Research Center for Space and Cosmic Evolution, Ehime University, 2-5 Bunkyo-cho, Matsuyama, Ehime 790-8577, Japan
Issei Yamamura66affiliation: Institute of Space and Astronautical Science, JAXA, 3-1-1 Yoshinodai, Chuo-ku, Sagamihara, Kanagawa 252-5210, Japan 77affiliation: Department of Space and Astronautical Science, SOKENDAI, 3-1-1 Yoshinodai, Chuo-ku, Sagamihara, Kanagawa 252-5210, Japan
Toshihiro Kawaguchi88affiliation: Department of Economics, Management and Information Science, Onomichi City University, Hisayamada 1600-2, Onomichi, Hiroshima 722-8506, Japan
Mitsuru Kokubo11affiliationmark:
Kohei Ichikawa11affiliationmark: 99affiliation: Frontier Research Institute for Interdisciplinary Sciences, Tohoku University, 6-3 Aramaki, Aoba-ku, Sendai, Miyagi 980-8578, Japan
Abstract
In order to construct a sample of ultra-luminous infrared galaxies (ULIRGs, with infrared luminosity, L*⊙) at , we are conducting an optical follow-up program for bright 90-m FIR sources with a faint optical ( mag) counterpart selected in the AKARI Far-Infrared Surveyor (FIS) Bright Source catalog (Ver.2). AKARI-FIS-V2 J0916248+073034, identified as a ULIRG at in the spectroscopic follow-up observation, indicates signatures of an extremely strong outflow in its emission line profiles. Its [Oiii] 5007Å emission line shows FWHM of km s-1* and velocity shift of km s*-1* in relative to the stellar absorption lines. Furthermore, low-ionization [Oii] 3726Å 3729Å doublet also shows large FWHM of km s*-1* and velocity shift of km s*-1*. After the removal of an unresolved nuclear component, the long-slit spectroscopy 2D image possibly shows that the outflow extends to radius of 4 kpc. The mass outflow and energy ejection rates are estimated to be M*⊙* yr*-1* and erg s*-1*, respectively, which imply that the outflow is among the most powerful ones observed in ULIRGs and QSOs at . The co-existence of the strong outflow and intense star formation (star formation rate of 990 M*⊙* yr*-1*) indicates that the feedback of the strong outflow has not severely affect the star-forming region of the galaxy.
1 Introduction
Ultra-luminous infrared galaxies (ULIRGs, with infrared luminosity, L*⊙) are a population of the most intensely star-forming galaxies in the local universe, with star formation rates (SFR) of – M⊙* yr*-1*(Sanders & Mirabel, 1996; Rowan-Robinson, 2000). They are thought to represent rapidly growing phase of massive galaxies before quenching of their star formation. In a widely accepted scenario of massive galaxy formation, a ULIRG is thought to be formed after merging of two gas-rich disk galaxies. An intense star formation in the nucleus is triggered by a rapid feeding of gas into the central region. This star formation results in a formation of dust particles, which, in turn, absorb rest-frame optical and ultraviolet (UV) emission from young blue stars, and re-radiate at far-infrared (FIR) / sub-millimeter wavelengths. Following the feeding of gas into the nuclear region, an active galactic nucleus (AGN) emerges (Sanders et al., 1988; Hopkins et al., 2008). As AGN heats the dusty materials around the supermassive blackhole (SMBH), the spectral energy distribution (SED) of the ULIRG shows a clear mid-infrared (MIR) bump since the temperature of dust heated by AGN is higher than that heated by the star formation (Imanishi et al., 2007; Alonso-Herrero et al., 2012; Lopez-Rodriguez et al., 2013; Ichikawa et al., 2014). The vigorous starburst and / or AGN in a ULIRG can induce a strong outflowing wind, which would blow out the gas and dust and terminate the activity of the galaxy. It is commonly accepted that a powerful AGN is required to drive outflows to high velocity, e.g., km s*-1* (, Rupke et al. (2005); Westmoquette et al. (2012); Arribas et al. (2014); Harrison et al. (2014)).
Recently, signatures of such outflowing gas in multi-phase have been found in various ULIRGs (neutral, Rupke & Veilleux (2011), Perna et al. (2015); ionized, Soto et al. (2012), Rodríguez Zaurín et al. (2013); and molecular, Veilleux et al. (2013), Saito et al. (2017)). Those observations support the idea that outflow plays an important role in the transition of a ULIRG from an extreme starburst to a quiescent galaxy. One widely employed diagnostic to identify the ionized outflowing gas is the broad [Oiii] 5007Å emission line profiles (Christopoulou et al., 1997; Tadhunter et al., 2001; Zamanov et al., 2002). As a forbidden (collisionally excited) transition, the [Oiii] line is a good tracer of the kinematics of gas in Hii regions formed by hot, young stars in a massive starburst, or gas in the narrow line region (NLR) formed by an AGN (Osterbrock & Ferland, 2006), which is found to be extended over parsecs to several kiloparsecs by the spatially resolved long-slit and integral-field spectroscopy observations (e.g., Westmoquette et al. (2012); Liu et al. (2013); Harrison et al. (2012)). Compared to the [Oiii] line with relatively high ionization potential (IP, 35.12 eV), the [Oii] 3726Å 3729Å doublet with lower IP (13.62 eV) can trace ionized gas with lower ionization degree, which shows more extended structure than gas traced by [Oiii] line (Collins et al., 2009). Several works reported that [Oii] emission line also shows outflow signatures, although it usually does not display the extremely broad feature seen in [Oiii] emission line (Zakamska & Greene, 2014; Perna et al., 2015; Toba et al., 2017). Broad [Oii] line profiles possibly imply that the ionized outflow could couple to the interstellar medium (ISM) at larger radius, i.e., over galaxy-wide scales ( kpc).
In this paper we report a discovery of one ULIRG selected from AKARI 90-m FIR survey, AKARI-FIS-V2 J0916248+073034 (hereafter J0916a), which indicates signatures of an extremely strong outflow in both [Oiii] and [Oii] emission line profiles but possibly with low AGN contribution to its bolometric luminosity. The paper is organized as follows. We present the photometric and spectroscopic observations and data reduction in Section 2. The methods and results of optical spectral analyses and multi-band SED fitting are shown in Section 3 and Section 4, respectively. We discuss the properties of the extreme outflow in Section 5. Section 6 summarizes the conclusion. Throughout the paper, the rest frame wavelengths are given in the air. We adopt the cosmological parameters 70 km s*-1* Mpc*-1*, and .
2 Observation and Data Reduction
In order to construct a sample of ULIRGs at intermediate redshifts (), we are conducting an optical follow-up program for 90-m FIR sources in the AKARI Far-Infrared Surveyor (FIS) Bright Source catalog (Ver.2, hereafter FISBSCv2, Yamamura et al., in prep.) by utilizing the Sloan Digital Sky Survey (SDSS) optical imaging data. We focus on optically-faint sources, which are expected to be at relatively high redshifts () and luminous in the IR wavelength range. The detection limit of FISBSCv2 catalog reaches 0.44 Jy at 90 m, which is deeper than the previous FIR all-sky survey by the Infrared Astronomical Satellite (IRAS). Furthermore, thanks to the smaller PSF of AKARI (spatial resolution of FWHM –, Doi et al. (2015)) than IRAS, we can achieve reliable identifications even with faint () optical counterparts. Additionally, recently released Wide-field Infrared Survey Explorer (WISE) all-sky survey catalog (Wright et al., 2010) in the MIR wavelength range (3.4 (W1), 4.6 (W2), 12 (W3), and 22 (W4) m) with a spatial resolution of FWHM –, is useful to narrow down the positional uncertainty of the AKARI FIR sources. The detection limit of the WISE survey is significantly deeper (1 mJy at 12 m) than the AKARI FIR catalog for sources with typical IR SED (e.g., Polletta et al. (2007)). Therefore, the AKARI FIR survey with the WISE pinpointing and SDSS optical photometric data is unique in identifying rare luminous FIR galaxies with faint optical counterpart. The cross-matched sample covers deg2, which is 10 times wider than the Herschel Astrophysical Terahertz Large Area Survey (H-ATLAS) FIR survey at the similar depth (Smith et al., 2017).
We started spectroscopic follow-up of the optically-faint FIR sources using FOCAS on the Subaru telescope. Eight objects are observed in a service program in S17A (S17A0216S, PI:Masayuki Akiyama). For each object, the long slit spectra were obtained from two exposures, with integration time of 420 seconds per exposure. The 300B grism with SY47 filter were used. The configuration provides spectral resolution of at 5500 Å with slit width of 0.5*′′* and covers 4600–9200 Å in the first-order of SY47. The data is reduced through bias-subtraction, flat-fielding, cosmic rays removal and wavelength calibration, before extraction of an individual spectrum using the IRAF package focasred. The wavelength calibration accuracy and spectral resolution measured using the positions and widths of the night-sky emission lines are 1 Å and 10.6 Å (FWHM), respectively, in the entire spectrum. The flux calibration is done with the spectra of standard stars, Feige34 and GD153, taken after the observations of the main targets. The atmospheric reddening was corrected using the Maunakea mean atmospheric extinction curve from Buton et al. (2013). We also corrected for the atmospheric oxygen and water vapor absorptions by comparing the observed spectra of standard stars with those archived in the CALSPEC database111http://www.stsci.edu/hst/observatory/crds/calspec.html. The slit-loss effect was estimated to be approximately 50 % by comparing the integrated flux to the SDSS photometry in the g- and i-bands, and corrected in the reduced spectrum. The seeing during the observation was 0.5*′′*.
All of the eight objects are identified as emission line galaxies at . One of the objects, J0916a with i-band magnitude of 20.29 mag shows emission lines at with features of a strong outflow. Since the H-[Nii] complex of J0916a lies around 9800 Å in the observed frame, we also examine the observed spectrum in the 9200–10000 Å range after correcting for the contamination of the second-order spectrum, using the throughput of the first- and second-order of the 300B+SY47 setting222https://www.subarutelescope.org/Observing/Instruments/FOCAS/spec/
efficiency.html and the observed first-order spectrum below 5000 Å. The optical image of the object is shown in Figure 1. The object has a neighboring galaxy J0916b with i-band magnitude of 21.43 mag. During the observation of this object the slit was aligned to the direction along the two galaxies.
We collected the photometric data for J0916a from SDSS (u, g, r, i, z, 3500–9100 Å, DR7, Abazajian et al. (2009)), WISE (W1–W4, 3.4–22 m, Wright et al. (2010)), AKARI (Wide-S, 90 m, Yamamura et al., in prep.) and the Very Large Array Faint Images of the Radio Sky at Twenty-cm (VLA FIRST Survey, Becker et al. (1995)). WISE images of J0916a show one foreground star at the edge of the AKARI beam in the short wavelength bands (W1 and W2 panels in Figure 2), but we expect that it does not contaminate the photometry of AKARI because the star has blue infrared color and the photometry in W4 is dominated by J0916a.
3 Spectroscopic Properties
3.1 Spectral Fitting and Line profiles
The reduced spectrum of J0916a is shown in Figure 4, which covers the wavelength range from [Oii] doublet to H-[Nii] complex. In order to examine the emission line properties of J0916a, firstly the stellar continuum with absorption lines are subtracted from the galaxy spectrum using the Penalized Pixel-Fitting stellar kinematics extraction code (pPXF), which is a public code for extracting the stellar kinematics and stellar population from absorption line spectra of galaxies (Cappellari & Emsellem, 2004; Cappellari, 2012). The code uses the Medium resolution INT Library of Empirical Spectra (MILES) library (Vazdekis et al., 2010), which contains single stellar population synthesis models and covers the full range of the optical spectrum with a resolution of 2.3 Å (FWHM). The best luminosity-weighted fitting result is shown as red curve in Figure 4 , and a zoomed-in spectrum covering strong Balmer absorption lines (H, H8, H9, etc.) is shown in Figure 5. The systemic redshift is estimated to be . In order to determine the uncertainty in the systemic redshift, we generate artificial spectra by adding random noise with scatter equal to the standard deviation of the fitting residuals and then perform the same fitting procedure for the artificial spectra using pPXF. The procedures are repeated for 100 times and the scatter is adopted as the uncertainty of the measurement. 333 For the uncertainty of the systemic velocity determination, we also consider the difference from the velocity of the narrow H line. We take the velocity of narrow H emission line in relative to stellar absorption lines as the upperlimit of the uncertainty of the systemic velocity, which is measured as approximately 90 km s*-1*, or 0.0003 in redshift.
The measured velocity dispersion of the stellar component is about 370 km s*-1* after correction for the instrumental profile. The luminosity-weighted age distribution indicates a main stellar population of 2 Gyr and a starburst population of 70 Myr.
The emission line profile fitting is carried out using the Python Spectroscopic Toolkit (PySpecKit) developed by Ginsburg & Mirocha (2011). At first, we examine the profiles of the [Oiii] 4959Å 5007Å doublet since they are bright and isolated from other emission lines. We tie the central wavelengths and dispersions of the Gaussian profiles for the [Oiii] doublet, and fix the intensity ratio of the two lines to the theoretical value of 1:2.92 (Osterbrock & Ferland, 2006). The velocity shift and FWHM of [Oiii] line is km s*-1* and km s*-1*, respectively, if a pair of tied Gaussian profiles is used to fit [Oiii] doublet. The residual shows a blue excess with shift of over km s*-1* but the excess is within level, thus an additional Gaussian profile is not adopted in the following fitting procedure. No narrow Gaussian component is required to explain the profile of the [Oiii] doublet.
We then fit the [Oii] doublet and H-[Nii] complex regions. The intensity ratio of [Nii] 6548Å 6583Å doublet is fixed to the theoretical value of 1:3.06 (Osterbrock & Ferland, 2006). We also fix the intensity ratio of [Oii] 3726Å 3729Å doublet to 1:1.31. The line ratio is calculated with the empirical function of Sanders et al. (2016) by assuming electron temperature of K and electron density of 100 cm*-3*, which are the typical photoionization equilibrium temperature and electron density of Hii regions (Sanders et al., 2016) and AGN NLR (Netzer, 1990). We simultaneously fit the forbidden lines, by tying the centers and dispersions of the multiple emission lines for each component444Note that tying the dispersion here means the assumption that for a certain component every emission line shows the same velocity dispersion after correcting for the instrumental broadening. Thus for each component the width of the Gaussian profiles is defined as:
with the same velocity FWHM for each line, where the and are the observed central position of the emission lines and instrumental broadening FWHM, respectively. . In the case where only a narrow Gaussian profile ( km s*-1*) is adopted for [Oii] line, a residual excess of 6–7 arises on the blue edge of the [Oii] line, which indicates that another broad component is required to fit this blue wing. Owing to the blending of H and [Nii] lines, it is hard to determine whether the broad [Nii] lines exist or not. Since IP of [Nii] (14.53 eV) is close to IP of [Oii] (13.62 eV), we assume [Nii] line has the same profile as the [Oii] line and consider the case with broad components of [Nii] doublet (Figure 6) as a nominal fitting result, hereafter. In order to reduce the degeneracy, the shift and width of broad [Oii] and [Nii] lines are tied to the values measured from the [Oiii] line.
{longtable}
c—ccccc Line properties determined in the best fitting profile (bottom panel of Figure 6). Name (km s*-1*) FWHM (km s*-1*) (km s*-1*) Flux (erg s*-1* cm*-2*) (erg s*-1*)
[Oii] 3726Å 3729Å
[Neiii] 3869Å
H
[Oiii] 5007Å
H
[Nii] 6583Å
\endhead
In order to describe the multi-component profiles, following Zakamska et al. (2014, 2016) and Perna et al. (2015), we use velocity defined from the normalized cumulative distribution:
[TABLE]
where is the flux per velocity unit from the best fit model, equals to the fraction of flux with velocity . The velocity shift is defined to be . The width comprising 80 percent of the total flux, , is equivalent to for a single Gaussian profile. We also define the total FWHM as the width at half maximum of the total profile consisting of both of the narrow and broad components. The , FWHM, and of each emission line are listed in Table 3.1. The uncertainty for the velocity shifts and widths are estimated using a Monte Carlo method. We generate artificial spectra by adding random noise with scatter equal to the standard deviation of the fitting residuals and then perform the same fitting procedure for the artificial spectra. The procedures are repeated for 100 times and the dispersion is used as the measurement error for each parameter.
Signatures of an extremely strong outflow are indicated in the emission line profiles. The [Oiii] line shows FWHM of km s*-1* with velocity shift of km s*-1* in relative to the stellar absorption lines 555 The uncertanty of the velocity shift is estimated to be , where and are the scatters for emission lines and the systemic velocity, respectively. We take km s*-1*, which is the deviation between the velocities of stellar absorption lines and narrow H emission line, and can be considered as the upperlimit of the uncertainty of the systemic velocity. . More interestingly, the low-ionization [Oii] doublet also shows large FWHM of km s*-1* with velocity shift of km s*-1*. The velocities of [Oiii] and [Oii] indicate the object shows one of the most powerful outflows observed among ULIRGs / DOGs (Toba et al. 2017; see discussion of Section 5.1) at . The extremely large width of the low-ionization [Oii] line probably suggests that the strong outflow can extend beyond the nuclear / bulge region of the galaxy.
3.2 Long-slit spectroscopy 2D image of the emission lines
In order to examine the spatial distribution of the outflow along the slit direction, we plot long-slit spectroscopy 2D image of the emission lines after subtracting the stellar continuum components. As shown in Figure 1, one companion galaxy (hereafter J0916b) exists at approximately ( kpc) from J0916a. Therefore the stellar contribution from both of the two galaxies are considered. We extract the integrated stellar spectrum of J0916b using the same method as for the J0916a. It is hard to fit the stellar continuum for each line of the data due to the low S / N ratio at the outer regions. Thus, we assume the inner and outer regions of each galaxy have the same stellar continuum, and apply a Gaussian profile to normalize the spatial distribution. The Gaussian profile is determined using the integrated flux distribution in line-free regions. The emission line components can be obtained after subtracting the stellar components of these two galaxies. Three zoom-in views around [Oii], [Oiii], and H-[Nii] emission lines are shown in Figure 7. Only regions with S/N are shown in each panel. The noise () is estimated to be the scatter of the off-source region in the spectroscopy 2D image.
J0916b lies at the same redshift () as J0916a. Among the three zoom-in views in Figure 7, J0916b only has relatively luminous [Oii] line, which is connected to the extended [Oii] component of J0916a. The [Oii] ‘bridge’ component possibly indicates a direct interaction between the two galaxies, which is consistent with the tidal optical morphology (Figure 1), and also consistent with the evolutionary scenario that ULIRGs are thought to be the descendants of galaxy mergers. On the other hand, the outflowing gas of J0916a shows extended structure ([Oii] and [Oiii] panels in Figure 7), which supports a possible evidence of the galaxy-wide outflow. We discuss the velocity structure and ionization source further in Section 5.1.
4 SED Analyses with multi-band photometric data
4.1 Building templates
The offset between J0916a and J0916b ( 2*′′) is smaller than the spatial resolution of WISE (6.1–12.0′′) and AKARI (1.0–1.5′*). Since J0916b is fainter in the optical and has only weak emission lines, which suggests no strong AGN or star formation activity, we assume that all of the observed MIR and FIR fluxes are associated with J0916a.
We perform a SED fitting for J0916a using the Code Investigating GALaxy Emission (CIGALE, Noll et al. (2009); Serra et al. (2011)) of version 0.12. Stellar continuum in the UV-optical as well as dust emission in the IR band are modeled in CIGALE, assuming the energy balance between absorption and re-emission by interstellar dust. AGN component is also modeled with the energy balance between absorption and re-emission by the dusty torus. The total IR luminosity between 1 m and 1000 m, , is defined as the sum of the emissions from dust heated by stars and AGN. Several parameters need to be set to generate templates. The observed photometric data points are then fitted with the templates. The best fit template is selected with minimization in the CIGALE code.
In order to model the stellar continuum, the star formation history (SFH) needs to be assumed. We adopt two stellar components, i.e., an old stellar population (OSP) with an exponentially declining SFR and a young stellar population (YSP) with a constant SFR (Buat et al., 2011, 2014). In order to avoid too many parameters in the SED fitting, only three parameters, i.e., the ages of OSP and YSP as well as the mass fraction of YSP (), are used as free parameters to reproduce SFH (see Table 1). The values of the age parameters are selected based on the estimation from luminosity-weighted fitting result of stellar continuum (Figure 4). The e-folding time () of OSP is fixed to be 500 Myr, assuming a typical quenching timescale for local galaxies (Lian et al., 2016). The single stellar population model of Bruzual & Charlot (2003) with the initial mass function of Salpeter (1955) is adopted. Metallicity is fixed to be the solar metallicity of 0.02.
Calzetti et al. (2000) dust attenuation law and Dale et al. (2014) dust emission model are adopted in the SED fitting. In the dust attenuation model, a reduction factor is applied to the color excess of the old stellar population. The reduction factor is defined as , under the assumption that the young stars are embedded in dense molecular birth clouds (BC) and old stars are in diffuse ISM (Calzetti et al., 2000; Charlot & Fall, 2000; da Cunha et al., 2010). In order to reduce the number of free parameters in the SED fitting, we fix , following Buat et al. (2012) and Lo Faro et al. (2017). In the dust emission model of Dale et al. (2014), the dust is assumed to be exposed to a distribution of starlight intensities described by a power-law function: . The exponent determines the relative contributions of different SED templates, which are comprised of calculated emission from small and large dust grains, as well as Polycyclic Aromatic Hydrocarbon (PAH) whose spectrum is derived from the average MIR spectrum of star-forming galaxies observed by the Infrared Space Observatory (ISO) satellite. A lower indicates stronger heating intensities with the FIR emission peak at shorter wavelengths, and corresponds to more active star-forming activities in a galaxy (Dale et al., 2014). Due to the lack of detections in the sub-millimeter bands, it is hard to constrain the FIR emission peak for J0916a. Therefore we only test three values of based on the results in the literature, i.e., , which corresponds to a SED peaks at around 60 m in the rest frame with a translated grey-body temperature of 40 K, from an IRAS 60-m selected ‘warm’ ULIRG sample at (Symeonidis et al., 2011); for a SED with a peak at 90–100 m and temperature of about 30 K, from the / MIPS 70-m selected ‘cold’ ULIRG sample at (Symeonidis et al., 2011) and the 90-m selected ULIRGs in the AKARI Deep Field-South (ADF-S) survey at (Małek et al., 2017); and for SEDs of normal galaxies in ADF-S field (Małek et al., 2017).
The Fritz et al. (2006) model is adopted to generate AGN emission templates. The model consists of three different components: the emission directly from the central source, the scattered component, and the thermal radiation of a dusty torus heated by the central source. Six parameters were used by Fritz et al. (2006) to describe the structure and geometry of the dusty torus and to calculate the radiation transfer. However, in order to reduce the number of free parameters in the SED fitting with limited photometric data points, we fix the radial () and angular () dust distribution, the opening angle of the torus () as well as the ratio of the radii () following Małek et al. (2017). Only two extreme values of the viewing angle of the torus , 0.001*∘* and 89.990*∘*, are considered, which corresponds to type-2 and type-1 AGNs, respectively. Silicate optical depth and AGN fraction , which is defined as the ratio of AGN IR luminosity to the total IR luminosity of the galaxy, are chosen as free parameters in the SED fitting procedure with ranges of 1.0–6.0 and 0.01–1.0, respectively. Although AGN IR emission is also considered in the Dale et al. (2014) model, we exclude this component because the templates are mainly from type-1 AGNs and do not have the absorption features in the MIR band which are observed in type-2 AGNs.
Since J0916a was also detected at 1.4 GHz in the VLA FIRST survey, we consider the radio non-thermal component in the SED fitting. Two parameters, FIR / radio correlation coefficient () and slope of the power-law synchrotron emission () are fixed to be 2.58 and 0.70, respectively, based on the model of Colina & Perez-Olea (1992), in which the non-thermal radio emission from radio supernovae and supernova remnants are the main contributor to the radio luminosity in the ULIRGs. A fixed results in the constraint on the ratio between the FIR and radio luminosities of J0916a. We also test other values of from the literature, e.g., 2.1 for sub-millimeter galaxies (SMGs) and ULIRGs at (Kovács et al., 2006), 2.3 for radio-identified, flux-limited ( Jy) IRAS sources (Yun et al., 2001), and 2.8 for the local spirals and starburst galaxies (Condon & Broderick, 1991). If we fit the SED with changing of 2.1, 2.3, 2.58, and 2.8, the reduced for the best fit cases are 11.4, 6.3, 0.8, and 3.7, respectively, with the estimated from interstellar dust varying between and erg s*-1*. The value of is hard to be constrained with the current limited data points, especially in the FIR wavelength range. Therefore we select , since it results in the smallest . The values and ranges of the free parameters are summarized in Table 1.
In order to estimate the uncertainties of the output parameters, we perform the same fitting procedure to the simulated mock SED. The mock SEDs are generated by adding random values with the same scatters as the measurement errors to the observed photometric data points in each band. We repeat the fitting procedure for 100 mock SEDs and use resulting standard deviations as the uncertainties of the output parameters.
4.2 The best fit properties from the SED fitting
The best fit parameters and SED model of J0916a are shown in Table 2 and Figure 8, respectively. The resulting reduced suggests that the model with relatively large number of free parameters (8) does not overfit the observation with limited number of data points (11).
The total IR luminosity between 1 m and 1000 m in the rest frame reaches L*⊙. 94 % of the IR luminosity comes from the re-emission of the interstellar dust heated by star formation, and the component dominates the FIR peak. Using the empirical relationship of SFR (M⊙* yr*-1*) (erg s*-1*) (Kennicutt, 1998), the SFR is estimated to be 990 M*⊙* yr*-1*. With the estimation of stellar mass of M*⊙*, J0916a lies above the star-forming main sequence at (Tasca et al., 2015), and the deviation indicates strong starburst activity in this object. The reduced for the cases where equals to 1.125, 1.625, and 2.125 are 0.79, 4.09, and 22.87, respectively, which suggests that J0916a is similar with the ‘warm’ ULIRG samples with relatively large grey-body temperature ( K, Symeonidis et al. (2011)).
In CIGALE the contribution of AGN component (green solid curve in Figure 8) is defined as , where is the thermal emission of dusty torus, and the fraction is estimated to be . We can also estimate the AGN contribution using the bolometric luminosity of the AGN, which is calculated as the sum of the luminosities of the three components in the model of Fritz et al. (2006):
[TABLE]
where is the isotropic luminosity of the central energy source integrated in the range of 0.001–20 m, and are luminosities of scattering and thermal emission from dusty torus, respectively, integrated in the range of 1–1000 m. In the best fit SED of J0916a, the AGN emission only dominates the MIR band and does not extend to the range shorter than 1 m, indicating that the radiation directly from the central accretion disc is obscured in the UV-optical range. The obscuration of AGN is consistent with the extended optical morphology (see Figure 1). The bolometric luminosity of the host galaxy can be estimated as:
[TABLE]
Therefore, we obtain , which is consistent with . The bolometric luminosity of obscured AGN is assumed to be the sum of total IR luminosity and X-ray luminosity in several works (Vasudevan et al., 2010; Lusso et al., 2011). We do not have the X-ray constraint on the AGN activity of J0916a. However, the intrinsic 2–10 keV to AGN bolometric luminosity is 0.03 %–0.81 % in the AGN hosted ULIRGs (Teng et al., 2015) or 4 %–8 % in obscured AGNs (Lusso et al., 2011). Thus the lack of X-ray observation will not affect the estimation of of J0916a.
The resulting contribution of AGN is significantly smaller than the average AGN fraction observed among ULIRGs (35 %–40 %, Veilleux et al. (2009); 40 %–50 %, Goto et al. (2010); 20 %, Ichikawa et al. (2014); 19 %, Małek et al. (2017)) and even smaller than that of LIRGs (12 %, Alonso-Herrero et al. (2012); 10 %, Buat et al. (2015); 12 %, Małek et al. (2017)). In order to test the necessity of the AGN component in the SED fitting, we perform the same fitting procedure with AGN contribution fixed to be 0 %, and the result is shown in Figure 9. The reduced significantly increase to 7.50, which suggests that the AGN component is necessary to reproduce the MIR photometry.
5 Discussion
5.1 Outflow structure and ionization source
It is commonly found that highly ionized gas, e.g., [Oiii] and [Neiii], tends to show strong outflows. J0916a shows extreme outflow not only in the [Oiii] emission line, but also in the [Oii] emission line. In order to compare the broad line widths of both [Oiii] and [Oii] emission lines with galaxies in the local universe, we collect the samples in the literature with both [Oiii] and [Oii] measurements. We examine the line widths of 1.8 million SDSS DR7 galaxies at , whose absorption and emission profiles are measured by the MPA-JHU group666https://wwwmpa.mpa-garching.mpg.de/SDSS/DR7/. Only the objects with for both [Oiii] and [Oii] emission lines are selected, and their velocity distributions () are shown in Figure 10 with contours. We separate the sample into star-forming galaxies (SFGs) and Seyfert 2 galaxies (Sy2s) following the classification of Brinchmann et al. (2004) with the “Baldwin, Phillips & Terlevich” (BPT) diagram (Baldwin et al., 1981; Osterbrock & Ferland, 2006). The distributions of SFGs and Sy2s show peak at 100 km s*-1* and 200 km s*-1*, respectively. J0916a lies far beyond the velocity range of both SFG and Sy2 samples in the local universe.
Recently several works have been presented on strong outflows detected in dust obscured quasars / galaxies at high redshifts. Perna et al. (2015) and Zakamska et al. (2016) reported the discovery of very broad (FWHM km s*-1*) and strongly blueshifted [Oiii] emission line in the spectra of obscured quasars at . Toba et al. (2017) analyzed the ionized gas properties for 36 IR-bright DOGs at , of which 25 objects are classified as ULIRGs/HyLIRGs, and found that the IR-bright DOGs show relatively strong outflows compared to Sy2s at . The dispersions of [Oiii] and [Oii] emission lines of these objects are also shown in Figure 10. In order to compare with the velocity dispersion measured in the same method, we obtain SDSS spectra of the DOG sample in Toba et al. (2017) and re-preform spectral fitting for the DOGs with significant detections of both [Oiii] and [Oii] lines to measure the dispersions. The powerful outflow of J0916a characterized by the broad ionized oxygen lines is among the fastest ones compared with the ULIRGs/DOGs at intermediate redshifts, and even comparable to the luminous high-redshift QSOs.
In order to examine the spatial extent of the ionized outflow, we perform spectral fitting to every line of the stellar continuum subtracted long-slit spectroscopy image shown in Figure 7. The pixel sampling of corresponds to a physical scale of 1.3 kpc at the object. The radial distributions of flux (left), velocity shifts (middle) and FWHM (right) for each emission line are shown in Figure 11. The [Oii] line shows a more extended structure than stellar continuum, while [Oiii] and H emission lines show relatively compact flux distribution. The velocity profiles show an extent to about 5 kpc with velocity shift larger than 500 km s*-1* and FWHM larger than 1000 km s*-1*, especially in the North-East side, indicating the outflow is extended up to 5 kpc scale. However, there also exists the possibility that the observed [Oiii] line with high-velocity at 5 kpc comes from the smeared-out flux of an unresoved core component, e.g., compact star-forming region or AGN NLR, by the PSF, which could lead to an overestimation of the size of outflow.
In order to evaluate a possible effect of an unresolved component on the estimation of the size of the outflow region, firstly we plot the flux radial distribution per velocity window with a width of 300 km s*-1* (Figure 12) to check if high-velocity [Oiii] line can be detected in the outskirt region. The unresolved core component is assumed to follow the profile of PSF and contribute to 100% of the observed [Oiii] flux in the central position. The residuals of observed [Oiii] flux minus the PSF-convolved core component (green solid curves in Figure 12) can be used to trace the extended component. We fit the residuals using one Gaussian profile on each of the South-West and North-East side, and find that the extended component with a velocity shift of 600–900 km s*-1* can be detected to about 3.5 kpc with S/N . The noise () is estimated to be the scatter of the off-source region in the 2D spectroscopy image. If we take as the detection limit, then the maximum radius of the extended component is 4–5 kpc with a velocity shift of 600–900 km s*-1*.
Assuming the original observed spectrum of the central pixel as the representative spectrum of the unresolved core component, we further subtract the PSF-convolved core component from the spectroscopy 2D image. The flux of the central pixel is entirely reduced. The spectroscopy 2D image of extended [Oii], [Oiii], and H-[Nii] emission lines after removal of the PSF-convolved core component are shown in Figure 13. We re-perform spectral fitting per pixel along the long-slit direction, and the measured velocity shifts and FWHM of [Oiii] and [Oii] lines are shown in Figure 14. The results indicate that, even after the removal of the PSF-convolved core component, the [Oiii] line with high velocity shift ( 800 km s*-1*) and FWHM ( 1200 km s*-1*) can still be detected to 4 kpc scale on the North-East side. As for the South-West side, the velocity shift of [Oiii] decreases from 600 km s*-1* to 300 km s*-1* at 2–4 kpc. The difference between the velocity shift on North-East side and South-West side would imply that the outflow is within an inclined structure. Although the velocity shift of [Oiii] is lower on the South-West side, the FWHM of [Oiii] is still over 1000 km s*-1*up to 4 kpc. Figure 15 shows the [Oiii] spectra of the unresolved core component (left), and the extended spectra after removal of the core component at 4 kpc on both sides (middle and right), respectively.
The more extended flux distribution as well as the lower ionization potential of [Oii] suggest that the outflow shown by [Oii] emission line can be extended farther than [Oiii] line. However, Figure 14 shows that the profiles of velocity shifts and FWHM of [Oii] line is more compact than those of [Oiii]. Furthermore, the velocity FWHM of extended [Oii] gas at 3–4 kpc decreases from 1000 km s*-1to 600 km s-1*after the removal of unresolved core component, indicating that the highest-velocity outflowing [Oii] gas is dominated by the core spectrum. Therefore, although the [Oii] gas is more spatially extended, the compact velocity profiles and core-dominated high-velocity outflowing gas imply that the extended [Oii] gas in the outer region of the galaxy has been less affected by the outflow than [Oiii] emitting gas.
The [Nii] / H and [Oiii] / H emission line ratios within the outflow region ( kpc) are higher than those of outside region. If we plot the line ratios of J0916a on the BPT diagram, then all the data points within outflow region are located on AGN (Seyfert 2) sequence (Figure 16). It is widely accepted that the high-velocity outflows shown by emission lines with high-IP, e.g., [Oiii] and [Neiii], are driven by AGN radiation or wind. On the other hand, the low-IP (13.62 eV) [Oii] line can also be significantly contributed from the star-forming regions, thus it is interesting to examine whether the fast [Oii] outflows are associated with the star formation activity. We use the MPA-JHU SDSS galaxy catalog to find the possible ionization source of fast [Oii] outflows observed among them. The distributions of galaxies with low and high FWHM of [Oii] emission line on the BPT diagram are shown in Figure 16. Galaxies with FWHM larger than 600 km s*-1* tend to show higher [Nii] / H and [Oiii] / H line ratios, and mostly lie on the AGN sequence, suggesting that the fast [Oii] outflowing gas is ionized by AGN radiation.
5.2 Mass outflow and energy ejection rates
In the recent works, the mass of the ionized outflowing gas has been estimated by either Balmer lines (H, e.g., Soto et al. (2012), Arribas et al. (2014); H, e.g., Harrison et al. (2014), Carniani et al. (2015)) or [Oiii] 5007Å line (e.g., Cano-Díaz et al. (2012); Kakkad et al. (2016)). Since the H emission of J0916a is weak, we estimate the mass of the ionized outflowing gas of J0916a using H and [Oiii] lines. Following Carniani et al. (2015), the mass of the ionized gas can be expressed as:
[TABLE]
where is the proton mass; , , and are the number density of helium ions, hydrogen ions, and electrons, respectively; is the volume of the considered region and the volume filling factor of the ionized hydrogen gas. With Equation 4 and the luminosity of H emission line:
[TABLE]
the mass of the ionized gas can be estimated as:
[TABLE]
In the derivation we assume (a) helium gas is fully ionized and , thus ; (b) , i.e., all of the ionized gas clouds have the same density (Cano-Díaz et al., 2012). The emissivity erg s*-1* cm*-3* is calculated using PyNeb (Luridiana et al., 2015) under the typical temperature ( K) and electron density ( cm*-3*) of Hii regions and AGN NLRs. The mass of the ionized gas can be similarly derived from [Oiii] emission line, whose luminosity can be given by:
[TABLE]
where is the density of ions and the total density of oxygen ions. In addition to the assumptions (a)-(b) adopted in the calculation with H, following Cano-Díaz et al. (2012) and Carniani et al. (2015) we also assume (c) , i.e., most of the oxygen ions are in its doubly ionized form777If we consider the observed flux ratio of [Oiii] and [Oii] the actual is approximately 0.7, which will result in a larger estimation of ionized gas mass. In order to compare the results with those in the literature (e.g., Harrison et al. (2012); Kakkad et al. (2016); Zakamska et al. (2016)), we keep in the proceeding calculations.; (d) , i.e., oxygen and hydrogen gas have the same ionization degree, and , where is the solar oxygen abundance (Centeno & Socas-Navarro, 2008); (e) , i.e., the regions from which oxygen and hydrogen lines are emitted have the same size. The emissivity erg s*-1* cm*-3* is calculated with PyNeb under the same condition as that assumed for H ( cm*-3*, K). Combining Equation 4 and Equation 7, we obtain the mass of the ionized gas as:
[TABLE]
The mass of the ionized outflowing gas is proportional to the intrinsic luminosity of outflowing components of H and [Oiii], and inversely proportional to the electron density. In order to obtain the intrinsic luminosity, the amount of dust extinction need to be determined. The color excess can be estimated from the H / H emission line ratio through the formula:
[TABLE]
where the attenuation curve, , which is calculated empirically for star-forming galaxies, resulting in and (Calzetti et al., 2000). We assume the intrinsic value of the Balmer decrement, , of 2.86, which corresponds to the electron temperature of K and electron density of 100 cm*-3* assuming Case B recombination (Osterbrock & Ferland, 2006). The ratio is commonly assumed for star-forming galaxies in the literature (Groves et al., 2012; Domínguez et al., 2013). Assuming the intrinsic value, we derive the color excess as from the narrow components of H and H, which is close to the typical amount of dust attenuation in the local U/LIRGs (Veilleux et al., 1995; Alonso-Herrero et al., 2006; García-Marín et al., 2009) and DOGs (Hwang & Geller, 2013). The SED fitting yields higher color excess for the young stellar population. The structure of the dust extinction in ULIRGs was found to be patchy and clumpy (García-Marín et al., 2009; Piqueras López et al., 2013), and possibly reflects the dust attenuation in dense molecular clouds where the young stars are formed. Since the relationship between the dust extinction of the stellar continuum and emission lines has not been concluded yet (Puglisi et al., 2016; Lo Faro et al., 2017), we adopt from the Balmer decrement to correct for the dust extinction of the outflowing gas, with the formula:
[TABLE]
Considering the projection effect in the line of sight, and for the comparison to the results in the literature, the total luminosity of [Oiii] including both of the unresolved core component and extended component is used to estimate the mass of the outflowing gas 888The integrated [Oiii] flux at 2.5–6.5 kpc contributes to approximately 35% of the total [Oiii] flux of the galaxy. The estimated gas mass will decrease by 0.45 dex if only the gas in the spatially extended component is considered in the calculation.. The luminosity of broad H is obtained from the spectral fitting decomposition with both of the broad H and broad [Nii] components (see discussion in Section 3). The [Sii] 6716Å 6731Å doublet of J0916a lies in the observed wavelength range where the contamination from night sky lines is severe, thus the electron density is assumed to be cm*-3*, which is a conventionally employed value for the estimation of ionized outflowing gas mass (Liu et al., 2013; Kakkad et al., 2016; Toba et al., 2017). With the dust extinction corrected luminosity and the assumption of cm*-3*, the mass of the ionized outflowing gas in J0916a is estimated to be M*⊙* using the broad component of H, or M*⊙* using the [Oiii] emission line. The is consistent with the average ratio () of AGN outflows (Fiore et al., 2017). The difference between and can be due to the assumptions employed in Equation 8, e.g., possibly results in the underestimation of .
In gas clouds with constant density, the mass outflow rate can be derived as , where is the bulk outflow velocity (Liu et al., 2013), and is the surface-area-to-volume ratio. Assuming the ionized outflowing gas in a spherically symmetric sector (Fiore et al., 2017), we have , where is the opening angle and the is the radius of outflow region. We adopt kpc, which is estimated from the core-component-removed spectroscopy 2D image at level. Then the mass outflow rate and energy ejection rate can be derived as:
[TABLE]
with the results of M*⊙* yr*-1* and erg s*-1* using broad H line, or M*⊙* yr*-1* and erg s*-1* using [Oiii] line, respectively. Those values reflect the instantaneous feedback effect from AGN and / or star formation activity in the radius at the observed time.
The estimation of and is based on a few assumptions and the results are dependent on the definition of outflow velocity and kinetic power, the size of outflow region, the correction for the PSF smearing effect, the correction for dust extinction, as well as the electron density. The derived are consistent with those estimated with another conventional definition of kinetic power (Holt et al., 2006; Harrison et al., 2014), where ( and are defined from Equation 1) and , within a factor of 0.6. Bae et al. (2017) proposed an outflow velocity estimate as , where and are the flux-weighted averaged shift and dispersion of the emission lines. If we calculate and with the definition of , the results increase by a factor of 1.5. and will decrease by 0.45 dex if only the gas in the spatially extended component is considered in the calculation. The uncertainty in the extinction correction using can lead to the variations of and by 0.4 and 0.5 dex for H and [Oiii] lines, respectively. The assumption of the electron density, which is thought as the main source of uncertainties in the calculation of ionized gas mass and hence the kinetic power of the outflow, was widely discussed in the literature (Rodríguez Zaurín et al., 2013; Fiore et al., 2017; Harrison et al., 2018). The typical value of for the AGN NLR is 50–1500 cm*-3* (Peterson, 1997). 100–500 cm*-3* was assumed in several papers (Cano-Díaz et al., 2012; Harrison et al., 2014; Carniani et al., 2015; Kakkad et al., 2016; Fiore et al., 2017; Toba et al., 2017) and roughly consistent with the result of [Sii] ratio of a luminous obscured quasar (Perna et al., 2015). Rupke & Veilleux (2013) and Liu et al. (2013) employed a lower density of 10 cm*-3* for ionized outflowing gas clouds in a thin shell, which was found in the superbubble in NGC 3079 (Cecil et al., 2001). On the contrary, Holt et al. (2011), Rose et al. (2018), and Kawaguchi et al. (2018) reported that the density of outflowing gas can reach as high as to cm*-3*. We have no direct constraint on for J0916a. However, the critical density of [Oii] ( cm*-3*, Osterbrock & Ferland (2006)) can be considered as a proxy for the upper limit of . The large uncertainty of can result in the uncertainty of the estimated gas mass and kinetic power of the outflow by one to two orders of magnitude.
A method assuming an energy-conserving bubble in a uniform medium was also widely used to estimate the maximum of energy ejection rates (Heckman et al., 1990; Veilleux et al., 2005; Nesvadba et al., 2006; Harrison et al., 2012, 2014). In the scenario (Castor et al., 1975; Weaver et al., 1977), the fast inside wind induced by the central engine release energy into a hot ( K), low-density, and coronal shocked gas bubble, where the radiative cooling loss is insignificant, by a constant rate, . The adiabatically expanding shocked bubble sweeps up a warm ( K), dense, and thin shell into the ISM in the host galaxy. The mechanical luminosity of the inside AGN or stellar wind, , can be estimated with the formula:
[TABLE]
where is the gas density of the un-disturbed ambient ISM, and we adopt cm*-3* following Nesvadba et al. (2006) and Harrison et al. (2014); and are the same as defined in Equation 11. According to the calculation of Weaver et al. (1977), 55 % of the total feedback energy is released into the swept-up gas region, and 40 %–70 % of the shell energy is converted to the kinetic energy of the swept-up gas as it collapse into a thin shell through radiative cooling. Therefore the kinetic power of the swept-up ISM corresponds to 22 %–38 % of the feedback energy, i.e., . For the sake of clarity, the kinetic energy ejection rates derived from the uniform spherical sector model and the energy-conserving bubble model, are named and , respectively. The from [Oiii] lines is erg s*-1*, which should be considered as the upper limit of the kinetic energy ejection rate because in the scenario it is assumed that all the ambient ISM within is entrained in the outflow and no filling factor is employed to reflect the clumpiness of the ambient gas. If we adopt filling factor of 0.2, which is a typical value for warm neutral medium (Hi) and warm ionized medium (Hii) of the Galaxy (Brinks, 1990), the estimation of will decrease by approximately one order of magnitude.
The derived mass outflow rate (400–500 M*⊙* yr*-1*, from the uniform spherical sector model) is comparable to the star formation rate (990 M*⊙* yr*-1*), leading to a mass loading factor of , which informs the efficiency of the outflow to remove gas from star-forming region. The co-existence of the strong outflow and intense star formation indicates that the feedback of the outflow has not severely affect the star-forming region of the galaxy, although the outflow would be extend to the radius of 4 kpc. The probable explanation can be that the axis of the outflow is perpendicular to the disc of the host galaxy. It is also possible that the galaxy stays in the intermediate stage in which the feedback just becomes effective and begins to sweep out the ISM in the entire galaxy, i.e., on-set of a quenching of star formation.
In order to discuss the dominant power source of the outflow further, we can compare the energy input power from the AGN and star formation to the energy ejection rate (Cicone et al., 2014; Kakkad et al., 2016; Harrison et al., 2018). The coupling efficiency is defined as the fraction of energy from AGN or star formation that couples to the surrounding gas. In the simulations of galaxy evolution with AGN feedback, is assumed to be from 0.5 % (assuming hot gas fraction of 10 %, Hopkins & Elvis (2010)) to 20 % (employed for AGN in the low-accretion mode, Weinberger et al. (2017)), with a typical value of 5 %, which is estimated in DiMatteo et al. (2005) to reproduce the normalization of the local – relation. As for feedback from star formation activity, the power provided by a starburst can be estimated with the formula, (erg s*-1*) SFR (M*⊙* yr*-1*), by assuming that gas has a solar-metallicity and the mass-loss rate and mechanical luminosity are constant beyond 40 Myr (Veilleux et al., 2005). Combining with the empirical relationship of SFR (M*⊙* yr*-1*) (erg s*-1*) (Kennicutt, 1998), we obtain . From the SED fitting, we obtain the AGN bolometric luminosity, erg s*-1*, as well as the star formation contributed IR luminosity, erg s*-1*. Therefore the observed kinetic coupling efficiency is and , respectively. Hence, both AGN and star formation are sufficient to drive the strong outflow, but larger coupling efficiency would be required for the AGN feedback case.
In order to compare the energy ejection rate of J0916a to that reported in the literature, we collect the outflow samples from the local U/LIRGs and QSOs (Soto et al. (2012); Arribas et al. (2014); Harrison et al. (2014)), the DOGs and QSOs at intermediated redshifts (Liu et al., 2013; Brusa et al., 2015; Kakkad et al., 2016; Toba et al., 2017), to the ULIRGs and QSOs at high redshifts (Harrison et al. (2012); Carniani et al. (2015); Zakamska et al. (2016); Bischetti et al. (2017)). In majority of the samples, the is estimated using multi-band SED fitting, except for Arribas et al. (2014)999The AGN contributions to the total luminosity of the galaxies in the sample of Arribas et al. (2014) were not presented, we apply an average AGN fraction of 20 % as mentioned in Section 4.2 of Arribas et al. (2014)., Liu et al. (2013)101010Liu et al. (2013) estimated using the rest 12 m luminosity, , and the bolometric correction of 9 from Richards et al. (2009)., and Carniani et al. (2015)111111Carniani et al. (2015) estimated using the empirical relation .. For the galaxies in all of the reference samples, the masses of ionized outflowing gas are estimated using Equation 6 for Balmer lines or Equation 8 for [Oiii] line, and then the energy ejection rates, and , are re-calculated using Equation 11 and Equation 12, respectively. For illustrative purposes, we assume that in the uniform spherical sector model, all of the galaxies have the same electron density ( cm*-3*) and electron temperature ( K). In the energy-conserving bubble model, we adopt the kinetic fraction of feedback energy, i.e., , and employ a filling factor of 0.2 to reflect the clumpiness of the ambient gas. The results are also shown in Figure 17.
J0916a shows one of the strongest outflow among the galaxies at . However, if we consider the bolometric luminosity of AGN () from the SED fitting, the of J0916a corresponds to only 1 %–10 % of of the galaxies with similar energy ejection rate, which would suggest the largest coupling ratio () among the plotted objects in Figure 17. In order to investigate the status of the AGN activity, we also estimate the Eddington ratio of J0916a. The Eddington luminosity is defined with (e.g., Rybicki & Lightman (1979)):
[TABLE]
As for J0916a, the black hole mass can be estimated from the total stellar mass with an empirical relationship between and in the local universe (Reines & Volonteri, 2015):
[TABLE]
From the SED fitting we obtain the estimation of M*⊙. Hence the black hole mass and Eddington luminosity are derived as M⊙* and erg s*-1*, respectively. The Eddington ratio of J0916a lies between those of ULIRGs / DOGs, which show a super-Eddington accretion (3.35, Kawakatu et al. (2007)121212Note that Kawakatu et al. (2007) calculated the ratio of instead of . The nuclear starbursts ( kpc) can contribute a fraction () of the infrared luminosity for their ULIRG sample. ; 2–3, Assef et al. (2015); 3, Toba et al. (2017)), and nearby QSOs, which show a sub-Eddington value (0.09, Kawakatu et al. (2007)).
The extremely strong outflow associated with less luminous AGN in J0916a is puzzling. It is possible that the AGN bolometric luminosity () of J0916a is underestimated in the SED fitting. We compare the SED-based and [Oiii]-based for this ULIRG and the reference sources in Figure 17, and the comparisons are shown in Figure 18. The bolometric correction factor of [Oiii] is 600 for extinction-corrected sources and 3500 for extinction-uncorrected sources (Kauffmann & Heckman, 2009; Lamastra et al., 2009). The luminosity ratio, , is for the reference sources, and 1.3 for J0916a, indicating the of J0916a estimated from the extinction-corrected [Oiii] luminosity is about 20 times higher than that estimated from the AGN-contributed IR luminosity. If we assume the [Oiii]-based , then J0916a (shown as open stars in Figure 17) becomes close to the most luminous high- QSOs with the most powerful outflows in the – diagram. The Eddington ratio is similar with that of the DOGs/ULIRGs with super-Eddington accretion (Kawakatu et al., 2007; Assef et al., 2015; Toba et al., 2017). The [Oiii]-based requires that the entire IR luminosity is owing to AGN, which is hard to be reproduced by the current SED fitting templates, where the FIR peak is mainly contributed by star formation heated dust. The hard X-ray observation is necessary to determine the intrinsic power of the possible hidden AGN in J0916a.
Another possible explanation for the large outflow coupling ratio is that J0916a is in the phase where the central AGN is less active than its peak epoch. The low IR luminosity of AGN, which originates from dusty torus in the vicinity (pc-scale) of SMBH, would imply the possibility that AGN lies in a fading status; while the observed extreme [Oiii] and [Oii] outflows would reflect a historical effect of the central engine during its preceding active phase, due to the time-lag between AGN activity in a nuclear region and outflow in an ionization cone (kpc-scale; Harrison (2017)). The traveling timescale of the outflow in J0916a can be estimated with , which results in Myr. Theoretical simulations (Novak et al., 2011; Gabor & Bournaud, 2014) and observational investigations (Hickox et al., 2014) suggest that the accretion rates of SMBHs and AGN luminosities can vary by several orders of magnitude in timescales of Myr or less. Additionally, recent works reported a population of AGNs called ‘dying AGNs’, which show AGN signatures in large spatial scale (e.g., radio jets and / or bright [Oiii] line in the kpc-scale NLRs), but lack the features in small scale (e.g., weak or lack of X-ray and / or MIR emission), and imply the transient stage that the central engine was active in the past, but now seems quenched (Schawinski et al. (2010); (Ichikawa et al., 2016, 2017, 2019); Schirmer et al. (2016)). Both AGN variability and AGN quenching can be one of possible mechanisms of the fading AGN scenario of J0916a.
It is also possible that star formation activity at least partially contributes to the strong outflow. While several studies presented that AGNs are required to accelerate high-velocity winds (e.g., km s*-1*, Rupke et al. (2005); Westmoquette et al. (2012); Arribas et al. (2014); Harrison et al. (2014)), recently high-velocity outflows traced using Mgii 2796Å 2803Å doublet absorption lines in galaxies with intense star formation activity but weak or no AGN activity have been reported (Diamond-Stanic et al., 2012; Bradshaw et al., 2013; Sell et al., 2014; Heckman & Borthakur, 2016). In these galaxies, the outflow originate from a compact star-forming region with effective radius of several hundred parsecs. Heckman & Borthakur (2016) found that the maximum outflow velocity (, 10–2500 km s*-1*) correlates with SFR (0.1–600 M*⊙* yr*-1*) and star formation rate density (SFRD, 0.1–5000 M*⊙* yr*-1* kpc*-2*). J0916a also lies on the velocity–SFR relationship, with a fast outflow ( km s*-1* for [Oiii]) and an intense star formation activity (SFR M*⊙* yr*-1*) similar with the most extreme starbursts in the sample of Sell et al. (2014) and Heckman & Borthakur (2016). Thus we can not rule out the possibility that star formation activity contributes to the fast outflow in J0916a, since the size of the star-forming region has not yet been constrained based on the current observations.
6 Conclusion
In the spectroscopic follow-up observations of AKARI-selected FIR-bright optically-faint objects, one ULIRG, J0916a, indicates signatures of an extremely strong outflow in its emission line profiles. Both of high- and low-ionization potential lines, e.g., [Oiii] and [Oii], show large velocity dispersions and shifts in relative to the stellar absorption lines. The velocity dispersions and shifts correspond to one of the fastest outflow among ULIRGs / DOGs at , and are comparable to the obscured quasars at . After the correction for a maximally possible contribution from an unresolved core component, the long-slit spectroscopy 2D image suggests that the outflow could extend to radius of 4 kpc. However, the co-existence of the strong outflow and vigorous starburst (SFR = 990 M*⊙* yr*-1*) suggests that the star formation has not yet been quenched by the outflow. The of J0916a estimated from the SED fitting is only 5 %–10 % of estimated from extinction-corrected [Oiii] luminosity, which leads to a large uncertainty in determinating the status of the AGN hidden in this ULIRG. Further observations are required in order to reveal the properties and origins of the outflow, e.g., hard X-ray observation to directly detect the intrinsic AGN radiation, spectroscopy observation with higher spatial and spectral resolution to determine the electron density in the outflowing gas, integral-field spectroscopy observation to investigate the structure of the outflow, and sub-millimeter observation to determine whether the warm ionized outflow really affect the cold molecular gas reservoirs.
{ack}
This research is based on data collected at Subaru Telescope, which is operated by the National Astronomical Observatory of Japan. This research is based on observations with AKARI, a JAXA project with the participation of ESA. This publication makes use of data products from the Wide-field Infrared Survey Explorer, which is a joint project of the University of California, Los Angeles, and the Jet Propulsion Laboratory / California Institute of Technology, funded by the National Aeronautics and Space Administration. Funding for SDSS-III has been provided by the Alfred P. Sloan Foundation, the Participating Institutions, the National Science Foundation, and the U.S. Department of Energy Office of Science. The SDSS-III web site is http://www.sdss3.org/. SDSS-III is managed by the Astrophysical Research Consortium for the Participating Institutions of the SDSS-III Collaboration including the University of Arizona, the Brazilian Participation Group, Brookhaven National Laboratory, Carnegie Mellon University, University of Florida, the French Participation Group, the German Participation Group, Harvard University, the Instituto de Astrofisica de Canarias, the Michigan State / Notre Dame / JINA Participation Group, Johns Hopkins University, Lawrence Berkeley National Laboratory, Max Planck Institute for Astrophysics, Max Planck Institute for Extraterrestrial Physics, New Mexico State University, New York University, Ohio State University, Pennsylvania State University, University of Portsmouth, Princeton University, the Spanish Participation Group, University of Tokyo, University of Utah, Vanderbilt University, University of Virginia, University of Washington, and Yale University. MA is supported by JSPS KAKENHI (17H06129). YT is supported by Grant-in-Aid for JSPS Research Fellow (Grant No.18J01050). KI is supported by Program for Establishing a Consortium for the Development of Human Resources in Science and Technology, Japan Science and Technology Agency (JST) and JSPS KAKENHI (18K13584).
The reference list from the paper itself. Each links out to its DOI / PubMed record.
- 1Abazajian et al. (2009) Abazajian, K. N., Adelman-Mc Carthy, J. K., Agüeros, M. A., et al. 2009, Ap JS, 182, 543
- 2Alonso-Herrero et al. (2006) Alonso-Herrero, A., Rieke, G. H., Rieke, M. J., et al. 2006, Ap J, 650, 835
- 3Alonso-Herrero et al. (2012) Alonso-Herrero, A., Pereira-Santaella, M., Rieke, G. H., & Rigopoulou, D. 2012, Ap J, 744, 2
- 4Arribas et al. (2014) Arribas, S., Colina, L., Bellocchi, E., Maiolino, R., & Villar-Martín, M. 2014, A&A, 568, A 14
- 5Assef et al. (2015) Assef, R. J., Eisenhardt, P. R. M., Stern, D., et al. 2015, Ap J, 804, 27
- 6Bae et al. (2017) Bae, H.-J., Woo, J.-H., Karouzos, M., et al. 2017, Ap J, 837, 91
- 7Baldwin et al. (1981) Baldwin, J. A., Phillips, M. M., & Terlevich, R. 1981, PASP, 93, 5
- 8Becker et al. (1995) Becker, R. H., White, R. L., & Helfand, D. J. 1995, Ap J, 450, 559