Topological property of a $t_{2g}^5$ system with a honeycomb lattice structure
Beom Hyun Kim, Kazuhiro Seki, Tomonori Shirakawa, and Seiji Yunoki

TL;DR
This paper investigates the topological phases of a $t_{2g}^5$ honeycomb lattice system, analyzing how hopping parameters, distortions, and electron interactions influence topological and Mott insulating states.
Contribution
It provides a theoretical framework showing how varying hopping parameters and Coulomb interactions induce topological phase transitions in $t_{2g}^5$ systems.
Findings
Topological phase transition driven by hopping parameter variation.
Coulomb interaction can induce transitions between trivial and nontrivial insulators.
Hund's coupling effectively renormalizes the Coulomb interaction.
Abstract
A system with a honeycomb lattice structure such as NaIrO was firstly proposed as a topological insulator even though NaIrO and its isostructural materials in nature have been turned out to be a Mott insulator with magnetic order. Here we theoretically revisit the topological property based on a minimal tight-binding Hamiltonian for three bands incorporating a strong spin orbit coupling and two types of the first nearest neighbor (NN) hopping channel between transition metal ions, i.e., the hopping () mediated by edge-shared ligands and the direct hopping () between orbitals via bonding. We demonstrate that the topological phase transition takes place by varying only these hopping parameters with the relative strength parametrized by , i.e., and . We also explore the effect of…
Click any figure to enlarge with its caption.
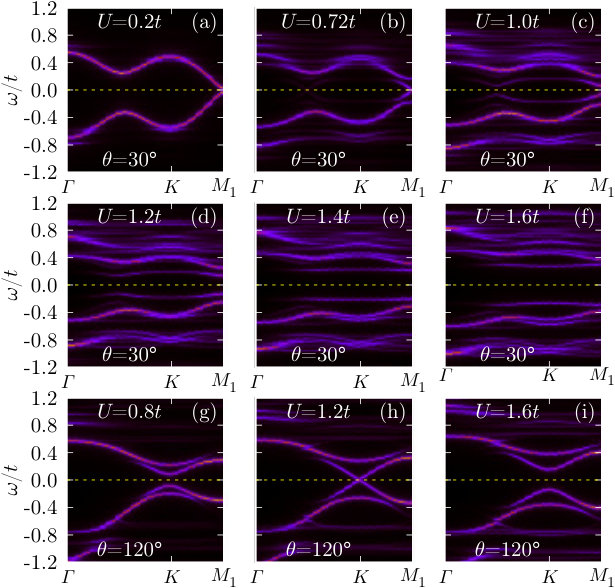 Figure 1
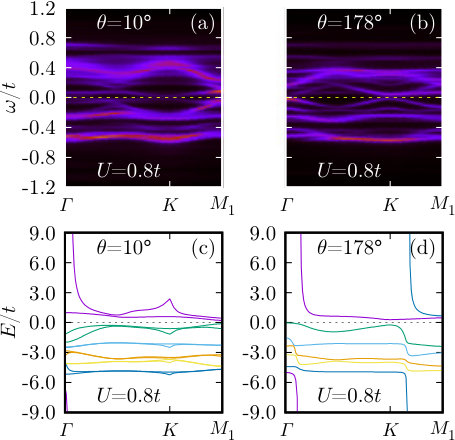 Figure 2
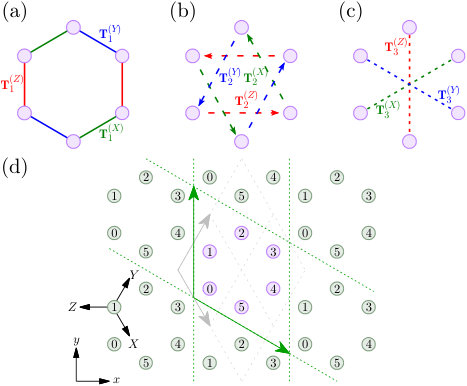 Figure 1
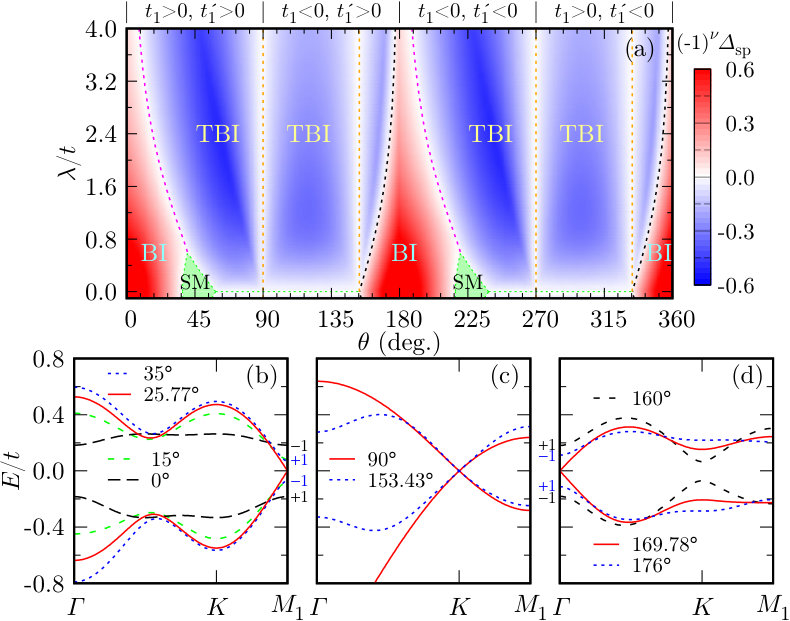 Figure 2
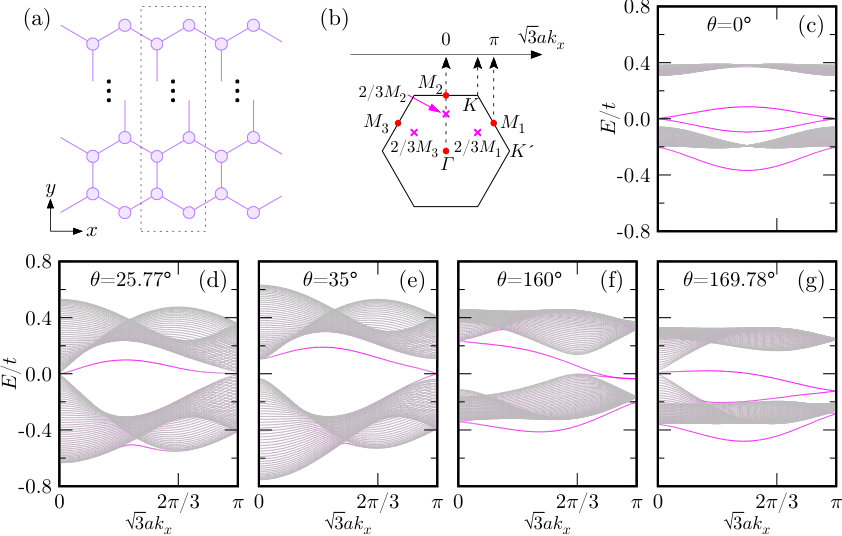 Figure 3
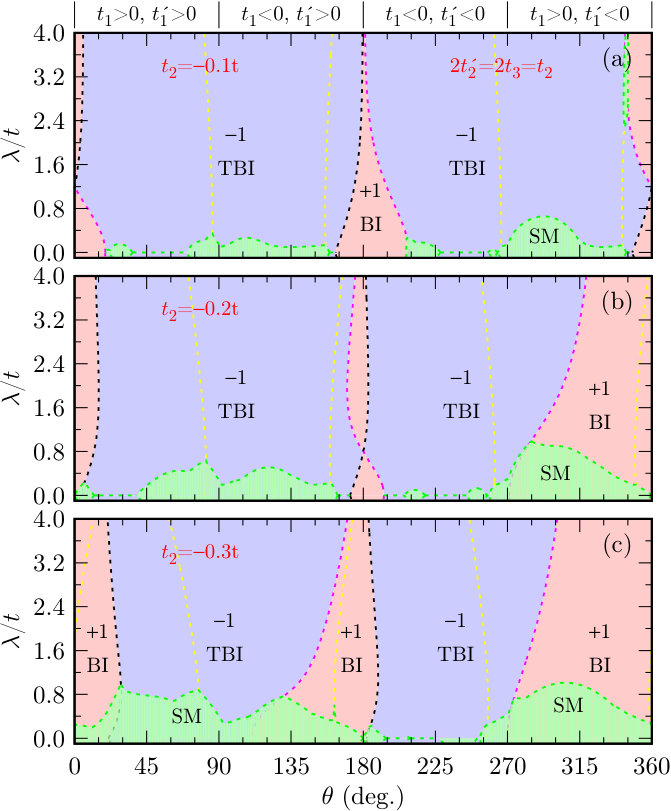 Figure 4
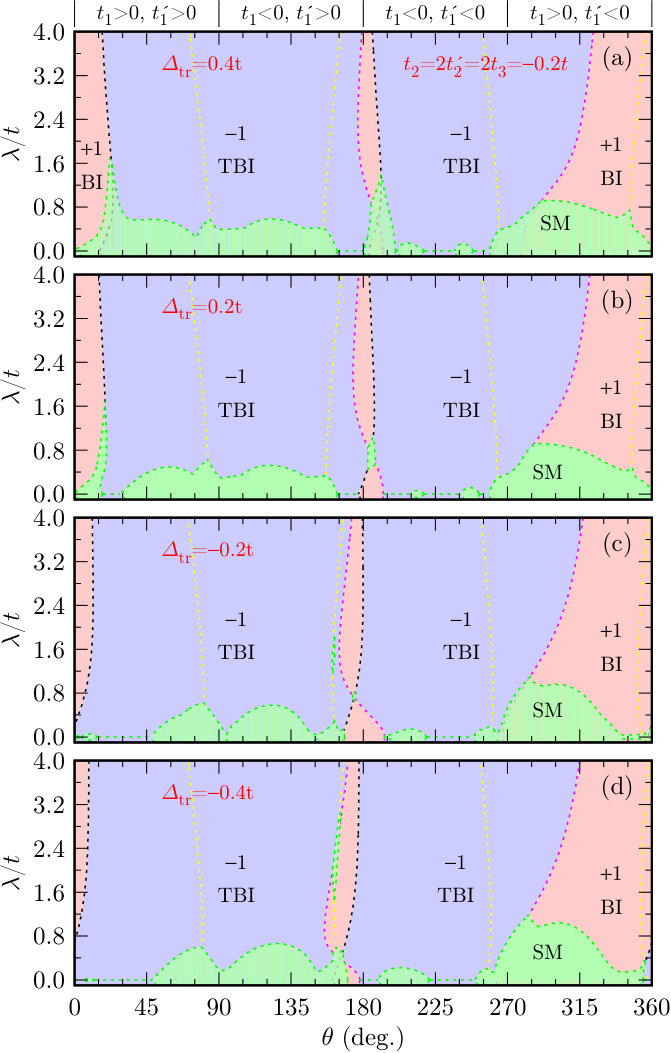 Figure 5
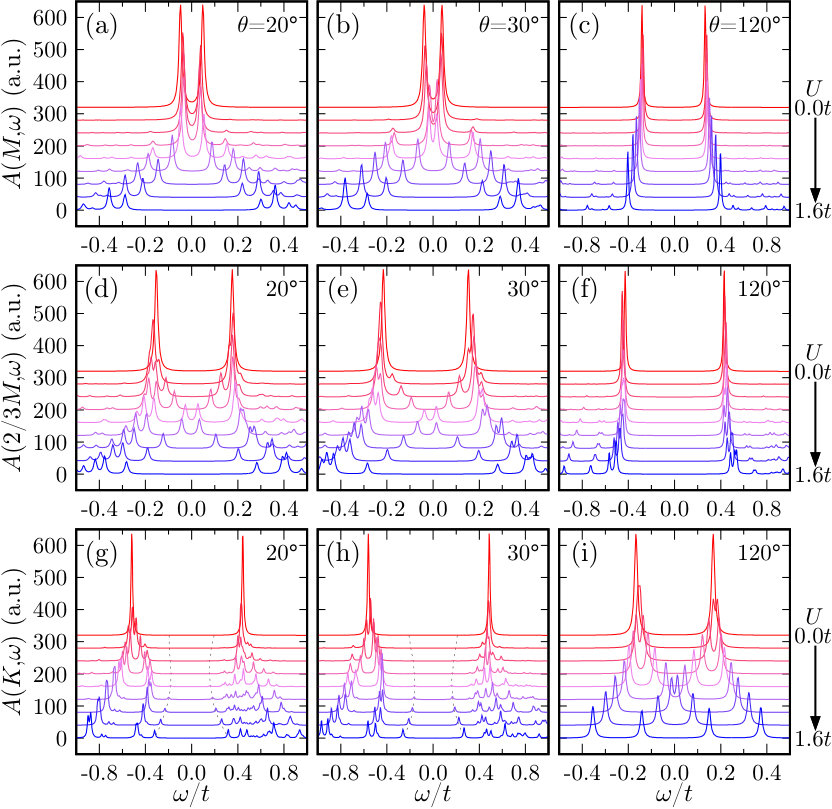 Figure 6
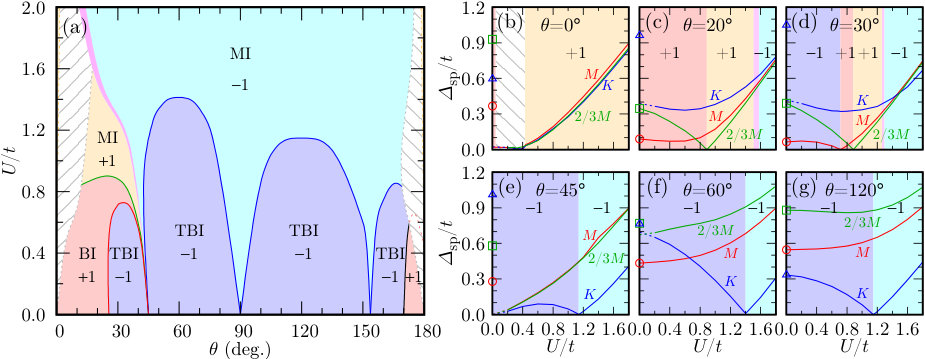 Figure 7
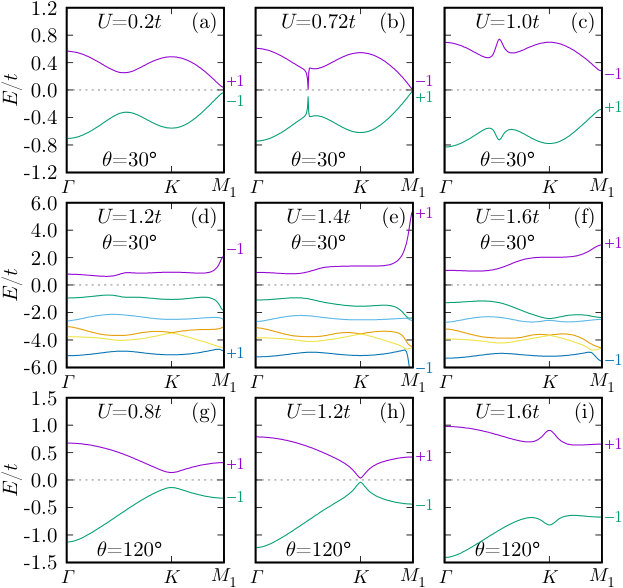 Figure 8
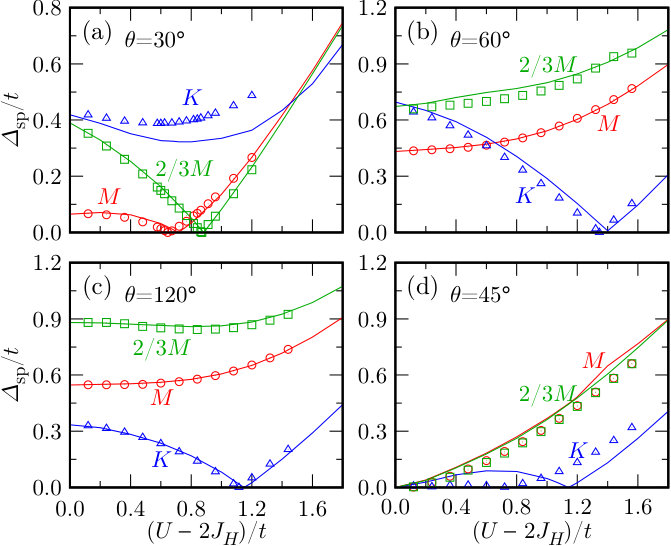 Figure 9
|
|
|
|||||||
|
|
|
|||||||
|
|
|
| (meV) | (∘) | |||||
|---|---|---|---|---|---|---|
| Na2IrO3 CHKim2012 | 559.0 | 296.6 | ||||
| Na2IrO3 Foyevtsova2013 | 273.8 | 10.0 | - | |||
| Na2IrO3 Yamaji2014 | 276.4 | 8.9 | ||||
| Na2IrO3 Winter2016 | 264.3 | 5.7 | ||||
| Li2IrO3 Winter2016 | 280.4 | 321.4 | ||||
| -RuCl3 HSKim2013 | 255.8 | 296.5 | - | |||
| -RuCl3 Winter2016 | 220.8 | 315.8 |
Peer Reviews
No public reviews on file for this paper yet. If you reviewed it on a platform where reviews are public (OpenReview, ICLR, NeurIPS, ICML), you can paste yours below so the community can read it here.
Videos
No videos yet. Explain this paper in a talk, walkthrough, or lecture? Add one.
Topological property of a system with a honeycomb lattice structure
Beom Hyun Kim
Korea Institute for Advanced Study, Seoul 02455, South Korea
Computational Condensed Matter Physics Laboratory, RIKEN Cluster for Pioneering Research (CPR), Saitama 351-0198, Japan
Kazuhiro Seki
International School for Advanced Studies (SISSA), Via Bonomea 265, 34136, Trieste, Italy
Computational Condensed Matter Physics Laboratory, RIKEN Cluster for Pioneering Research (CPR), Saitama 351-0198, Japan
Computational Materials Science Research Team, RIKEN Center for Computational Science (R-CCS), Kobe, Hyogo 650-0047, Japan
Tomonori Shirakawa
International School for Advanced Studies (SISSA), Via Bonomea 265, 34136, Trieste, Italy
Computational Condensed Matter Physics Laboratory, RIKEN Cluster for Pioneering Research (CPR), Saitama 351-0198, Japan
Computational Materials Science Research Team, RIKEN Center for Computational Science (R-CCS), Kobe, Hyogo 650-0047, Japan
Computational Quantum Matter Research Team, RIKEN, Center for Emergent Matter Science (CEMS), Wako, Saitama 351-0198, Japan
Seiji Yunoki
Computational Condensed Matter Physics Laboratory, RIKEN Cluster for Pioneering Research (CPR), Saitama 351-0198, Japan
Computational Materials Science Research Team, RIKEN Center for Computational Science (R-CCS), Kobe, Hyogo 650-0047, Japan
Computational Quantum Matter Research Team, RIKEN, Center for Emergent Matter Science (CEMS), Wako, Saitama 351-0198, Japan
Abstract
A system with a honeycomb lattice structure such as Na2IrO3 was firstly proposed as a topological insulator even though Na2IrO3 and its isostructural materials in nature have been turned out to be a Mott insulator with magnetic order. Here we theoretically revisit the topological property based on a minimal tight-binding Hamiltonian for three bands incorporating a strong spin orbit coupling and two types of the first nearest neighbor (NN) hopping channel between transition metal ions, i.e., the hopping () mediated by edge-shared ligands and the direct hopping () between orbitals via bonding. We demonstrate that the topological phase transition takes place by varying only these hopping parameters with the relative strength parametrized by , i.e., and . We also explore the effect of the second and third NN hopping channels, and the trigonal distortion on the topological phase for the whole range of . Furthermore, we examine the electronic and topological phases in the presence of on-site Coulomb repulsion . Employing the cluster perturbation theory, we show that, with increasing , a trivial or topological band insulator in the absence of can be transferred into a Mott insulator with nontrivial or trivial band topology. We also show that the main effect of the Hund’s coupling can be understood simply as the renormalization of . We briefly discuss the relevance of our results to the existing materials.
I Introduction
Topology of electronic states is one of the most fascinating research subjects in the current condensed matter physics. This is a new physical aspect to distinguish quantum phases beyond the traditional Landau’s approach based on the spontaneous symmetry breaking. The quantum spin Hall (QSH) phase, which can arise in the presence of the time-reversal symmetry (TRS), is the most extensively studied example of intriguing topological phases Hasan2010 . The QSH insulator, termed as a topological insulator (TI), is characterized by the topological invariant determined by the time-reversal polarization Fu2006 ; Fu2007a ; Fu2007b . In contrast with a conventional insulator, gapless edge or surface states protected by the TRS emerge along with a peculiar magnetoelectric effect Ando2013 . After the theoretical proposal of the QSH phase in graphene Kane2005a ; Kane2005b and HgTe quantum well Bernevig2006 , many theoretical and experimental researches have verified that not only a TI but also other types of topological phases such as a topological crystalline insulator and a Weyl semimetal are indeed stabilized in existing materials Bansil2016 .
TIs and many candidate TIs are - or -based with a strong spin-orbit coupling (SOC) such as Bi2Se3 Xia2009 ; Zhang2009 , and only a few candidates have been proposed in or transition metal (TM) compounds Shitade2009 ; Pesin2010 ; Yang2010 ; CHKim2012 ; HSKim2013 ; Qian2014 ; Weng2015 ; Sun2015 ; Zhou2015 ; Ochi2016 ; Khazaei2016 ; Si2016 . Na2IrO3 is the first candidate of TM-based TIs. This system is in the low-spin state of Ir4+ ion, stabilized due to the gigantic cubic crystal field of approximately 3 eV, with five electrons per TM occupying in Ir -based bands, which are split into four-fold degenerate bands and two-fold degenerate bands in the presence of a strong SOC. Here, is referred to as the effective total angular momentum. Because of their large splitting, it is expected that the four-fold degenerate bands are fully occupied, and only the doubly degenerate bands cross the Fermi energy and are half filled. Because Ir atoms in Na2IrO3 form a layered honeycomb lattice and the energy band dispersion along the inter-layer direction is much smaller than that in the intra-layer plane, the low-energy electronic structure of Na2IrO3 can be mapped into an effective tight-binding model for the bands, which is reminiscent of the Kane-Mele model of graphene Kane2005a ; Kane2005b . If the parameters in the effective Kane-Mele model is in the right range, the QSH phase necessarily emerges in Na2IrO3. This point has been firstly pointed out by Shitade et al. Shitade2009 . The consecutive studies have supported a weak TI in Na2IrO3 and a strong TI in isostructural Li2IrO3 if the trigonal distortion and further neighbor hoppings are tailored suitably CHKim2012 ; HSKim2013 .
In spite of the theoretical prediction, the QSH phase in Na2IrO3 and its isostructural materials, Li2IrO3, Li2RhO3, and -RuCl3, has not been experimentally reported yet. In fact, these materials prefer to exhibit topologically trivial insulating phases with long-range magnetic order Singh2010 ; Singh2012 ; Luo2013 ; Sears2015 . These phases are rather understood in terms of the Mott physics of relativistic orbitals with a strong SOC Comin2012 ; MJKim2016 ; BHKim2016 . Although the spatial distribution of or orbitals is somewhat extended as compare with that of orbitals, the electron correlation could be hardly screened out and still play a role in determining their electronic characteristics. There have also been extensive studies along this line on these systems, focusing on their exotic magnetic phases induced by the mutual interplay among the kinetic energy, SOC, and Coulomb interaction, which include, for example, Kitaev spin liquid phase Chaloupka2010 ; Jiang2011 ; Reuther2011 .
Nevertheless, the possibility of the QSH phase in these systems is still interesting. State-of-the-art structural control with pressure, chemical substitution, or substrate engineering can potentially manipulate experimentally their electronic kinetics and correlations. Moreover, a recent photoemission spectroscopy experiment has observed metallic surface states near the point in Na2IrO3 Alidoust2016 ; Moreschini2017 . Despite that its texture is not direct evidence on the QSH phase, in which a gapless mode is expected to appear at the points, it still infers the possibility that the electronic character near surfaces could be quite different from the bulk Mott insulating phase Alidoust2016 ; Moreschini2017 .
The topological phase transition in the presence of electron correlations has also attracted much attention. A lot of theoretical approaches have been employed to determine electronic and topological phases of various interacting topological insulators Rachel2018 . When the correlations are weak, both electronic and topological phases are still robust in the topological band insulator (TBI) even though the insulating gap can be slightly modified. In the limit of strong electron correlations, an electronic phase is surely changed from a band insulator (BI) to a Mott insulator (MI) with often magnetic order. In a moderate correlation regime, however, exotic electronic and topological phases are expected. The mean-field approximation based on the slave-rotor approach has shown the possibility of a topological Mott insulator (TMI) in pyrochlore iridates Pesin2010 . The first-principles electronic structure calculation Wan2011 and the cellular dynamical mean-field theory (CDMFT) AGo2012 have revealed that exotic topological phases such as an axion insulator and a Weyl semimetal emerge between a TI and an antiferromagnetic (AFM) MI when the electron correlations are increased. The topological phase transition of the Kane-Mele-Hubbard model for interacting graphene has also been investigated by various numerical methods Hohenadler2011 ; Yu2011 ; Hohenadler2012 ; Wu2012 ; Hohenadler2014 ; Grandi2015 . The effect of correlations in the effective model proposed by Shitade et al. has also been studied with the slave-spin approaches Ruegg2012 .
All these studies have found that the topological phase transition occurs from a TBI to an AFM MI with increasing the Coulomb repulsion. However, the contradicting results are obtained among the different studies on the nature of the intermediate phase. The CDMFT calculations Wu2012 have found a spin liquid phase near the phase boundary in a very weak SOC region, whereas the quantum Monte Carlo (QMC) method Hohenadler2014 and the cluster perturbation theory (CPT) method Grandi2015 have not predicted the presence of the spin liquid phase. The single-particle excitation gap is perfectly closed at the critical point in the calculations using the CPT and variational cluster approximation (VCA) methods Yu2011 ; Grandi2015 . In contrast, the QMC calculations show that the gap becomes smallest but remains finite Hohenadler2011 ; Hohenadler2012 . Recent studies on the Haldane-Hubbard model using the VCA have found nonmagnetic and magnetic TBI phases in the presence of electron correlations Gu2015 ; Wu2016 .
Here, in this paper, we revisit the topological property of Na2IrO3 and its isostructural compounds theoretically by considering a system in the single-layer honeycomb lattice. In contrast with the previous studies, which mainly elucidate the role of longer-range hoppings, i.e., the second nearest-neighbor (2nd NN) and third nearest-neighbor (3rd NN) hopping channels, in the topological phase in the analogy of the Kane-Mele model, we focus on the two dominant processes in the first nearest-neighbor (1st NN) hopping channel between TMs: the direct - hopping via the bonding and the indirect hopping mediated by edge-shared ligands via the bonding, and examine the topological phase transition. We demonstrate that the topological phase is transferred from a trivial BI to a TBI and vice versa with varying the relative strength between the two different hoppings in the 1st NN channel. In addition, we explore the topological phase transition against the Coulomb repulsion. Employing the CPT, we calculate the electronic and topological phase diagram in the presence of the Coulomb repulsion. We find that a Mott insulator with nontrivial band topology similar to the QSH state appears over a broaden parameter region of the phase diagram.
The rest of this paper is organized as follows. Section II introduces a model Hamiltonian of the system and explains briefly numerical methods to calculate the topological invariant for both noninteracting and interacting cases. The topological phase diagram in the noninteracting limit with respect to the SOC and the 1st NN hopping parameters is examined in Sec. III. The edge states in a zigzag stripy geometry are also analysed. The roles of the trigonal distortion as well as the 2nd and 3rd NN hopping channels in the topological phase is also studied in Sec. III. The effect of electron correlations on the topological phase diagram is investigated in Sec. IV. Finally, Sec. V discusses the relevance of our results to the existing compounds, before concluding the paper in Sec. VI. Appendix A provides the details of the CPT used here, followed by the results of the single-particle excitation spectrum in Appendix B and the topological Hamiltonian in Appendix C
II Model and Method
II.1 Noninteracting Hamiltonian
To investigate the electronic and topological phases of a system with the honeycomb lattice structure such as Na2IrO3 and its isostructural systems, we consider three hopping channels between 1st NN, 2nd NN, and 3rd NN sites, as schematically shown in Figs. 1(a)–1(c). Let , , and be the hopping matrices of -type (, , and ) for the 1st, 2nd, and 3rd NN hoppings, respectively. Because there is no inversion symmetry (IS) about the bond center of sites connected via the 2nd NN hopping [see Fig. 1(b)], along the direction, indicated by arrows in Fig. 1(b), is not the same as that along the opposite direction denoted as . The hopping matrix along the opposite hopping direction, , is given by the transpose of . In contrast, the other two hopping matrices and are independent of the hopping directions because there is the IS at the center of the corresponding bond, and hence .
We consider the following tight-binding Hamiltonian on the honeycomb lattice:
[TABLE]
where is the annihilation operator of electron with orbital , , and ) and spin at lattice site , and , , and are three orbitals, i.e., , , and orbitals, represented in the local coordinates indicated in Fig. 1(d) (also see Ref. BHKim2016, ). The first four terms describe the electron hopping, where , , and are site indices, denoting sites connected from site via the -type 1st, 2nd, and 3rd NN hopping channels, respectively, with , , and , as shown in Figs. 1(a)–1(c). Note that each site has three neighboring sites that are connected via the 1st and 3rd NN hopping channels, while there are six neighboring sites that are connected from a given site via the 2nd NN hopping channel.
The fifth term in is the SOC Hamiltonian and the matrix elements of are given as , where and are orbital and spin angular momentum operators, respectively. Among these matrix elements, the nonzero matrix elements are , , , and the complex conjugate of these elements. The SOC causes the six-fold degenerate orbitals, including the spin degree of freedom, to split into four-fold degenerate and doubly degenerate relativistic orbitals. in the sixth term in is the chemical potential and is determined for the number of electrons per site to be .
The last term in describes the energy level splitting due to the trigonal distortion. In the presence of the trigonal distortion, the three-fold degenerate orbitals, not including the spin degree of freedom, split into doubly degenerate ( and ) orbitals and nondegenerate () orbital with the level splitting energy . Here, , and orbitals are given as , , and . The SOC term has nonzero matrix elements in these , , and orbitals only for , , , and the complex conjugate of these elements.
For simplicity, we only consider one or two hopping processes in each hopping channel, which contribute dominantly for the hopping channel, as previously estimated in Refs. CHKim2012, ; Foyevtsova2013, ; Yamaji2014, ; Winter2016, . The hoppings considered here in this study is summarized in Table 1. For the 1st NN hopping channel, and refer to the hopping amplitudes of the direct hopping via the bonding of orbitals and the indirect hopping mediated via the bonding between a TM and its neighboring ligands, respectively. These hopping amplitudes and are parametrized as and by introducing two parameters and . As already noted above, the broken IS of the 2nd NN hopping channel gives rise to different hopping amplitudes from orbital to orbital and from orbital to orbital . Because the previous studies have supported that both 2nd and 3rd NN hoppings are negative CHKim2012 ; Foyevtsova2013 ; Yamaji2014 ; Winter2016 , here we only consider negative , , and .
II.2 topological invariant
Because possesses both IS and TRS simultaneously, the topological characteristic induced by the TRS can be investigated without directly calculating the Berry curvature over the whole momentum space. Owing to the theory by Fu and Kane Fu2007a , the topological invariant of the QSH phase can be evaluated simply from parity eigenvalues of occupied energy bands at every time-reversal invariant momentum (TRIM) point. Provided that - and -th energy bands are -th Kramers pair (ascending order in energy eigenvalues) with the same energy and parity eigenvalues at a TRIM point, the topological quantity is given as
[TABLE]
where () is the parity eigenvalue of the -th Kramers pair at specific TRIM . is total number of Kramers pairs below the Fermi energy and for our system in the honeycomb lattice. The topological quantity is defined as the product of all parity eigenvalues of Kramers pairs below the Fermi energy at . For the honeycomb lattice, there are four TRIM points at the point and three points (, , and ) [see red dots in Fig. 3(b)].
II.3 Correlation effect
To investigate the correlation effect, we add to the Kanamori-type interaction term described by the following Hamiltonian:
[TABLE]
where and with are the intra-orbital and inter-orbital on-site Coulomb interactions, respectively, represents the Hund’s coupling, and stands for the opposite spin of . We employ the CPT of a six-site cluster depicted in Fig. 1(d) to examine the electronic band structure of the interacting system by calculating the single-particle excitation spectrum Senechal2008 . According to a recent study Grandi2015 , the symmetry of cluster is crucial to determining the topological property in a honeycomb lattice because the discrepancy of the symmetry between the cluster and the original lattice leads to wrong symmetry of the self-energy in the single-particle Green’s function, which can give rise to artificial electronic and topological phases. Our selection of the cluster is the minimum cluster to keep the point group symmetry of the original honeycomb lattice. Details on the CPT used here are described in appendix A.
To identify the topological property of an interacting system, we adopt the framework proposed by Wang and Zhang Wang2012a ; Wang2012b . In this framework, the topological property of an interacting system is evaluated from the corresponding noninteracting system described by the so-called “topological Hamiltonian” , where is the single-particle Green’s function of the interacting system at frequency and momentum . This is justified because there always exists the smooth transformation from the single-particle Green’s function of the noninteracting system described by the topological Hamiltonian, , to that of the interacting system Wang2012a . We can calculate the topological invariant of the interacting system by using Eq. (2), in which the parity eigenvalues are evaluated for the eigenstates of with the negative energy eigenvalues at the TRIM points Wang2012b .
When the component of the total spin is conserved, the topological invariant can be obtained by directly calculating the spin Chern number expressed in terms of the single-particle Green’s function. However, in systems with the SOC, the spin Chern number is hardly formulated because the up and down spin sectors of the single-particle Green’s function always couple together. The approach based on the topological Hamiltonian is best suited to the numerical calculation of the topological invariant for the interacting systems. Therefore, this method has been adopted very often to explore the topological properties of many interacting systems Yosida2013 ; Witczak2014 ; Hung2014 ; Gu2015 ; Grandi2015 ; He2016a . Moreover, it has been shown that the method is enough to obtain relevant results on the topological phase transition in interacting systems as long as the electronic and topological phases can be certainly defined by fermionic degrees of freedom He2016b .
III Noninteracting system
III.1 Topological phase diagram
First, we explore the role of the 1st NN hopping channel on the topological property. Figure 2(a) shows the topological phase diagram as functions of the 1st NN hopping parameter and the SOC strength . The phase diagram is obtained by calculating the product of a band gap and a topological invariant given in Eq. (2). This quantity is exactly the same as a topological mass of the Kane-Mele model when the band gap is determined at TRIM points Murakami2007 . Red and blue regions in Fig. 2(a) correspond to topologically trivial BI and nontrivial TBI phases, respectively. A semimetallic region, in which the highest energy of the valence bands is larger than the lowest energy of the conduction bands, is indicated by green in Fig. 2(a).
Since the reversal of the hopping parameters (i.e., ) does not change the energy band dispersions and the corresponding Bloch wave functions but only alter the sign of their parity eigenvalues, all topological quantities for have the opposite signs of those for when odd numbers of Kramers pairs are occupied. Note that there are 10 electrons per unit cell in our system in the honeycomb lattice, and hence odd numbers of Kramers pairs are occupied at each TRIM point. However, this never changes the topological invariant because there are four TRIM points in our system. Therefore, the topological phase diagram for is exactly the same as that for as shown in Fig. 2(a).
When is or , and only contributes to the hopping. In this limit, the electronic energy band structures without the SOC can be interpreted in terms of quasimolecular orbitals formed in each hexagon of the honeycomb lattice, which are well separated in energy and characterized by the parity eigenstates Mazin2012 ; Foyevtsova2013 . Once the hopping is considered with the other terms kept absent, the six-fold degenerate bands (two sites per unit cell without considering the spin degree of freedom) are split into dispersionless bands with , , , and symmetries, charactering the quasimolecular orbitals, whose energies are , , and , respectively. Therefore, the highest unoccupied band for the configuration is the band with symmetry for or symmetry for . Based on the analytic form of the quasimolecular orbital with () symmetry in Ref. BHKim2016, , we can easily show that the parity eigenvalues at the , , , and points of the highest unoccupied band, i.e., , , , and , are , , , and (, , , and ), respectively. Topological quantities are thus for and for . Therefore, topologically trivial insulator with is stabilized for both and without the SOC. When the SOC increases, the energy band character smoothly changes from the quasimolecular to relativistic bands BHKim2016 . However, no gap closure happens at the Fermi energy and the topological invariant remains the same regardless of the strength of . This is why the number is always zero near and in Fig. 2(a), although the trivial BI region apparently decreases with increasing .
When is away from or , the strength of increases and modifies the electronic and topological characteristics. A finite band gap at the points ( point) gradually decreases but a direct gap at the () point increases reversely when increases (decreases) from (). Eventually, the valence and conduction bands touch each other at the () point and the Dirac like dispersion appears around the Fermi energy. Concomitantly, the parity eigenvalues at the three points ( point) of the highest occupied and lowest unoccupied bands are reversed with further increasing (decreasing) . Accordingly, topological quantities are changed from [] to , as shown in Table 2. This is well illustrated in Figs. 2(b) and 2(d). In the case of , the Dirac like dispersions appear at the three points ( point) when is about (). A dashed line with magenta (black) color in Fig. 2(a) represents the topological phase boundary where the Dirac like energy band dispersion with appears at the points ( point). Thus, the increase (decrease) of gives rise to the topological phase transition from a trivial BI [] to a TBI []. We should emphasize that the TBI phase is realized in a much broader parameter region, in sharp contrast with the previous report based on an effective model in which the contribution on the 1st NN hopping channel between orbitals exactly cancels out Shitade2009 .
When only is finite (i.e., ), the hopping between one specific orbital is allowed in each type of hoppings, i.e., orbital for type, orbital for type, and orbital for type of the 1st NN hopping channel (see Table 1). Therefore, when the SOC is absent, each orbital participates to form the bonding and antibonding states with the same type of orbital on the nearest neighboring sites connected through along the different hoping direction. This brings about two six-fold-degenerate Bloch states (including doubly degenerate spin states) with momentum independent dispersions. When is turned on, the momentum dependence arises in the dispersions and the six-fold degeneracy is lifted in the entire momentum space expect for , corresponding to , where the six-fold degeneracy still remains at the , , and points. When the SOC is turned on, the six-fold degenerate states at the and points are split into low-energy two-fold degenerate states and high-energy four-fold degenerate states. As in the graphene band, the Fermi energy crosses the four-fold degenerate bands at the and points [also see Fig. 2(c)]. Therefore, the zero gap region with appears at and , regardless of values, as indicated by orange dashed lines in Fig. 2(a). Figure 2(c) shows the more detailed energy band structure at these values. Clear Dirac like dispersions appear at both and points, while there is a finite gap at the point. Since both and are not the TRIM points, the band gap closure at these points does not alter the parity eigenvalues of the occupied bands at the TRIM points. Topological quantities are always across these values of and thus nontrivial topology is still robust.
The 1st NN hopping between the relativistic orbitals is exactly cancelled when only is considered. The other hopping process attributed to can give rise to a finite 1st NN hopping in the effective Kane-Mele model of the manifold. However, still leads to a finite 1st NN hopping between the and orbitals. The virtual hopping process via orbital is enough to give rise to the effective hopping between the 2nd and 3rd NN sites in the manifold Catuneanu2016 . Thus, we expect that the variation of parameter in our model induces the relative enhancement of the 2nd and 3rd NN hopping strengths in the effective Kane-Mele model. Therefore, the topological phase transition found here by varying relative strengths of the two processes in the 1st NN hopping channel of our system can be understood in the analogy of the Kane-Mele model with the 2nd and 3rd NN hopping channels.
Recently, Laubach et al. have reported a similar topological phase diagram of a band model with respect to the relative strength of two 1st NN hopping processes and the SOC Laubach2017 . The two 1st NN hopping processes considered in their model are those that lead to the Kitaev-type and Heisenberg-type magnetic interactions in the strong coupling limit. The former is exactly the same as our hopping. The latter is the hopping processes with our hopping and additional hoppings among the same orbitals. We consider the direct hopping only between, e.g., orbitals in the type, whereas they consider the direct hopping between all orbitals, including also, e.g., and orbitals in the type. Although this difference in the hopping parameters gives rise to an additional metallic region in a small SOC region around (not found here in our phase diagram), the topological phase diagram is in good agreement with our result for because their study is limited for both hopping processes positive. Therefore, the topological phase transition with the gap closure at the point appering in is not found in their study.
III.2 Edge state
One of the characteristic features of TIs is the presence of symmetrically protected edge states which intersect the Fermi energy odd numbers of times. To explore the surface electronic structures of our system in the honeycomb lattice, here we consider a zigzag stripy geometry of the lattice structure along the -direction with fifty lattice sites along the -direction, thus containing one hundred sites in the unit cell, as schematically depicted in Fig. 3(a). Because the translation symmetry is broken along the -direction, the two-dimensional momentum of the honeycomb lattice is projected onto the one-dimensional one shown in Fig. 3(b).
Figures 3(c)–3(g) show the electronic energy band structures of the zigzag stripy geometry for various values of with . The electronic bands dominantly contributed from the edges are highlighted with magenta. Intriguingly, the energy band dispersions manifested inside the bulk band gap originate from the edge states for all the parameter region of . Because the IS as well as the TRS is still preserved even in the stripy geometry, the energy dispersions and (: pseudospin) of the edge states at upper and lower edges, respectively, are related as , where the first and third equalities are due to the inversion operation and the second equality is due to the time reversal operation. Therefore, the edge states show four-fold degeneracy at the TRIM points, i.e., and where is the distance between the 1st NN sites, irrespective of the width of the zigzag stripy geometry of the lattice. At any momentum away from these momenta, however, the surface bands are simply doubly degenerate. As show in Figs. 3(c)–3(g), these two-fold degenerate surface bands are eventually connected to other surface bands at and with quite different ways depending on the bulk topological feature.
As shown in Fig. 3(c), in the topologically trivial BI phase at and close to and , the surface bands located inside the bulk band gap are well isolated from the bulk conduction and valence band continua and connect pairwise at the TRIM points. This is reminiscence of the energy dispersion at the edge of a single-layer Na2IrO3 recently studied by Catuneanu et al. Catuneanu2016 . With increasing or decreasing from [math] or , some part of the surface bands is buried in the valence band continuum but they never contact the conduction band continuum until the bulk band gap is closed at the or points. Thus, the surface bands clearly intersect the Fermi energy even number of times, as expected for a topologically trivial BI.
When the bulk gap is closed at the points for or at the point for [see Figs. 2(b) and 2(d)], the bulk conduction and valence band continua touch each other , as shown in Fig. 3(d), or at , as shown in Fig. 3(g). With further increasing or decreasing , the bulk conduction and valence band continua depart and the surface bands in the bulk band gap are again well separated from the bulk continua. However, the connectivity of the surface bands qualitatively changes. The pairwise connection of the surface bands is now broken and the surface bands cross the Fermi energy from the bulk conduction band continuum to the bulk valence band continuum, as shown in Figs. 3(e) and 3(f). Thus, the surface bands intersect the Fermi energy odd number of times, as expected in the TI phase.
III.3 Further neighboring hopping and trigonal distortion
According to previous studies, the electronic and topological properties of Na2IrO3 and its isostructural systems depend sensitively on the further neighboring hopping channels or the local electronic modulation induced by structural distortions. Here we investigate the effects of the 2nd and 3rd NN hopping channels and the trigonal distortion on the topological phase diagram.
Figure 4 shows the topological phase diagrams for different 2nd and 3rd NN hopping parameters. Here we simply set and because this is not far from the theoretical estimations for Na2IrO3 and its isostructural materials (also see table 3). TBI and BI phases are determined by the topological invariant in Eq. (2). When varies from [math] to , the semimetal region is enlarged, and the BI-TBI phase boundaries indicated by black dashed lines, where the Dirac dispersion appears at point, shifts rightward, whereas the other phase boundaries indicated by magenta dashed lines, where the Dirac dispersions appear at the points, shift oppositely. Therefore, comparing to the topological phase diagram shown in Fig. 2(a), the topological insulating region is slightly enlarged when the 2nd and 3rd NN hopping channels are introduced. However, with further increasing the 2nd and 3rd NN hopping strengths, the topological insulating region decreases and in particular the TBI phase is largely suppressed for (i.e., and ).
The trigonal distortion is also important to determine the topological phase. Figure 5 shows the topological phase diagrams for several values of the trigonal distortion with for the 2nd and 3rd NN hoppings. The BI-TBI phase boundaries shift leftward with decreasing from positive to negative values. Thus, the trigonal distortion affects the topological phases very differently depending on the relative strength of and . For instance, the topological phase at and changes from a trivial BI to a nontrivial TBI when decreases from to . In contrast, the topological phase at and transforms from a trivial BI to a nontrivial TBI when increases from to .
Kim et al. have performed the first-principles calculations based on the density functional theory (DFT) to estimate eV and eV for Na2IrO3 CHKim2012 , which corresponds to , as shown in Table 3. According to our calculations in Fig. 5, the TBI phase easily appears at this value of when is positively large. Indeed, they have concluded that a weak TBI phase can be realized in Na2IrO3 when there is the large trigonal distortion with positive . However, other DFT based studies have estimated quite different values of the 1st NN hopping parameters. Their estimated values correspond to less than , as summarized in Table 3. In these values of , our results expect the TBI phase to be more favorable when is negatively large, not positively large, as opposed to the prediction by Kim et al. CHKim2012 .
IV Interacting system
To explore the effect of the Coulomb interaction on the electronic and topological phases, here we consider a simple system with and . First, we focus on the role of the on-site Coulomb repulsion in Eq. (3) by setting . The CPT is employed to calculate the spectral function of the single-particle Green’s function [see Eq. (9) for the definition] for various values of and . Figure 6 shows the representative results of the spectral function at the , [, , and indicated by magenta crosses in Fig. 3(b)], and points as a function of for three different values of (i.e., , , and ). These three cases exhibit three different types of the electronic phase transition from a BI to a MI with increasing : the phase transitions with the single-particle excitation gap closing at the points, with the single-particle excitation gap closing consecutively at the and points, and with the single-particle excitation gap closing at the and points.
In the noninteracting limit, the spectral function is simply composed of the delta functions locating exactly at the energy of the noninteracting band dispersions. In finite , the electron correlation induces the nonzero self-energy that generates additional peak structures in the spectral function. Because the electron coherency becomes poor due to the scattering among electrons, the spectral function becomes usually broader and the spectral weight can be even redistributed involving a large energy scale of . These modifications of the spectral function certainly lead to the change of the single-particle excitation gap determined by the two lowest excitations below and above the Fermi energy.
The insulating gap in the single-particle excitations for the MI is directly attributed to the Coulomb repulsion. It is easy to conjecture that is monotonically increased with increasing . In the BI, however, the insulating gap is already opened, without , according to its own electronic kinetics. Because the Coulomb repulsion inhibits its kinetic effect, the insulating gap would be decreased and can be even diminished with increasing . Indeed, this feature has already been observed in our previous calculations of various spectroscopic quantities such as optical conductivity when BHKim2016 . As shown in Fig. 6, this is also the case in our systems studied here; the single-particle excitation gap in at the , , and/or points first decreases and then start to increase with increasing from the noninteracting limit. This implies that the insulating nature is changed from a BI to a MI with increasing .
Figures 7(b)–7(g) show the dependence of the single-particle excitation gaps at the , , and points, , , and , respectively, estimated from the spectral functions for six different values of . One of , , and becomes zero at the critical value. These critical values at which , , and are drawn with red, green, and blue solid lines, respectively, in the topological phase diagram shown in Fig. 7(a). When is larger than , the single-particle excitation gap at the point, , can also be zero with increasing . The corresponding critical values are indicated with black solid line in Fig. 7(a).
As shown in Figs. 6(g) and 6(h), the two -function peaks in the spectral function at the and points near the Fermi energy for are split into multiple subpeaks as soon as finite is introduced. The two subpeaks closest to the Fermi energy, which determine the single-particle excitation gap for finite , emerge at the energies rather away from the -function peaks in the noninteracting system, as indicated by dashed lines in Figs. 6(g) and 6(h). Their spectral weights gradually decreases with decreasing and completely vanishes at . Therefore, the single-particle excitation gap does not necessarily approaches to that of the noninteracting system in the limit of , as indicated by dotted line near in Figs. 7(b)–7(f).
To explore the topological feature for finite , we calculate the topological Hamiltonian based on the CPT and evaluate the topological invariant for the eigenstates of . Figure 8 shows examples of the energy dispersions of for various and values. Although the topological Hamiltonian can mimic the topological properties of the interacting system perfectly, the energy dispersion of has no reason to be the same as that of the corresponding interacting system because the energy dispersion for the latter is determined by the spectral function of the single-particle Green’s function. Only in a weakly interacting system, such as in Fig. 8(a), where the electronic self-energy is almost zero, both dispersions are expected to be almost the same. However, when is large, these two dispersions are evidently distinct, as shown in Fig. 8 and Fig. A1. This has also been commonly observed in previous studies Grandi2015 ; Gu2015 .
When the single-particle excitation gap in an interacting system is closed at a specific momentum , the spectral function exhibits dominant spectral weight at the Fermi energy (). In other words, has poles at and . Thus, the topological Hamiltonian, which is proportional to , should also exhibit the gap closure at the same momentum, simultaneously. As shown in Figs. 8(b) and 8(h) and Figs. A1(b) and A1(h), our calculation clearly manifests that the lowest conduction energy band and the highest valence energy band of the topological Hamiltonian touch the Fermi energy simultaneously at the critical value and at the momentum where the single-particle excitation gap of the interacting system is closed in the spectral function.
As the energy gap of is closed at a TRIM point , the parity eigenvalues of the corresponding conduction and valence energy bands of at are exchanged. Accordingly, the topological quantities in Eq. (2) is reversed. If the gap closure happens at odd numbers of TRIM points, the topological invariant is reversed. Therefore, in this case, the topological phase transition occurs. In the case of , for instance, is closed at , as shown in Fig. 7(c). Concomitantly, the parity eigenvalues of the lowest conduction and highest valence energy bands of are reversed at the three points. Thus, the topological quantities of change from to when increases from below to above . This is an example where the Coulomb repulsion compels the topological invariant to change from to , hence representing the topological phase transition from the TBI to the trivial BI. Red and black solid lines in Fig. 7(a) represent the parameters where the single-particle excitation gap in the spectral function is closed at the TRIM points, i.e., at the and points, respectively. Across these boundaries, the topological invariant of changes the sign between and .
In the noninteracting case, the topological invariant can be changed only when the single-particle excitation gap is closed. Therefore, the noninteracting single-particle Green’s function has necessarily a pole at the Fermi energy exactly when the topological phase transition occurs. In the interacting case, however, this gap closure criteria is no longer mandatory. In the presence of the interaction, the single-particle Green’s function could have zeros along the real axis as well as poles Dzyaloshinskii2003 ; Eder2008 ; Gurarie2011 ; Ezawa2013 ; Seki2017 . If the single-particle Green’s function at a TRIM point becomes zero, instead of having a pole, at when the topological phase transition occurs, the lowest conduction and highest valence energy bands of do not touch each other at the Fermi energy. Instead, they are positively and negatively diverged, respectively, at . Moreover, the parity eigenvalues of these diverging eigenstates of are able to be exchanged at and thus the topological invariant can be varied.
This is indeed observed in our calculations. As shown in Figs. 8(d) and 8(e), the parity eigenvalues of the eigenstates of with the largest and smallest eigenvalues are reversed at three points after their eigenvalues are diverged positively and negatively, respectively. Accordingly, the topological quantities of changes from to , keeping a finite single-particle excitation gap in the spectral function of the interacting system [see Figs. A1(d) and A1(e)]. This type of topological phase transition is indicated with light magenta lines in Figs. 7(a), 7(c), and 7(d).
As shown in Figs. 7(e)–7(g), in the cases of , , and , the single-particle excitation gap decreases first, diminishes at a certain , and then increases with increasing . Because the point is not a TRIM, the parity eigenvalues of at the TRIM points remain the same even after this gap closure happens. Thus, the topological property of a MI region, indicated by light cyan color in Fig. 7, is the same as that of the noninteracting system with , i.e., the QSH state. Our calculations therefore affirm the possibility of the paramagnetic MI with nontrivial band topology in honeycomb systems.
We should note here that we fail to calculate the topological invariant of in parameter regions indicated by hatched areas in Figs. 7(a) and 7(b). This is simply because evaluated by the CPT is broken down. More details are discussed in Appendix C.
It is often the case that the Hund’s coupling as well as the on-site Coulomb repulsion plays a crucial role in determining the electronic and magnetic properties of systems. For example, anisotropic magnetic exchange interactions such as Kitaev interaction are induced in the strong coupling limit of systems with a honeycomb lattice structure only when is finite Chaloupka2010 . We thus investigate the effect of on the electronic and topological phase diagram in a relatively weak coupling region. Figure 9 shows the single-particle excitation gap for , , , and when and . Remarkably, we find that for various values is approximately scaled with , which is the effective Coulomb interaction among different orbitals, regardless of values. As shown in Fig. 9(d), only at the point near seems to deviate from this scaling. Therefore, we can conclude that the dominant effect of on the electronic and topological phase diagram is the renormalization of the on-site Coulomb repulsion .
V Discussion
Table 3 summarizes the hopping and trigonal distortion parameters for the existing materials Na2IrO3, Li3IrO3, and -RuCl3, which are extracted from literature CHKim2012 ; HSKim2013 ; Foyevtsova2013 ; Yamaji2014 ; Winter2016 . In the case of Na2IrO3, the expected value of is about Foyevtsova2013 ; Yamaji2014 ; Winter2016 , although Ref. CHKim2012, reports that can be as large as . Note that the SOC for Na2IrO3 is eV and thus is about . Therefore, according to our results shown in Fig. 4, this material can be in the TBI phase only when the 2nd and 3rd NN hopping strengths are within the proper range. In addition, as shown in Fig. 5, the phase boundary separating the BI and TBI phases tends to shift leftward as decreases to be negative. This infers that strong negative is more profitable for Na2IrO3 to be in the TBI phase. However, the expected value of is about and is positive. These are pessimistic indications for Na2IrO3 being a TBI.
Recently, Catuneanu et al. have studied theoretically the edge state of single-layer Na2IrO3 Catuneanu2016 . In their study, the effective Hamiltonian for the manifolds was constructed with the 1st, 2nd, and 3rd NN hoppings between orbitals, which are extracted from the first-principles electronic band structure calculations of single-layer Na2IrO3. The edge dispersion in the zigzag geometry was also calculated with the effective Hamiltonian. Their results are similar to the edge dispersion shown in Fig. 3(c). This also confirms that Na2IrO3 is not in the TBI phase.
However, recent photoemission spectroscopy measurement on Na2IrO3 has observed a metallic band near the point Alidoust2016 ; Moreschini2017 . If this metallic band is attributed dominantly to the surface honeycomb layer, the physical parameters in the surface honeycomb layer would be located very close to the topological phase boundary because, according to our calculation in Fig. 4 and Fig. 5, the -point Dirac dispersion appears at the Fermi energy in the phase boundary between the BI and TBI phases. This is an optimistic clue for the surface layer of Na2IrO3 to be located not far from the TBI phase. Therefore, we expect that small structural tuning on Na2IrO3 would be enough to bring about the topological phase transition in the surface layer.
As shown in Table 3, estimated for Li2IrO3 is about 320∘ and for -RuCl3 is about –. Therefore, according to the topological phase diagrams shown in Fig. 4 and Fig. 5, these materials could be in the TBI phase when is positively large, and the 2nd and 3rd NN hopping strengths are small enough CHKim2012 . However, the estimated 2nd NN hopping strengths listed in Table 3 are relatively large (). This implies that the TBI phase is hard to be stabilized in these parameters for Li2IrO3 and -RuCl3. For the realization of TBIs in these materials, it is advantageous to reduce the further neighboring hoppings.
Recently, Yamada et al. have proposed a new efficient way to experimentally control the hopping strengths of a honeycomb lattice by introducing oxalate- or tetraaminopyrazine-based molecular ligands, instead of chlorine atoms, which are connected to the adjacent TM Ru3+ ions Yamada2016 . They have theoretically suggested that the relative strength of the 1st NN hopping channel can be tuned by selecting the molecular ligand. Since molecular ligands can also increase the distance between the adjacent TM ions in a honeycomb lattice, it would be enough to modify the relative hopping strength of the 2nd and 3rd NN hoping channels. Although their theory expects that these systems should be in the MI phase with the magnetic exchange interaction between the TM ions being properly designed, the topological phase could also be turned in the paramagnetic insulating limit.
In Sec. IV, we have shown the possibility of the MI with nontrivial band topology in a system with the honeycomb lattice structure. However, the estimated values for Na2IrO3, Li2IrO3, and -RuCl3 are much larger than studied in Fig. 7. Their values are estimated around for Na2IrO3 and for -RuCl3 BHKim2016 . In such a large limit, the effective spin model with relativistic doublets is expected to be a better description for the insulating state. In the system with the honeycomb lattice structure, the magnetic exchange interaction between the 1st NN sites can be expressed with three different parameters: isotropic Heisenberg term (), Kitaev term (), and symmetric off-diagonal term () Rau2014 . Furthermore, the relative strength of these three magnetic interaction terms can be varied with . When and , only the Kitaev term is accessible for finite Hund’s coupling Chaloupka2010 . Thus, in this case, the magnetic spin liquid can be stabilized. In contrast, the Kitaev term is diminished and only the Heisenberg term is survived when . Thus, it gives rise to the antiferromagnetic Neél order Chaloupka2010 . Because the off-diagonal parameter is proportional to , its magnitude is maximum at and , whereas it is absent at , , and .
VI Conclusion
We have investigated the topological property of a system with a honeycomb lattice structure such as Na2IrO3 and the isostructural Li2IrO3 and -RuCl3. By calculating the bulk topological invariant and the energy band dispersions of edge states, we have unraveled that the hopping parameter , which determines the relative strength of the two different processes in the 1st NN hopping channel, plays an essential role in the topological phase transition between the trivial BI and the TBI. When the -type hopping process mediated by the edge-shared ligands is dominant, the topologically trivial phase is favorable. On the other hand, when the -type direct hopping process becomes stronger, the topological phase transition occurs to the TBI phase at the critical where the band gap is closed at the or points.
We have also explored the topological phase transition when the Coulomb repulsion is introduced. As expected, we have shown that the BI phase is transferred into the MI phase with increasing . We have found that there are the following four cases for this transition to occur. i) The electronic phase transition occurs from a BI to a MI with trivial band topology, accompanied with closing the single-particle excitation gap (at non-TRIM points) at the same critical value. ii) The topological phase transition occurs from a TBI to a BI with the single-particle excitation gap closing at TRIM points, followed by the electronic phase transition from a BI to a topologically trivial MI with the single-particle excitation gap closing at non-TRIM points. iii) The topological phase transition occurs within a MI from trivial to nontrivial band topology at the critical where the single-particle Green’s function exhibits zeros, not poles, at the Fermi energy and at TRIM points. iv) In a wide range of values, the electronic phase transition occurs from a TBI to a MI without changing the band topology, where the single-particle excitation gap at the and points is closed at the same critical value. Therefore, our calculations confirm the possibility of the MI phase with nontrivial band topology in a system with a honeycomb lattice structure.
Acknowledgements.
The authors acknowledge S. Miyakoshi for fruitful discussion. The numerical calculations have been performed with the RIKEN supercomputer system (HOKUSAI GreatWave). This work has been supported by Grant-in-Aid for Scientific Research from MEXT Japan under Grant No. 25287096 and also by RIKEN iTHES Project and Molecular Systems. K. S. acknowledges support from the JSPS Overseas Research Fellowships. T. S. acknowledges Simons Foundation for financial support (award no. 534160).
Appendix A Cluster perturbation theory
With the help of the exact diagonalization method based on the Lanczos algorithm Morgan93 , we calculate the ground state with its energy for the electron configuration in the six-site cluster under the open boundary conditions. Let () and () be the -th eigenvalue and eigenstate of the cluster with the total number of electrons being one less (more) than that of the ground state. The cluster single-particle Green’s function is given as
[TABLE]
where is complex frequency, , , , and Zacher2002 ; Aichhorn2006 . is the annihilation operator at site in the cluster and denotes both spin and orbital degrees of freedom. The chemical potential for the cluster is given as , where and are the minimum energy among and , respectively. Therefore, the Fermi energy is located in the middle of the lowest one-electron and highest one-hole additional energy bands. Using the band Lanczos method Freund , we calculate , , , and to obtain .
In the CPT Senechal2002 , the lattice single-particle Green’s function of the supercell composed of the clusters is calculated as
[TABLE]
where is the cluster Green’s function given in Eq. (4) and is the Fourier transformation of the inter-cluster hopping matrix. Here, is the momentum in the Brillouin zone of the supercell. Note that the lattice single-particle Green’s function evaluated from the CPT sometimes fails to describe the total number of electrons correctly even when the cluster Green’s function gives the correct number. This always happens when the electron-hole symmetry of is broken. To overcome this difficulty, here we adopt the VCA Potthoff2003 with the chemical potential of the cluster treated as a variational parameter. In this treatment, the cluster Green’s function is calculated in Eq. (4) with replaced with . The additional term is also added in in order that the replacement of the chemical potential does not change the overall Hamiltonian. Thus, Eq. (5) is modified as
[TABLE]
where .
The chemical potential is determined so as to satisfy the stationary condition of the grand potential function , i.e., , under the condition that the average number of electrons per site is 5. Here, the grand potential function at the zero temperature is given as
[TABLE]
where is the grand potential function of the cluster, is the total number of electrons in the cluster (i.e., for the six-site cluster), and refers to the integration of the momentum over the Brillouin zone of the supercell.
Note that the lattice single-particle Green’s function is given in terms of the supercell momentum . In general, the symmetry of the supercell can be different from that of the original honeycomb lattice. Therefore, in order to obtain the single-particle Green’s function at the momentum in terms of the original honeycomb lattice, we periodize the Green’s function as
[TABLE]
where in the left hand side is referred to as state at the -th () base in the unit cell of the original honeycomb lattice, and is the remainder after dividing by 2 (i.e., ). is the lattice vector of the unit cell of the honeycomb lattice within the cluster that contains site . The supercell momentum that corresponds to the momentum can be obtained by properly subtracting from a reciprocal lattice vector of the supercell. Finally, the periodized spectral function can be evaluated as
[TABLE]
where is real frequency and is the broadening parameter taken as in our calculations.
Appendix B Spectral functions
Figure A1 shows the spectral functions calculated from Eq. (9) for the same parameters used to obtain the energy dispersions of the topological Hamiltonian in Fig. 8. When , we can observe that, as increases, subbands with weak intensity appear inside the main bands with dominant intensity. On the other hand, when as in the case of , the overall shapes of spectral functions near the Fermi energy resemble those for the Kane-Mele-Hubbard model with a finite SOC (see Refs. Yu2011, ; Grandi2015, ). In this case, as shown in Figs. A1(g)–A1(i), the conduction and valence bands around the and points are split into two subbands, each of which exhibits similar spectral weight.
Appendix C Breakdown of the topological Hamiltonian
We find that the topological Hamiltonian obtained in our calculations is sometimes broken down for the particular parameter regions specially when is predominant. For example, the topological Hamiltonian for and shown in Fig. A2(c) does not preserve the IS and TRS as it should. The topological Hamiltonian for and shown in Fig. A2(d) exhibits several singularities, although it preserves the correct symmetry. In these cases, the topological invariant based on the topological Hamiltonian is not well defined. One possibility of these kinds of breakdown is due to the failure of precise numerical calculations. We have found that the convergence of the ground state for these parameters as in Fig. A2(c) is much poorer than that for other parameters. On the other hand, the convergence of the ground state for the parameters such as the case in Fig. A2(d) is almost similar to that for other parameters where the topological Hamiltonian is well defined. Thus, in this case, the numerical error for the calculation of the ground state does not seem serious. To resolve these difficulties, more precise numerical analysis is required.
The reference list from the paper itself. Each links out to its DOI / PubMed record.
- 1(1) M. Z. Hasan and C. L. Kane, Rev. Mod. Phys. 82 , 3045 (2010) .
- 2(2) L. Fu and C. L. Kane, Phys. Rev. B 74 , 195312 (2006) .
- 3(3) L. Fu and C. L. Kane, Phys. Rev. B 76 , 045302 (2007) .
- 4(4) L. Fu, C. L. Kane, and E. J. Mele, Phys. Rev. Lett. 98 , 106803 (2007) .
- 5(5) Y. Ando, J. Phys. Soc. Jpn. 82 , 102001 (2013)
- 6(6) C. L. Kane and E. J. Mele, Phys. Rev. Lett. 95 , 146802 (2005) .
- 7(7) C. L. Kane and E. J. Mele, Phys. Rev. Lett. 95 , 226801 (2005) .
- 8(8) B. A. Bernevig, T. L. Hughes, S.-C. Zhang, Science 314 , 1757 (2006) .