Resolved young binary systems and their disks
Rachel L. Akeson, Eric L. N. Jensen, John Carpenter, Luca Ricci, Emily, Laos, Natasha F. Nogueira, and Emma M. Suen-Lewis

TL;DR
This study uses high-resolution ALMA observations to analyze protoplanetary disks in young binary systems, revealing that multiplicity affects disk mass and distribution, with implications for planet formation.
Contribution
It provides the first large-scale, high-resolution survey of disks in young binary systems, showing how multiplicity influences disk properties and mass distribution.
Findings
Binary systems have lower millimeter flux than single stars of similar mass.
Disks around primary stars do not dominate the total system mass.
Over 75% of surveyed stars have detectable disks.
Abstract
We have conducted a survey of young single and multiple systems in the Taurus-Auriga star-forming region with the Atacama Large Millimeter Array (ALMA), substantially improving both the spatial resolution and sensitivity with which individual protoplanetary disks in these systems have been observed. These ALMA observations can resolve binary separations as small as 25--30 AU and have an average 3 detection level of 0.35 mJy, equivalent to a disk mass of M for an M3 star. Our sample was constructed from stars that have an infrared excess and/or signs of accretion and have been classified as Class II. For the binary and higher order multiple systems observed, we detect mm continuum emission from one or more stars in all of our target systems. Combined with previous surveys of Taurus, our 21 new detections increase the fraction of…
Click any figure to enlarge with its caption.
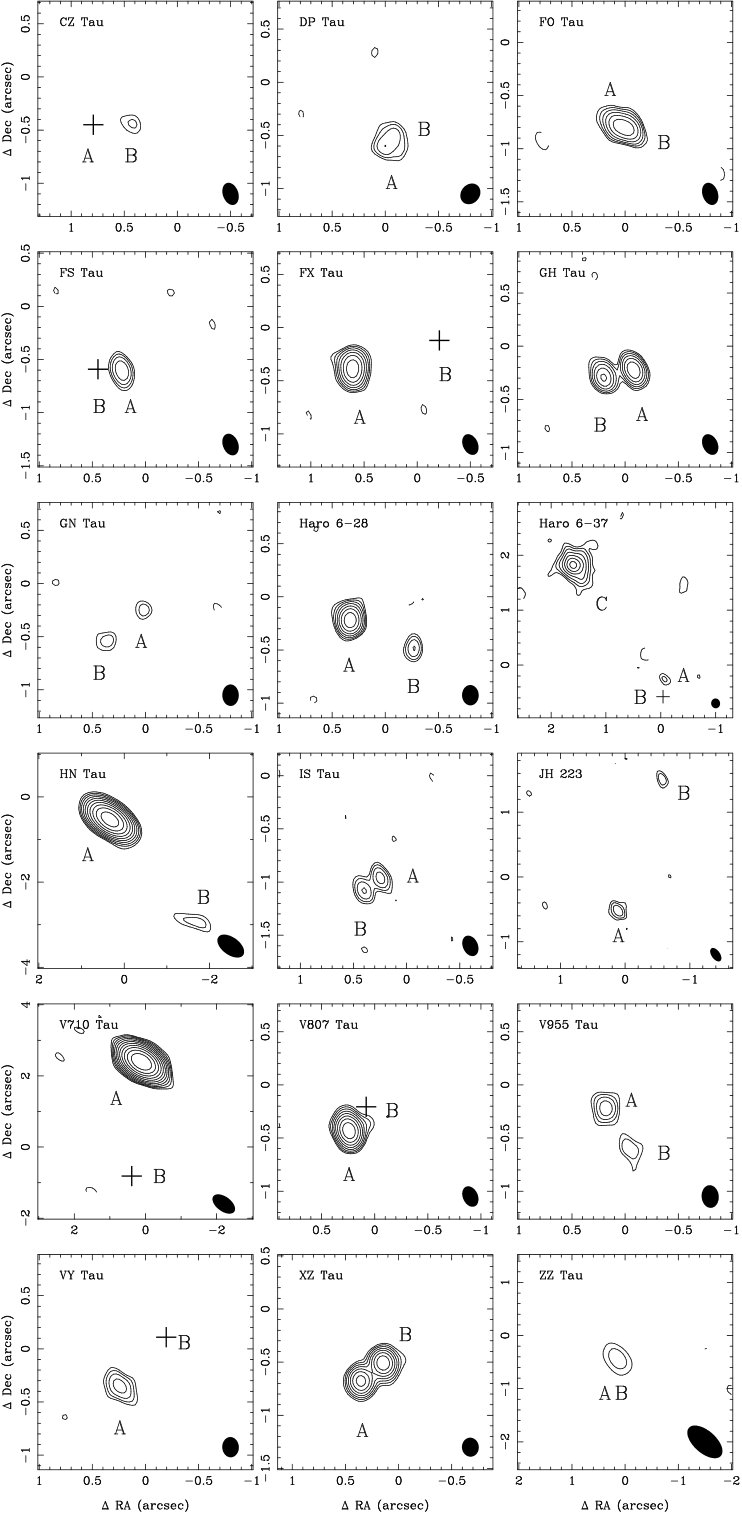 Figure 1
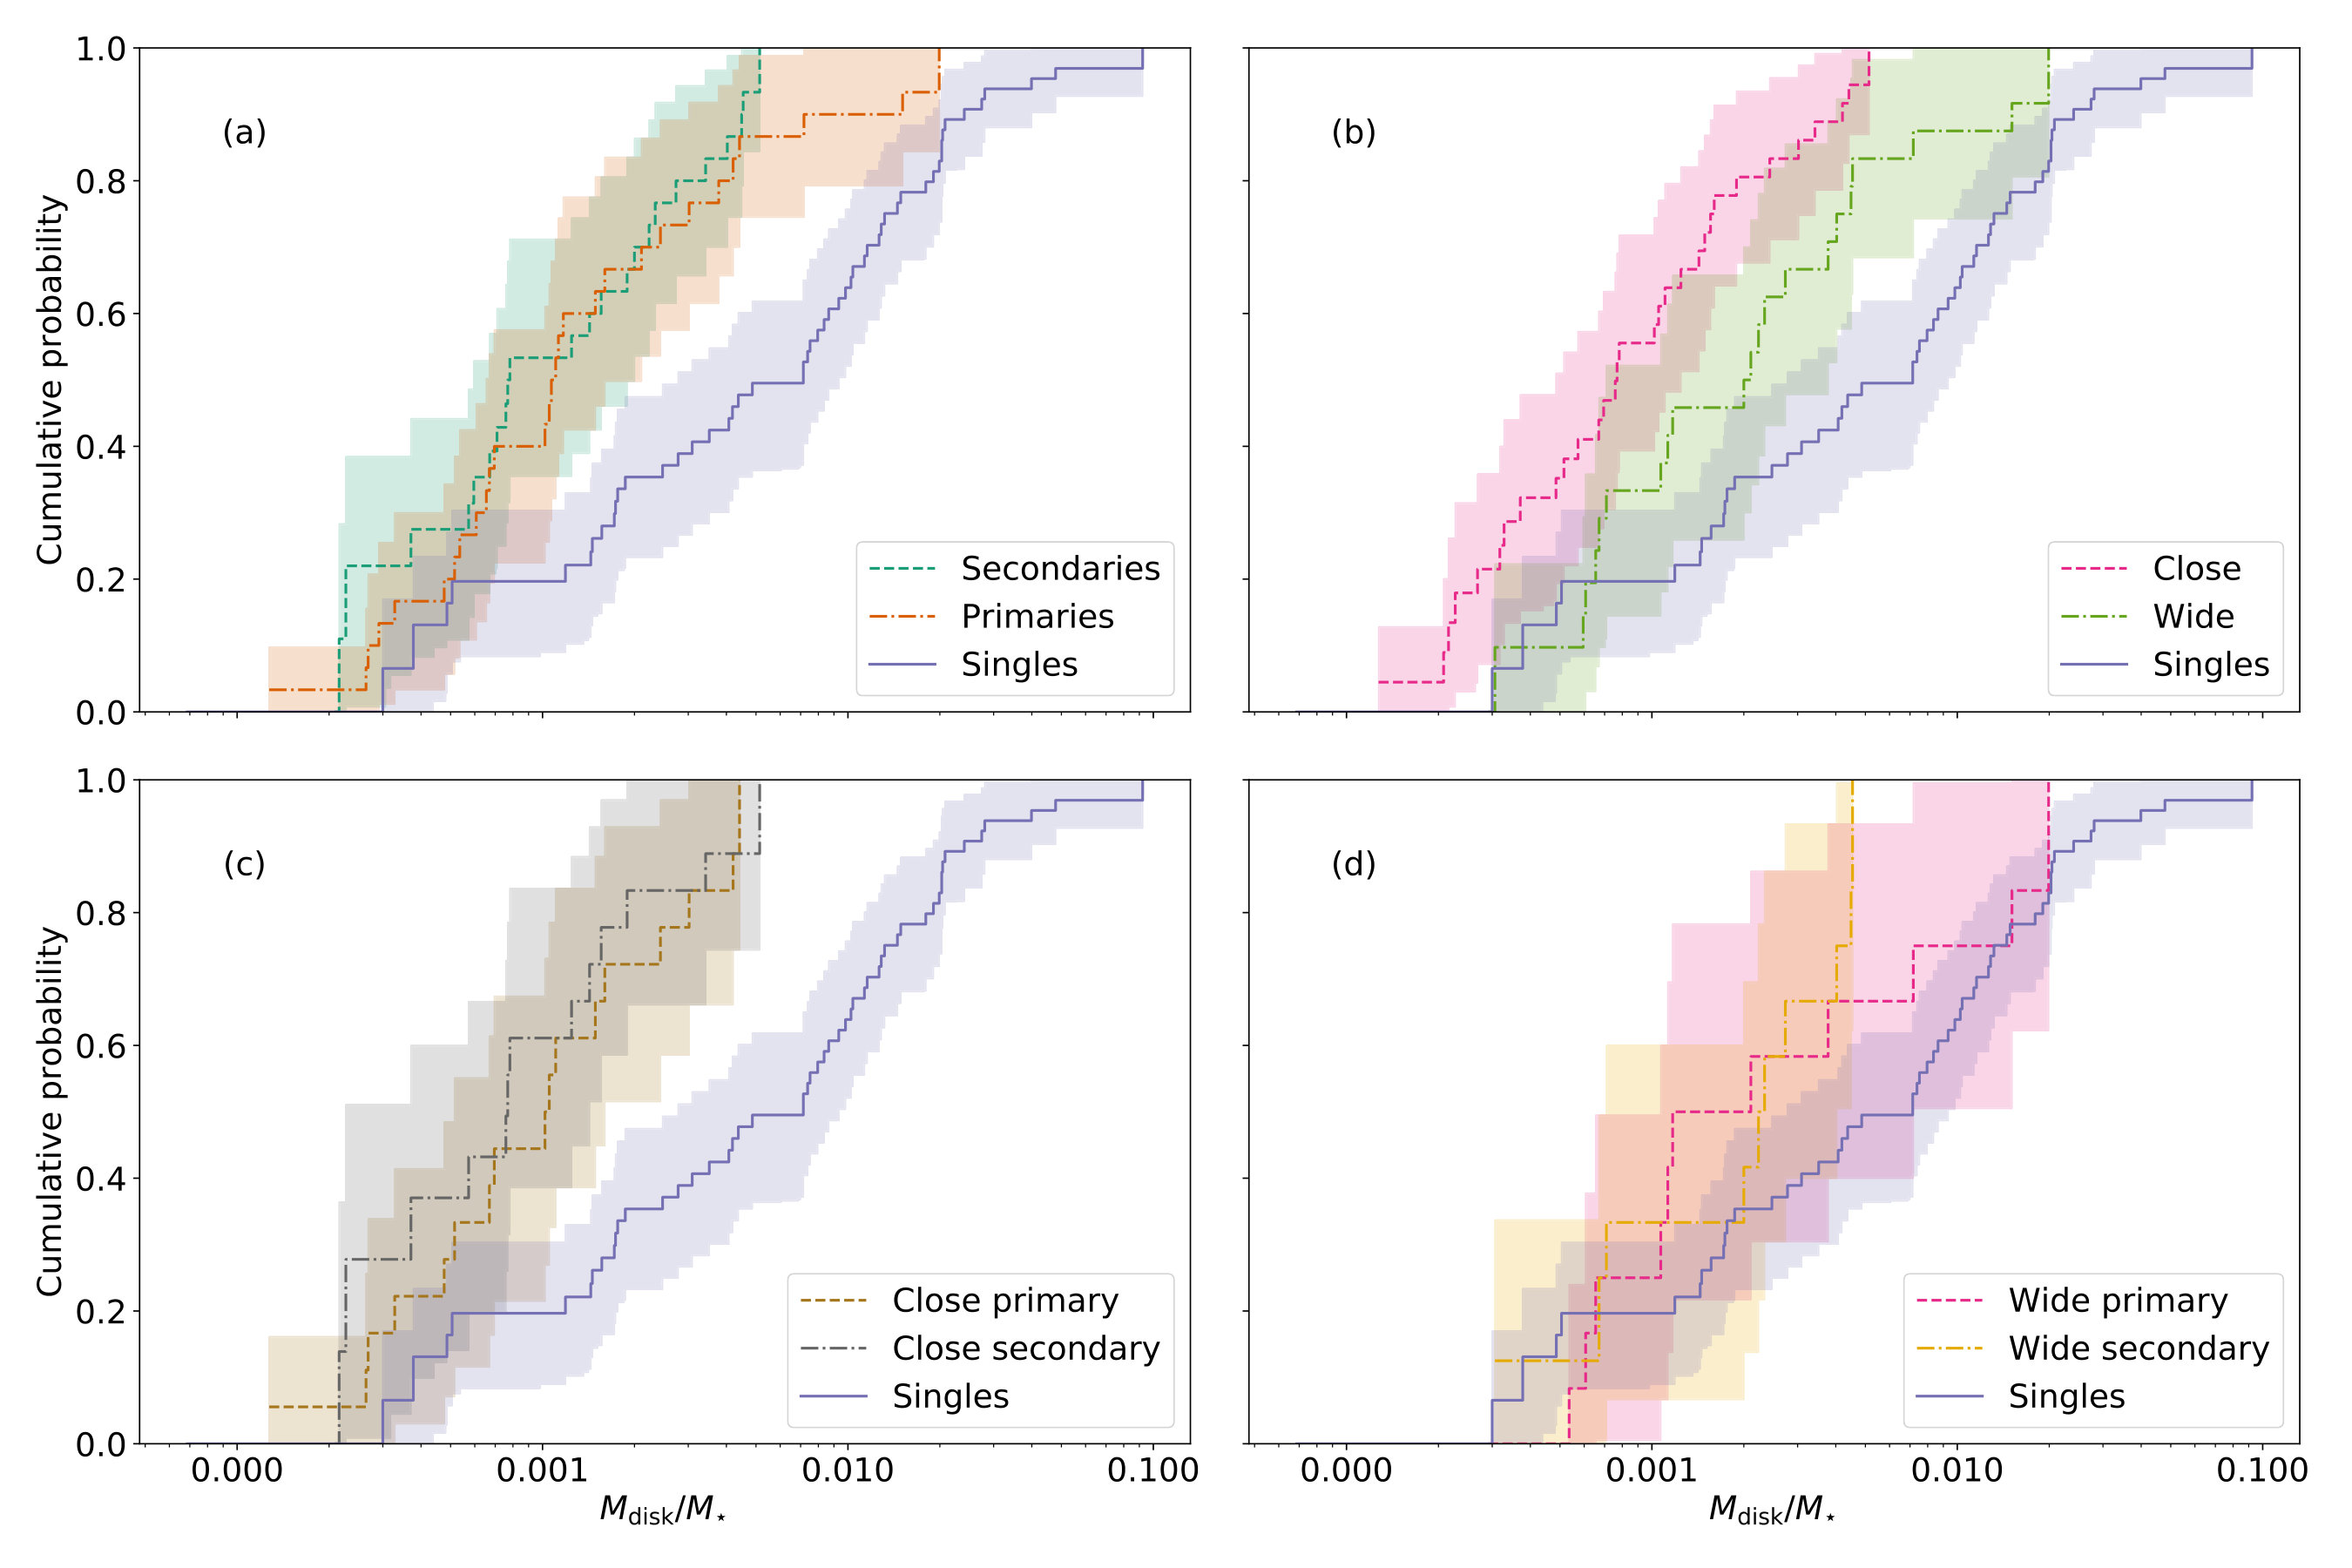 Figure 2
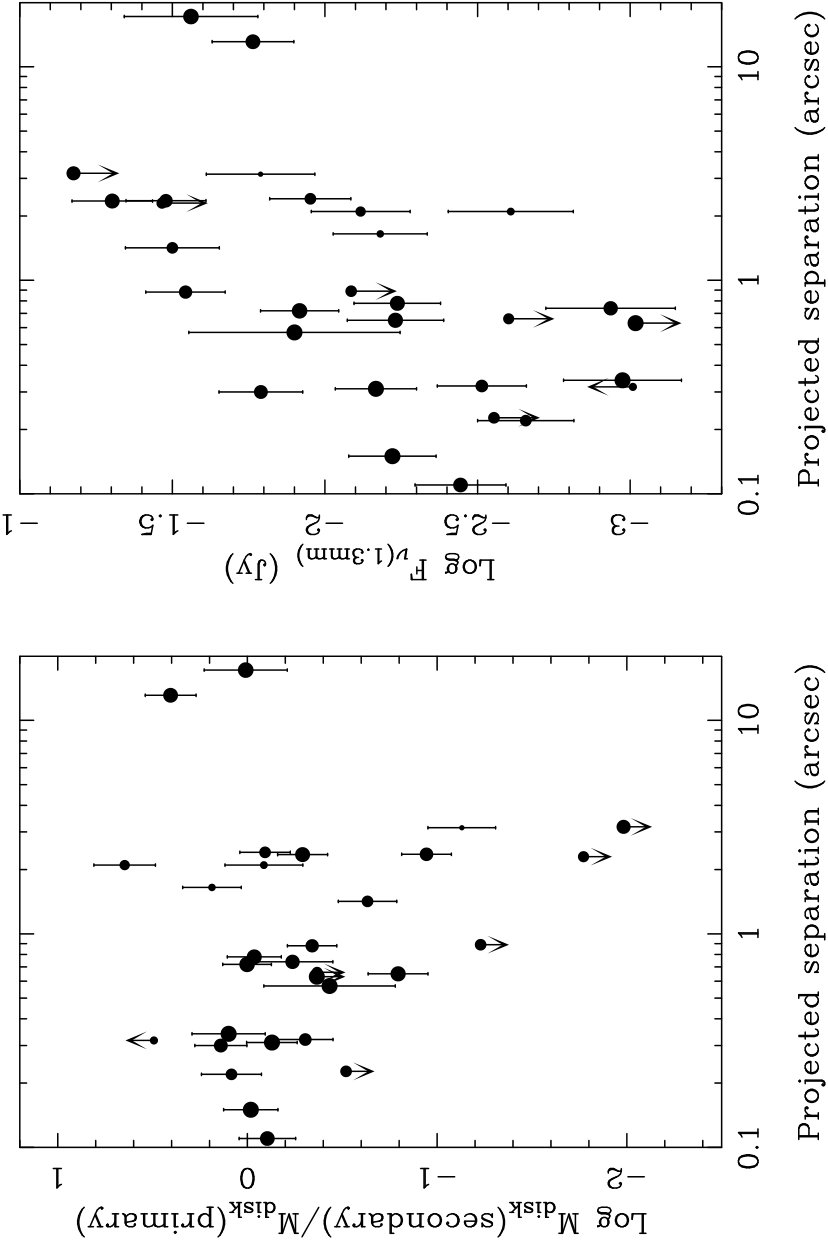 Figure 3
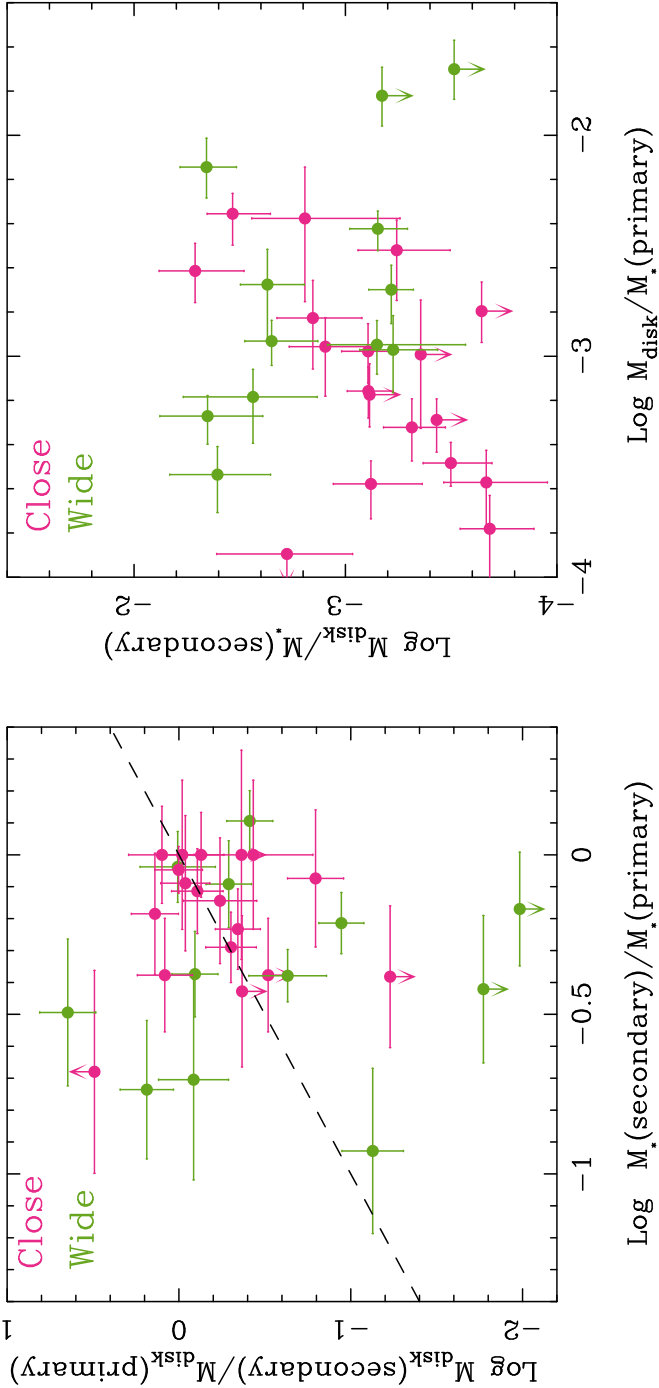 Figure 4
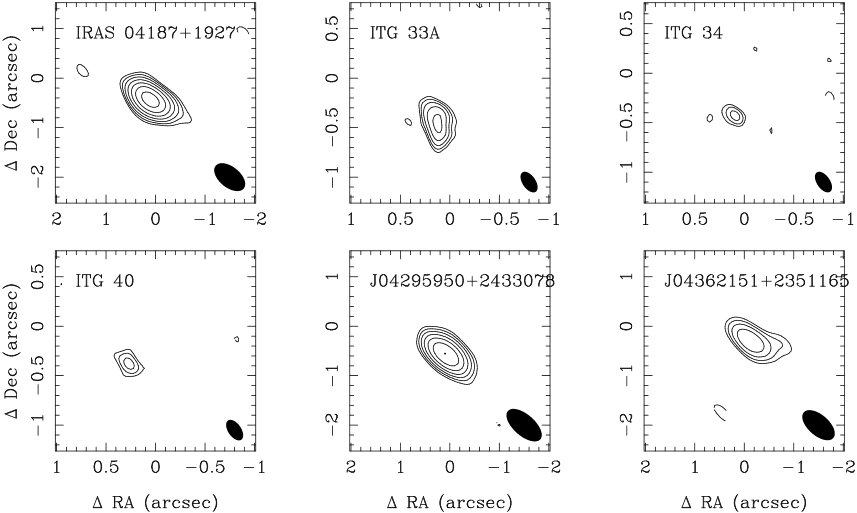 Figure 5
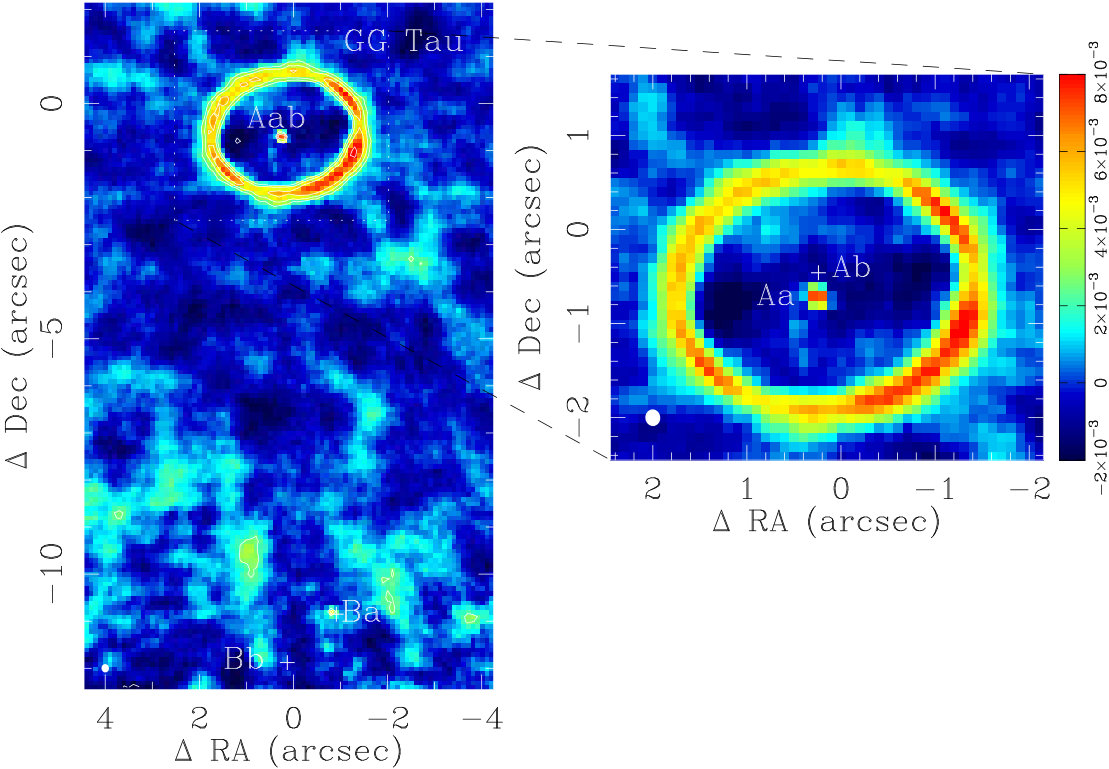 Figure 6
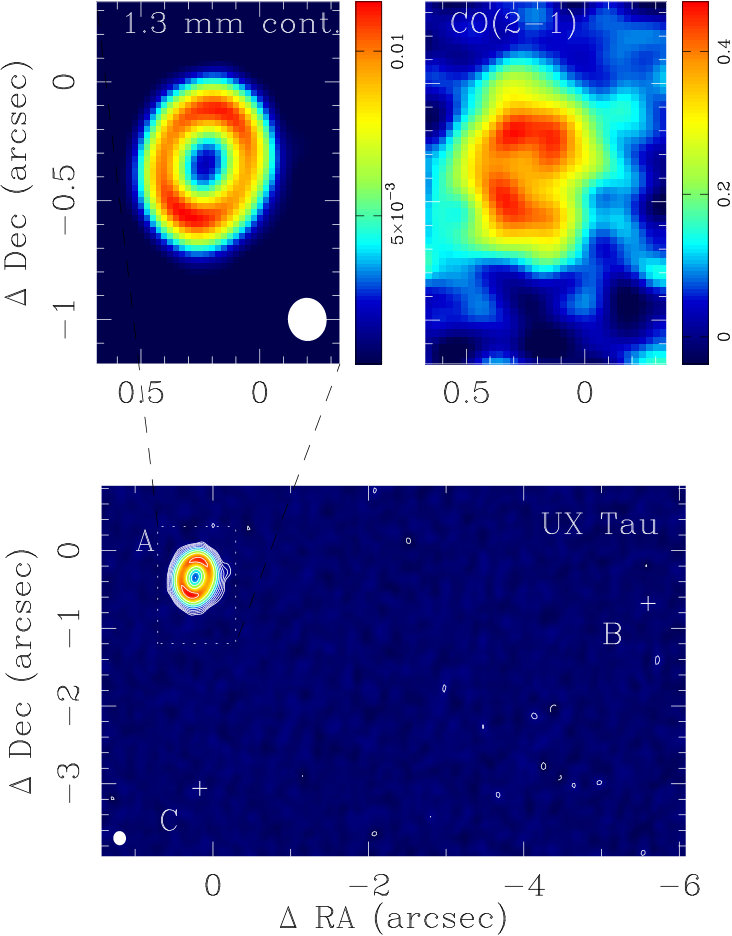 Figure 7
 Figure 8
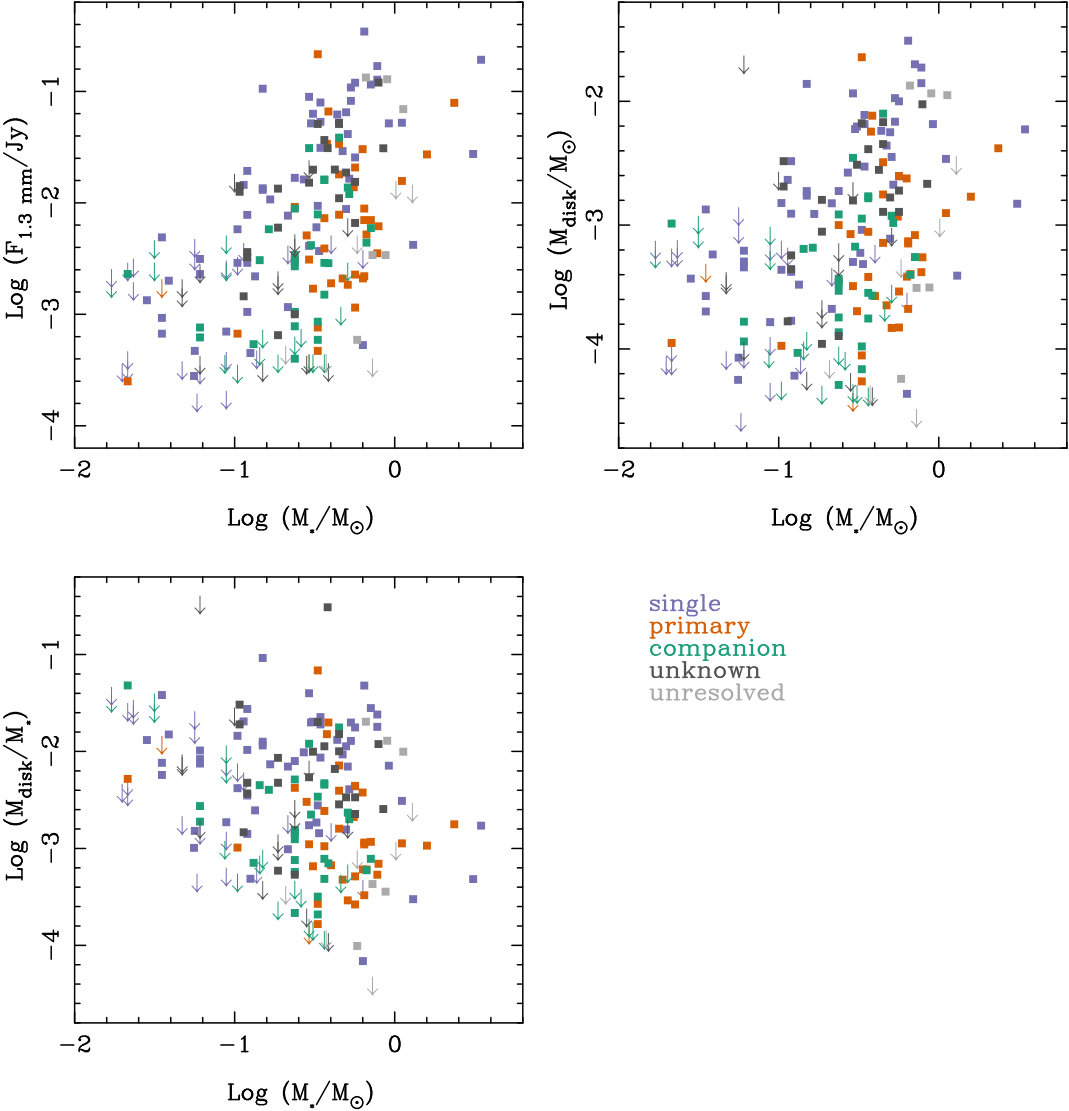 Figure 9
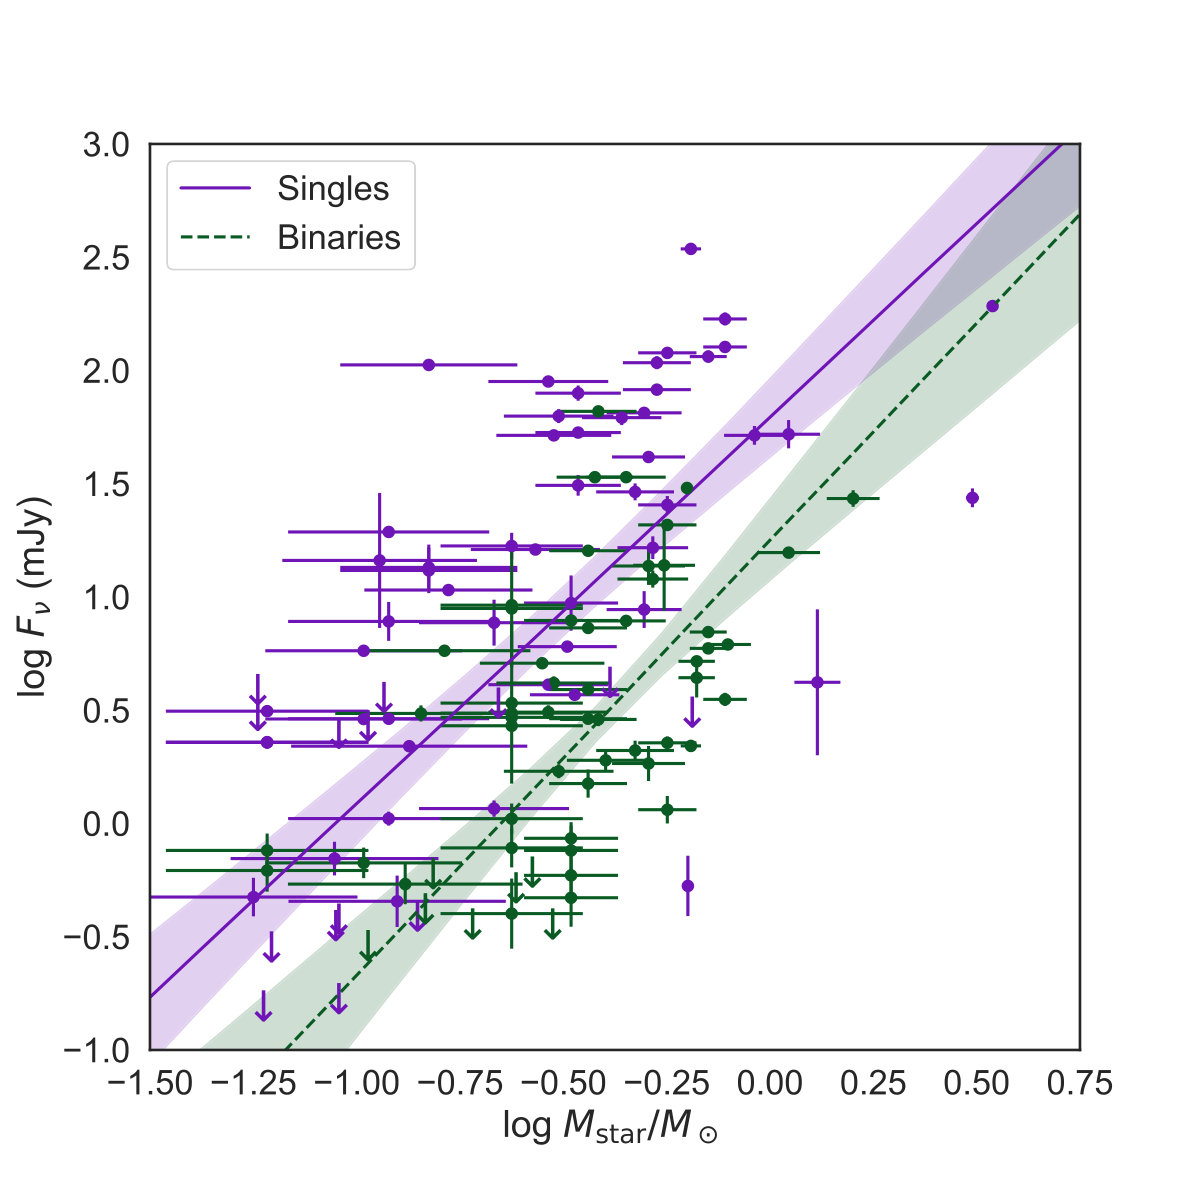 Figure 10
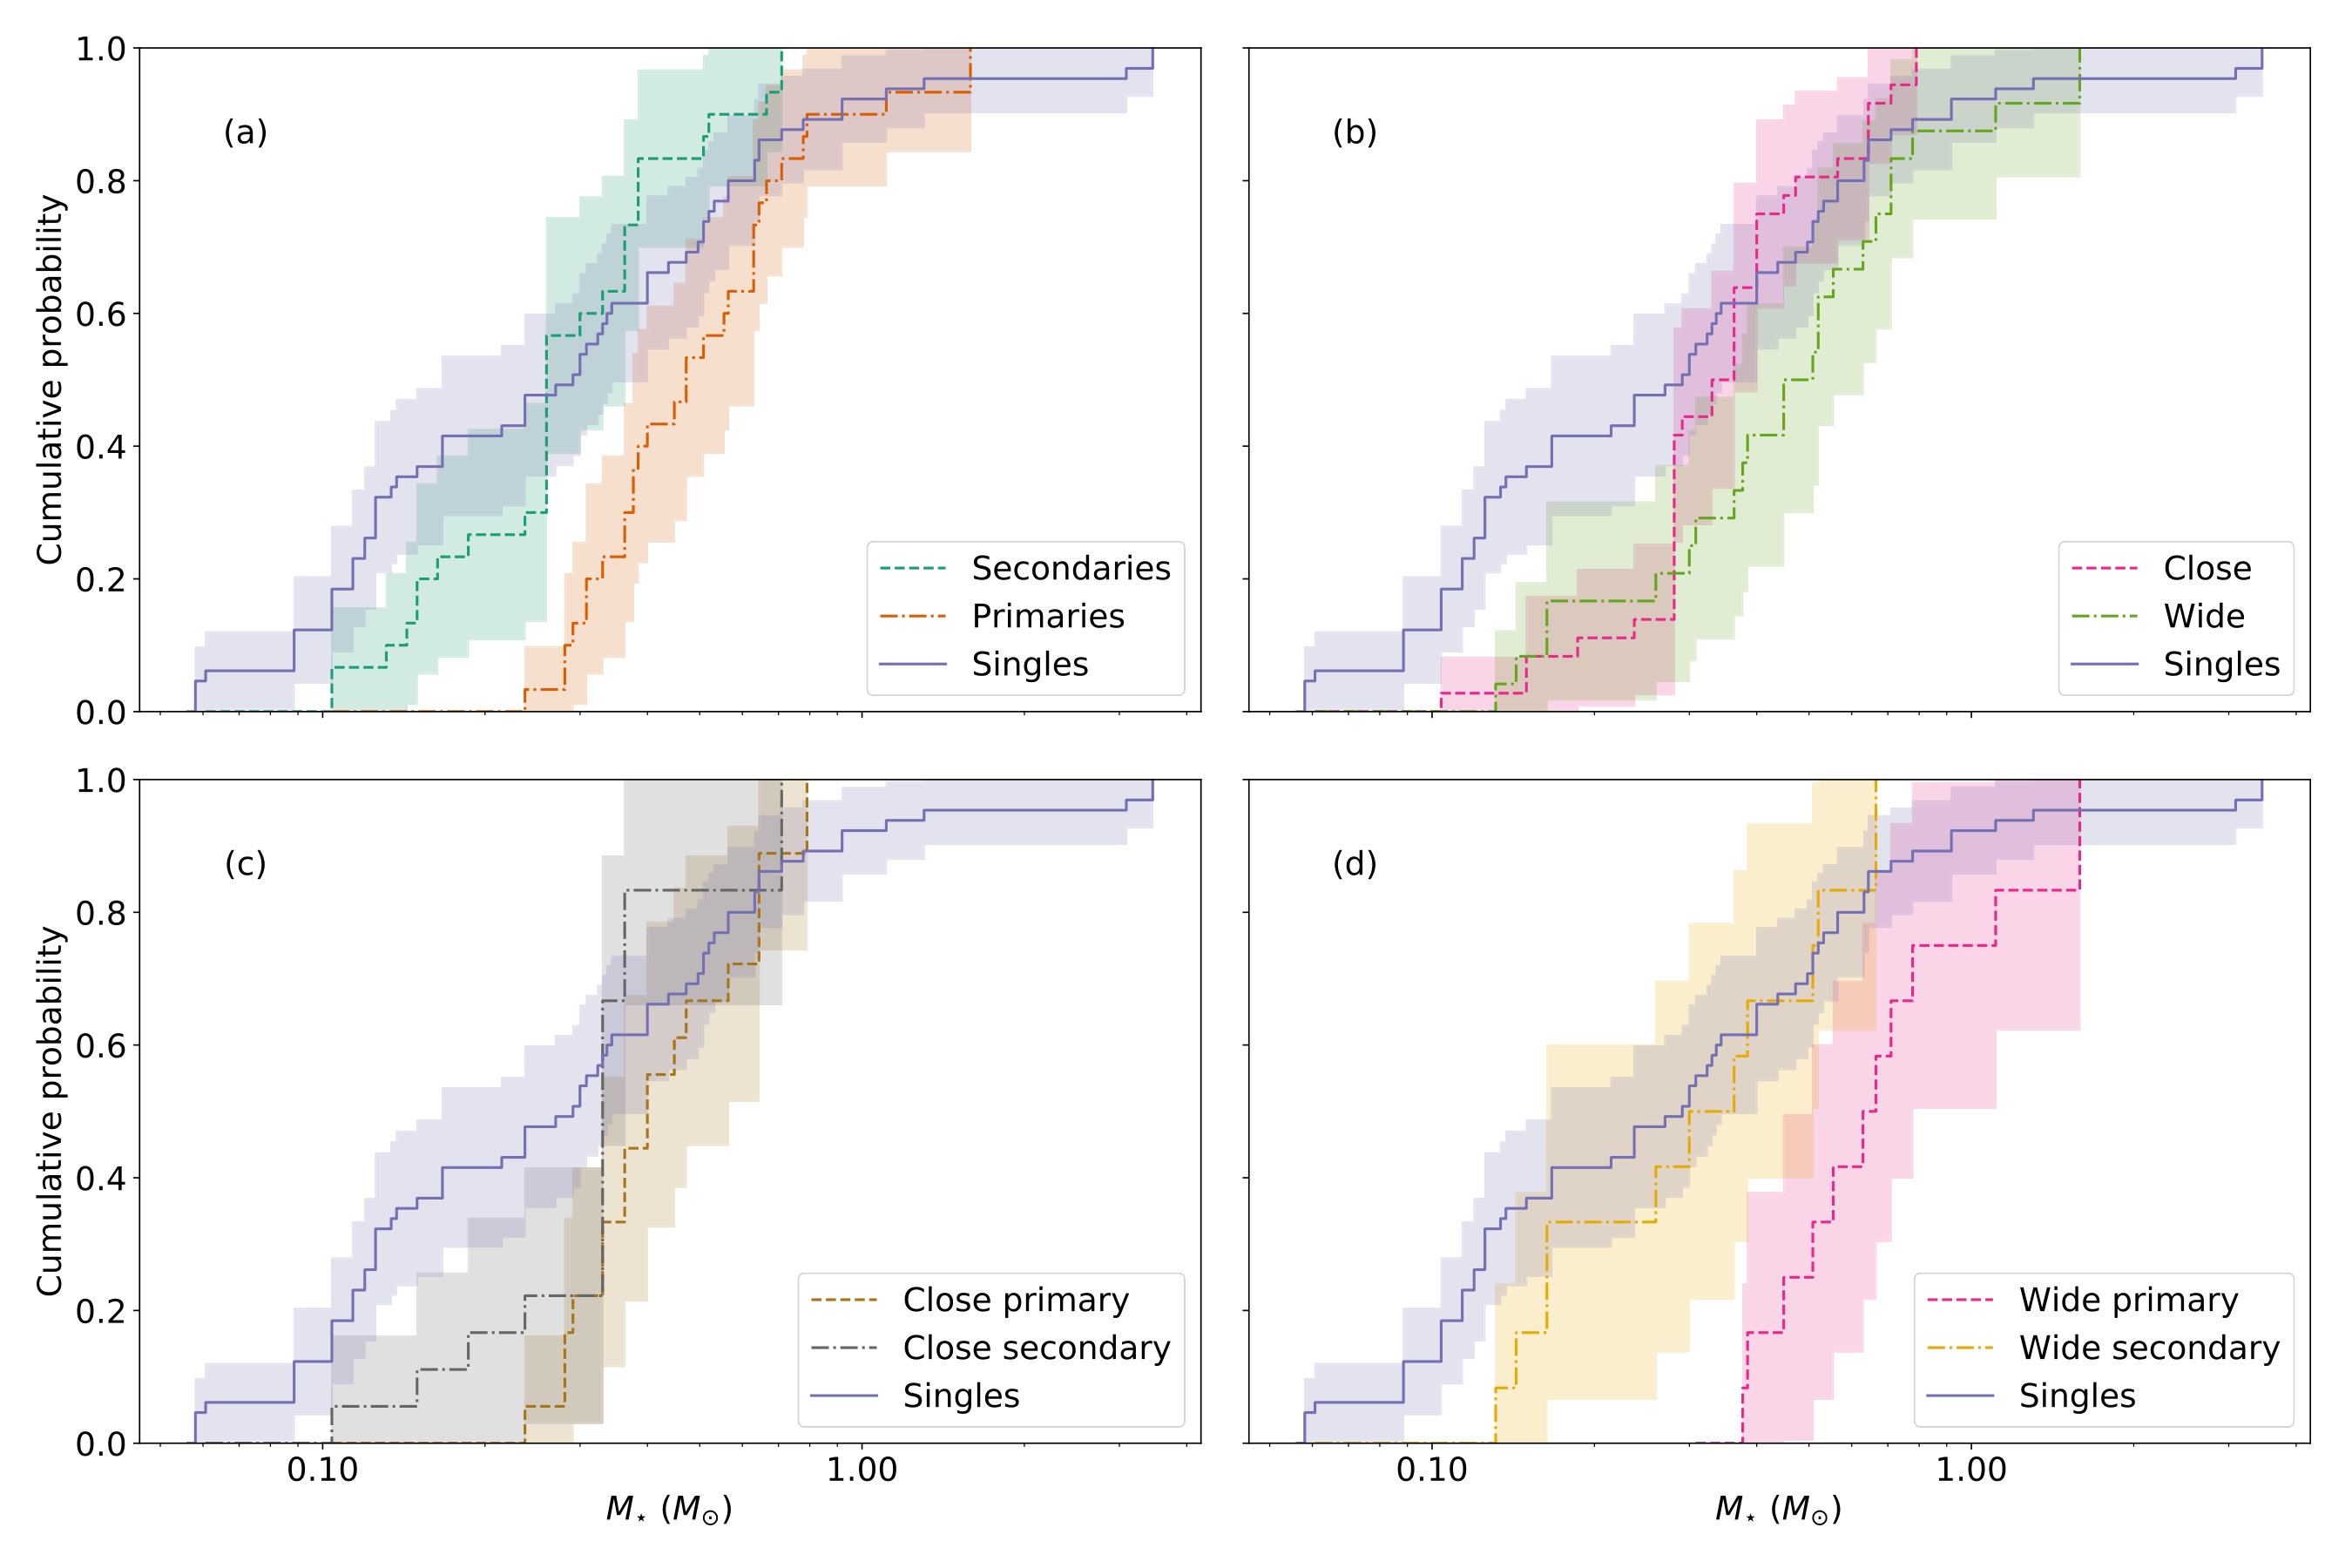 Figure 11
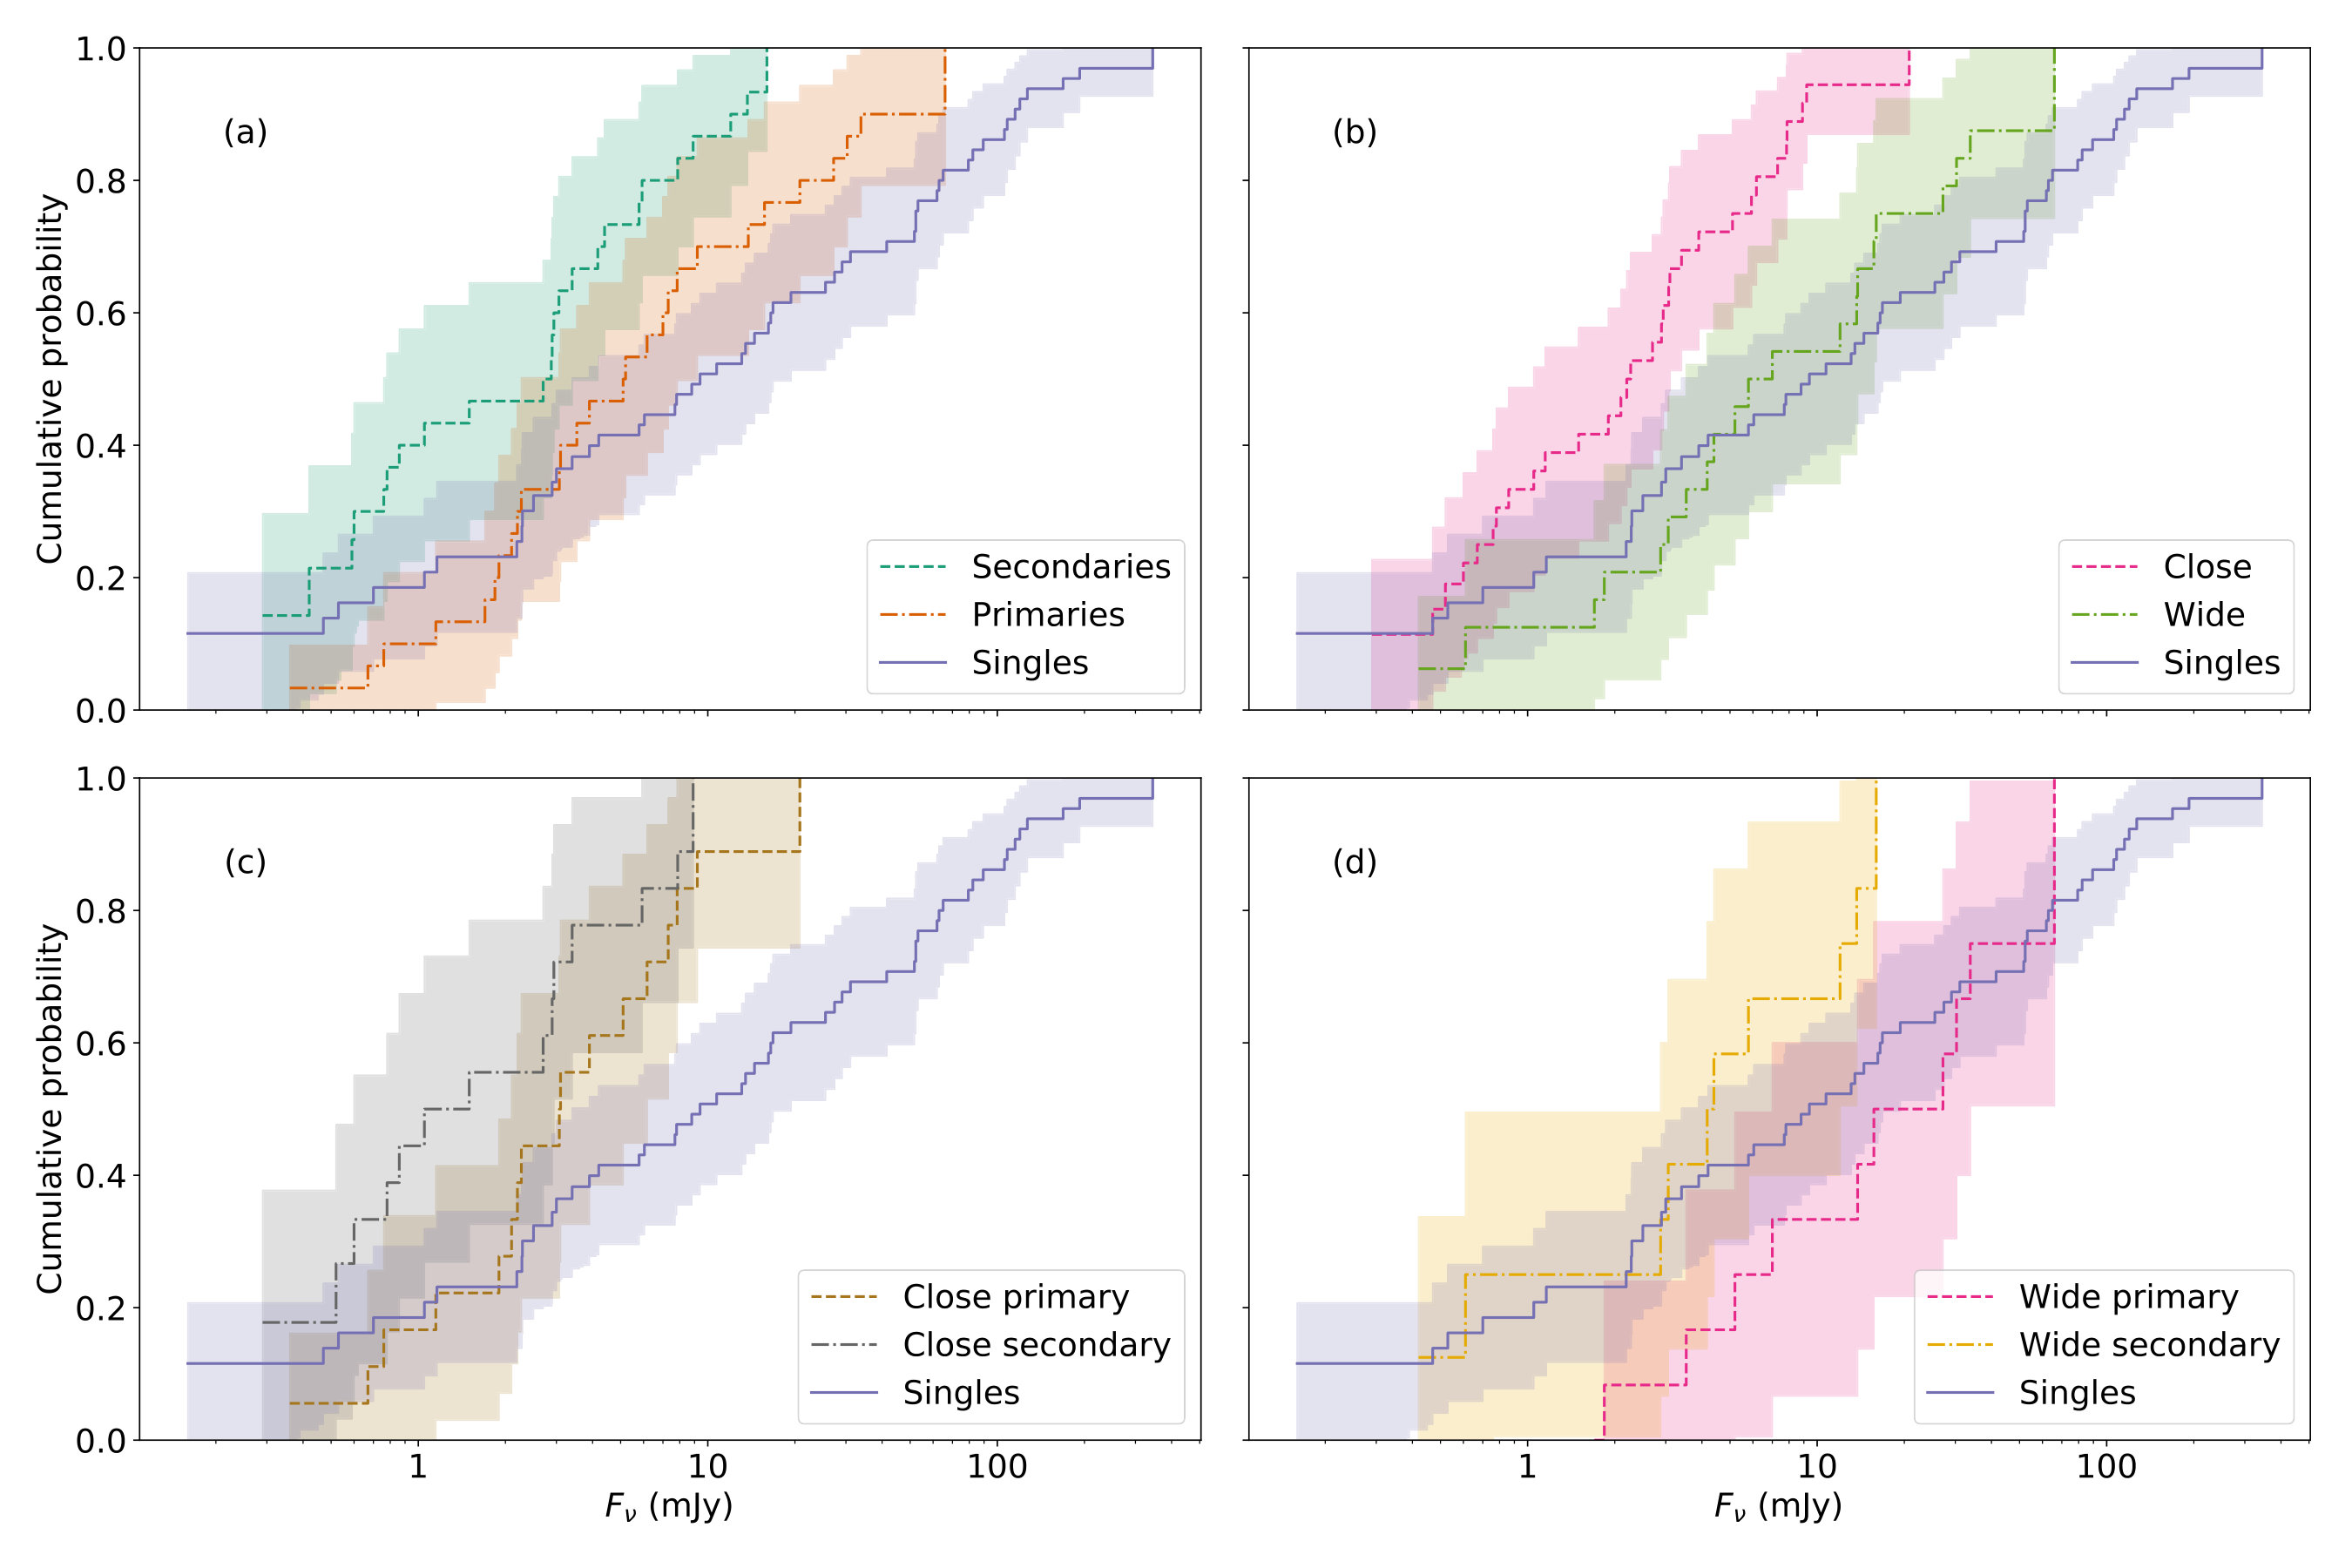 Figure 12
| Project code | Observation Date | Antennas | Beam (arcs) |
|---|---|---|---|
| 2013.1.00105.S | 2015 May 3aaHigh rms; data not used. | 36 | 1.7 x 0.9 |
| 2013.1.00105.S | 2015 May 3 | 36 | 0.18 x 0.16 |
| 2013.1.00105.S | 2015 Sept 18 | 34 | 0.24 x 0.13 |
| 2013.1.00105.S | 2015 Sept 19 | 36 | 0.22 x 0.14 |
| 2015.1.00392.S | 2016 July 1bbRepeat of first 2015 May 3 dataset; used in analysis here. | 41 | 0.75 x 0.42 |
| 2MASS designation | Source name | 1.3mm Peak | 1.3 mm Int. | Beam | PA | RA | Dec. | Deconvolved | Deconvolved | ||
|---|---|---|---|---|---|---|---|---|---|---|---|
| Flux (mJy) | Flux (mJy) | (arcsec) | (deg) | J2000 | (arcsec) | J2000 | (arcsec) | maj. axis | min. axis | ||
| (mas) | (mas) | ||||||||||
| J04144928+2812305 | FO Tau A | 3.07 0.12 | 3.00 0.30 | 0.21x0.14 | 18.9 | 04:14:49.297 | 0.005 | 28:12:30.122 | 0.006 | 161 36 | 126 37 |
| J04144928+2812305 | FO Tau B | 2.94 0.12 | 3.00 0.30 | 0.21x0.14 | 18.9 | 04:14:49.288 | 0.006 | 28:12:30.086 | 0.007 | … | … |
| J04183158+2816585 | CZ Tau A | 0.36 | … | … | … | … | … | … | … | ||
| J04183158+2816585 | CZ Tau B | 0.60 0.12 | 0.62 0.12 | 0.22x0.14 | 19.3 | 04:18:31.621 | 0.018 | 28:16:58.173 | 0.016 | … | … |
| J04214323+1934133 | IRAS 04187+1927 | 4.24 0.10 | 3.72 0.17 | 0.73x0.42 | 51.0 | 04:21:43.243 | 0.040 | 19:34:13.116 | 0.040 | … | … |
| J04220217+2657304 | FS Tau A | 1.90 0.14 | 2.27 0.14 | 0.21x0.14 | 21.3 | 04:22:02.194 | 0.006 | 26:57:30.368 | 0.005 | … | … |
| J04220217+2657304 | FS Tau B | 0.41 | … | … | … | … | … | … | … | ||
| J04263055+2443558 | … | 0.30 | … | … | … | … | … | … | … | ||
| J04295950+2433078 | … | 3.10 0.09 | 2.87 0.15 | 0.87x0.43 | 48.8 | 04:29:59.513 | 0.040 | 24:33:07.285 | 0.040 | 758 20 | 422 8 |
| J04300399+1813493 | UX Tau A | 11.50 0.50 | 79.00 2.00 | 0.18x0.16 | -174.5 | … | … | … | … | 470 25 | 320 25 |
| J04300399+1813493 | UX Tau Ba | 0.37 | … | … | … | … | … | … | … | ||
| J04300399+1813493 | UX Tau Bb | 0.37 | … | … | … | … | … | … | … | ||
| J04300399+1813493 | UX Tau C | 0.37 | … | … | … | … | … | … | … | ||
| J04302961+2426450 | FX Tau A | 5.60 0.12 | 7.84 0.33 | 0.20x0.14 | 24.7 | 04:30:29.659 | 0.003 | 24:26:44.740 | 0.003 | … | … |
| J04302961+2426450 | FX Tau B | 0.37 | … | … | … | … | … | … | … | ||
| J04305137+2442222 | ZZ Tau AB | 0.59 0.10 | 0.42 0.13 | 0.80x0.42 | 48.6 | 04:30:51.389 | 0.040 | 24:42:21.864 | 0.040 | … | … |
| J04314007+1813571 | XZ Tau A | 7.30 0.18 | 7.37 0.46 | 0.18x0.16 | -175.5 | 04:31:40.097 | 0.003 | 18:13:56.640 | 0.004 | 93 22 | 51 39 |
| J04314007+1813571 | XZ Tau B | 8.70 0.18 | 8.92 0.52 | 0.18x0.16 | -175.5 | 04:31:40.082 | 0.003 | 18:13:56.805 | 0.004 | 138 17 | 70 23 |
| J04315779+1821380 | V710 Tau A | 53.00 0.20 | 66.00 0.56 | 0.73x0.41 | 53.5 | 04:31:57.805 | 0.003 | 18:21:37.616 | 0.003 | 373 12 | 489 2 |
| J04315779+1821380 | V710 Tau B | 0.61 | … | … | … | … | … | … | … | ||
| J04315968+1821305 | LkHa 267 | 0.30 | … | … | … | … | … | … | … | ||
| J04321606+1812464 | BHS98 MHO 5 | 0.31 | … | … | … | … | … | … | … | ||
| J04322415+2251083 | … | 0.30 | … | … | … | … | … | … | … | ||
| J04323028+1731303 | GG Tau Aa | 8.70 0.74 | 7.05 1.60 | 0.18x0.16 | -173.8 | 04:32:30.364 | 0.009 | 17:31:40.175 | 0.008 | … | … |
| J04323028+1731303 | GG Tau Ab | 2.22 | … | … | … | … | … | … | … | ||
| J04323028+1731303 | GG Tau Ba | 2.40 | … | … | … | … | … | … | … | ||
| J04323028+1731303 | GG Tau Bb | 2.40 | … | … | … | … | … | … | … | ||
| J04330622+2409339 | GH Tau A | 3.60 0.11 | 3.91 0.20 | 0.20x0.14 | 24.9 | 04:33:06.218 | 0.003 | 24:09:33.640 | 0.003 | … | … |
| J04330622+2409339 | GH Tau B | 2.60 0.11 | 2.89 0.20 | 0.20x0.14 | 24.9 | 04:33:06.239 | 0.004 | 24:09:33.576 | 0.003 | … | … |
| J04330664+2409549 | V807 Tau A | 8.10 0.11 | 8.94 0.26 | 0.20x0.14 | 24.4 | 04:33:06.646 | 0.003 | 24:09:54.737 | 0.003 | … | … |
| J04330664+2409549 | V807 Tau Bab | 0.33 | … | … | … | … | … | … | … | ||
| J04330945+2246487 | … | 0.28 | … | … | … | … | … | … | … | ||
| J04333678+2609492 | IS Tau A | 1.50 0.12 | 1.15 0.12 | 0.20x0.14 | 24.4 | 04:33:36.804 | 0.007 | 26:09:48.777 | 0.008 | … | … |
| J04333678+2609492 | IS Tau B | 1.20 0.12 | 1.05 0.12 | 0.20x0.14 | 24.4 | 04:33:36.816 | 0.009 | 26:09:48.663 | 0.011 | … | … |
| J04333935+1751523 | HN Tau A | 7.10 0.10 | 15.70 1.90 | 0.72x0.41 | 53.6 | 04:33:39.376 | 0.033 | 17:51:51.974 | 0.042 | 1390 120 | 350 140 |
| J04333935+1751523 | HN Tau B | 0.57 0.10 | 0.54 0.10 | 0.72x0.41 | 53.6 | 04:33:39.231 | 1.048 | 17:51:49.716 | 1.382 | … | … |
| J04355684+2254360 | Haro 6-28 A | 4.90 0.10 | 5.14 0.20 | 0.19x0.16 | -178.4 | 04:35:56.865 | 0.003 | 22:54:35.805 | 0.003 | 91 14 | 50 42 |
| J04355684+2254360 | Haro 6-28 B | 1.05 0.10 | 0.78 0.15 | 0.19x0.16 | -178.4 | 04:35:56.822 | 0.006 | 22:54:35.539 | 0.009 | … | … |
| J04361030+2159364 | … | 0.31 | … | … | … | … | … | … | … | ||
| J04362151+2351165 | … | 0.15 0.10 | 1.45 0.19 | 0.79x0.42 | 48.9 | 04:36:21.508 | 0.040 | 23:51:16.300 | 0.040 | … | … |
| J04391741+2247533 | VY Tau A | 1.28 0.10 | 1.95 0.27 | 0.19x0.16 | 3.4 | 04:39:17.429 | 0.008 | 22:47:53.044 | 0.010 | 177 45 | 96 70 |
| J04391741+2247533 | VY Tau B | 0.31 | … | … | … | … | … | … | … | ||
| J04392090+2545021 | GN Tau A | 0.62 0.11 | 0.47 0.11 | 0.20x0.15 | -179.0 | 04:39:20.912 | 0.013 | 25:45:01.820 | 0.013 | … | … |
| J04392090+2545021 | GN Tau B | 0.64 0.11 | 0.59 0.11 | 0.20x0.15 | -179.0 | 04:39:20.938 | 0.012 | 25:45:01.525 | 0.010 | … | … |
| J04404950+2551191 | JH 223 A | 1.10 0.12 | 1.68 0.30 | 0.24x0.13 | 34.9 | 04:40:49.516 | 0.011 | 25:51:18.662 | 0.011 | 172 52 | 52 62 |
| J04404950+2551191 | JH 223 B | 0.77 0.12 | 0.76 0.20 | 0.24x0.13 | 34.9 | 04:40:49.466 | 0.009 | 25:51:20.695 | 0.018 | … | … |
| J04410826+2556074 | ITG 33A | 1.90 0.11 | 4.10 0.38 | 0.24x0.13 | 34.8 | 04:41:08.271 | 0.005 | 25:56:07.033 | 0.010 | 279 36 | 141 32 |
| J04411078+2555116 | ITG 34 | 0.84 0.11 | 0.70 0.11 | 0.24x0.13 | 34.8 | 04:41:10.794 | 0.010 | 25:55:11.228 | 0.010 | … | … |
| J04412464+2543530 | ITG 40 | 0.85 0.11 | 1.00 0.12 | 0.24x0.13 | 34.8 | 04:41:24.661 | 0.016 | 25:43:52.608 | 0.009 | … | … |
| J04414489+2301513 | … | 0.38 | … | … | … | … | … | … | … | ||
| J04420777+2523118 | V955 Tau A | 1.80 0.11 | 2.16 0.24 | 0.21x0.16 | -174.5 | 04:42:07.787 | 0.005 | 25:23:11.580 | 0.007 | 105 41 | 97 80 |
| J04420777+2523118 | V955 Tau B | 0.86 0.11 | 0.86 0.21 | 0.21x0.16 | -174.5 | 04:42:07.770 | 0.009 | 25:23:11.201 | 0.014 | 105 71 | 25 84 |
| J04423769+2515374 | DP Tau A | 2.10 0.11 | 2.10 0.35 | 0.21x0.17 | -40.0 | 04:42:37.696 | 0.012 | 25:15:36.924 | 0.009 | 246 40 | 102 66 |
| J04423769+2515374 | DP Tau B | 1.50 0.11 | 1.50 0.20 | 0.21x0.17 | -40.0 | 04:42:37.693 | 0.041 | 25:15:37.124 | 0.029 | … | … |
| J04432023+2940060 | … | 0.38 | … | … | … | … | … | … | … | ||
| J04465897+1702381 | Haro 6-37 A | 0.80 0.33 | 2.10 0.90 | 0.18x0.16 | 9.8 | 04:46:58.975 | 0.022 | 17:02:37.631 | 0.020 | 143 64 | 86 95 |
| J04465897+1702381 | Haro 6-37 B | 0.97 | … | … | … | … | … | … | … | ||
| J04465897+1702381 | Haro 6-37 C | 13.40 0.33 | 38.50 1.90 | 0.18x0.16 | 9.8 | 04:46:59.090 | 0.005 | 17:02:39.713 | 0.005 | 357 16 | 289 14 |
| J04554535+3019389 | … | 0.39 | … | … | … | … | … | … | … | ||
| J04554801+3028050 | … | 0.35 | … | … | … | … | … | … | … | ||
| J04554969+3019400 | … | 0.35 | … | … | … | … | … | … | … | ||
| J04560118+3026348 | XEST 26-071 | 0.35 | … | … | … | … | … | … | … | ||
| J05052286+2531312 | CIDA 9 A | 7.20 0.14 | 33.80 0.80 | 0.25x0.16 | 44.0 | … | … | … | … | 380 25 | 300 25 |
| J05052286+2531312 | CIDA 9 B | 0.41 | … | … | … | … | … | … | … | ||
| J05062332+2432199 | CIDA 11 | 0.36 | … | … | … | … | … | … | … |
| Name | ALMA separation | ALMA PA | Lit. separation | Lit. PA | Lit. reference |
|---|---|---|---|---|---|
| (arcsec) | (deg) | (arcsec) | (deg) | ||
| FO Tau AB | 0.1240.012 | 253.23.7 | 0.1500.007 | 193.71.0 | White and Ghez (2001) |
| XZ Tau AB | 0.2710.006 | 307.40.9 | 0.3000.006 | 324.51.0 | White and Ghez (2001) |
| GH Tau AB | 0.2870.007 | 103.01.0 | 0.3050.006 | 114.81.1 | White and Ghez (2001) |
| IS Tau AB | 0.1950.017 | 125.93.5 | 0.2220.004 | 95.41.4 | White and Ghez (2001) |
| HN Tau AB | 3.0611.735 | 222.523.2 | 3.1420.001 | 219.70.5 | Correia et al (2006) |
| Haro 6-28 AB | 0.6510.012 | 245.80.6 | 0.6470.012 | 245.21.0 | White and Ghez (2001) |
| GN Tau AB | 0.4500.024 | 130.92.1 | 0.3350.006 | 124.11.0 | White and Ghez (2001) |
| JH 223 AB | 2.1450.026 | 341.40.6 | 2.0600.100 | 342.32.8 | Kraus and Hillenbrand (2007) |
| V955 Tau AB | 0.4470.019 | 212.11.8 | 0.3230.008 | 204.01.2 | White and Ghez (2001) |
| DP Tau AB | 0.2070.052 | 345.78.6 | 0.1070.001 | 293.30.3 | Kraus et al (2011) |
| Haro 6-37 AC | 2.6600.031 | 38.50.5 | 2.6500.080 | 38.90.2 | Schaefer et al (2014) |
| Sample | Total | mm detections | Detection percentage |
|---|---|---|---|
| All Class II | 211 | 151 | |
| M6 or earlier | 189 | 143 | |
| Singles | 65 | 52 | |
| Binaries | |||
| All primaries | 30 | 29 | |
| All secondaries | 30 | 24 | |
| Wide primaries | 12 | 12 | |
| Wide secondaries | 12 | 10 | |
| Close primaries | 18 | 17 | |
| Close secondaries | 18 | 14 |
| Sample | p-value | |||
|---|---|---|---|---|
| M∗ | Fν | M | M | |
| Singles/Primaries | 0.95 | 0.015 | 0.0089 | |
| Singles/Secondaries | 0.26 | 0.027 | 0.0037 | |
| Primaries/Secondaries | 0.60 | 0.98 | ||
| Singles/Wide | 0.0050 | 0.93 | 0.18 | 0.11 |
| Singles/Close | 0.037 | 0.032 | ||
| Wide/Close | 0.072 | 0.034 | 0.044 | 0.050 |
| Sample | SlopeaaNonparametric slope estimate from Akritas-Theil-Sen method | Kendall’s | bbProbability that no correlation is present. |
|---|---|---|---|
| All | 0.22 | 0.08 | 0.53 |
| Wide | 0.48 | 0.35 | 0.12 |
| Close | 0.62 | 0.37 | 0.031 |
| Source | Peak flux | RMS |
|---|---|---|
| (Jy beam-1 km s-1) | ||
| CIDA 9 (J05052286+2531312) | 0.284 | 0.049 |
| DP Tau | 0.323 | 0.066 |
| FX Tau | 0.292 | 0.043 |
| GG Tau | 0.295 | 0.043 |
| GH Tau | 0.159 | 0.038 |
| Haro 6-28 | 0.134 / 0.152 | 0.041 |
| Haro 6-37 | 0.253 | 0.043 |
| HN Tau | 0.749 | 0.058 |
| IRAS 04187+1927 | 0.452 | 0.058 |
| ITG 33A | 0.192 | 0.065 |
| J04295950+2433078 | 0.267 | 0.060 |
| UX Tau | 0.467 | 0.039 |
| V807 Tau | 0.343 | 0.039 |
| V710 Tau | 0.810 | 0.058 |
| VY Tau | 0.239 | 0.076 |
| XZ Tau | 0.631 / 0.469 | 0.048 |
Peer Reviews
No public reviews on file for this paper yet. If you reviewed it on a platform where reviews are public (OpenReview, ICLR, NeurIPS, ICML), you can paste yours below so the community can read it here.
Videos
No videos yet. Explain this paper in a talk, walkthrough, or lecture? Add one.
Resolved young binary systems and their disks
IPAC-NExScI, Caltech, Pasadena, CA 91125, USA
Swarthmore College, Dept. of Physics & Astronomy, 500 College Ave., Swarthmore, PA 19081-1390, USA
Joint ALMA Observatory, Avenida Alonso 3107 Vitacura, Santiago, Chile
Luca Ricci
Department of Physics and Astronomy, California State University Northridge, 18111 Nordhoff Street, Northridge, CA 91330, USA
Physics and Astronomy Department, Vanderbilt University, 6301 Stevenson Center Nashville, TN 37235
Swarthmore College, Dept. of Physics & Astronomy, 500 College Ave., Swarthmore, PA 19081-1390, USA
Swarthmore College, Dept. of Physics & Astronomy, 500 College Ave., Swarthmore, PA 19081-1390, USA
(Received September 10, 2018; Accepted January 7, 2019)
Abstract
We have conducted a survey of young single and multiple systems in the Taurus-Auriga star-forming region with the Atacama Large Millimeter Array (ALMA), substantially improving both the spatial resolution and sensitivity with which individual protoplanetary disks in these systems have been observed. These ALMA observations can resolve binary separations as small as 25–30 AU and have an average 3 detection level of 0.35 mJy, equivalent to a disk mass of M*⊙* for an M3 star. Our sample was constructed from stars that have an infrared excess and/or signs of accretion and have been classified as Class II. For the binary and higher order multiple systems observed, we detect mm continuum emission from one or more stars in all of our target systems. Combined with previous surveys of Taurus, our 21 new detections increase the fraction of millimeter-detected disks to over 75% in all categories of stars (singles, primaries, and companions) earlier than spectral type M6 in the Class II sample. Given the wealth of other information available for these stars, this has allowed us to study the impact of multiplicity with a much larger sample. While millimeter flux and disk mass are related to stellar mass as seen in previous studies, we find that both primary and secondary stars in binary systems with separations of 30 to 4200 AU have lower values of millimeter flux as a function of stellar mass than single stars. We also find that for these systems, the circumstellar disk around the primary star does not dominate the total disk mass in the system and contains on average 62% of the total mass.
protoplanetary disks, binaries: general, stars: pre-main sequence
††facilities: ALMA††software: CASA (McMullin et al., 2007), R, Astropy (The Astropy Collaboration et al., 2018), matplotlib (Hunter, 2007)
1 Introduction
The formation, evolution, and dissipation of circumstellar disks are key components in understanding the formation of stellar and planetary systems, but despite years of study, some puzzling questions about circumstellar disks remain. One of the chief questions is why stars of similar ages, in the same star-forming region, can have very different disk properties. Millimeter interferometry has been crucial in confirming the paradigm of a Keplerian rotating disk of gas and dust that funnels material onto the central star, and millimeter continuum flux is the most sensitive probe of cold dust in the outer disk (see e.g. Williams & Cieza, 2011). Here we present results from an ALMA survey, taking advantage of the unprecedented combination of high sensitivity and angular resolution to explore two of the factors affecting these disks: the influence of stellar mass, and the influence of stellar companions.
Previous work has demonstrated that at a given stellar mass, the mass of the circumstellar disk ranges over more than an order of magnitude in Taurus (Andrews et al., 2013), but many non-detections remain at the same flux level as the lower flux detections. At lower stellar masses in particular (later than M3), the sample is dominated by non-detections and while the non-detections are consistent with the fit of Andrews et al. (2013, see also ), our ALMA Cycle 0 observations of wide binaries in Taurus (Akeson & Jensen, 2014, hereinafter Paper 1) revealed several disks at flux levels below the sensitivity of pre-ALMA surveys.
Early studies of the impact of multiplicity generally did not resolve the individual disks, but did show a decrease in flux for binaries with separations of a few to AU (Osterloh & Beckwith, 1995; Jensen et al., 1996). Initial interferometric observations to resolve the separate circumprimary and circumsecondary disks detected the primary disk, but only rarely detected the secondary disk and were limited to small (5) sample sizes (Jensen & Akeson, 2003; Patience et al., 2008). Only the advent of high resolution and high sensitivity millimeter surveys provided sufficient samples to detect more individual components. In the Taurus star forming region, two recent studies have concentrated on disks in multiple systems. Harris et al. (2012) used the Submillimeter Array to observe 23 multiple systems in Taurus. They found a lower detection rate for stars in multiple systems (28–37%) as compared to single stars (62%) and a correlation of larger binary separation with higher flux. In Paper 1, we described an ALMA survey of 17 Class II binaries in Taurus which detected 10 secondary disks and found that within binary systems the primary/secondary stellar mass ratio is not correlated with the primary/secondary flux or disk mass ratio.
Despite the significant amount of previous work on this issue, some questions remain open. In particular, the sensitivity level of pre-ALMA surveys was often insufficient to detect disks around lower-mass stars, given the well-known correlation between stellar mass and millimeter flux (e.g. Andrews et al., 2013). As a result, these surveys were less sensitive to secondary stars in binaries (by definition of lower stellar mass than their primary counterparts), and they were often quite incomplete for the low-mass tail of the single star population as well, leading to biases when comparing single stars to secondaries. Thus, in designing this ALMA study to probe both the influence of stellar mass and of companions on circumstellar disks, we specifically included both undetected single stars and all previously unresolved multiple systems where the component separations were resolvable in a snapshot survey at moderate (i.e. 02) resolution. When combined with previous detections from the literature and Paper 1, we have compiled a significant sample of primary and secondary components to compare to their single star counterparts.
Our ALMA observations are described in §2, and the results of our survey, including calculation of the circumstellar disk mass, in §3. The definition of a carefully selected sample for statistical analysis is given in §4, along with the comparison of disk properties between single and binary stars. Our conclusions are given in §5.
2 Observations
2.1 Sample
We selected targets from a single star forming region, Taurus (distance 140 pc), so that effects such as age and cluster environment are kept constant as much as possible. Taurus is ideal in having a significant population of YSOs that have evolved into the disk-only state (with no remaining envelope) and in being very well studied, containing both a well-known set of single stars with disks and a significant population of binaries where both stellar components have been characterized in the optical or near-infrared. We started with the list of Taurus objects from Luhman et al. (2010) and selected those with Class II spectral energy distributions (SEDs), which resulted in 211 stars in 166 systems. Twelve of these stars are spectroscopic binaries. Some of the multiple star systems were classified using separate SEDs, but most of the binary star systems are unresolved in the mid-infrared and were classified as a pair. We then eliminated all single and close ( or 25 AU) multiple sources that had been previously detected at millimeter wavelengths, as well as multiple systems where all resolvable (i.e. separations ) components have been detected (Harris et al., 2012; Andrews et al., 2013, Paper 1). We also removed sources with observations in ALMA Cycle 1. The remaining list included 69 single and multiple systems with 94 resolvable disks, including 1 G star, 7 K stars, and the rest M stars.
2.2 ALMA Data Reduction
To construct the observing groups for ALMA, the sample was divided into close multiple systems (separations ), and singles and wide multiples, to allow for different spatial resolution observations. Within these groups, the sample was split to follow the ALMA guidelines on maximum angular separation from the gain calibrator. These divisions resulted in five source groupings; four of these were observed in Cycle 2, and one of the four was re-observed in Cycle 3. Table 1 lists the basic information for these observation sets. One source group was never observed. The data obtained included observations of 45 systems, with a total of 65 stars.
We selected Band 6 (1.3 mm) for these ALMA observations. Three of the correlator sections were set for continuum emission sensitivity, with the fourth set to the transition for CO(2–1) at 230.5 GHz. The total continuum bandwidth was 7.5 GHz. For the datasets from 2015, we used the calibration provided by ALMA and created images using the CASA package (McMullin et al., 2007). For sources with sufficient continuum flux, we also performed self-calibration. The data taken in July 2016 did not pass the internal quality assessment at ALMA, so we processed the raw data using the pipeline scripts in CASA. Based on the gain calibration and measured fluxes for sources with previous measurements, we deemed the data usable and they are included in the analysis below.
For each target, the CASA routine clean was used to produce an image. As the source positions are known a priori, detections were defined as a peak at the known location. The flux uncertainty was measured as the rms in the cleaned portion of the image without known sources. The peak flux was measured as the highest flux within the detection, while the integrated flux was measured using the routine imfit and fitting a two-dimensional Gaussian.
3 Results
3.1 Continuum emission
Table 3.1 lists all sources observed at ALMA with the detected Band 6 (1.3 mm; 230 GHz) peak flux and observed rms or 3 limit. For all detected sources, the integrated flux, the beam size and orientation, and the center of the emission are listed. An integrated flux is not listed if the source was reported as unresolved by imfit. The results from imfit are also used for the reported positions of the detections and to derive the measured component separations given in Table 3.1. These observations resulted in 21 new detections: 6 single stars, 4 primary stars, and 11 companion stars.
The reference list from the paper itself. Each links out to its DOI / PubMed record.
- 1Akeson & Jensen (2014) Akeson, R. L., & Jensen, E. L. N. 2014, Ap J, 784, 62
- 2Andrews et al. (2013) Andrews, S. M., Rosenfeld, K. A., Kraus, A. L., & Wilner, D. J. 2013, Ap J, 771, 129
- 3Andrews et al. (2018) Andrews, S. M., Terrell, M., Tripathi, A., et al. 2018, Ap J, 865, 157
- 4Ansdell et al. (2016) Ansdell, M., Williams, J. P., van der Marel, N., et al. 2016, Ap J, 828, 46
- 5The Astropy Collaboration et al. (2018) The Astropy Collaboration, Price-Whelan, A. M., Sipőcz, B. M., et al. 2018, AJ, 156, 123
- 6Bailer-Jones et al. (2018) Bailer-Jones, C. A. L., Rybizki, J., Fouesneau, M., et al. 2018, AJ, 156, 58
- 7Baraffe et al. (2015) Baraffe, I., Homeier, D., Allard, F., & Chabrier, G. 2015, A&A, 577, A 42
- 8Barenfeld et al. (2016) Barenfeld, S. A., Carpenter, J. M., Ricci, L., & Isella, A. 2016, Ap J, 827, 142