Quasiparticle Relaxation Dynamics in URu$_{2-x}$Fe$_{x}$Si$_{2}$ Single Crystals
Peter Kissin, Sheng Ran, Dylan Lovinger, Verner K. Thorsm{\o}lle,, Noravee Kanchanavatee, Kevin Huang, M. Brian Maple, and Richard D. Averitt

TL;DR
This study uses ultrafast optical spectroscopy to explore quasiparticle relaxation in URu$_{2-x}$Fe$_{x}$Si$_{2}$ crystals, revealing complex phase transitions and coexistence phenomena between hidden order, antiferromagnetism, and paramagnetism.
Contribution
It provides new insights into the low-energy electronic structure and phase coexistence in URu$_{2-x}$Fe$_{x}$Si$_{2}$ across different Fe doping levels using ultrafast spectroscopy.
Findings
Identification of phase transitions at specific temperatures for x=0.1
Evidence of coexistence of different electronic phases
Detection of hybridization gap and spin-charge interactions in the paramagnetic phase
Abstract
We investigate quasiparticle relaxation dynamics in URuFeSi single crystals using ultrafast optical-pump optical-probe (OPOP) spectroscopy as a function of temperature () and Fe substitution (), crossing from the hidden order (HO) phase ( = 0) to the large moment antiferromagnet (LMAFM) phase ( = 0.12). At low , the dynamics for = 0 and = 0.12 are consistent with the low energy electronic structure of the HO and LMAFM phases that emerge from the high paramagnetic (PM) phase. In contrast, for = 0.1, two transitions occur over a narrow range (from ~15.5 - 17.5 K). A PM to HO transition occurs at an intermediate followed by a transition to the LMAFM phase at lower . While the data at low are consistent with the expected coexistence of LMAFM and HO, the data in the intermediate phase are not, and instead suggest the…
Click any figure to enlarge with its caption.
 Figure 1
 Figure 1
 Figure 2
 Figure 2
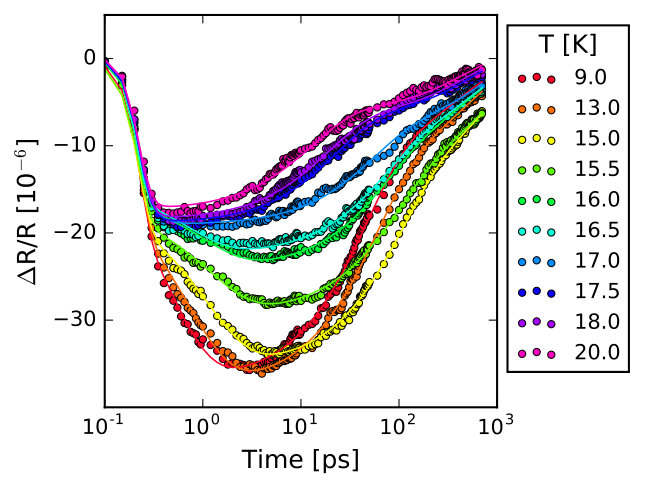 Figure 2
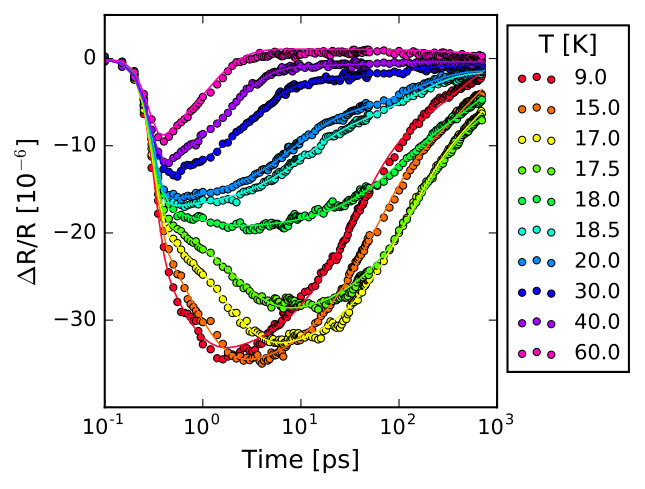 Figure 2
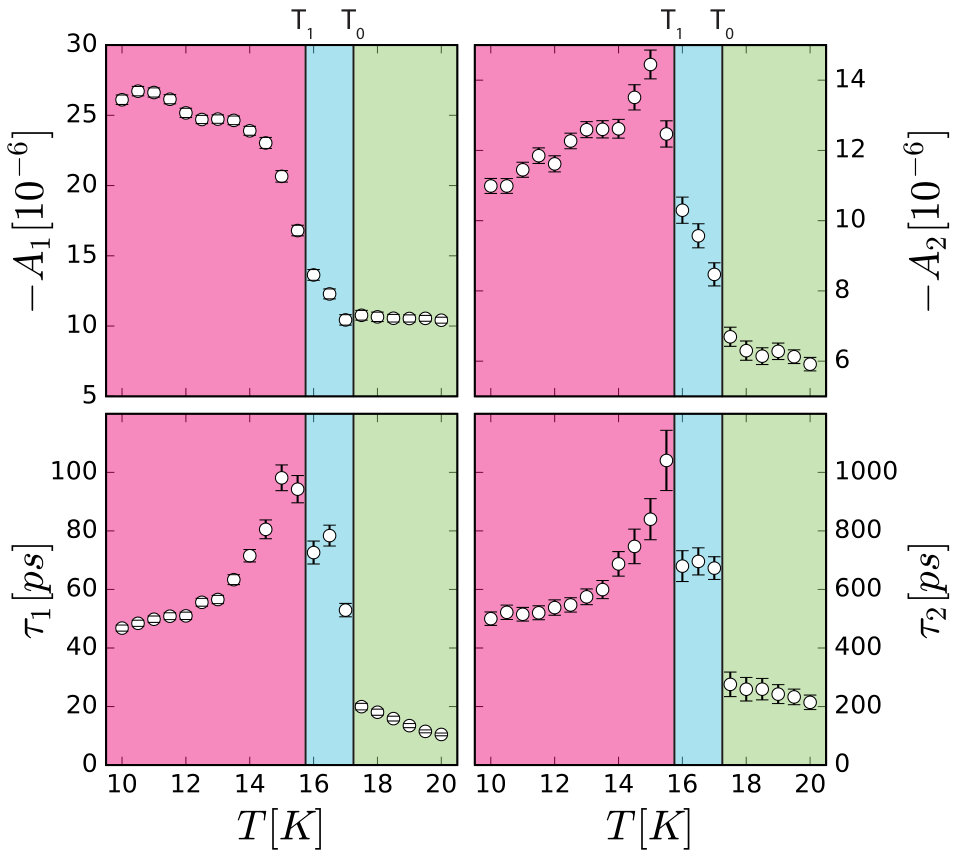 Figure 3
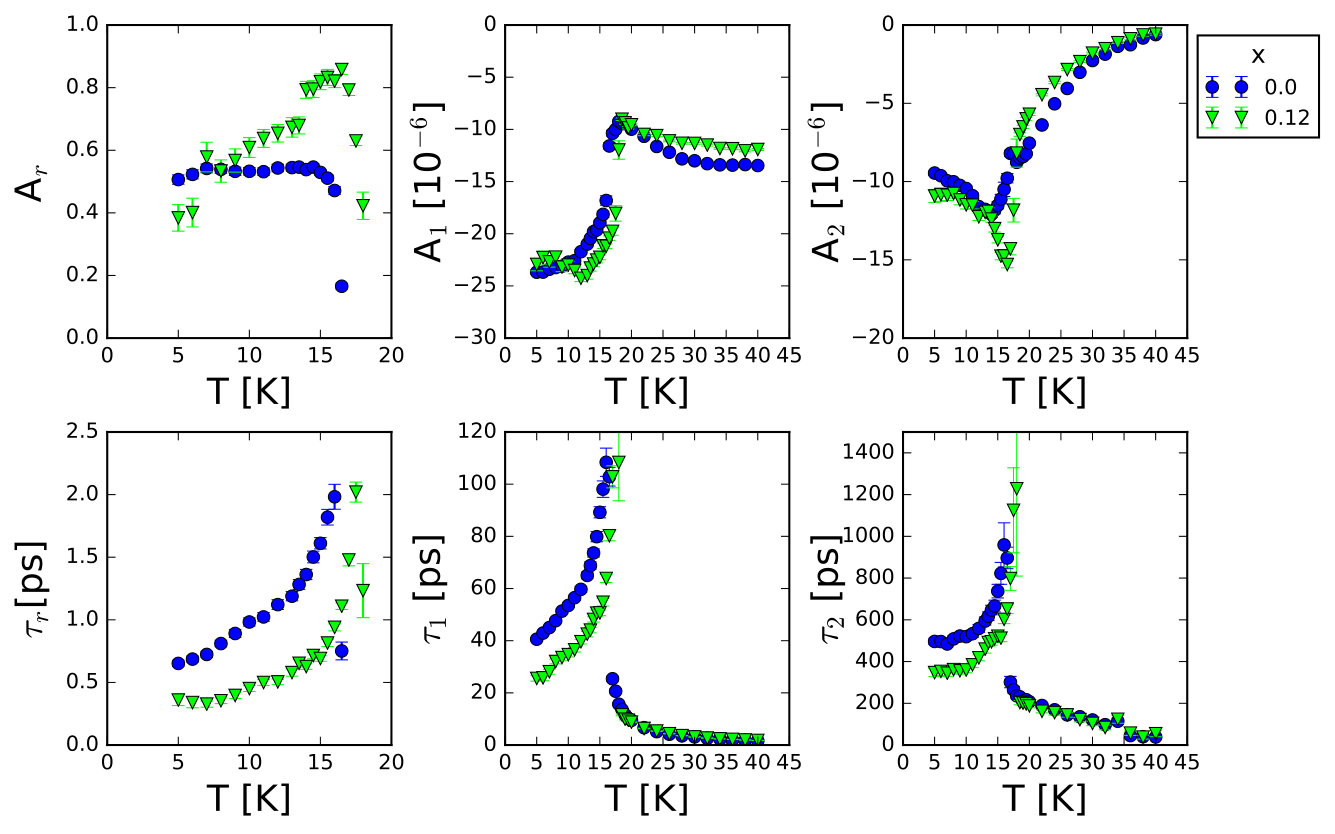 Figure 3
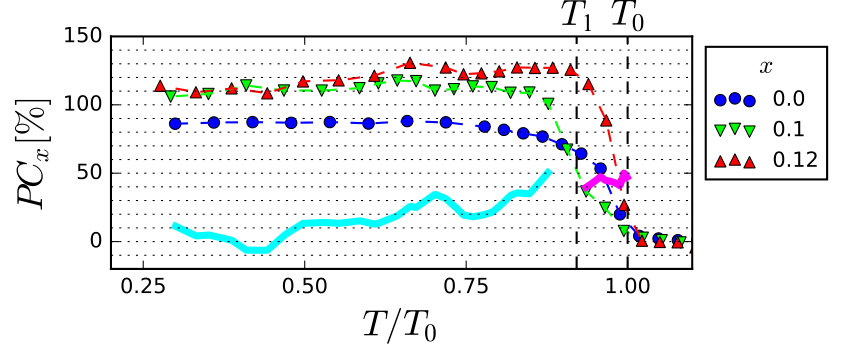 Figure 4
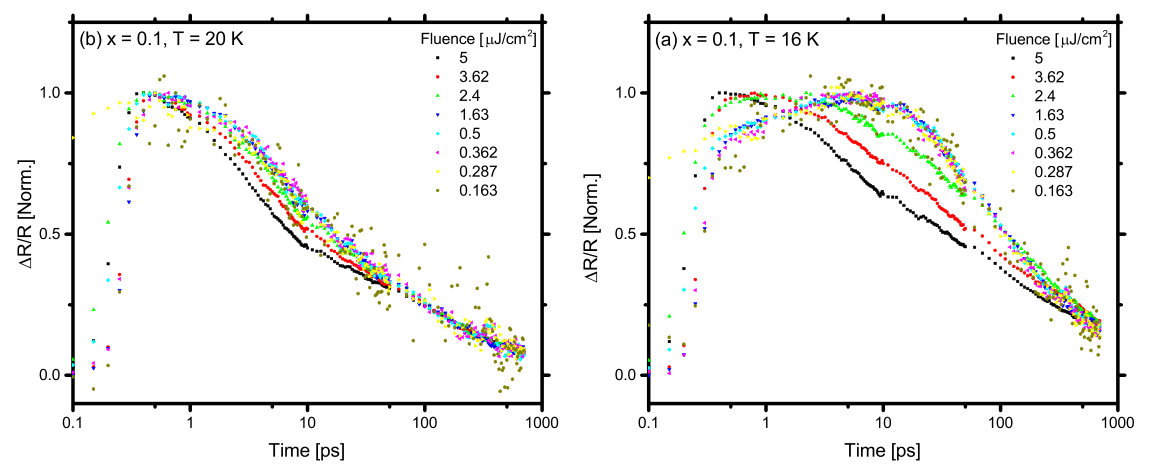 Figure 4
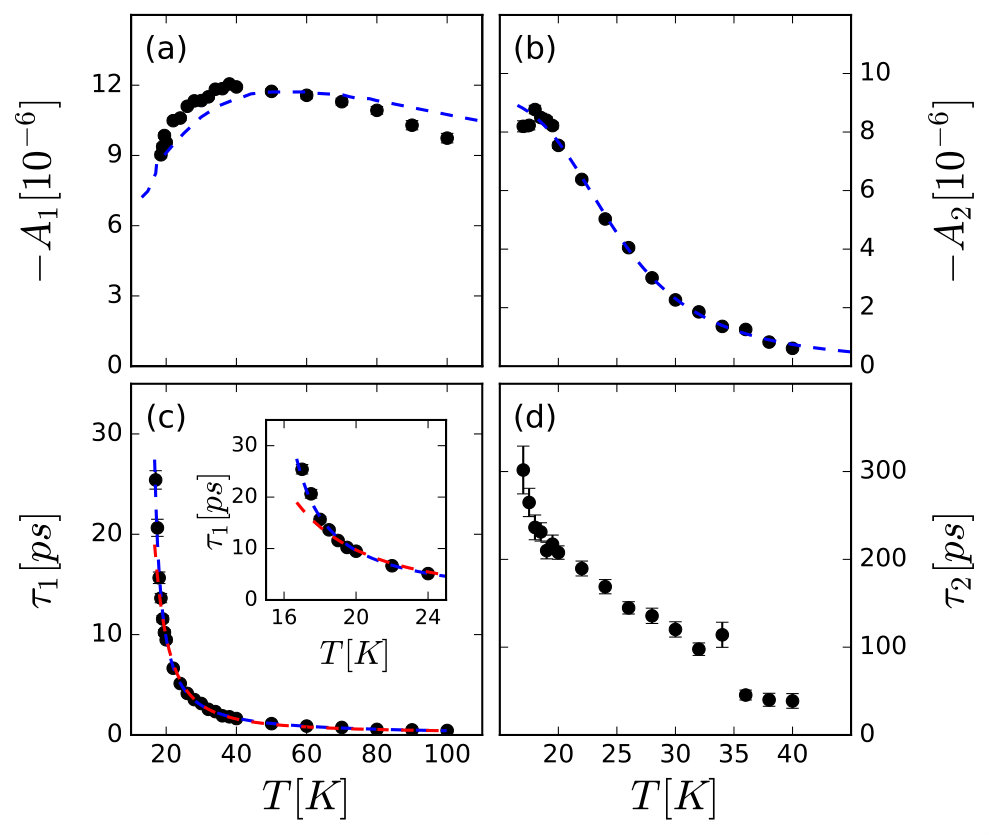 Figure 5
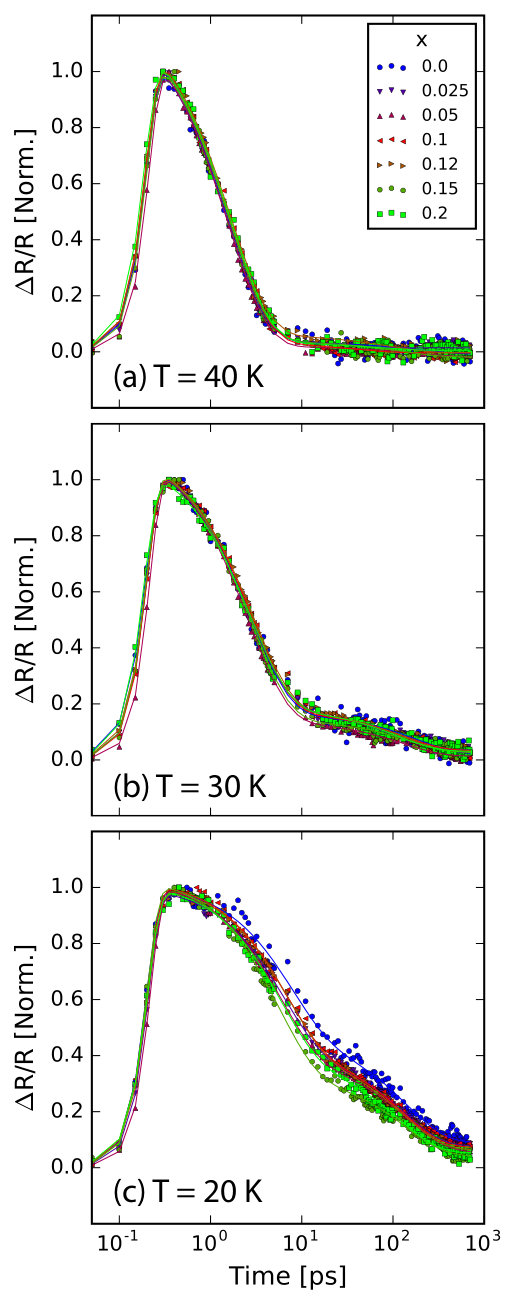 Figure 5
Peer Reviews
No public reviews on file for this paper yet. If you reviewed it on a platform where reviews are public (OpenReview, ICLR, NeurIPS, ICML), you can paste yours below so the community can read it here.
Videos
No videos yet. Explain this paper in a talk, walkthrough, or lecture? Add one.
\captionnamefont\captiontitlefont\captionstyle
Present Addresses: ]Center for Nanophysics and Advanced Materials, Department of Physics, University of Maryland, College Park, MD 20742; NIST Center for Neutron Research, National Institute of Standards and Technology, 100 Bureau Drive, Gaithersburg, MD 20899.
Present Address: ]Department of Physics, Chulalongkorn University, Pathumwan, 10330, Thailand.
Present Address: ]National High Magnetic Field Laboratory, Florida State University, Tallahassee, FL 32313.
Quasiparticle Relaxation Dynamics in URu2-xFexSi2 Single Crystals
Peter Kissin
Department of Physics, University of California San Diego, 9500 Gilman Drive, La Jolla, California 92093, USA
Sheng Ran
[
Department of Physics, University of California San Diego, 9500 Gilman Drive, La Jolla, California 92093, USA
Center for Advanced Nanoscience, University of California San Diego, La Jolla, California 92093, USA
Dylan Lovinger
Department of Physics, University of California San Diego, 9500 Gilman Drive, La Jolla, California 92093, USA
Verner K. Thorsmølle
Department of Physics, University of California San Diego, 9500 Gilman Drive, La Jolla, California 92093, USA
Noravee Kanchanavatee
[
Department of Physics, University of California San Diego, 9500 Gilman Drive, La Jolla, California 92093, USA
Center for Advanced Nanoscience, University of California San Diego, La Jolla, California 92093, USA
Kevin Huang
[
Center for Advanced Nanoscience, University of California San Diego, La Jolla, California 92093, USA
Materials Science and Engineering Program, University of California San Diego, 9500 Gilman Drive, La Jolla, California 92093, USA
M. Brian Maple
Department of Physics, University of California San Diego, 9500 Gilman Drive, La Jolla, California 92093, USA
Center for Advanced Nanoscience, University of California San Diego, La Jolla, California 92093, USA
Richard D. Averitt
Department of Physics, University of California San Diego, 9500 Gilman Drive, La Jolla, California 92093, USA
Abstract
We investigate quasiparticle relaxation dynamics in URu2-xFexSi2 single crystals using ultrafast optical-pump optical-probe (OPOP) spectroscopy as a function of temperature () and Fe substitution (), crossing from the hidden order (HO) phase ( = 0) to the large moment antiferromagnet (LMAFM) phase ( = 0.12). At low , the dynamics for = 0 and = 0.12 are consistent with the low energy electronic structure of the HO and LMAFM phases that emerge from the high paramagnetic (PM) phase. In contrast, for = 0.1, two transitions occur over a narrow range (from 15.5 - 17.5 K). A PM to HO transition occurs at an intermediate followed by a transition to the LMAFM phase at lower . While the data at low are consistent with the expected coexistence of LMAFM and HO, the data in the intermediate phase are not, and instead suggest the possibility of an unexpected coexistence of HO and PM. Additionally, the dynamics in the PM phase reflect the presence of a hybridization gap as well as strongly interacting spin and charge degrees of freedom. OPOP yields insights into meV-scale electrodynamics with sub-Kelvin resolution, providing a complementary approach to study low energy electronic structure in quantum materials.
The metallic actinide compound URu2Si2, with its many proximal phases, offers a platform to study emergent phenomena in -electron systems poised between localization and itinerancy. In particular, the hidden order (HO) phase, which develops from a strongly correlated paramagnetic (PM) phase below = 17.5 K Palstra et al. (1985); Maple et al. (1986), has attracted extensive attention Mydosh and Oppeneer (2011). The combined efforts of ARPES Meng et al. (2013); Bareille et al. (2014); Chatterjee et al. (2013); Boariu et al. (2013), quantum oscillations Hassinger et al. (2010), and band structure calculations Elgazzar et al. (2009); Oppeneer et al. (2010) have led to a consistent picture of the Fermi surface. Neutron scattering measurements have identified magnetic excitations at and in the body-centered tetragonal Brillouin zone (BZ) of the PM phase, which are gapped in the HO phase Wiebe et al. (2007); Butch et al. (2015). Despite this progress, the order parameter of the HO phase remains unidentified, motivating novel experimental approaches.
An alternate route to understanding HO is to instead study the large-moment antiferromagnetic (LMAFM) phase in pressurized URu2Si2 Motoyama et al. (2003). While the LMAFM and HO phases have similar signatures in thermodynamics and transport Hassinger et al. (2008), and nearly identical Fermi surfaces Hassinger et al. (2010), the order parameter and symmetries of the LMAFM phase are known, facilitating progress in theory Oppeneer et al. (2010). Unfortunately, even the modest pressure necessary to access LMAFM renders many techniques impossible. However, substitution of Fe for Ru yields an antiferromagnetic phase without applied pressure Kanchanavatee et al. (2011); Das et al. (2015). Striking resemblances exist between the magnetic excitation spectra of the two phases Butch et al. (2016), and distinctive features of the phase diagrams of URu2Si2 are reproduced Ran et al. (2016, 2017). Apparently, Fe substitution acts as a chemical pressure, enabling new measurements in the LMAFM phase Kung et al. (2016).
Optical Pump Optical Probe (OPOP) spectroscopy has been used to study quasiparticle (QP) relaxation dynamics in heavy fermion compounds Demsar et al. (2003, 2006a, 2006b); Chia et al. (2006); Talbayev et al. (2010). The versatility of this technique comes from its extreme sensitivity to the formation of meV-scale gaps in the electronic density of states (DOS) near the Fermi Energy . The presence of a gap can be inferred from the temperature () and pump fluence () dependence of the QP relaxation dynamics and may result in an increase in the relaxation time by several orders of magnitude at low .
In this letter, we investigate QP relaxation dynamics in URu2-xFexSi2 single crystals spanning a broad range of Fe substitution (), focusing on the compositions indicated in Fig. 1(a). We observe differences in the dynamics between the HO ( = 0) and LMAFM ( = 0.12) phases, which are successfully described using a simple phenomenological model of relaxation bottlenecks associated with gaps characteristic of each state. In contrast, for = 0.1, two transitions occur over a narrow range (from 15.5 - 17.5 K). A PM to HO transition occurs at higher , with a subsequent transition to a LMAFM phase at lower . While signatures of heterogeneity are present in both phases, anomalies in the intermediate HO phase suggest the unusual possibility of a persistent PM volume fraction. In the PM phase, the dynamics reveal the presence of a hybridization gap as well as strongly interacting spin and charge degrees of freedom.
The Fe-substituted single crystals were grown in a tetra-arc furnace using the Czochralski technique Ran et al. (2016). OPOP measurements used 25 fs laser pulses centered at 800 nm with a repetition rate of 209 kHz Sup . The cross polarized pump and probe beams were focused to spot diameters of 100 m and 60 m respectively. was fixed at 0.5 J/cm2 for all measurements to ensure minimal heating of the sample Sup . The data were collected from large, flat areas of samples cleaved in the - plane and placed in a continuous flow liquid He optical cryostat.
Fig. 1(b) shows the photoinduced change in fractional reflectivity R/R as a function of time for = 0 (For other samples, see Sup ). The dynamics are qualitatively similar for all samples. At high , the relaxation is biexponential, consisting of a fast, negative component with a time constant of hundreds of fs and a small, slow, positive component with a time constant of hundreds of ps. Upon cooling, the fast component begins to slow to the few ps timescale, and the slower component switches sign and increases in amplitude. At , between 17 K and 16.5 K, the signal amplitude continues to increase for a few ps after photoexcitation Sup and the relaxation time approaches a ns. These abrupt changes to the dynamics at mark the transition to the low phase.
We fit the data with a multiexponential function:
[TABLE]
Where . In , the first term containing the error function represents the fast rise present at all . This term is included for completeness and is independent. The term containing and represents the slow rise dynamics that onset below . The second term in Eqn. 1 contains two exponential decays and a constant. The constant is close to the experimental noise floor of at all , so our analysis will focus on the dependence of the parameters from the exponential terms. In order to compare amplitudes above and below , we define ( for consistency).
Relaxation of photoexcited QPs in the presence of a gap requires e-h recombination with the emission of a high energy boson (HEB) with energy h Egap. This situation is frequently analyzed using the phenomenological Rothwarf-Taylor (RT) model Rothwarf and Taylor (1967). The key parameters in the RT model are the bare QP recombination rate , the rate of across-gap QP excitation by a HEB , and the rate of escape or anharmonic decay of HEBs . Various regimes are realized depending on these rates Kabanov et al. (2005); Torchinsky et al. (2010). If or , then bimolecular recombination dynamics are observed, and the bare recombination rate of QPs can be obtained. On the other hand, if is the fastest rate, the result is a strong bottleneck with a relaxation rate limited to . In URu2Si2, the relaxation dynamics are independent of , implying strongly bottlenecked QP relaxation Sup .
Fig. 2 shows the parameters extracted from fits to the raw data using Eqn. 1 below 20 K. All time constants diverge approaching from below and jump to lower values in the PM phase. This divergence is characteristic of a bottleneck associated with a dependent gap where the limiting step is the anharmonic decay of HEBs Demsar et al. (2001); Lobo et al. (2005). To analyze the dependence of the fit parameters, we use a bottleneck model due to Kabanov et al. Kabanov et al. (1999):
[TABLE]
[TABLE]
In Eqn. 2 and Eqn. 3, , , , . is the photoexcited energy density per unit cell, is the number of modes per unit cell, and is the electronic DOS at . , , and are the cutoff frequency, linewidth, and frequency of the modes, respectively. Eqn. 2 and Eqn. 3 can be derived from the RT model in the strong bottleneck regime. The dependence of the gaps is modeled with a generic BCS form Lobo et al. (2015); Bachar et al. (2016). We treat the zero- gap and the transition temperature as shared parameters and fit to Eqn. 2 and Eqn. 3 simultaneously, strongly constraining the extracted values of .
Fits to the fast component, shown in (a) and (b) of Fig. 2, yield smaller gap energies than reported with optical techniques, meV for = 0 and meV for = 0.12. An indirect gap is a possibility, since infrared and Raman spectroscopy only probe direct gaps. The energies roughly agree with the energies of the magnetic excitation at , which has been interpreted as an interband transition across an indirect hybridization gap Butch et al. (2015, 2016). A hybridization gap bottleneck arises naturally from this interpretation.
Fits to the slow component, shown in (c) and (d), return values of meV and meV for = 0 and = 0.12, respectively. These values are consistent with measurements of the charge gaps in the HO and LMAFM phases of Fe-substituted samples Kanchanavatee et al. (2011); Das et al. (2015); Hall et al. (2015). The value for = 0 also agrees with the HO gap from Raman spectroscopy Buhot et al. (2014); Kung et al. (2015), so we interpret the slow component as a bottleneck involving a direct gap between a localized, occupied -state and a light conduction band that crosses the as in Kung et al. (2015).
The gap energies extracted by the fits shown in Fig. 2 correspond to the literature values for both phases. This excellent agreement supports the description of the QP relaxation dynamics in terms of bottlenecks using Eqn. 2 and Eqn. 3 and demonstrates the sensitivity of our technique to the low energy electronic structure of URu2Si2. Clearly, we can distinguish between the QP relaxation dynamics in the HO and LMAFM phases, even though the gaps of the two phases differ by only a few meV.
Armed with an understanding of the dynamics for = 0 and = 0.12, we turn to the fit parameters for = 0.1, shown in Fig. 3. Anomalous dependence is observed between 17.5 K and 15.5 K. Both time constants jump twice: once between 17.5 and 17 K at , and again at a second temperature between 16 and 15.5 K. In contrast, abrupt changes in relaxation times occur only once, at , for both = 0 and = 0.12. Additionally, the rise in amplitudes below occurs more gradually for = 0.1 than for = 0 or = 0.12, with a discontinuity in slope at . These observations are reminiscent of thermal expansion measurements Ran et al. (2016), where the two phase transitions observed for = 0.08 and = 0.1 were interpreted as a second order PM to HO transition and a first order HO to LMAFM transition.
One particularly striking feature of the data is the abrupt increase in signal amplitude observed at the HO and LMAFM transitions. We perform a model-independent comparison of the low behavior of all three samples by considering the percentage change in the signal amplitude, Sup , with respect to the PM phase, in which the dynamics are independent of Sup . These quantities are plotted for each sample as a function of reduced temperature in Fig. 4. For = 0, the amplitude nearly doubles as the sample cools from the PM phase to the HO phase (corresponding to a percentage change of nearly 100). The increase is even greater for LMAFM phase in = 0.12.
The well documented coexistence of HO and LMAFM domains in the parent compound Matsuda et al. (2001); Amitsuka et al. (2003) originates from inhomogeneous strain due to defects Yokoyama et al. (2005), and is thus likely to be enhanced around Fe sites, as in the case of Rh substituted samples Baek et al. (2010). This effect likely plays a much larger role for = 0.1, given its proximity to the HO/LMAFM phase boundary, than for either = 0 and = 0.12. Therefore, in order to study inhomogeneity in = 0.1, we assume that = 0 and = 0.12 represent comparatively pure HO and LMAFM phases, respectively.
Below , the data for = 0.1 matches expectations. Since the amplitude in Eq. 2 depends only on band structure and lattice parameters Kabanov et al. (1999), the overlap between and suggests that = 0.1 and = 0.12 have the same phase composition at low . Closer to , . This is expected behavior for coexisting HO and LMAFM domains, with a HO volume fraction Sup that decreases with . As seen in Fig. 4, decreases roughly linearly, from 0.5 just below to 0 at low . In contrast, it is difficult to describe the data for = 0.1 between and in terms of coexistence between HO and LMAFM. Here, the expected phase composition is primarily HO with a small LMAFM volume fraction. However, is less than expected for both pure HO and LMAFM.
We speculate that the anomalously small signal amplitude arises from phase coexistence of PM and HO. For example, if we assume that the signal for = 0.1 contains contributions from HO and PM domains, we obtain a PM volume fraction 0.5 Sup , which is strikingly close to just below . There are several reasonable explanations for this unusual possibility. Perhaps the PM to HO transition in this sample is driven weakly first order by proximity to the bicritical point in the phase diagram or by disorder from Fe substitution. On the other hand, there is evidence for a weakly first order PM to HO transition in the parent compound Tonegawa et al. (2014), and a first order PM to HO transition was predicted in a recent theoretical study Shen and Dzero (2018). It is also possible that this is a nonequilibrium effect, similar to the coexistence between superconducting and normal state domains observed in photoexcited superconductors Giannetti et al. (2009); Coslovich et al. (2011); Matsunaga and Shimano (2012). Each of these outcomes points to exotic and novel physics in -electron systems, meriting future studies to replicate this observation and to clarify its origin, if confirmed.
The data in the PM phase is also informative. We first discuss the dependence of , shown in Fig. 5(b). In a previous OPOP study on the parent compound Liu et al. (2011), this component was interpreted as evidence of a HO pseudogap (HOPG) Levallois et al. (2011); Haraldsen et al. (2011); Shirer et al. (2013). The dynamics we observe are nearly independent of x in the PM phase Sup . This observation is likely incompatible with a HOPG that arises from competition between HO and LMAFM phases, but does not rule out scenarios where the HOPG originates from fluctuations of a shared HO-LMAFM order parameter above Kung et al. (2016); Niklowitz et al. (2015). On the other hand, a fit of to a T-independent form of Eq. 2 between and 40 K, shown in Fig. 5(b), is consistent with a bottleneck associated with a gap of 13.80.5 meV. This is likely the correct interpretation of this component, since a hybridization gap of similar energy has been observed in the PM phase with a number of techniques Lobo et al. (2015); Bachar et al. (2016); Levallois et al. (2011); Park et al. (2012).
The fast process and is more difficult to interpret. As shown in Fig. 5, peaks near 40 K and decreases upon approaching . This is not the expected behavior from a bottleneck. At this , we assume that the concentration of photoexcited QPs is much less than the concentration of thermal QPs and approximate , with . A fit to this equation, shown in red in Fig. 5(c), returns a gap value of =4.90.1 meV. This value does not match any charge gap reported in the literature above .
On the other hand, the resemblance between and the -axis magnetic susceptibility, highlighted in Fig. 5(a), indicates that the fast process may have a magnetic origin. A power law fit of the form Zhu et al. (2018), shown in Fig. 5(c), reproduces the dependence of , particularly the quasi-divergence near , with and K. The slight disagreement between the nominal and extracted values of is likely due to pump induced heating that limits the accuracy of transition temperatures and critical exponents measured with this technique. Nonetheless, the value for the scaling exponent is close to the exponent describing critical slowing down in the 3D Ising model, Wansleben and Landau (1987); Pelissetto and Vicari (2002), where is the critical exponent of correlation length and is the dynamical critical exponent Hohenberg and Halperin (1977). The 3D Ising model is a good starting point to describe magnetic fluctuations (MFs) in the PM phase given the notable Ising anisotropy in URu2Si2 Ramirez et al. (1992). We conclude that the fast process tracks a relaxation channel for photoexcited QPs involving scattering with MFs that slows as the MFs become critical. The literature supports this interpretation. Strong MFs are present at both Bourdarot et al. (2010) and Wiebe et al. (2007) in this range, and nearly critical behavior of MFs at has been reported Niklowitz et al. (2015). The THz frequency scattering of carriers by critical MFs can also explain the non-Fermi liquid behavior observed in the PM state Nagel et al. (2012).
To conclude, our measurements of QP relaxation dynamics in the URu2-xFexSi2 single crystals reveal several new insights. The dynamics in the PM phase, which are nearly independent of , highlight the presence of a hybridization gap as well as the influence of strong interactions between QPs and critical MFs. Below , the dynamics in the HO and LMAFM phases reflect known differences in the low energy electronic structure. As in past measurements Ran et al. (2016), we observe a second phase transition in a sample of intermediate Fe substituent concentration = 0.1. In addition to a low LMAFM phase, there is a distinct intermediate HO phase. The anomalous data in this phase suggests the unexpected possibility of coexisting HO and PM. Our study lays the groundwork for future experiments on the URu2-xFexSi2 system to understand HO, its relationship to LMAFM, and novel forms of order in -electron systems more generally.
Acknowledgements.
This research was supported by the U.S. National Science Foundation under Grant No. DMR-1810310 (ultrafast optical pump-probe spectroscopy measurements and materials characterization), the U.S. Department of Energy, Office of Science, Office of Basic Energy Sciences under Award Number DE-FG02-04ER46105 (crystal growth), and ARO W911NF-16-1-0361 (ultrafast instrumentation development).
The reference list from the paper itself. Each links out to its DOI / PubMed record.
- 1Palstra et al. (1985) T. T. M. Palstra, A. A. Menovsky, J. v. d. Berg, A. J. Dirkmaat, P. H. Kes, G. J. Nieuwenhuys, and J. A. Mydosh, Phys. Rev. Lett. 55 , 2727 (1985) . · doi ↗
- 2Maple et al. (1986) M. B. Maple, J. W. Chen, Y. Dalichaouch, T. Kohara, C. Rossel, M. S. Torikachvili, M. W. Mc Elfresh, and J. D. Thompson, Phys. Rev. Lett. 56 , 185 (1986) . · doi ↗
- 3Mydosh and Oppeneer (2011) J. A. Mydosh and P. M. Oppeneer, Rev. Mod. Phys. 83 , 1301 (2011) . · doi ↗
- 4Meng et al. (2013) J.-Q. Meng, P. M. Oppeneer, J. A. Mydosh, P. S. Riseborough, K. Gofryk, J. J. Joyce, E. D. Bauer, Y. Li, and T. Durakiewicz, Phys. Rev. Lett. 111 , 127002 (2013) . · doi ↗
- 5Bareille et al. (2014) C. Bareille, F. L. Boariu, H. Schwab, P. Lejay, F. Reinert, and A. F. Santander-Syro, Nature Communications 5 , 4326 (2014) . · doi ↗
- 6Chatterjee et al. (2013) S. Chatterjee, J. Trinckauf, T. Hänke, D. E. Shai, J. W. Harter, T. J. Williams, G. M. Luke, K. M. Shen, and J. Geck, Phys. Rev. Lett. 110 , 186401 (2013) . · doi ↗
- 7Boariu et al. (2013) F. L. Boariu, C. Bareille, H. Schwab, A. Nuber, P. Lejay, T. Durakiewicz, F. Reinert, and A. F. Santander-Syro, Phys. Rev. Lett. 110 , 156404 (2013) . · doi ↗
- 8Hassinger et al. (2010) E. Hassinger, G. Knebel, T. D. Matsuda, D. Aoki, V. Taufour, and J. Flouquet, Phys. Rev. Lett. 105 , 216409 (2010) . · doi ↗