Discovery of CO absorption at z=0.05 in G0248+430
F. Combes (LERMA, Obs-Paris), N. Gupta (Pune, India), G. I. G. Jozsa, (Cape Town South Africa), E. Momjian (NRAO, USA)

TL;DR
This paper reports the first detection of CO absorption at z=0.05 in a merging galaxy system, providing insights into the molecular content and physical conditions of the interstellar medium in the tidal tail.
Contribution
It presents the discovery of CO(1-0) and CN(1-0) absorption lines in a galaxy merger system, complementing previous emission and absorption observations across multiple wavelengths.
Findings
Detection of CO and CN absorption lines at z=0.05
Confirmation of CO emission in the merging galaxies
Insights into the molecular content of the tidal tail
Abstract
Absorption lines in front of distant quasars are quite rare in the millimeter domain. They can however bring a very useful and complementary information to emission lines. We report here the detection with NOEMA of CO(1-0) and CN(1-0) lines in absorption, and confirmation of CO emission in the quasar/galaxy pair Q0248+430/G0248+430. The system G0248+430 corresponds to two merging galaxies (a Seyfert and a LINER) at z=0.0519 with a tidal tail just on the line of sight to the background quasar Q0248+430 at z = 1.313. Optical (CaII, NaI), HI-21cm and OH-1667 MHz absorption lines associated with the tidal tail of the foreground system have previously been detected toward the quasar, while four CO lines at different rotation J levels have been detected in emission from the foreground galaxies. New HI 21-cm line observations with the upgraded GMRT array are presented. We discuss the…
Click any figure to enlarge with its caption.
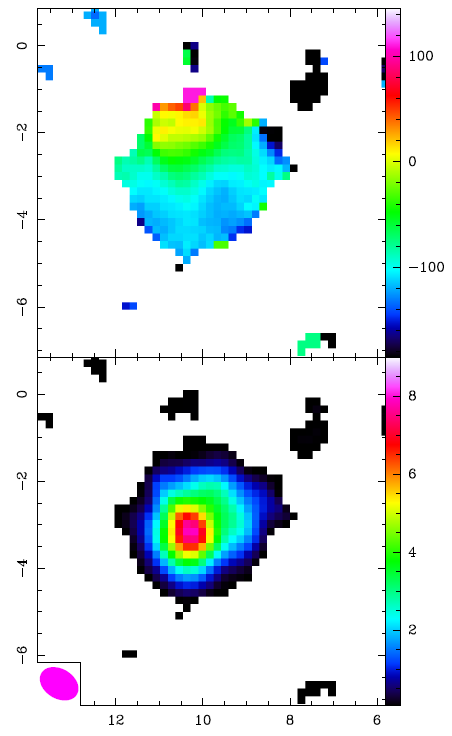 Figure 1
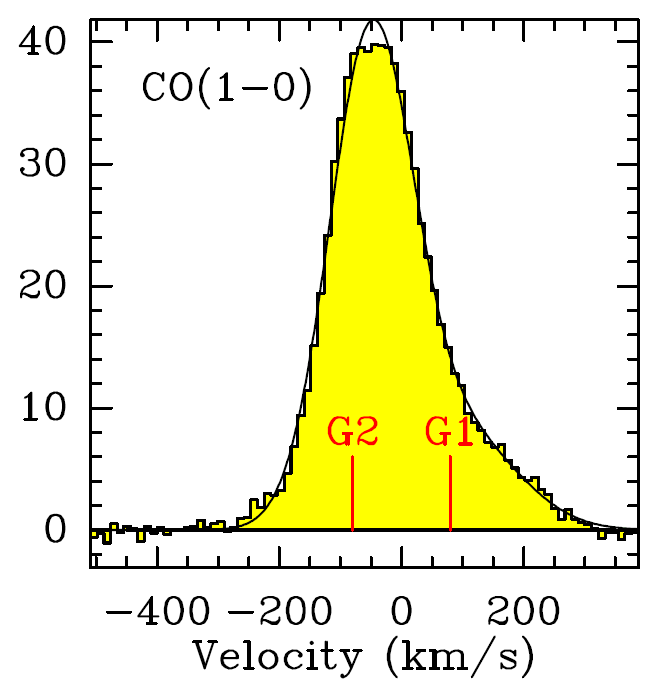 Figure 2
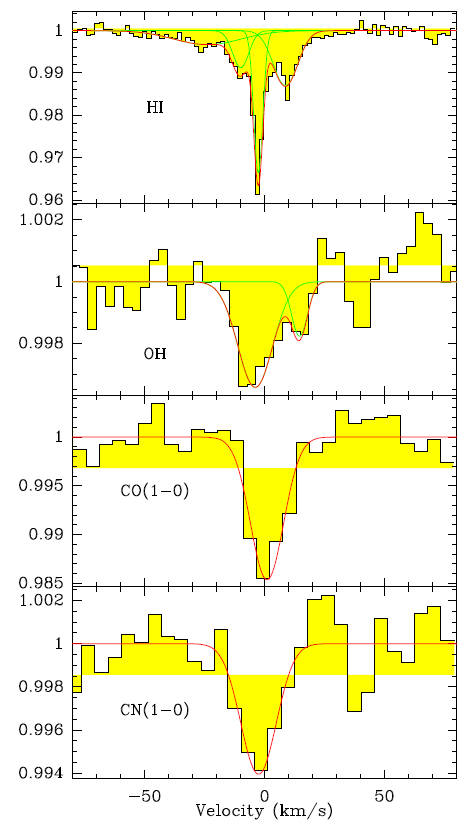 Figure 3
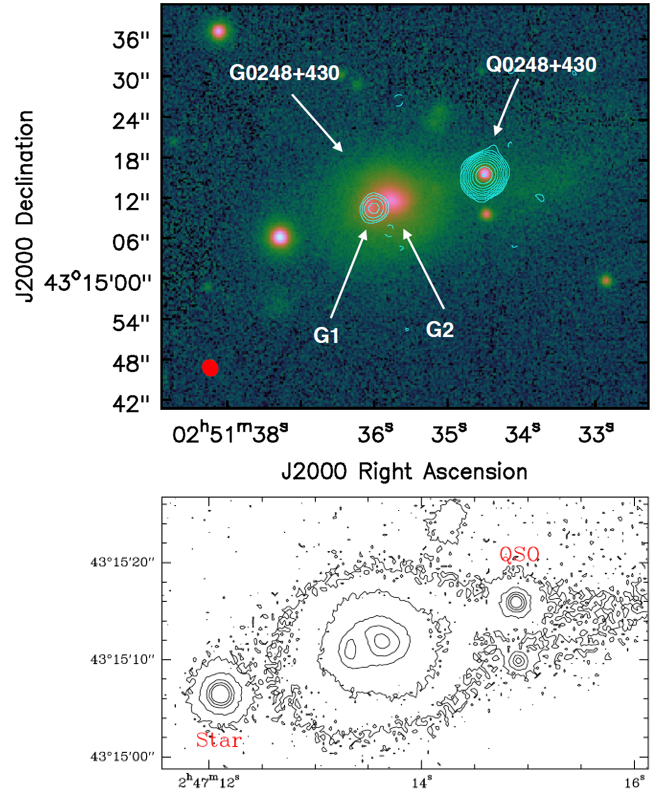 Figure 4
| SFR | ||||
| (L⊙) | (M⊙) | () | (K km s-1 pc2) | (M⊙) |
| (1) | (2) | (3) | (4) | (5) |
| 4.3 | 6.5 | 74 | 0.4 | 1.6 |
| Absorption | Emission | |
|---|---|---|
| RA | 02:51:34.5 | 02:51:36.04 |
| Dec | 43:15:16.0 | 43:15:10.8 |
| z | 0.05151 | 0.05135 |
| SCO(1-0) | 0.25.02 | 290.5 |
| VCO | 161.6 | 1912 |
| SCN(1-0) | 0.11.02 | – |
| VCN | 173 | – |
| Line | Area | V | V | Peak |
| km s-1 | km s-1 | km s-1 | ||
| HI1 | 0.11 .01 | -24 1.8 | 33. 1.8 | 0.9967 |
| HI2 | 0.07 .01 | -10. 1.8 | 8 1.8 | 0.9913 |
| HI3 | 0.16 .01 | -2.6 1.8 | 4.5 1.8 | 0.9664 |
| HI4 | 0.17 .01 | 8.7 1.8 | 12 1.8 | 0.9871 |
| OH1 | -0.06.01 | -4 2 | 17 5 | 0.9966 |
| OH2 | -0.015.01 | 14 4 | 8 6 | 0.9982 |
Peer Reviews
No public reviews on file for this paper yet. If you reviewed it on a platform where reviews are public (OpenReview, ICLR, NeurIPS, ICML), you can paste yours below so the community can read it here.
Videos
No videos yet. Explain this paper in a talk, walkthrough, or lecture? Add one.
11institutetext: Observatoire de Paris, LERMA, College de France, CNRS, PSL Univ., Sorbonne University, UPMC, Paris, France 22institutetext: Inter-University Centre for Astronomy and Astrophysics, Post Bag 4, Ganeshkhind, Pune 411 007, India 33institutetext: South African Radio Astronomy Observatory, Black River Park, 2 Fir Street, Observatory, Cape Town, 7925, South Africa 44institutetext: Rhodes Centre for Radio Astronomy Techniques & Technologies, Dep. of Physics and Electronics, Rhodes University, PO Box 94, Grahamstown 6140, South Africa 55institutetext: Argelander-Institut für Astronomie, Auf dem Hügel 71, D-53121 Bonn, Germany 66institutetext: National Radio Astronomy Observatory, P.O. Box O, Socorro, NM 87801, USA
Discovery of CO absorption at z=0.05 in G0248+430
††thanks: Based on observations carried out with NOEMA, the NOrthern Extended Millimeter Array – IRAM (Institute of RAdioastronomy in Millimeter).
F. Combes 11
N. Gupta 22
G. I. G. Jozsa 334455
E. Momjian 66
(Received 2018/ Accepted 2019)
Absorption lines in front of distant quasars are quite rare in the millimeter domain. They can, however, bring very useful and complementary information to emission lines. We report here the detection with NOEMA of CO(1-0) and CN(1-0) lines in absorption, and the confirmation of CO emission in the quasar/galaxy pair Q0248+430/G0248+430. The system G0248+430 corresponds to two merging galaxies (a Seyfert and a LINER) at z=0.0519 with a tidal tail just on the line of sight to the background quasar Q0248+430 at z = 1.313. Optical (CaII, NaI), H I-21cm, and OH-1667 MHz absorption lines associated with the tidal tail of the foreground system have previously been detected toward the quasar, while four CO lines at different rotation levels have been detected in emission from the foreground galaxies. New H I 21cm line observations with the upgraded GMRT array are also presented. We discuss the molecular content of the merging galaxies, and the physical conditions in the absorbing interstellar medium of the tidal tail.
Key Words.:
Galaxies: active — Galaxies: ISM — Galaxies: nuclei — Galaxies: quasars: absorption lines — Galaxies: quasars: general
1 Introduction
Most of our knowledge of molecular gas in galaxies at high or low redshift have been obtained through CO emission line studies. However, absorption lines can bring new and complementary information. In contrast to emission, absorption lines remain observable at practically any distance, with the sensitivity only determined by the strength of the background source (e.g., Combes, 2008). Given a strong enough continuum source, ( mJy), millimeter-wave absorption lines can be used to obtain information about molecular gas and star formation in “normal” galaxies. While emission lines are sensitive to dense and warm molecular gas, absorption lines may also arise from low-excitation and diffuse gas, which is more prevalent in normal galaxies (e.g., Wiklind & Combes, 1995, 1996, 1997; Menten et al., 2008; Henkel et al., 2009; Muller et al., 2014).
Once a galaxy has been detected in the strongest CO absorption lines, deeper studies in other molecular lines allow characterization of the physical and chemical conditions in the absorbing gas (e.g., Henkel et al., 2005; Bottinelli et al., 2009; Muller et al., 2014, 2016; Riquelme et al., 2018). The relative strengths of species like HC3N, where the excitation is dominated by the cosmic microwave background (CMB), can be used to determine the CMB temperature (e.g., Henkel et al., 2009; Muller et al., 2013). Comparisons between the redshifts of different transitions (e.g., NH3, CH3OH, OH) can be used to test for cosmological variations in the fundamental constants (e.g., Uzan, 2011; Kanekar, 2011; Kanekar et al., 2012; Rahmani et al., 2012; Bagdonaite et al., 2013).
In this paper we report the discovery of CO absorption at 0.05, in front of the quasar Q0248 at (Kuehr, 1977). The absorption comes from a foreground pair of galaxies called G0248 (Junkkarinen, 1987), consisting of the two sources G1 and G2. A tidal tail connects, in projection, G2 with the background quasar. Optical absorption lines (CaII and NaI) have been detected at the G0248 redshift , or very close (0.05146, at 150 km s*-1*) by Sargent & Steidel (1990) and Womble et al. (1990). They noted that the QSO and the galaxy nuclei are separated by 14.7” = 14.7 kpc at z=0.05, and the absorption is due to the tidal tail crossing the quasar (see Fig. 1).
Throughout this paper we use the CDM cosmology with =0.3, =0.7, and Ho=70 km s*-1* Mpc*-1*. At the redshift of the foreground galaxies, the distance scale is 1 kpc per arcsec.
2 Apparent quasar-galaxy merger association
The associated pair of galaxies G0248 is a violent starburst, according to its IRAS far-IR (FIR) flux density measurements, corresponding to LFIR= 4.31011 L⊙, and a star formation rate (SFR) of 74 M⊙/yr (see Table 1), and the G1 and G2 nuclei (separated by 3.5” = 3.5 kpc) both show nonthermal activity (Borgeest et al., 1991; Kollatschny et al., 1991). Indeed, G1 is a LINER and G2 a Seyfert 2, and based on their optical emission line excitation both are located in the AGN region of the Baldwin-Phillips-Terlevich (BPT) diagram (Baldwin et al., 1981), plotting [OIII]/H as a function of [NII]/H. We note that the above FIR luminosity is extrapolated between 1 and 500m, as in Table 1, while Gupta et al. (2018a) adopt the calibration formula from Sanders & Mirabel (1996) and find LFIR= 3.51011 L⊙, which is in good agreement. The background quasar Q0248 is a well-studied radio source and has a variable, flat spectrum (Massaro et al., 2014). Its flux density at 100 GHz has been observed to be around 200 mJy. The variability of the quasar could be due in part to micro-lensing by stars in the tidal tail of G0248 (Borgeest & Schramm, 1994). An OH megamaser has been detected from the starburst (Kazes et al., 1989; Darling & Giovanelli, 2002). Kollatschny et al. (1991) determine the kinematics of the two merging galaxies, the LINER G1 and Seyfert G2; the former shows systematic rotation, but the latter does not. With respect to G2 (z=0.0507), a constant velocity of 100 km s*-1* is observed all across the tidal tail. Furthermore, from their spectra, they conclude that G1 is a spiral galaxy and G2 an elliptical. Downes et al. (1993) report the detection of CO(1-0) emission, with an integrated flux of 25 Jy km s*-1* with the IRAM 30m telescope. With the NRAO 12m telescope, Walker et al. (1997) confirm this detection, and show a quite high CO(2-1) excitation, with a ratio of 4 between the CO(2-1) and CO(1-0) integrated fluxes, taking into account a common full width at half maximum (FWHM) of 175 km s*-1* . Observations of CO(3-2) with the JCMT (James Clerk Maxwell Telescope) by Leech et al. (2010) reveal a CO(3-2)/CO(1-0) flux ratio of 6. Papadopoulos et al. (2010) find a CO(6-5)/CO(1-0) flux ratio of 16, showing that the peak of the excitation is around J=3-4. Hwang & Chiou (2004) have mapped the galaxy pair in CO(1-0) at 2” resolution using the Berkeley Illinois Maryland Array (BIMA). They confirm the integrated flux of 25 Jy km s*-1* found by Downes et al. (1993) showing little or no interferometer filtering (see our spectrum in Fig. 2). They also show H I-21cm absorption detected with the Very Large Array (VLA, 1.8” beam) in front of the quasar, which remains unresolved in the 21cm continuum. The H I absorption is at the same velocity as the CaII and NaI lines. Gupta et al. (2006, 2018a) have detected the strongest line (at 1667 MHz rest frequency) of the OH 18cm transitions in absorption in front of the quasar with a total integrated optical depth of 0.080.01 km s*-1* , showing that molecular gas exists in the tidal tail. For an excitation temperature of 10 K, the observed 1667 MHz OH optical depth corresponds to a column density of N(OH) = 1.8 x 1014 cm*-2*; similar column densities (1013-14 cm*-2*) are observed in diffuse clouds, while typical values for giant molecular clouds (GMC) are 1015-16 cm*-2*. The BIMA observations by Hwang & Chiou (2004) did not lead to any detected CO absorption in front of the quasar, but the data suffered from a low sensitivity (N(CO) cm*-2*).
Assuming a spin temperature of 1000K, Hwang & Chiou (2004) derive a column density of N(H I) = 51020 cm*-2*. However, this is based on a derived integrated optical depth at 21cm of dv = 0.26 km s*-1*. Gupta et al. (2018a) reprocessed these archival VLA data, and found dv = 0.430.02 km s*-1*. The column density of the H I gas in front of the quasar is large enough for the absorber to be classified as a damped Ly system, provided the spin temperature is higher than 300 K and/or the covering factor is less than unity.
The calcium depletion on grains of the absorbing gas is high, indicating that the gas must come from a disk rather than from a halo. The column density of NaI is 6.3 1013 cm*-2* (Womble et al., 1990), while the ratio N(CaII)/N(NaI)=0.2-0.3 is low, similar to or lower than the values 1 of the Galactic disk. The high NaI suggests that the gas could come from outflowing gas from the starburst or the active nuclei in the tidal tail (Heckman et al., 2000). The absence of H I emission in the VLA observations (upper limit at 5 of 2.3 1022 cm*-2* over 30 km s*-1*) is likely due to the phase transformation of the atomic gas to molecular gas in the starburst, which now contains M(H2)= 1.61010 M⊙, with a standard CO-to-H2 conversion factor, X(CO) = 2 cm*-2* / (K km s*-1*).
3 Observations and data analysis
3.1 IRAM observations
We have mapped G0248 at 109.605 GHz for a total of 13 hr (8 hr on source) allowing us to spatially resolve the CO(1-0) emission line in the foreground gas, and the continuum emissions from both the foreground merging system and the background quasar.
The phase center was RA(2000) = 02h 51m 35.1s, Dec(2000) = 43∘ 15’ 14.0”, corresponding to the barycenter of the quasar and the merging system (both are located at 6.5” from the phase center). The observations were made with nine antennas using the extended array A-configuration of the NOEMA interferometer (project W17CE, P.I.: Combes). The configuration provided a synthesized beam of 0.94 0.67 arcsec (PA=60∘). This allows us to resolve the two merging galaxies, which are separated by 3.5”= 3.5 kpc. The field of view at half power is 47” at this frequency. The observations were carried out during five days (10, 16, 23, 25 February, and 2 March 2018) in very good weather conditions (seeing in the range 0.1-0.4 arcsec).
We employed the PolyFix correlator in Band 1 (3 mm), which provides 28 GHz of instantaneous dual-polarization bandwidth. The spectral resolution was 2 MHz (5.4 km s*-1* at the redshifted CO(1-0) frequency). The bandwidth allowed us to observe the frequency range from 91.9 to 99.7 GHz in LSB (Lower SideBand), and 107.3 to 115.1 GHz in the USB (Upper SideBand). The data reduction was performed using the latest release of the GILDAS package as of May 2018111https://www.iram.fr/IRAMFR/GILDAS/. The data were calibrated using the NOEMA standard pipeline adopting a natural weighting scheme to optimize both sensitivity and resolution. Flagging was required only on the February 10 data, and was minor. The rms noise is 0.3 mJy in 30 km s*-1* channels for the line and 8 Jy/beam for the continuum.
3.2 uGMRT observations
We used Band-5 (1000-1450 MHz) of the upgraded Giant Metrewave Radio Telescope (uGMRT) to observe the redshifted H I 21cm line toward the quasar. The observations took place on 29 June 2018. The GMRT Software Backend (GSB) was used to configure a baseband bandwidth of 4.17 MHz split into 512 spectral channels (resolution1.8 km s*-1*) centered at 1350.8 MHz. During the -hour observing run, 3C48 was observed for flux density scale and bandpass calibrations. The total on-source time was 6.6 hours. The data were edited, calibrated, and imaged using the Automated Radio Telescope Imaging Pipeline (ARTIP) that is being developed to perform the end-to-end processing of data from the uGMRT and MeerKAT absorption line surveys (Gupta et al., 2018b; Sharma et al., 2018).
The Stokes radio continuum image made using the line-free frequency channels and using ROBUST=0.5 visibility weighting (based on Common Astronomy Software Applications, CASA) is shown in Fig. 1. The image has a synthesized beam of and an rms noise level of 0.45 mJy beam*-1*. The radio continuum emission associated with Q0248+430 and G1 is unresolved with a deconvolved size 0.2*′′. The integrated flux densities are 12141.3 and 23.71.3 mJy, respectively. We extracted the Stokes 21cm absorption spectra toward Q0248+430 and G1. The spectral rms noise level in the unsmoothed spectra is 1.2 mJy beam-1*. The spectrum of Q0248+403 is presented in Fig. 2. Ninety percent of the total 21cm optical depth is contained within 49 km s*-1* and the total integrated 21cm optical depth, = 0.530.02 km s*-1*. In the spectrum of G1 (not shown here), we detect a broad absorption feature 100 km s*-1* in width centered at 1351.06 MHz. It corresponds to an integrated optical depth of 191 km s*-1*. However, in the different circular polarizations (L for left, R for right) and their cross-correlations, this feature is present only in LL and not in RR; therefore, we consider the feature to be an artifact. For G0248+430 we then use the RR spectrum smoothed to 30 km s*-1*. Adopting 100 km s*-1* as the FWHM of a typical associated 21cm absorption line (Gupta et al., 2006), we estimate a 3 21cm integrated optical depth limit of 6 km s*-1*.
4 Results
4.1 Implication of CO absorption
The CO(1-0) emission and possible absorption was mapped in the NOEMA field of view of 47 arsec FWHP around the merging galaxies (G1 and G2 of Fig 1) with 0.94”0.67” resolution. Although the quasar and the tidal tail were only at an angular distance of 6.5” from the phase center, the sensitivity was not sufficient to detect molecular emission in the tidal tail.
While it was quite easy to detect the radio continuum of the quasar, at a level of 0.155 Jy (and the foreground absorption toward it) it was not possible to detect the two AGN nuclei in the continuum of G2 (Seyfert) or of GI (LINER), the latter being detected at centimeter wavelength.
The quasar continuum source is unresolved. In the millimeter range, AGN continuum sources are in general restricted to a core smaller than a milliarcsec in size, contrary to the cm emission, extended due to steep spectrum radio lobes (e.g., de Zotti et al., 2010). This size corresponds to 1 pc at the galaxies’ distance, and it is therefore justified to assume that the molecular medium fills the surface of the quasar continuum source. Assuming a filling factor of 1, we can derive the average column density over the beam corresponding to the quasar mm continuum emission and its footprint on the galaxy tidal tail. This will be a lower limit to the actual column density,
[TABLE]
where is the statistical weight of level , is the Einstein coefficient for transition , and the function is
[TABLE]
We adopt the partition function of local thermal equilibrium (LTE), i.e., , where is the energy of level or (for CN) and is the excitation temperature of the CO or CN molecule. For the CN molecule, we detect the two stronger lines at rest frequencies, 113.488 GHz and 113.490 GHz, which are blended at our spectral resolution (they correspond to J=3/2-1/2, F=3/2-1/2, and F=5/2-3/2). We do not detect the three other lines, expected to be five times weaker. We have detected CO(1-0) absorption in front of the quasar, with an optical depth =0.016 or V =0.25 km s*-1* , corresponding to N(CO) = 2.91015 cm*-2* or N(H2) = 2.91019 cm*-2*, for a common CO/H2 abundance ratio of 10*-4*. For this computation, we have assumed an excitation temperature of = 15 K. With the same assumptions, the column density of CN is 7.61012 cm*-2*. The relative abundance of CN/CO = 2.6 10*-3* is relatively high for dense clouds, by 1 or 2 orders of magnitude (e.g., Leung et al., 1984), but not necessarily for more diffuse clouds, for which some models predict abundances 100 times higher (Wakelam et al., 2015). The H2 column density found toward the tidal tail indeed corresponds to that of a diffuse interstellar medium (Welty et al., 2006) (see also Sect. 1).
4.2 Implications of CO emission
Figure 3 displays the NOEMA integrated CO(1-0) emission map and the velocity field of G0248 (zero and first moments of the cube). The central CO(1-0) spectrum is displayed in Fig. 4 . For the first time, the CO emission is resolved by our beam of 0.940.67” and the total extent of the CO emission is 4 kpc. The morphology is not symmetric, however, as expected for an interacting galaxy. The velocity field shows clear rotation, with the kinematic major axis in the N-S direction. The projected gradient is relatively low, but this can be explained by the almost face-on orientation (inclination ) of both G1 and G2. The systemic velocities of the two galaxies, obtained through their optical spectrum by Kollatschny et al. (1991), are indicated in figure 4. They are symmetrically located at 80 km s*-1* from the center of the absorption, which is at z=0.05151.
With our high spatial resolution, we can now attribute the CO emission to one or the other galaxy of the pair. The galaxies are separated by 3.5” = 3.5 kpc, and Hwang & Chiou (2004) find the CO emission centered in the middle of G1 and G2, but they had a synthesized beam of 2”. As displayed in Table 2, the center of the CO emission coincides clearly with the position of the spiral galaxy G1, and not with the elliptical G2, or with a position in between the two merging galaxies. Within its maximum radial extent of 2 kpc, there is no CO emission detected toward the center of G2. Kollatschny et al. (1991) estimated the V luminosities of both galaxies, LV(G1) = 4.5109 L⊙ and LV(G2) = 9.4109 L⊙. Through kinematical arguments, they also derived a total mass for the ensemble of Mtot = 6.71010 M⊙. Assuming comparable mass-to-luminosity ratios for the two galaxies, we can estimate the stellar mass of G1 at 2.21010 M⊙. This estimation is compatible with that obtained from the observed H and [NII] rotation curve: a maximum rotational velocity of 100 km s*-1* at a radius of 2 kpc, provided that the inclination of the spiral galaxy G1 is 27∘.
The observation of the fundamental CO(1-0) line is the best measure of the total H2 mass. We compute L’CO, the CO luminosity in units of K km s*-1pc2, through integrating the CO intensity over the velocity profile, and over the galaxy extent. The total flux is = 29 Jy km.s-1* (see Table 2) very close to the previous values, 24 Jy km s*-1* with the BIMA interferometer (Hwang & Chiou, 2004) and 25 Jy km s*-1* with the IRAM 30m telescope (Downes et al., 1993), confirming that the interferometer has not resolved out any emission.
This CO luminosity is given by
[TABLE]
where is the integrated flux in Jy km s*-1* , the rest frequency in GHz, and the luminosity distance in Mpc. Under the assumption of a standard CO-to-H2 conversion factor (Bolatto et al., 2013), we compute the H2 mass using M L’CO, with M⊙ (K km s*-1* pc2)-1. The molecular gas mass is then M = 1.51010 M⊙.
Given our estimation of the stellar mass of the spiral galaxy G1 above, we can now compute a gas fraction of 40%. This is a high gas fraction, even for the epoch, as determined from the scaling relation of the main sequence (e.g., Tacconi et al., 2018). The gas fraction in G1 is ten times higher than the value expected on the main sequence. The explanation is that G1 belongs to a merging system. The SFR is 74 M⊙/yr (see Table 1), and the depletion time is tdep = 200 Myr, i.e., ten times lower than the depletion time on the main sequence. The merging system is therefore in a starburst phase, probably due to the gravitational torques of the interaction, which have driven all the gas reservoir of the G1 spiral galaxy inward. Alternatively, as observed in active starburst galaxies, it is possible to adopt a much lower CO-to-H2 conversion factor, but then the depletion time would be even lower, which would bring the system even farther from the main sequence.
4.3 H I absorption
The updated H I 21cm absorption spectrum toward the quasar is presented in Fig. 2, together with the other absorption lines. We have fitted the spectrum with four Gaussians, and the results are in Table 3. The new H I absorption spectrum with high spectral resolution allows the discovery of quite narrow components (8 km s*-1* , implying a kinetic temperature lower than 1400 K), together with relatively wide wings (33 km s*-1*), although the fit is not unique. Within the errors, the integrated 21cm optical depth estimated using this spectrum is consistent with that from the VLA spectrum presented in Gupta et al. (2018b). As expected the molecular absorption is coincident with the narrower (implying colder) and stronger 21cm absorption components at -2.6 and +8.7 km s*-1* . The limited spectral resolution and sensitivity of the molecular data (OH, CO, and CN) does not allow us to carry out a more detailed decomposition. The two main and broader components seen in the H I absorption are only tentatively seen in the OH spectrum, and not in CO or CN. This might be explained by the different sizes of the quasar continuum emission at millimeter and centimeter wavelengths. The radio continuum at 2.3 GHz has an overall extent of 26 mas (27 pc at z=0.05; Fey & Charlot (2000)), which is much larger than the size expected at 100 GHz relevant for CO and CN absorption lines.
4.4 Absorption upper limits
The wide bandwidth of NOEMA allowed us to search for other possible absorptions from lines falling in our frequency range. There is an H2CO line at 101.332 GHz; however, the lower level of the transition at 57 K is too high to yield a significant limit. There is CS(2-1) at 97.980 GHz, with a lower level at 2.2 K, and the fundamental O2 line at 118.750 GHz. These lines were not detected, and we derive 3 upper limits of N(CS) 3.3 1012 cm*-2* and N(O2) 2.9 1017 cm*-2*, assuming the same excitation temperature of Tx = 15 K. The molecular oxygen limit is quite high, because the strength of the transition is about 2 orders of magnitude lower than for the CO molecule.
5 Concluding remarks
We reported the discovery of a new CO(1-0) absorption in an intervening galaxy () in front of a background quasar (). Millimetric molecular absorptions are still very rare at moderate and high redshift: only six systems have been found (e.g., Combes, 2008): three are associated-absorbing systems (i.e., from the AGN host itself), one has been detected recently (Allison et al., 2019), and three are intervening absorbers from gravitational lens systems. To date no simple millimeter molecular absorber has been detected in a normal intervening galaxy without strong lensing, and hence more suitable to study variations of fundamental constants. The absorber in front of Q0248 presented here is thus the first one: the absorbing gas is in a tidal tail without any lensing potential.
With high spatial resolution, the number of detections for local millimeter absorption, in the associated-absorption category, is increasing (e.g., Tremblay et al., 2016), providing extremely useful information, for example disentangling inflow from outflow around AGN. Although intervening H I 21cm absorbers are now more frequent with about a 30% detection rate in case of optically selected sight lines (Gupta et al., 2009, 2013; Dutta et al., 2017), the OH absorbers in intervening galaxies are still rare, with an incidence or a number per unit redshift of =0.008, at z0.1 (Gupta et al., 2018a).
In the present case, the absorption is from relatively diffuse gas, belonging to a tidal tail at about 17 kpc projected distance from the parent G1 galaxy, the gas-rich spiral from the merging pair. The column density is therefore quite low, and the depth of the absorption rather small, less than 2%. In the near future, the increased sensitivity of ALMA, NOEMA, and large blind surveys with SKA precursors such as MALS (e.g., Gupta et al., 2016; Allison et al., 2016) will make it possible to discover such weak absorbing systems, which was impossible before.
Acknowledgements.
We warmly thank the referee for the constructive comments and suggestions. We thank the GMRT and IRAM staff for their support during the observations, and in particular Mélanie Krips during the reduction of NOEMA data. We acknowledge the use of ARTIP. ARTIP was developed by researchers and developers at ThoughtWorks India Pvt. Limited and IUCAA. GMRT is run by the National Centre for Radio Astrophysics of the Tata Institute of Fundamental Research. The National Radio Astronomy Observatory is a facility of the National Science Foundation operated under cooperative agreement by Associated Universities, Inc. This work is based on observations carried out under project number W17CE with the IRAM NOEMA Interferometer. IRAM is supported by INSU/CNRS (France), MPG (Germany), and IGN (Spain). The Common Astronomy Software Applications (CASA) package was developed by an international consortium of scientists based at the National Radio Astronomical Observatory (NRAO), the European Southern Observatory (ESO), the National Astronomical Observatory of Japan (NAOJ), the Academia Sinica Institute of Astronomy and Astrophysics (ASIAA), the CSIRO division for Astronomy and Space Science (CASS), and the Netherlands Institute for Radio Astronomy (ASTRON) under the guidance of NRAO.
The reference list from the paper itself. Each links out to its DOI / PubMed record.
- 1Allison et al. (2019) Allison, J. R., Mahony, E. K., Moss, V. A., et al. 2019, MNRAS, 482, 2934
- 2Allison et al. (2016) Allison, J. R., Zwaan, M. A., Duchesne, S. W., & Curran, S. J. 2016, MNRAS, 462, 1341
- 3Bagdonaite et al. (2013) Bagdonaite, J., Jansen, P., Henkel, C., et al. 2013, Science, 339, 46
- 4Baldwin et al. (1981) Baldwin, J. A., Phillips, M. M., & Terlevich, R. 1981, PASP, 93, 5
- 5Bell & de Jong (2001) Bell, E. F. & de Jong, R. S. 2001, Ap J, 550, 212
- 6Bolatto et al. (2013) Bolatto, A. D., Wolfire, M., & Leroy, A. K. 2013, ARA&A, 51, 207
- 7Borgeest et al. (1991) Borgeest, U., Dietrich, M., Hopp, U., Kollatschny, W., & Schramm, K. J. 1991, A&A, 243, 93
- 8Borgeest & Schramm (1994) Borgeest, U. & Schramm, K.-J. 1994, A&A, 284, 764