A 10-$M_{\odot}$ YSO with a Keplerian disk and a nonthermal radio jet
Luca Moscadelli, Alberto Sanna, Riccardo Cesaroni, Victor M. Rivilla,, Ciriaco Goddi, Kazi L.J. Rygl

TL;DR
This study presents high-resolution ALMA observations of a high-mass YSO with a Keplerian disk and nonthermal radio jet, revealing detailed disk structure, rotation profile, and potential dynamical interactions.
Contribution
It provides the first detailed ALMA imaging of a high-mass YSO's disk showing Keplerian rotation and disk-jet misalignment, suggesting dynamical interactions.
Findings
Disk radius ~500 au with Keplerian rotation around 10±2 M_sun
Detection of a Vlsr gradient indicating disk rotation
High gas temperatures (42-131 K) in the mm sources
Abstract
We previously observed the star-forming region G16.590.05 through interferometric observations of both thermal and maser lines, and identified a high-mass young stellar object (YSO) which is surrounded by an accretion disk and drives a nonthermal radio jet. We performed high-angular-resolution (beam FWHM ~0.15") 1.2-mm continuum and line observations towards G16.590.05 with the Atacama Large Millimeter Array (ALMA). The main dust clump, with size ~10 au, is resolved into four relatively compact (diameter ~2000 au) millimeter (mm) sources. The source harboring the high-mass YSO is the most prominent in molecular emission. By fitting the emission profiles of several unblended and optically thin transitions of CHOCH and CHOH, we derived gas temperatures inside the mm-sources in the range 42--131 K, and calculated masses of 1--5 . A well-defined Local…
Click any figure to enlarge with its caption.
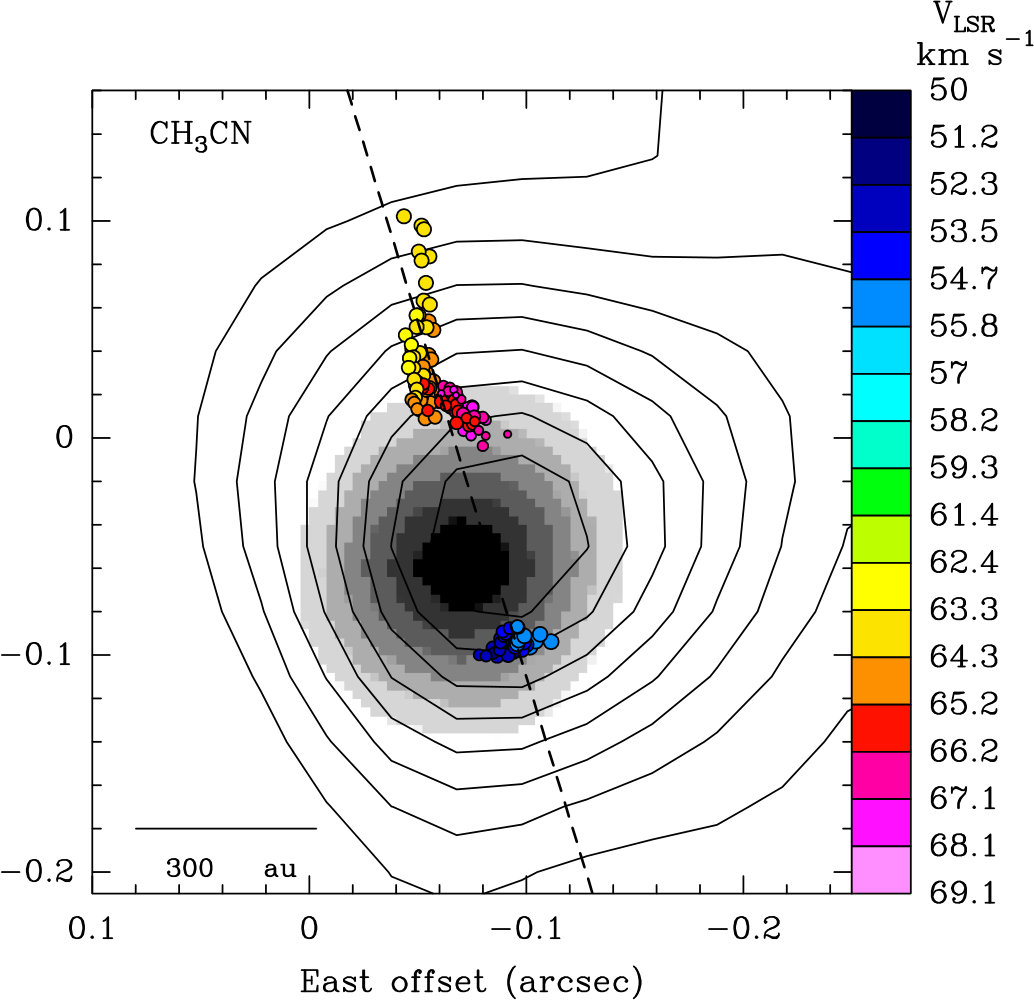 Figure 1
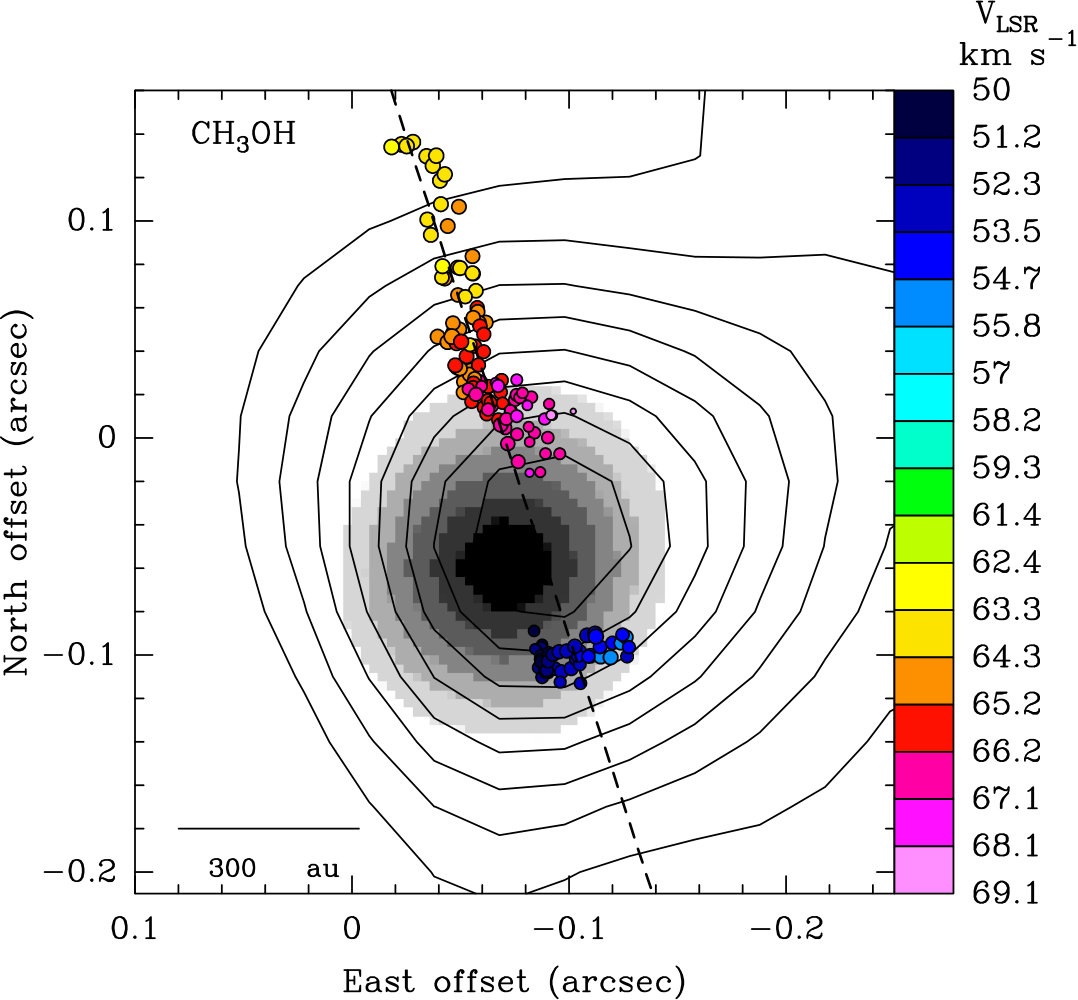 Figure 2
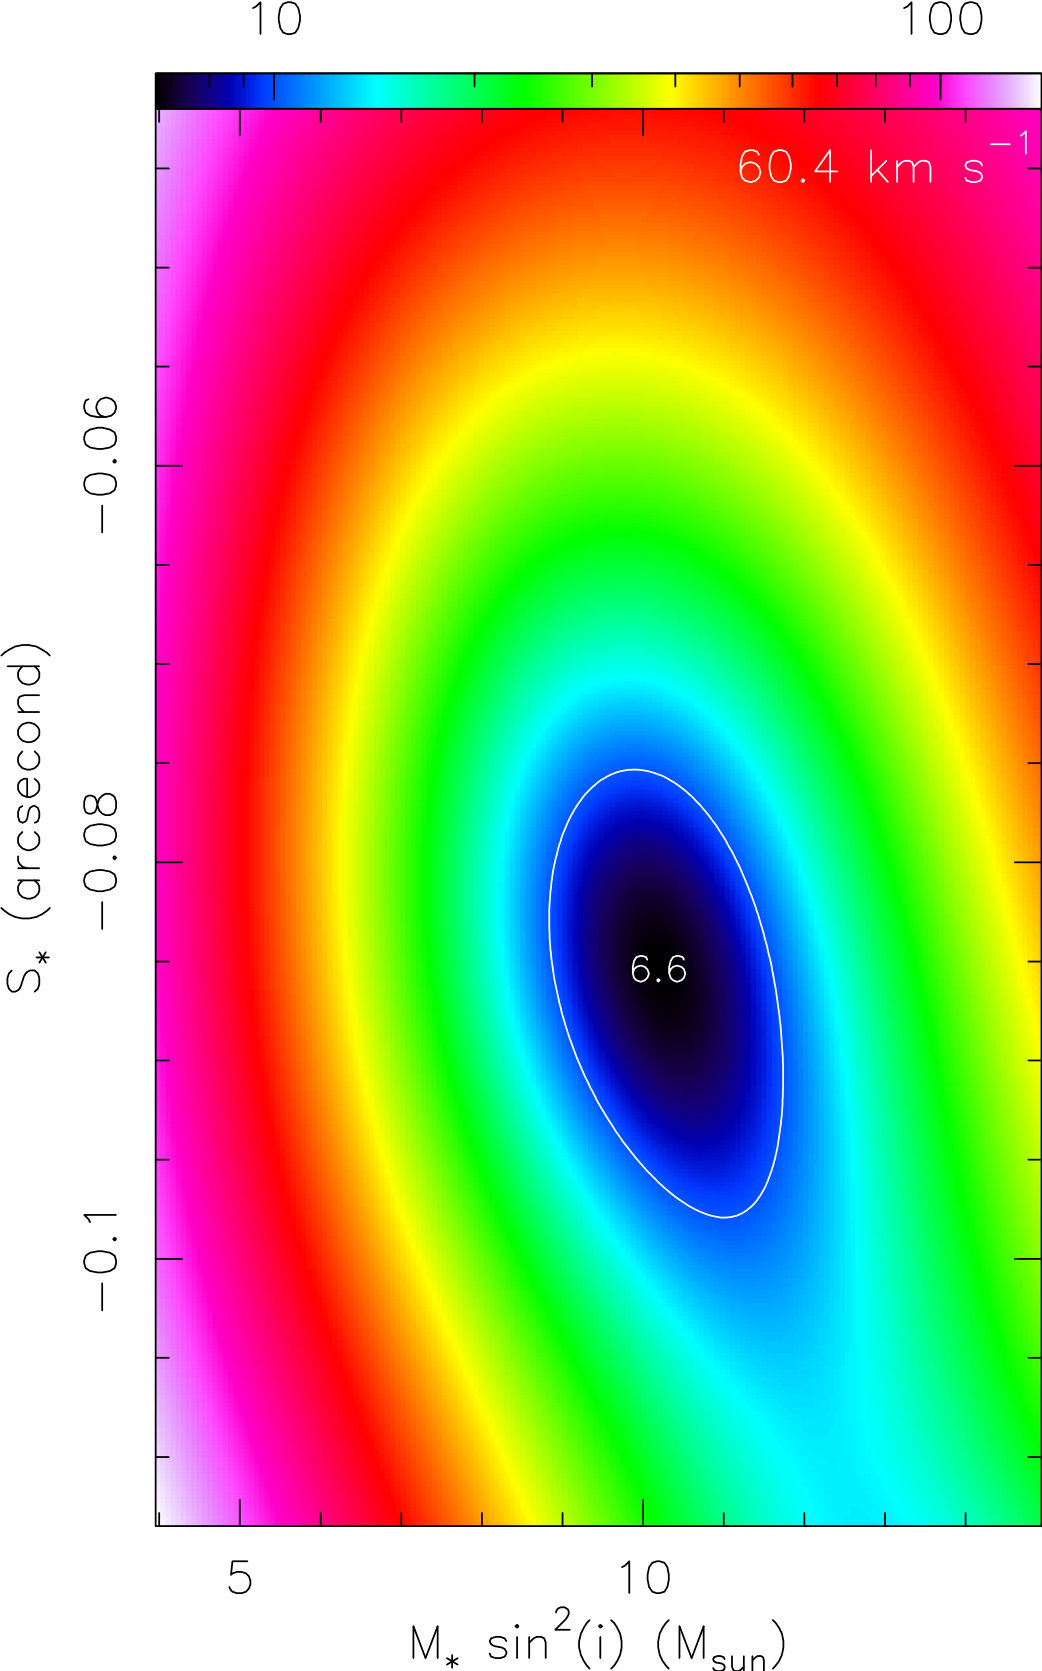 Figure 3
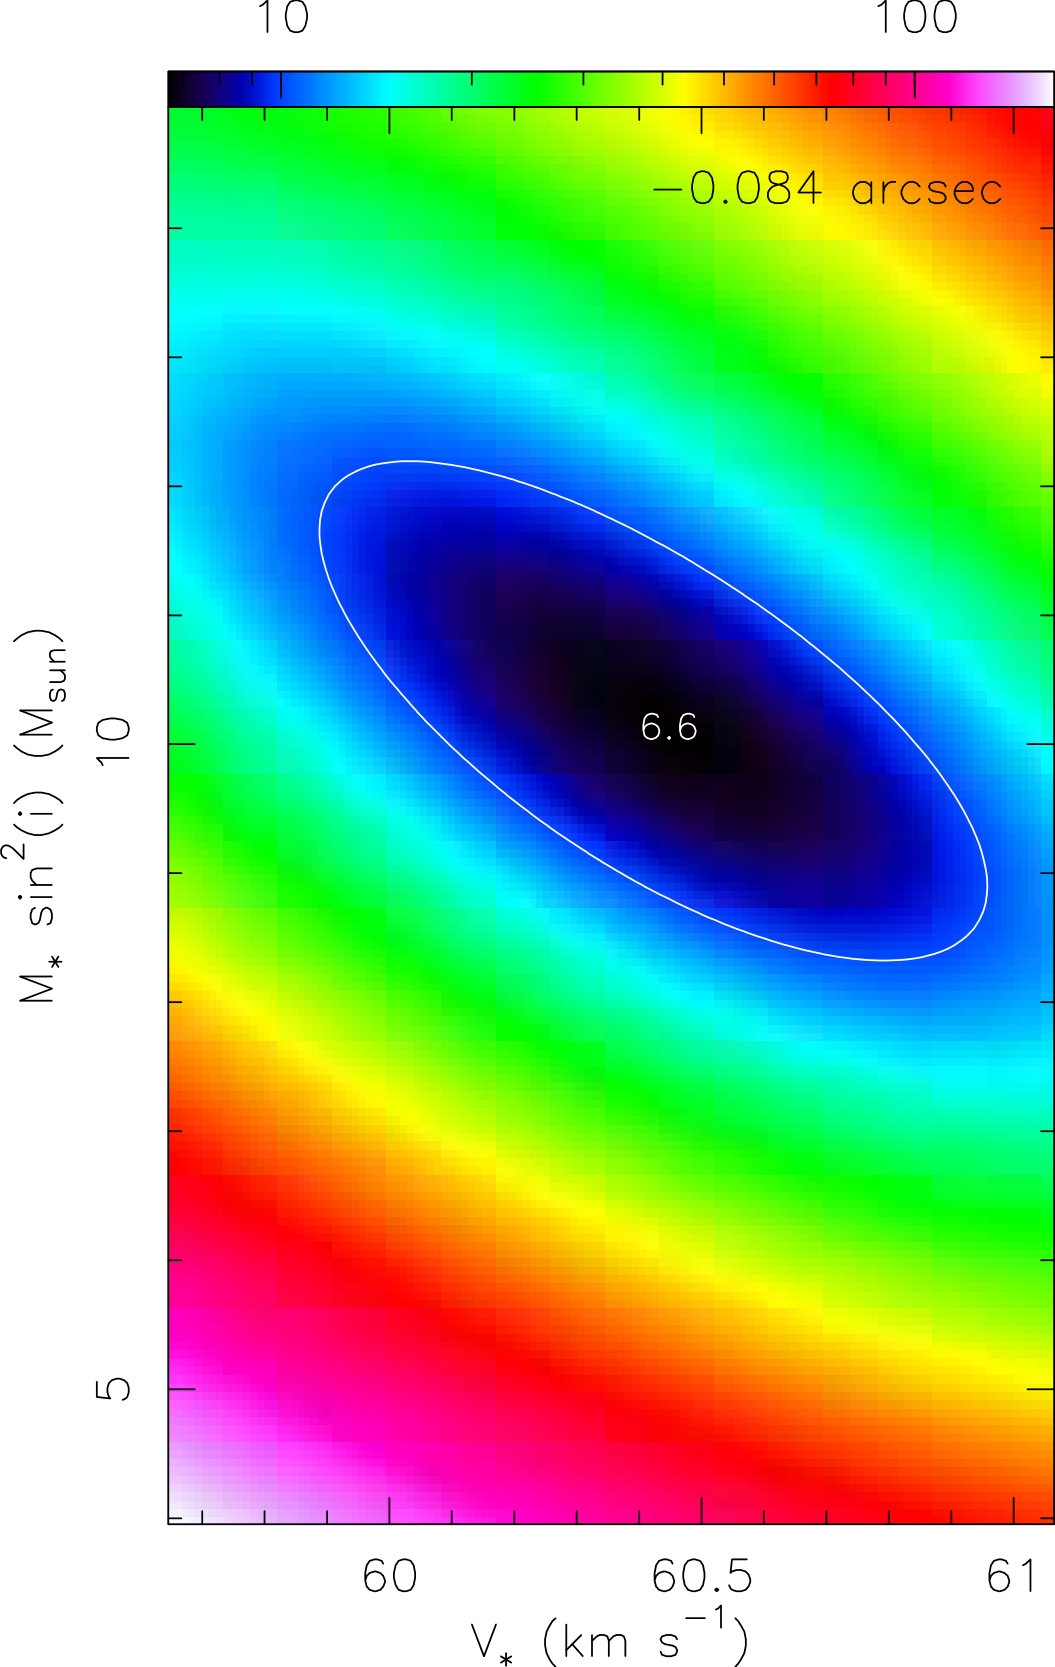 Figure 4
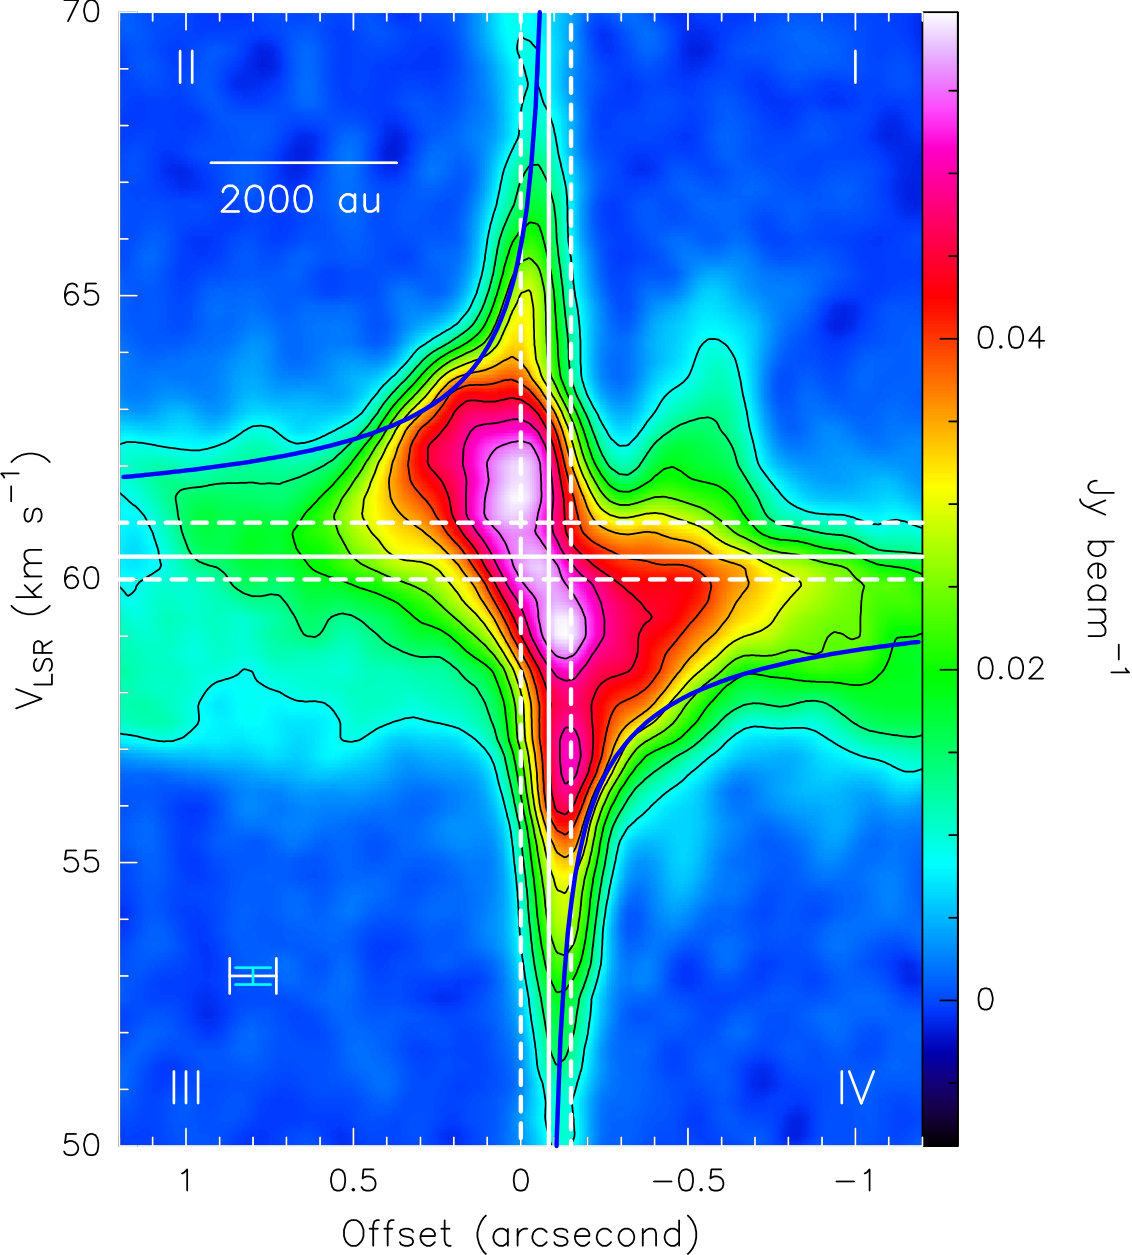 Figure 5
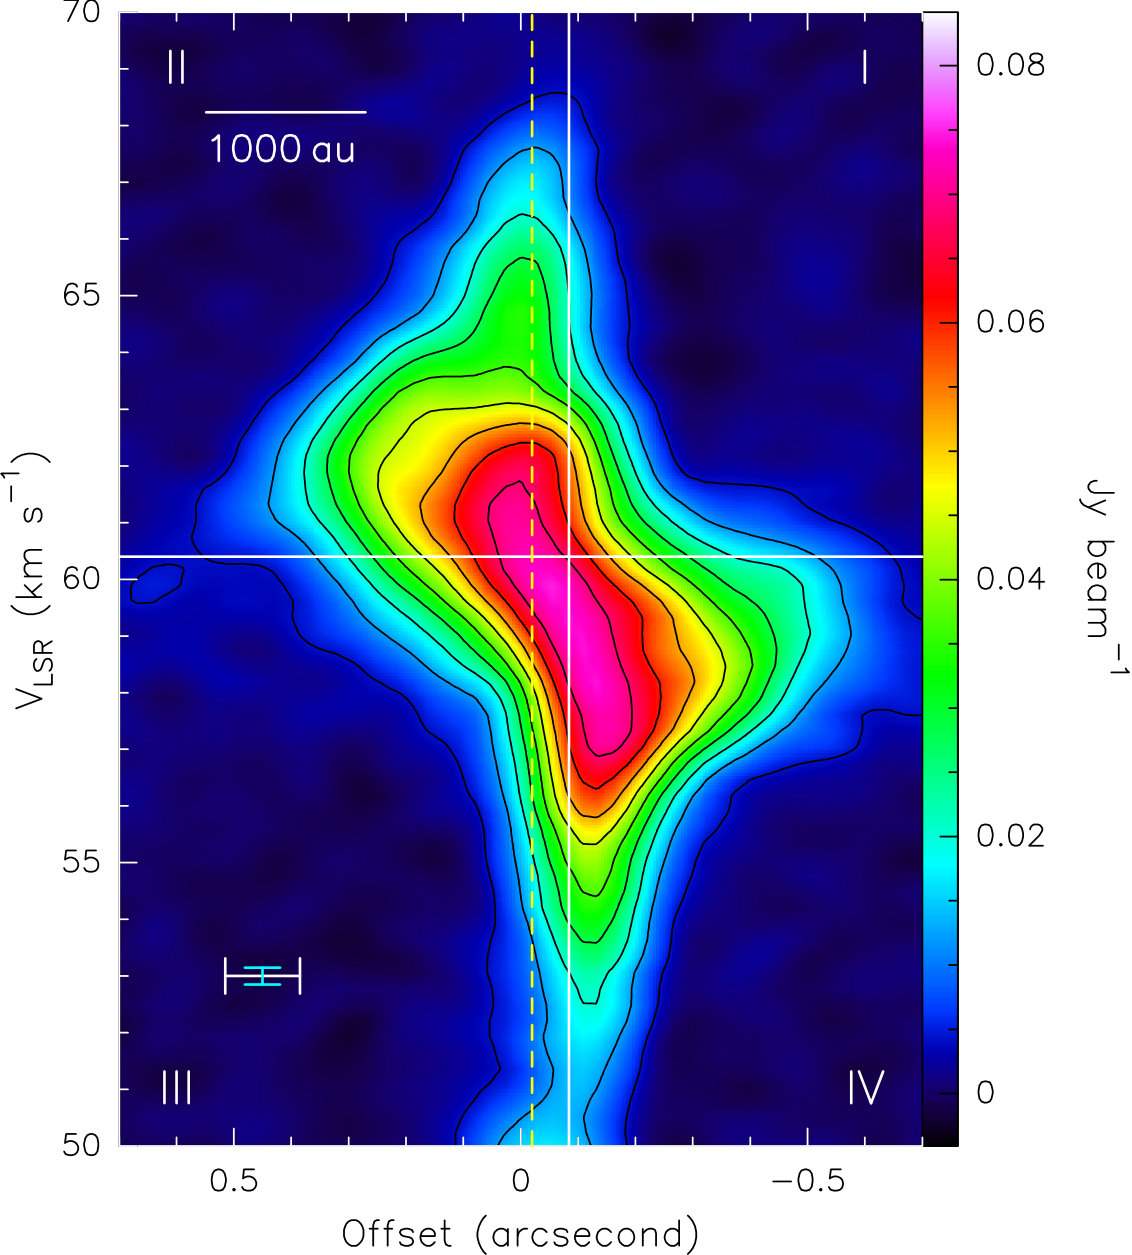 Figure 6
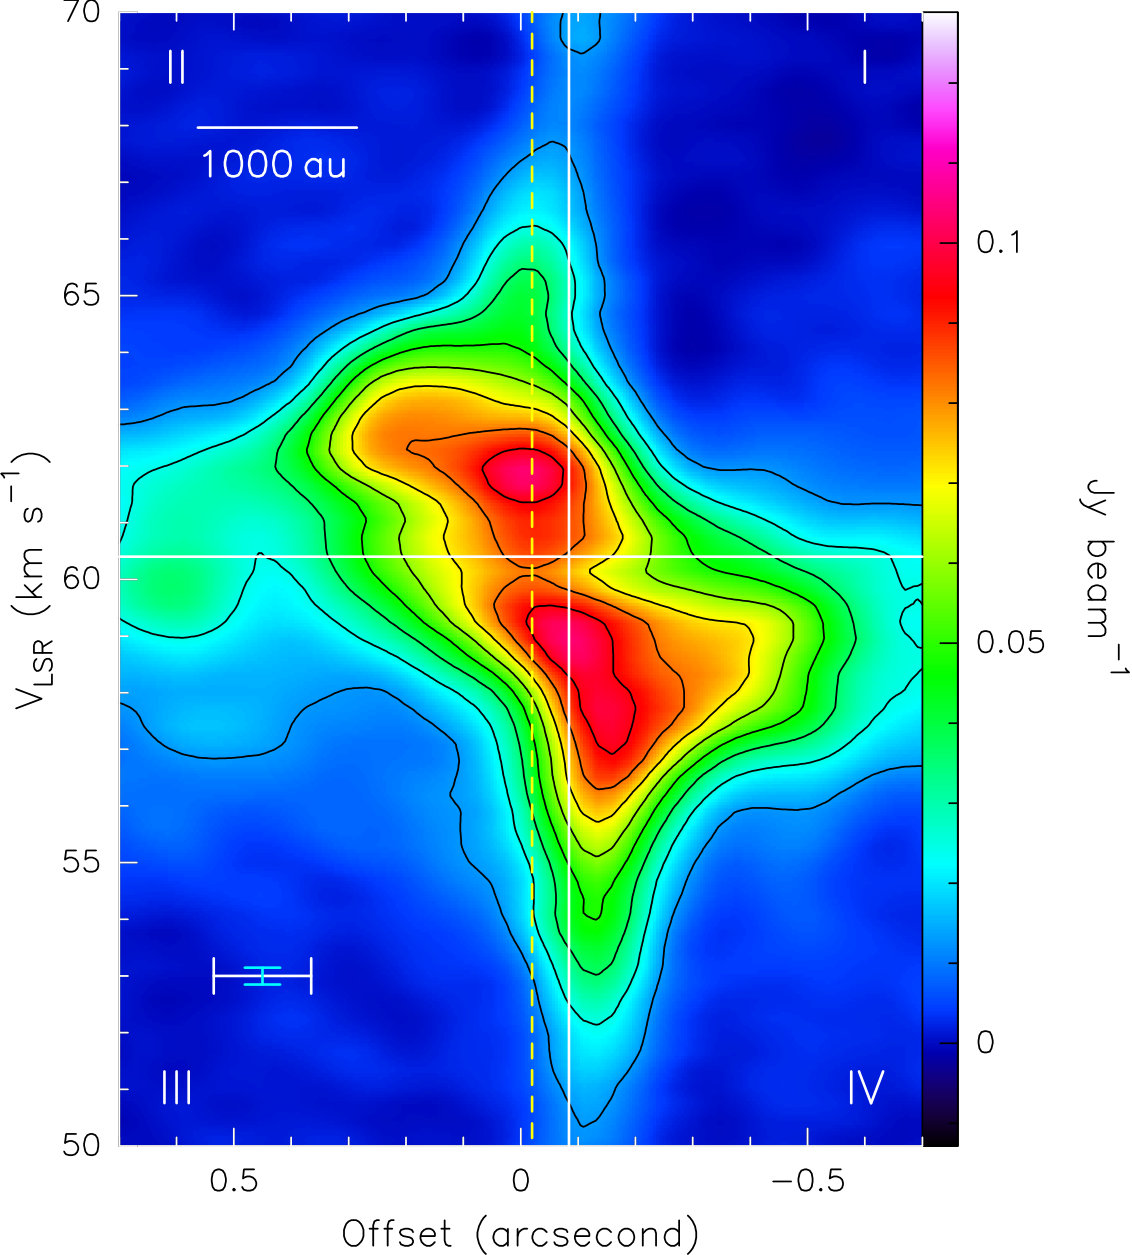 Figure 7
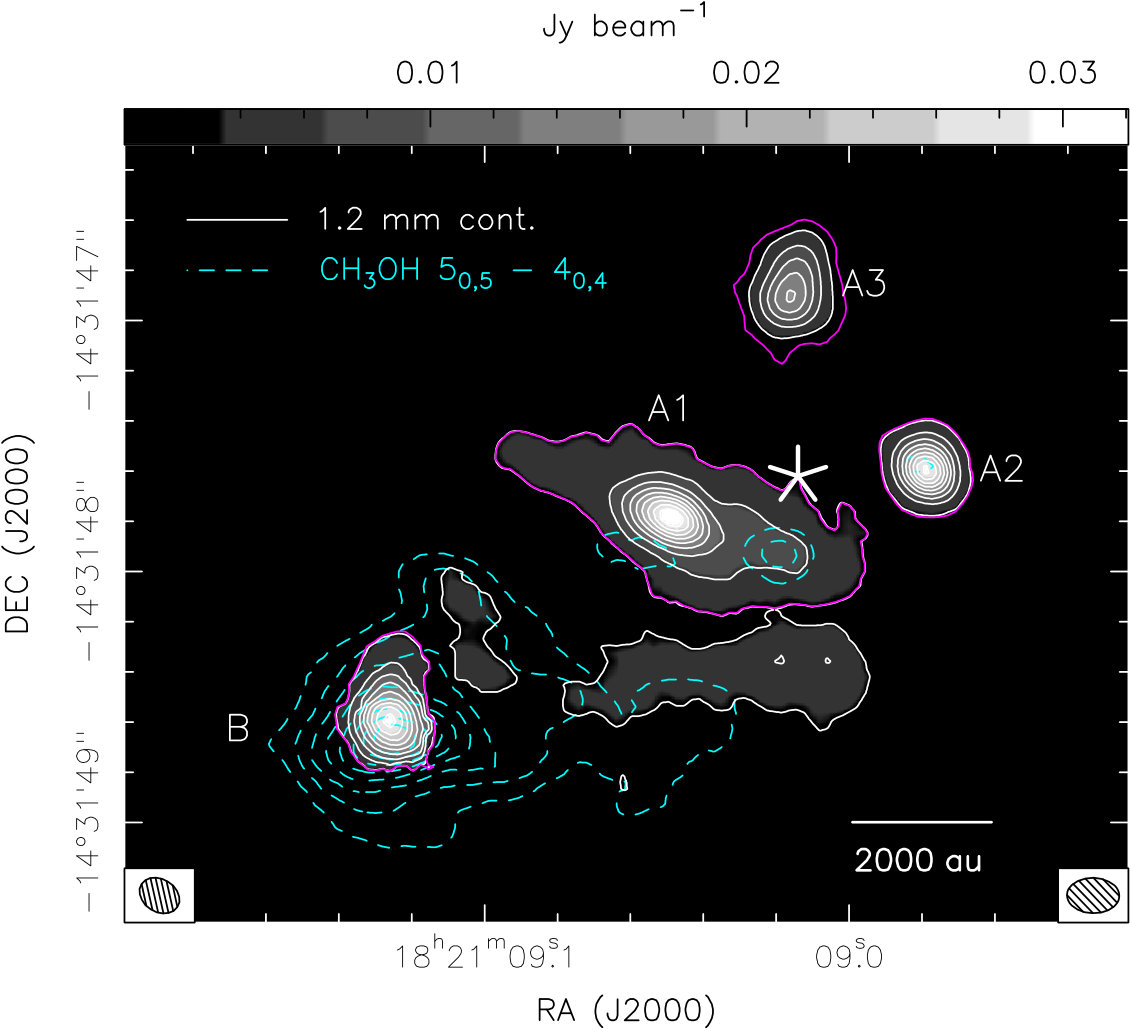 Figure 8
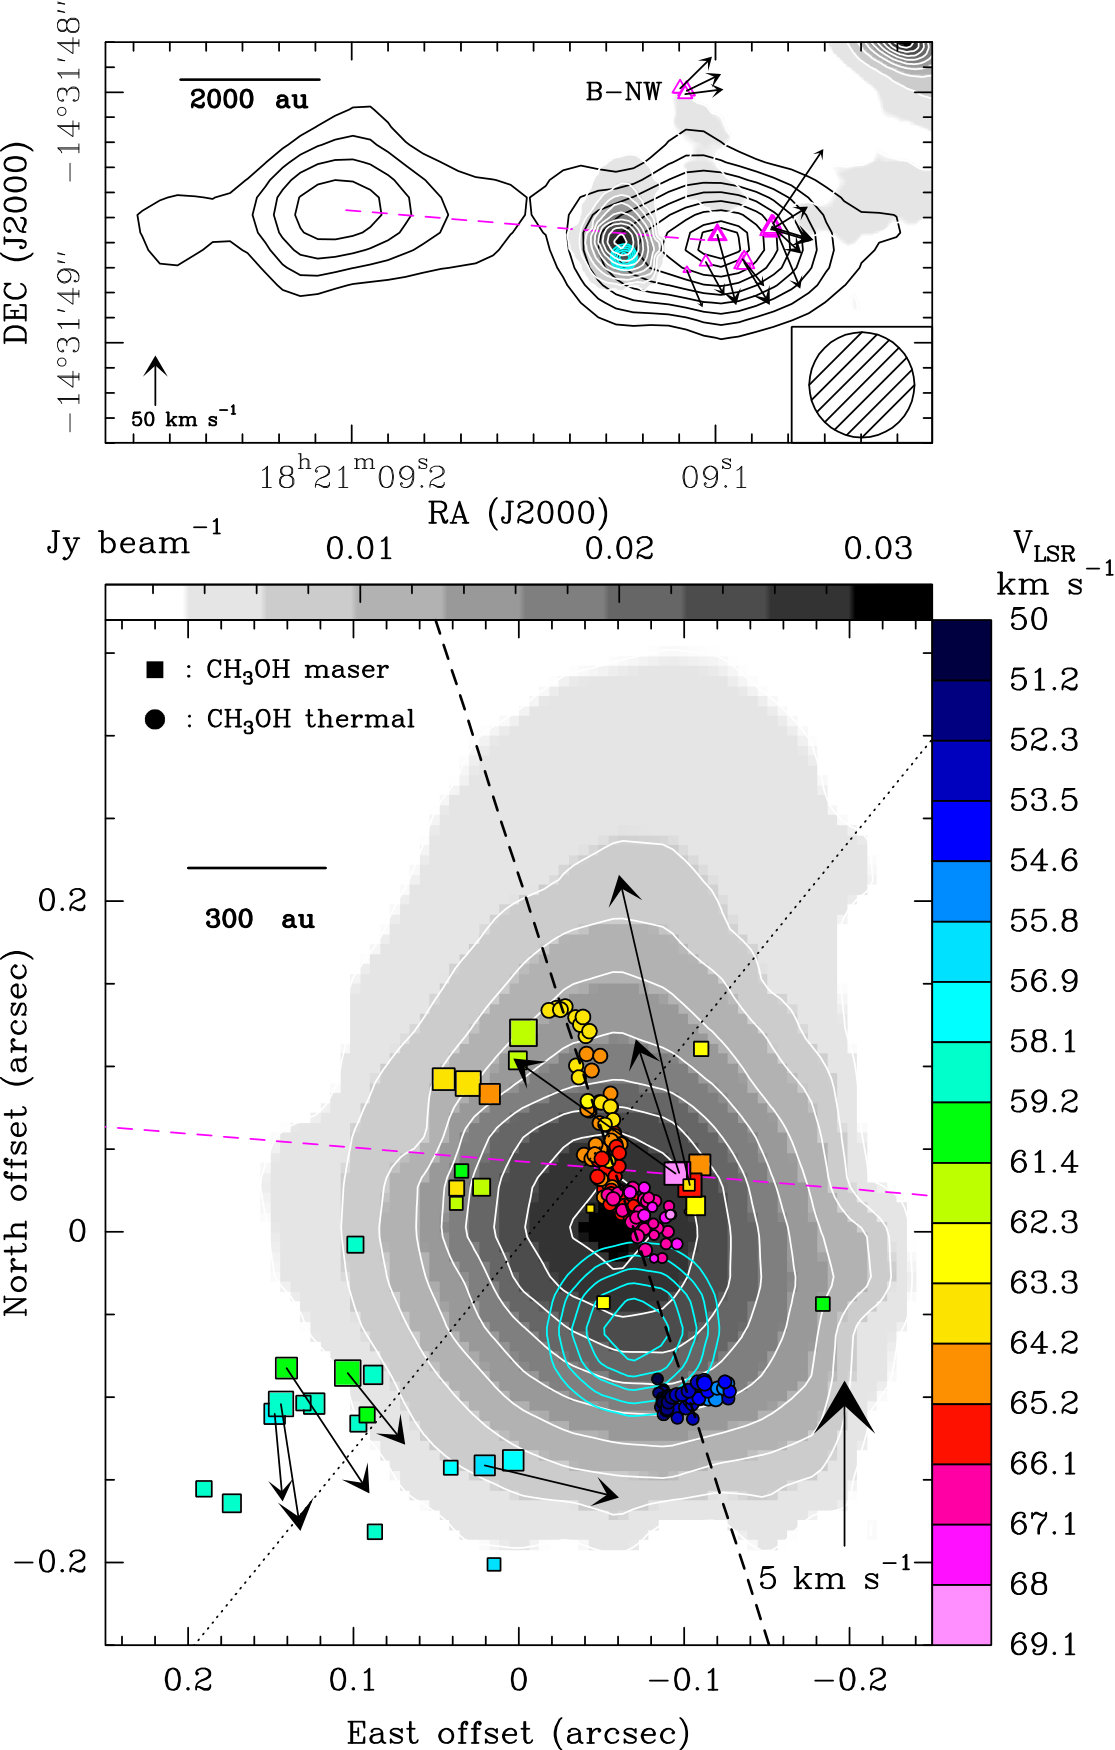 Figure 9
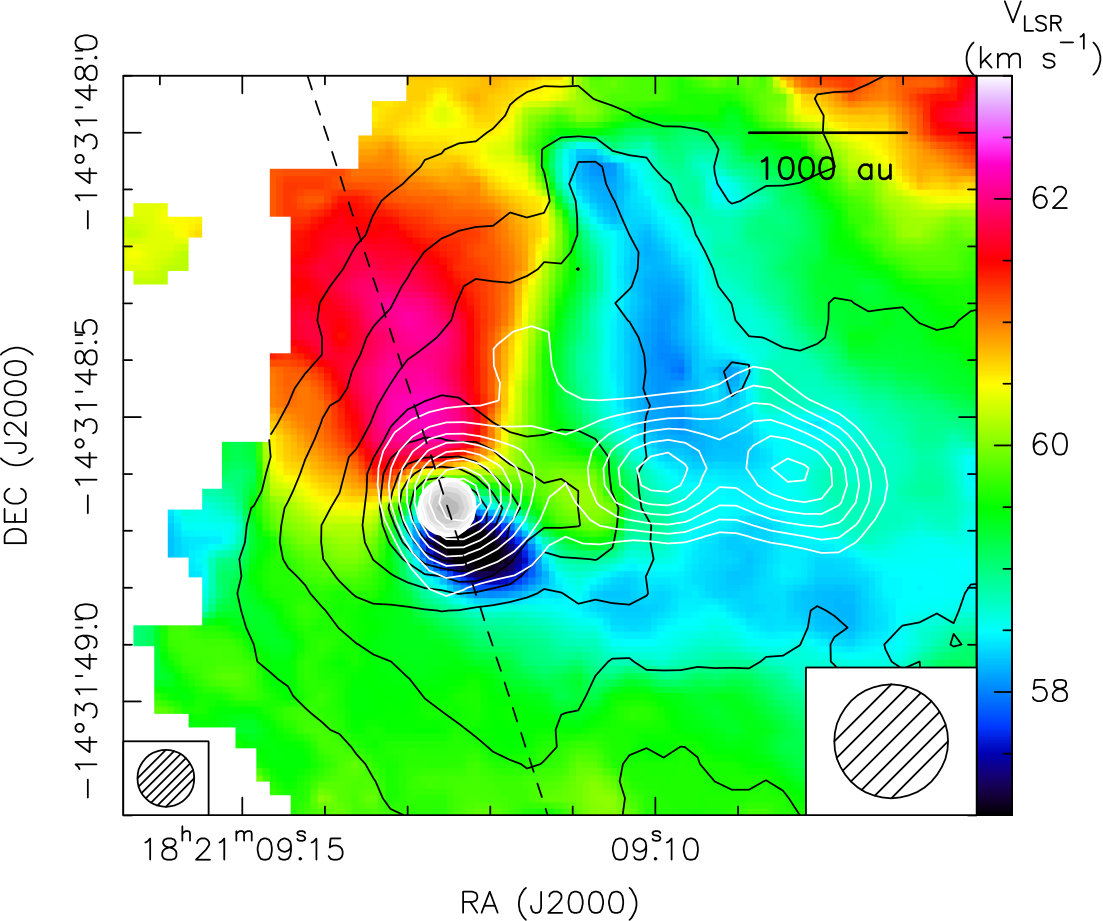 Figure 10
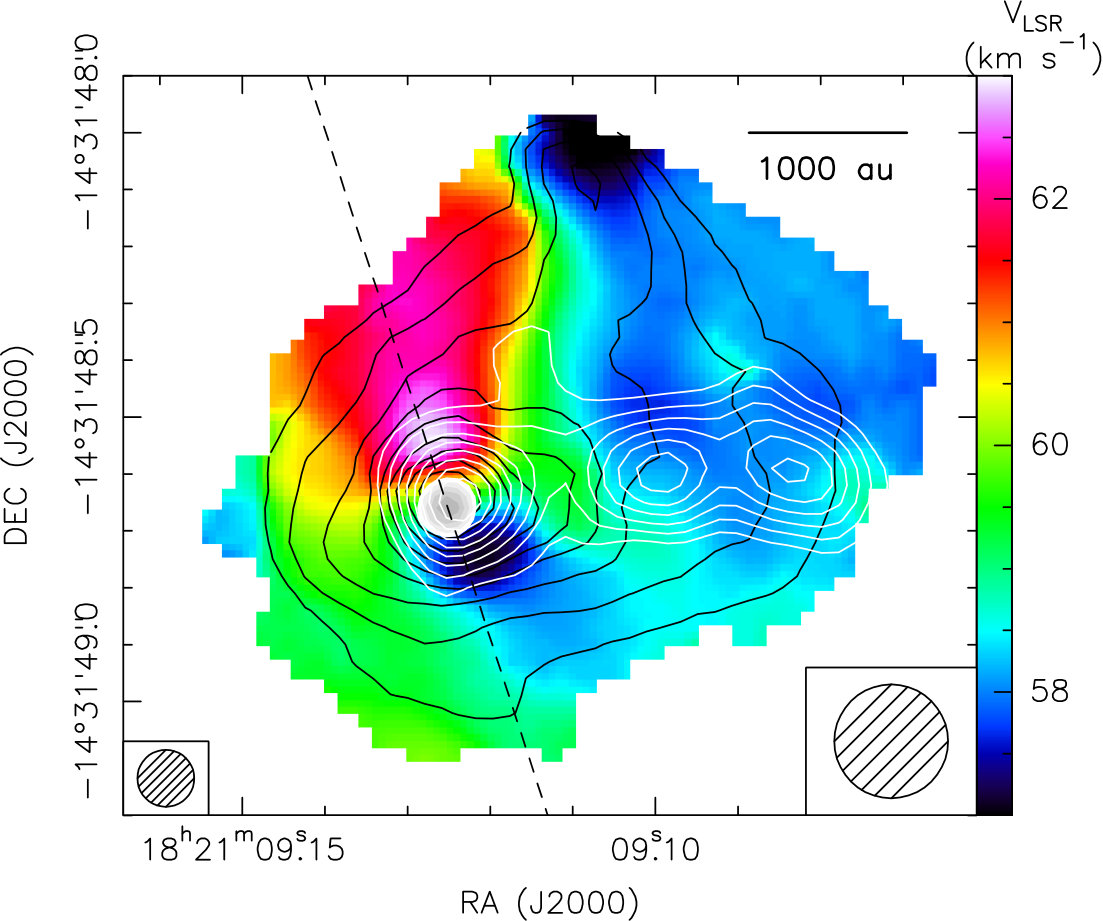 Figure 11
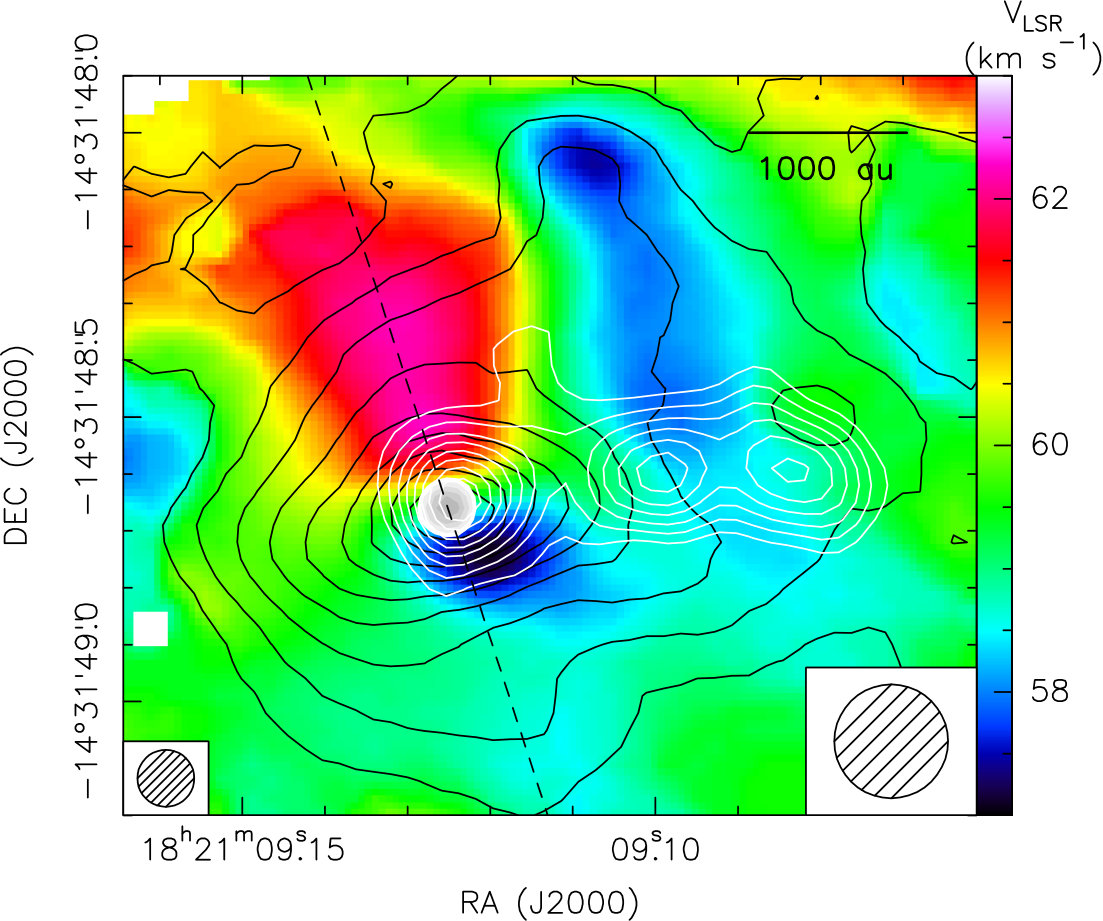 Figure 12
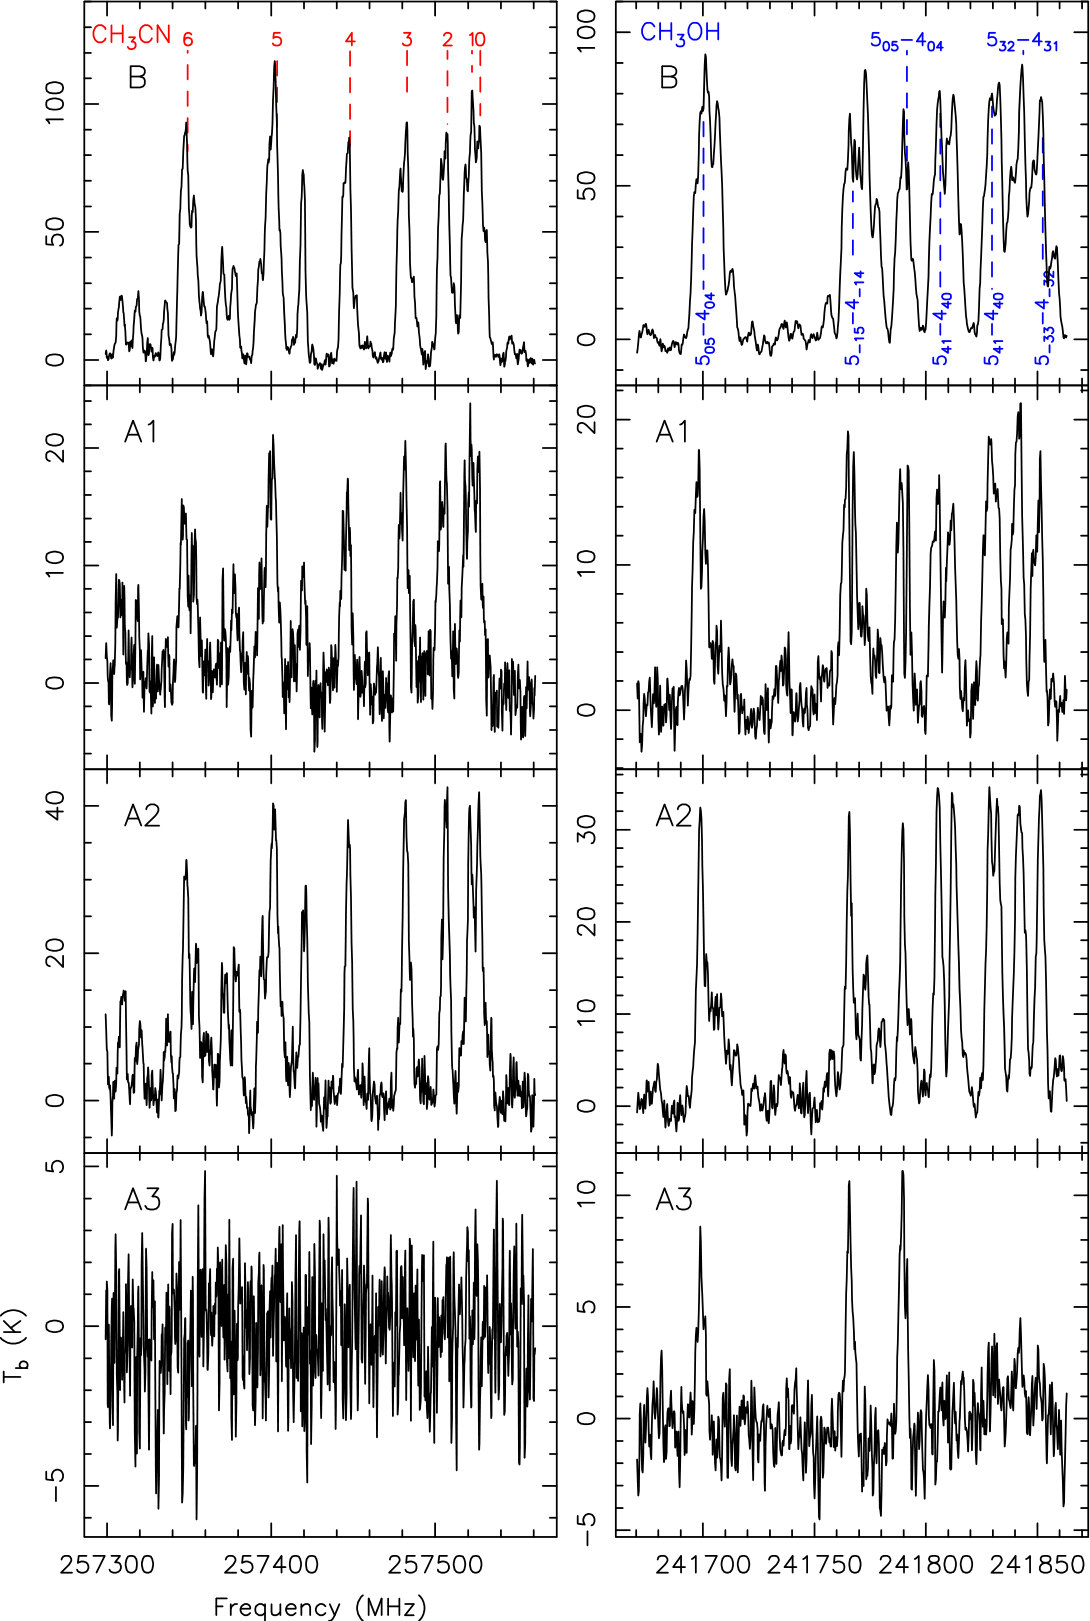 Figure 13
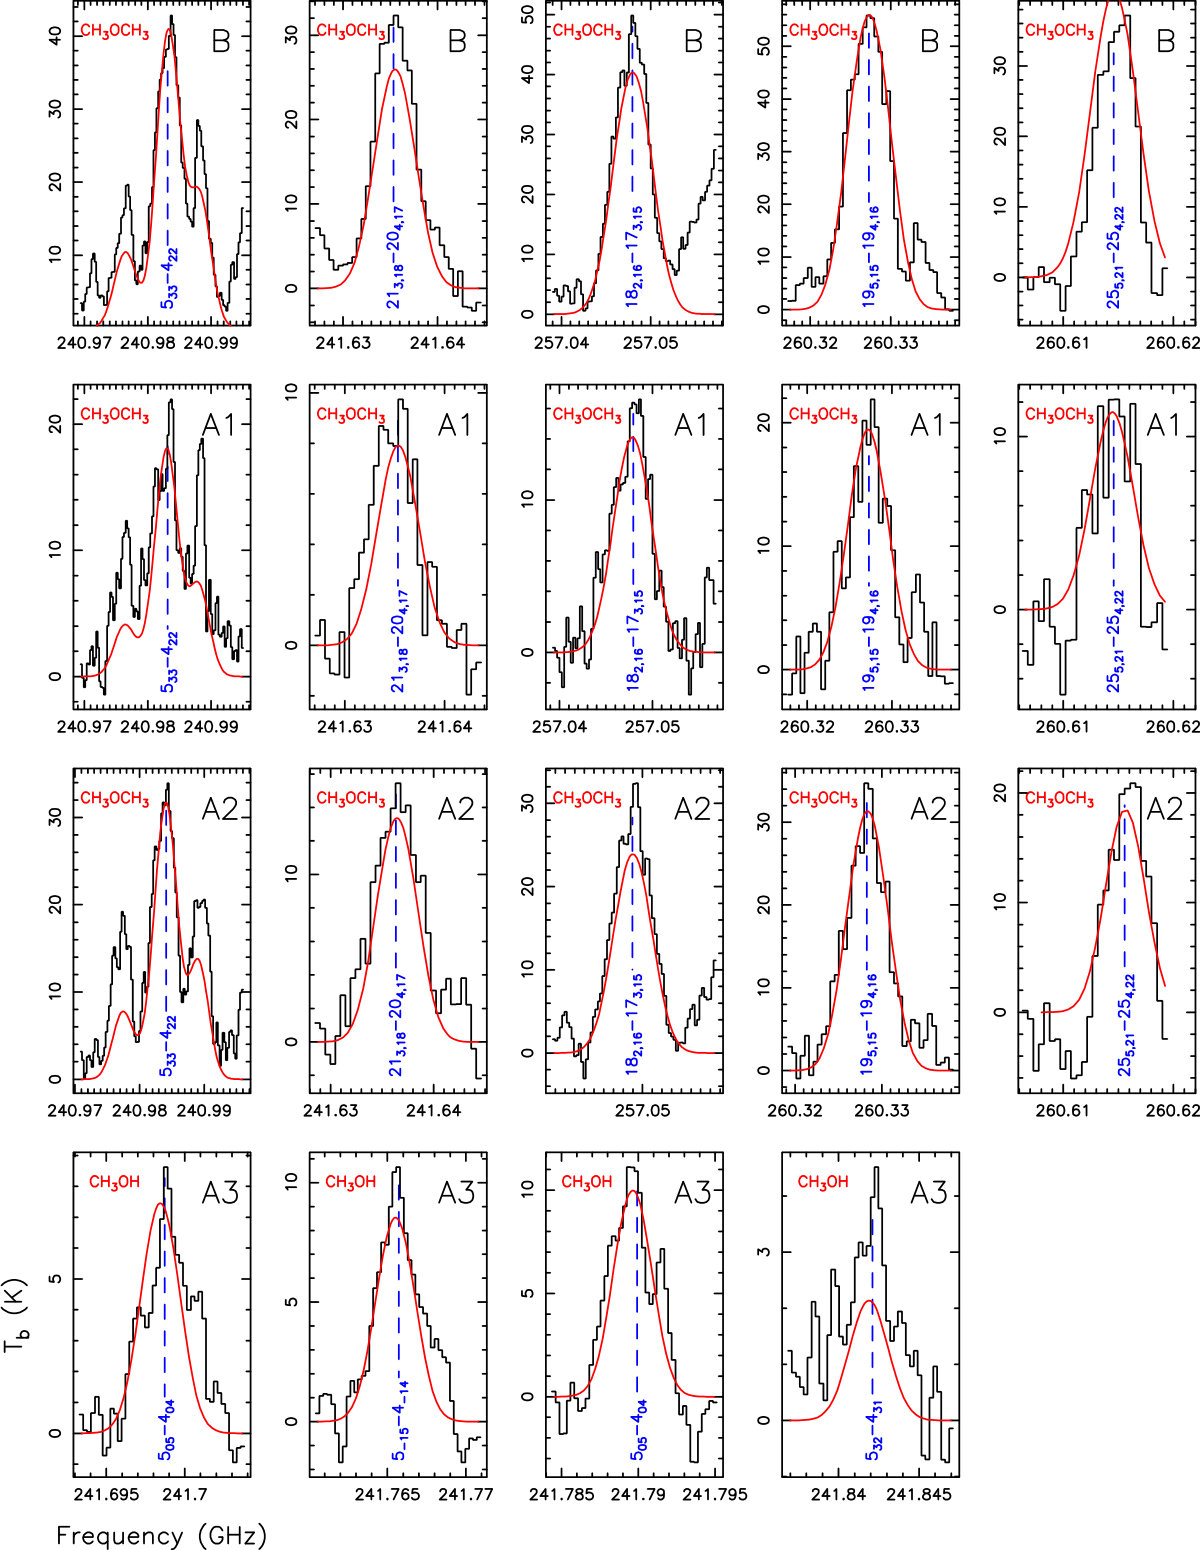 Figure 14
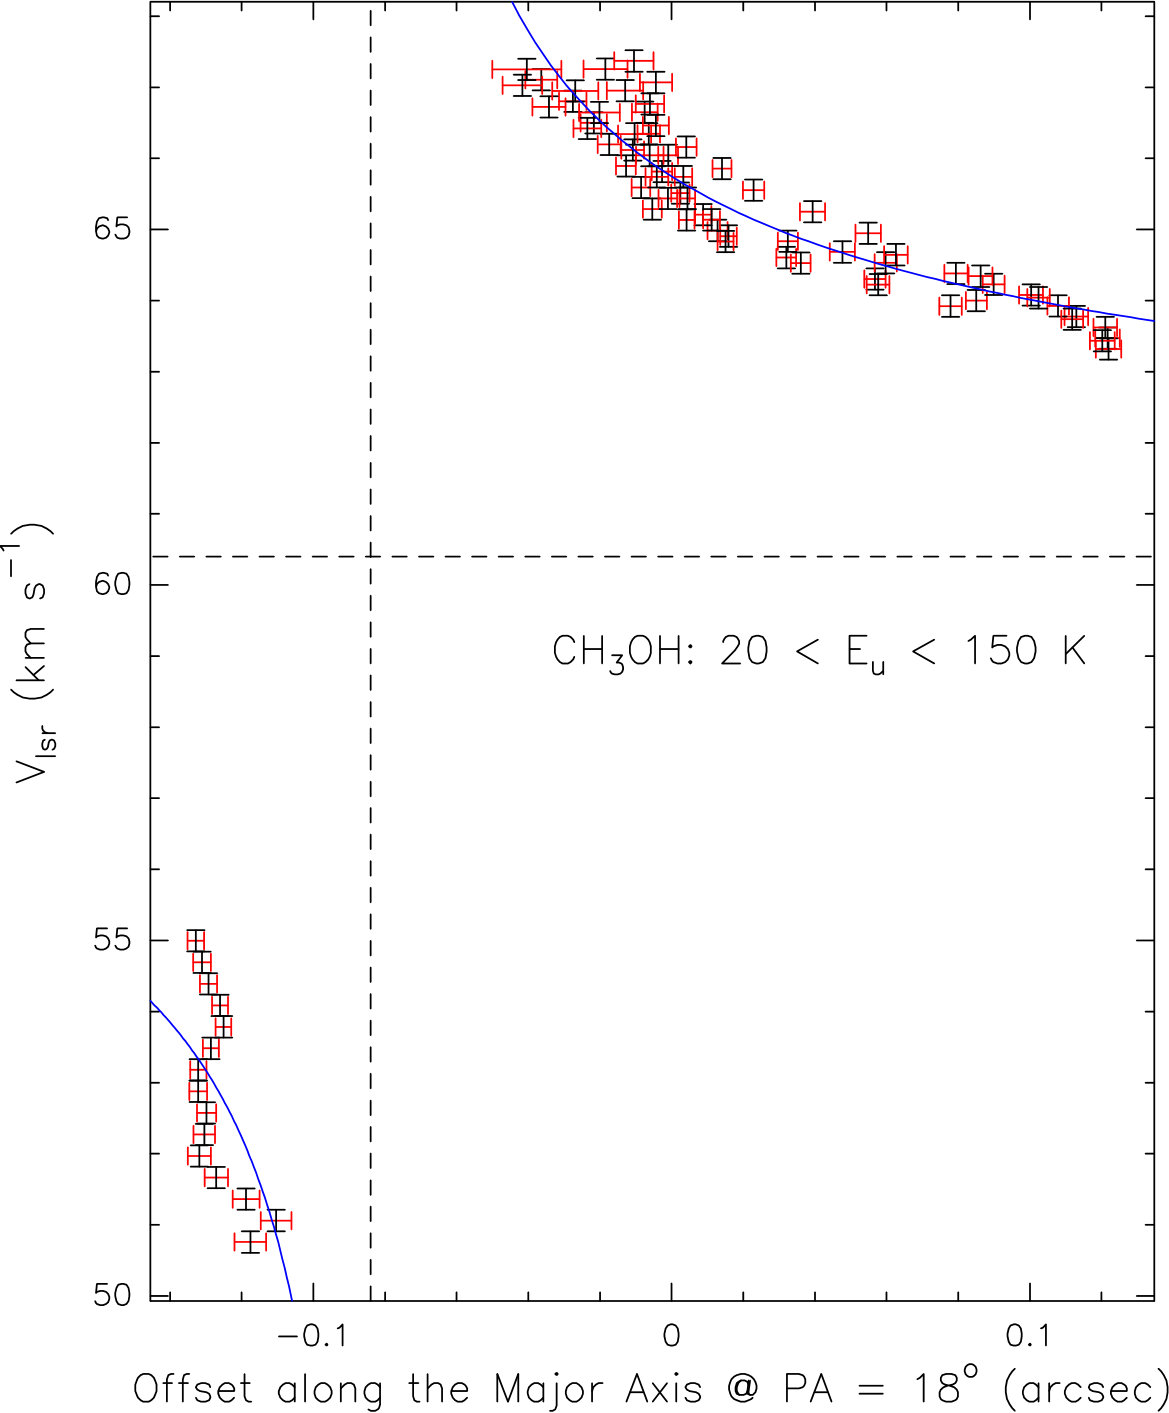 Figure 15
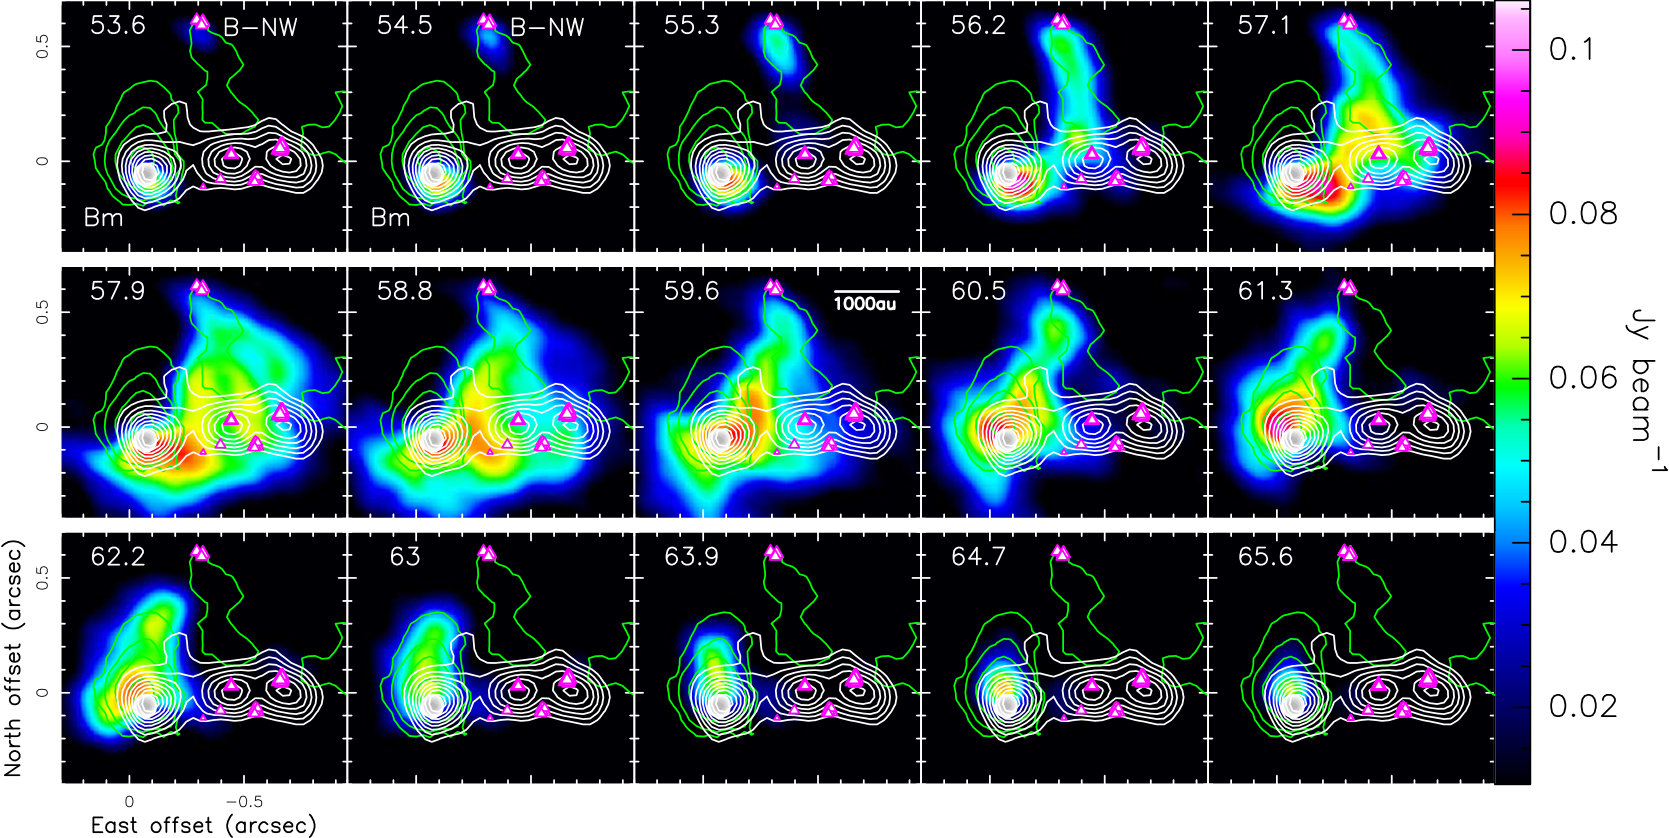 Figure 16
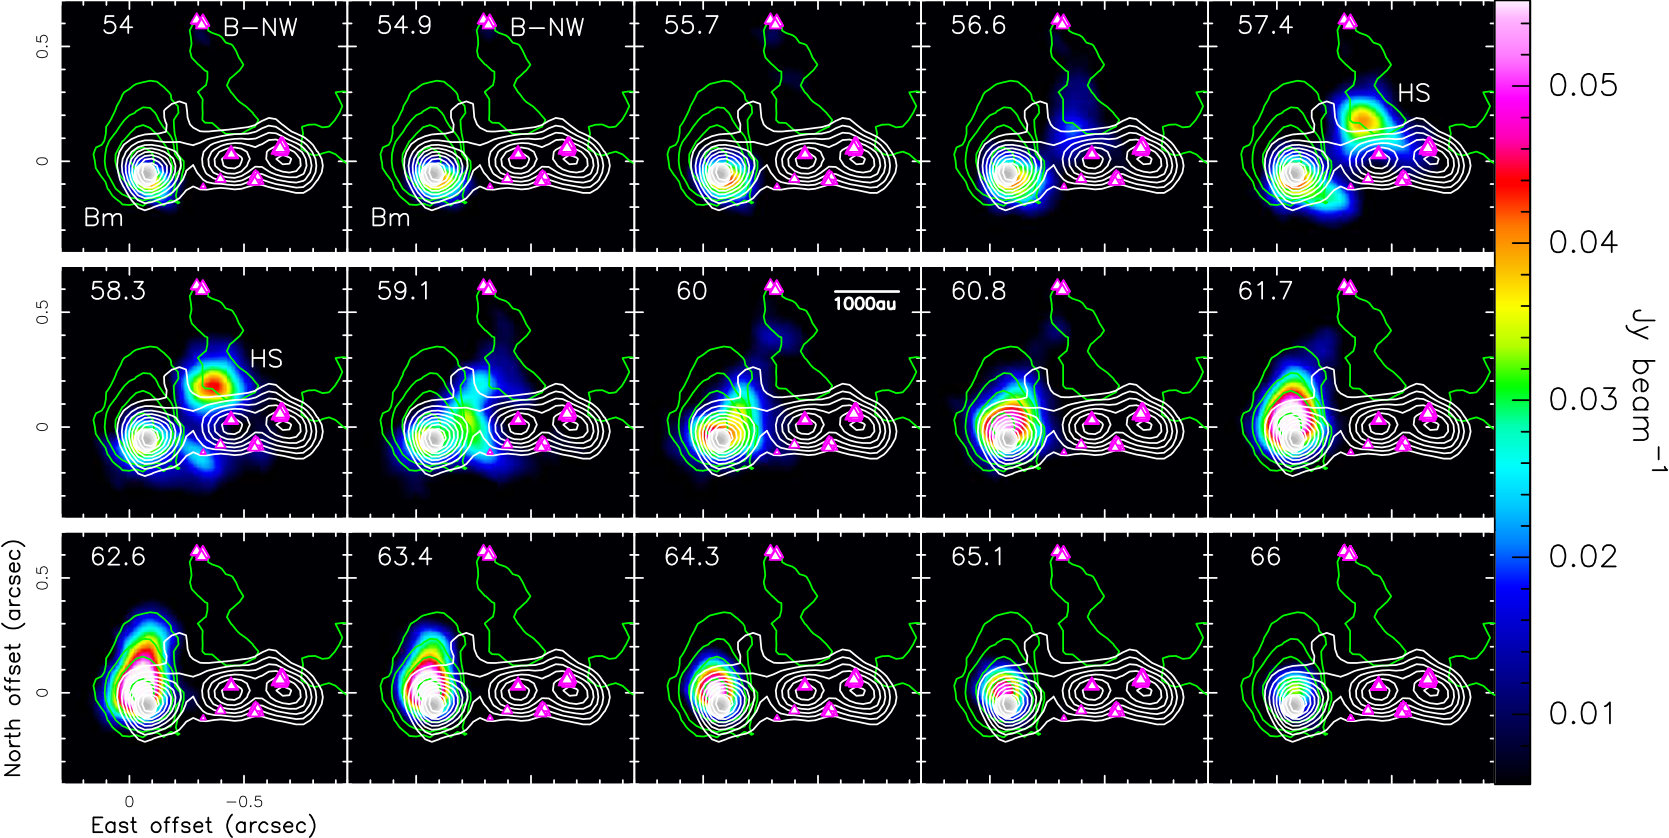 Figure 17
| SPW | Frequency range | Resolution | 1- noisea | Moleculeb |
|---|---|---|---|---|
| (GHz) | (km s-1) | mJy beam-1 | ||
| 0 | 240.748–242.748 | 19 | 0.08 | |
| 1 | 260.151–260.619 | 0.56 | 1.8 | SiO |
| 2 | 256.703–257.641 | 0.28 | 1.9 | CH3CN |
| 3 | 241.629–241.863 | 0.30 | 2.9 | CH3OH |
| 4 | 240.899–241.133 | 0.30 | 2.5 | C34S |
| 5 | 241.499–241.733 | 0.60 | 2.6 | SO2 |
| Mol. Species | Frequency | Resolved QNs | / |
| (MHz) | (K) | ||
| CH3OH | 241590.115 | 253,22–252,23 | 804 |
| 241700.219 | 50,5–40,4 | 48 | |
| 241767.224 | 5-1,5–4-1,4 | 40 | |
| 241791.431 | 50,5–40,4 | 35 | |
| 241806.508 | 54,1–44,0 | 115 | |
| 241829.646 | 54,1–44,0 | 131 | |
| 241843.608 | 53,2–43,1 | 83 | |
| 257402.190 | 183,16–182,17 | 447 | |
| 260381.560 | 203,18–202,19 | 537 | |
| CH3CN | 257127.035 | JK = 149–139 | 671 |
| 257210.877 | JK = 148–138 | 549 | |
| 257284.935 | JK = 147–137 | 442 | |
| 257349.179 | JK = 146–136 | 350 | |
| 257448.128 | JK = 144–134 | 207 | |
| 257482.791 | JK = 143–133 | 157 | |
| 257507.561 | JK = 142–132 | 121 | |
| C34S | 241016.089 | J = 5–4 | 28 |
| CH3OCH3 | 240978.322 | 53,3–42,2 | 26 |
| 240982.799 | 53,3–42,2 | 26 | |
| 240985.078 | 53,3–42,2 | 26 | |
| 240989.939 | 53,3–42,2 | 26 | |
| 241523.829 | 53,2–42,3 | 26 | |
| 241528.306 | 53,2–42,3 | 26 | |
| 241528.692 | 53,2–42,3 | 26 | |
| 241530.972 | 53,2–42,3 | 26 | |
| 241635.940 | 213,18–204,17 | 226 | |
| 241637.327 | 213,18–204,17 | 226 | |
| 241638.713 | 213,18–204,17 | 226 | |
| 241638.717 | 213,18–204,17 | 226 | |
| 257048.633 | 182,16–173,15 | 164 | |
| 257049.945 | 182,16–173,15 | 164 | |
| 257051.256 | 182,16–173,15 | 164 | |
| 257051.258 | 182,16–173,15 | 164 | |
| 260327.165 | 195,15–194,16 | 208 | |
| 260327.238 | 195,15–194,16 | 208 | |
| 260329.312 | 195,15–194,16 | 208 | |
| 260331.422 | 195,15–194,16 | 208 | |
| 260400.617 | 165,11–164,12 | 159 | |
| 260401.254 | 165,11–164,12 | 159 | |
| 260403.392 | 165,11–164,12 | 159 | |
| 260405.845 | 165,11–164,12 | 159 | |
| 260615.883 | 255,21–254,22 | 332 | |
| 260615.883 | 255,21–254,22 | 332 | |
| 260616.584 | 255,21–254,22 | 332 | |
| 260617.285 | 255,21–254,22 | 332 |
| mm source | Flux | (Ncol) | Tex | FWHM | Mass | |
|---|---|---|---|---|---|---|
| (mJy) | (cm-2) | (K) | (km s-1) | (km s-1) | () | |
| B | 706 | 17.816.6 | 13111 | 62.30.2 | 5.10.5 | 1.80.3 |
| A1 | 16418 | 17.216.4 | 11118 | 62.40.5 | 41 | 5.11.5 |
| A2 | 444 | 17.616.6 | 10616 | 61.10.4 | 4.60.9 | 1.40.4 |
| A3 | 415 | 15.615.1 | 427 | 62.10.5 | 3.40.9 | 4.01.3 |
Peer Reviews
No public reviews on file for this paper yet. If you reviewed it on a platform where reviews are public (OpenReview, ICLR, NeurIPS, ICML), you can paste yours below so the community can read it here.
Videos
No videos yet. Explain this paper in a talk, walkthrough, or lecture? Add one.
11institutetext: INAF-Osservatorio Astrofisico di Arcetri, Largo E. Fermi 5, 50125 Firenze, Italy
11email: [email protected] 22institutetext: Max Planck Institut für Radioastronomie, Auf dem Hügel 69, 53121, Bonn, Germany 33institutetext: Leiden Observatory, Leiden University, PO Box 9513, 2300 RA Leiden, The Netherlands 44institutetext: Department of Astrophysics/IMAPP, Radboud University, PO Box 9010, 6500 GL, Nijmegen, The Netherlands 55institutetext: INAF - Istituto di Radioastronomia & Italian ALMA Regional Centre, Via P. Gobetti 101, 40129, Bologna, Italy
A 10- YSO with a Keplerian disk and a nonthermal radio jet
L. Moscadelli 11
A. Sanna 22
R. Cesaroni 11
V. M. Rivilla 11
C. Goddi 3344
K. L. J. Rygl 55
Abstract
*Context. *To constrain present star formation models, we need to simultaneously establish the dynamical and physical properties of disks and jets around young stars.
*Aims. *We previously observed the star-forming region G16.590.05 through interferometric observations of both thermal and maser lines, and identified a high-mass young stellar object (YSO) which is surrounded by an accretion disk and drives a nonthermal radio jet. Our goals are to establish the physical conditions of the environment hosting the high-mass YSO and to study the kinematics of the surrounding gas in detail.
*Methods. *We performed high-angular-resolution (beam FWHM 015) 1.2-mm continuum and line observations towards G16.590.05 with the Atacama Large Millimeter Array (ALMA).
*Results. *The main dust clump, with size 104 au, is resolved into four distinct, relatively compact (diameter 2000 au) millimeter (mm) sources. The source harboring the high-mass YSO is the most prominent in molecular emission. By fitting the emission profiles of several unblended and optically thin transitions of CH3OCH3 and CH3OH, we derived gas temperatures inside the mm sources in the range 42–131 K, and calculated masses of 1–5 . A well-defined Local Standard of Rest (LSR) velocity () gradient is detected in most of the high-density molecular tracers at the position of the high-mass YSO, pinpointed by compact 22-GHz free-free emission. This gradient is oriented along a direction forming a large (70°) angle with the radio jet, traced by elongated 13-GHz continuum emission. The butterfly-like shapes of the P-V plots and the linear pattern of the emission peaks of the molecular lines at high velocity confirm that this gradient is due to rotation of the gas in the disk surrounding the high-mass YSO. The disk radius is 500 au, and the distribution along the major axis of the disk is well reproduced by a Keplerian profile around a central mass of 102 . The position of the YSO is offset by 01 from the axis of the radio jet and the dust emission peak. To explain this displacement we argue that the high-mass YSO could have moved from the center of the parental mm source owing to dynamical interaction with one or more companions.
Key Words.:
**ISM: jets and outflows – ISM: molecules – Masers – Radio continuum: ISM – Techniques: interferometric **
1 Introduction
The formation of stars in the mass interval 1-20 involves accretion disks and fast collimated outflows or jets. Atacama Large Millimeter Array (ALMA) observations at very high angular resolution (01) have recently provided clear examples of disk-jet systems around young stellar objects (YSO) with luminosities from low-mass to late O-type zero-age-main-sequence (ZAMS) stars (Lee et al., 2017; Ginsburg et al., 2018; Sanna et al., 2018a). From a theoretical point of view, the role played by turbulence, magnetic field, gravitational instability and radiation feedback in defining the properties of the system (disk size and velocity profile; jet orientation and collimation) is still highly debated (Matsumoto et al., 2017; Tan et al., 2014; Kuiper & Hosokawa, 2018). Detailed studies of disk-jet systems are therefore essential to constrain current star-formation models.
Since all star-formation models state that accretion and ejection are intimately related, studying the properties of the outflows from YSOs, which are much more extended and easier to observe than the small accretion disks, can be an effective way of probing the disk-jet systems. Observations reveal different characteristics for solar-type and B-type YSOs: 1) the molecular outflows tend to be less collimated with increasing YSO mass (Beuther & Shepherd, 2005), and 2) only a few radio jets are known in B-type YSOs, whereas they are commonly observed towards low-mass protostars (Moscadelli et al., 2016; Sanna et al., 2018b). If the larger distances and the more rapid evolution of B-type YSOs could in part explain these differences, we know that additional processes are at work in the formation of the most massive stars. In comparison with low-mass protostars, the formation of B-type YSOs involves more energetic stellar radiation, which can ionize the surrounding gas and exert radiation pressure on it. The combined action of the magnetic field, the thermal pressure of the ionized gas, and the radiation pressure has been modeled by several authors (see, e.g., Peters et al., 2011; Vaidya et al., 2011), and results in a lower collimation of the outflow. Another notable difference is that more massive B-type stars form in richer clusters (Carpenter et al., 1997; Hillenbrand & Hartmann, 1998), and dynamical and radiative interactions among cluster members can significantly affect the properties of the disk-jet systems, causing disk fragmentation, jet precession, or even disruption of the system (see, e.g., Farias & Tan, 2018).
In this paper we report on recent ALMA observations of the star-forming region (SFR) G16.590.05, also known as IRAS 181821433. This region has been the target of several millimeter (mm) and centimeter (cm) interferometric (Submillimeter Array, Owens Valley Radio Observatory, Plateau de Bure Interferometer, Very Large Array (VLA)) and Very Long Baseline Interferometry (VLBI) observations (Beuther et al., 2006; Zapata et al., 2006; Furuya et al., 2008; Sanna et al., 2010; Moscadelli et al., 2013). The bolometric luminosity of the region is 104 (Moscadelli et al., 2013) at a distance of 3.60.3 kpc, as determined via maser trigonometric parallax observations (Sato et al., 2014). Inside a molecular clump of size 0.5 pc and mass 1900 (Beuther et al., 2002), the VLA C-Array observations at 3.6, 1.3, and 0.7 cm by Zapata et al. (2006) identified two compact cm sources, named “a” and “b”, separated by 2″ along the SE–NW direction. From previous mm interferometric observations we know that, while source “a” coincides with the peak of the dust emission, indicating that this source is the most embedded, source “b” is found in good positional correspondence with intense, high-density molecular tracers, marking a hot molecular core (HMC).
European VLBI Network (EVN) observations of the 6.7-GHz methanol masers demonstrate that this maser emission is associated with the HMC and traces an elongated structure of 2000 au, with the three-dimensional (3D) maser velocity pattern suggesting rotation (Sanna et al., 2010, see their Fig. 7) about a central mass of 12 (Moscadelli et al., 2013). The sensitive Jansky Very Large Array (JVLA) A-Array observations at 5, 2.3, and 1.3 cm by Moscadelli et al. (2013, see their Fig. 1) resolve the compact cm source “b” into a radio jet, elongated 3″ along the E–W direction. The spectral index of the jet is negative, indicating nonthermal emission over most of the jet, except the peak close to the maser disk, where thermal free-free emission is observed (Moscadelli et al., 2013, see their Fig. 2). Water masers, monitored with the Very Long Baseline Array (VLBA) by Sanna et al. (2010), are distributed close to the HMC, and appear to trace a wide, fast bow-shock at the head of the western lobe of the radio jet.
The combination of a rotating disk, as suggested by the 6.7-GHz maser proper motions, and a nonthermal radio jet, one of the few observed in high-mass SFRs (see, e.g., Rodríguez-Kamenetzky et al., 2017), makes G16.590.05 a promising target to constrain the formation mechanism of B-type stars. For this reason, we conducted new ALMA observations towards G16.590.05, as described in Sect. 2. In Sect. 3, we report our observational results presenting a general view of the physical conditions and kinematics of the gas at the center of the mm clump. Section 4 derives the properties of the disk and the YSO, and Sect. 5 provides a more general discussion of the geometrical and physical relations among the YSO, the disk, and the jet. Finally, our conclusions are presented in Sect. 6.
2 ALMA observations
ALMA observed G16.590.05 during Cycle 3 in September 2016. Fourty-seven 12-m antennae were used in an extended configuration with baselines ranging from 15 to 3300 m. The observing time on the target source was about 1.8 h. The bandpass calibrator was the strong quasar J19242914, and the phases were calibrated from interleaved observations (every 8-9 min) of the quasar J18322039, separated from the target on the sky by 7°. To check the astrometric accuracy, ALMA also observed the quasar J1830-1606, separated from the target by 3°. We have verified that the peak emission of the phase-calibrated image of J1830-1606 differs from the nominal position by less than 10 mas, which provides an estimate of the astrometric uncertainty of our ALMA images.
The correlator frequency setup consisted of six spectral windows (SPWs), one broad 2-GHz spectral unit to obtain a sensitive continuum measurement at 242 GHz, and five narrower SPWs to cover a large number of lines, in particular the CH3CN (J = 14-13), CH3OH, and SiO rotational transitions. For each SPW, Table 1 reports the frequency coverage, spectral resolution, and sensitivity, and also indicates the most prominent molecular species.
Data calibration was performed using the pipeline for ALMA data analysis in the Common Astronomy Software Applications (CASA, McMullin et al., 2007) package, version 4.7. For each SPW, looking at the plots of (baseline-averaged) -amplitude versus channels, we selected the most intense emission line (always 10 times stronger than the continuum level of the -amplitude spectra), self-calibrated its channel-averaged emission, and, before imaging, applied the self-calibration phase solutions to all the channels of the SPW. Self-calibration improves the signal to noise ratio (S/N) of the final images of the SPWs by a factor of 1.1–1.5, with the larger gain factors obtained in correspondence with the stronger self-calibrated lines. The dynamical range of the line images varies in the range 20–50, depending on the considered SPW. The images for the continuum and line emissions were produced manually using the CLEAN task, with the robust parameter of Briggs (1995) set to 0.5, as a compromise between resolution and sensitivity to extended emission. The clean beam FWHM of the resulting images varies in the range 013–017. The mm continuum image of G16.590.05 has a 1 rms noise level of 0.08 mJy beam*-1*, limited by the dynamic range. The 1 rms noise in a single spectral channel varies in the interval 1–3 mJy beam*-1*, depending on the considered SPW/channel.
We have employed a specific procedure to determine the continuum level of the spectra and subtract it from the line emission. Since all the observed SPWs present a “line forest”, identifying the channels where no line emission is present is a very difficult task. For each SPW, we use STATCONT111http://www.astro.uni-koeln.de./~sanchez/statcont (Sanchez-Monge et al., 2017), a statistical method to estimate the continuum level at each position of the map from the spectral distribution of the intensity at that position.
3 Results
This section presents the main results of our ALMA observations, first reporting on the physical properties of the parental core and then focusing on the kinematics of the embedded high-mass YSO, the main target of our study.
3.1 G16.590.05 B: the prominent molecular source in a cluster
The ALMA 1.2-mm continuum map presented in Fig. 1 reveals four main sources, distributed from SE to NW over a region of 104 au. The source B corresponds to the HMC identified in previous interferometric observations at 3 and 1 mm (Furuya et al., 2008; Beuther et al., 2006), named source “b” in Moscadelli et al. (2013). The compact “mm core” from previous, lower-angular-resolution, interferometric observations, named source “a” in Moscadelli et al. (2013), is now resolved into three distinct sources, labeled A1, A2, and A3, separated by 2000–3000 au. Considering emission down to 10% of the peak, the sources B, A2, and A3 are relatively compact with size 05, while A1 has a significantly flatter spatial distribution extending up to 15.
Figure 2 shows the spectra of the CH3CN and CH3OH lines prominent in our ALMA frequency setup, extracted at the position of the 1.2-mm peak for each of the four continuum sources. In agreement with previous findings, the molecular emission is significantly stronger towards B (by a factor of 2.5–5). While in sources A1 and A2 the intensity of the CH3CN and CH3OH lines is comparable, in A3 only weak CH3OH emission is detected. Table 2 lists all the molecular lines analyzed in this paper. The intense lines of CH3CN and CH3OH are mostly employed to trace the gas kinematics inside B. While the optical depth of these lines close to the peak approaches 1 in some cases, the line wings are always optically thin and allow us to map the gas kinematics around the high-mass YSO in B with good S/N. Using the SLIM (Spectral Line Identification and Modeling) tool of MADCUBA444Madrid Data Cube Analysis on Image (MADCUBA) is a software developed in the Center of Astrobiology (Madrid, INTA-CSIC) to visualize and analyze astronomical (single) spectra and data cubes (Martín et al, in prep.; Rivilla et al. 2016); website: http://cab.inta-csic.es/madcuba/Portada.html., we surveyed the spectra of the four mm sources to search for molecular species with a relatively large number of unblended and optically thin lines suitable for deriving the gas physical conditions. We selected the transitions of the CH3OCH3 and CH3OH555CH3OH transitions are used to derive the physical conditions in A3 only, since in this source the emission of CH3OCH3 is not detected. molecules reported in boldface characters in Table 2, which have optical depths of less (or much less) than 0.5, and cover a sufficiently wide range in excitation energy to guarantee a good estimate of the excitation temperature. To derive the physical parameters we used the tool AUTOFIT of MADCUBA, which compares the observed spectra with the LTE synthetic spectra, taking into account all transitions and the line opacities. Leaving four parameters free to vary, that is, column density (), excitation temperature (), Local Standard of Rest (LSR) velocity (), and line width (FWHM), AUTOFIT provides the best nonlinear least-squared fit using the Levenberg-Marquardt algorithm. Figure 3 shows that the emission profiles of the unblended CH3OCH3 and CH3OH transitions are reasonably well fitted with MADCUBA, determining the values of column density, temperature, velocity and line width listed in Table 3. The masses in molecular gas of the mm sources are derived from the mm fluxes (integrating inside the contours at 10% of the peak marked in Fig. 1) and the fitted gas temperatures, assuming a dust opacity of 1 cm2 g*-1* at 1.4 mm (Ossenkopf & Henning, 1994) and a gas-to-dust mass ratio of 100. We used the mm continuum peak flux and the fitted gas temperature to estimate the optical depth of the dust emission inside the mm sources, ranging from 0.25 for source B to 0.45 for source A3. For each mm source, the mass value reported in Table 3 was corrected using the corresponding dust opacity. The flux error is evaluated by considering the contributions of the rms noise of the dust continuum map close to the intense sources, 0.4 mJy beam*-1*, and the ALMA flux calibration uncertainty of 5%, as recently estimated from the analysis of calibrators in bands 3 and 6 by Bonato et al. (2018, see also references therein). The uncertainty in the mass of the mm sources is derived by taking into account both the flux and gas temperature uncertainties.
3.2 The massive YSO Bm
We now focus on the gas kinematics around the massive YSO inside the mm source B. In the following we refer to this YSO as Bm. This is probably the most massive object in source B. A well-defined, SW-NE gradient is detected at the position of Bm in all the observed high-density gas tracers. Figures 4, 5, and 6 present results from low-Eu lines of CH3OH, CH3CN, and C34S, respectively. We note that the JVLA 22-GHz continuum, pinpointing the YSO, falls exactly between the SW blue-shifted and the NE red-shifted line emission, and that the direction of the gradient forms a large (70°) angle with the radio jet traced by the extended JVLA 13-GHz continuum. These findings suggest that the gradient could be due to rotation of the gas in an envelope and/or disk surrounding the YSO.
The P-V plots produced along the axis (at PA = 18°) of the gradient confirm that we are observing envelope–disk rotation. The plots have a butterfly-like shape (mostly clear in Fig. 6 for the C34S line), with well-defined spurs at high absolute velocities and small offsets in the second and fourth quadrants. These spurs correspond to gas whose line-of-sight velocity increases with decreasing radius and could be consistent with Keplerian rotation. In Sect. 4, we fit the velocity profile and estimate the disk radius and mass, and the YSO mass. Here, we constrain the YSO and position by inspecting the P-V plots. The positional offset (along the axis at PA = 18°) of the YSO is delimited by the offsets of the high-velocity spurs in the second and fourth quadrants of the P-V plots, falling inside the interval 0″–015 (see Fig. 6). The spurs at low (line of sight) velocities and large offsets are less clear, because they are contaminated by emission of the ambient gas at the systemic velocity. We make use of the P-V plot of the C34S line (see Fig. 6) to confidently set a range of values for the YSO within 60–61 km s*-1*. These constraints for the YSO position and the are used in the following analysis.
Looking at Figs. 4, 5, and 6 (left panels), in all the three molecular tracers the blue-shifted emission extends over an area significantly smaller than that of the red-shifted emission. Moreover, while the red-shifted emission is distributed approximately symmetrically about the major axis of the envelope–disk, the barycenter of the blue-shifted gas is offset to W. These asymmetries in the velocity distribution of the gas around Bm are further discussed in Sects. 5.1 and 5.2.
3.3 The surroundings of Bm
We now consider a larger region encompassing the jet emerging from Bm. Figures 7 and 8 show the channel maps of two intense CH3CN lines with quite different excitations, the JK = 142–132 with = 121 K and the JK = 147–137 with = 442 K. These two lines are representative of the velocity distribution of the large majority of the low- and high-excitation molecular transitions detected towards Bm. At high velocities (channels with 56 km s*-1* or 63 km s*-1*) both low- and high-excitation molecular lines trace the compact disk close to the high-mass YSO. At V_{\rm LSR}$$\approx55 km s*-1*, a compact source is detected only in low-excitation lines at 06 towards N-NW of the mm peak of source B, in proximity to the weak continuum emission and the cluster of water masers located at the largest distance from the radio jet. In the following, we refer to this compact source as B-NW. At central velocities (56 km s*-1* V_{\rm LSR}$$\leq 63 km s*-1*), low-excitation lines show extended emission emerging from (only) the western side of the jet at blue-shifted velocity, and from an arc-like/linear bridge at blue-/red-shifted velocities connecting the massive YSO Bm with the compact source B-NW. High-excitation lines have a quasi-compact structure also at central velocities, with some notable features: 1) at V_{\rm LSR}$$\approx59 km s*-1*, a slightly resolved funnel-like structure is traced on top of the western lobe of the jet near Bm, and 2) at V_{\rm LSR}$$\approx57-58 km s*-1*, an emission spot is observed adjacent to the radio jet towards N. This latter feature is referred to as HS in the following.
The radio jet from Bm is one of the few known cases of nonthermal jets from high-mass YSOs. In particular, the eastern lobe of the radio jet is well detected with the JVLA at 6 GHz, and is very weak and/or undetected at frequencies 10 GHz (Moscadelli et al., 2013, see their Figs. 1 and 2). Our ALMA observations confirm the presence of a strong asymmetry between the eastern and western lobes of the jet, with the western lobe being much more intense in both continuum and molecular lines. Considering also the distribution of the dust emission (see Fig. 1), predominant towards W-NW of Bm, the simplest explanation for all these facts is an E-W density gradient at the position of Bm. Integrating the ALMA 1.2-mm continuum inside the area of each jet lobe, we estimate that the average gas density in the western lobe is about one order of magnitude larger than in the eastern lobe.
4 The Keplerian disk around the high-mass YSO Bm
In this section, we derive the properties of the YSO Bm and its disk. The angular resolution of the P-V plots shown in Figs. 4, 5, and 6 varies in the range 013–017, reflecting the FWHM of the observing beam at the frequency of the molecular line employed to produce the P-V plot. The emission at high blue- (56 km s*-1*) and red-shifted (63 km s*-1*) velocities is approximatively compact (see Figs. 7 and 8), which allows us to fit a 2D Gaussian profile and determine the peak position at each velocity channel. The positional accuracy is equal to (see, e.g., Reid et al., 1988), where and are the peak intensity and the rms noise, respectively, of a given channel. With typical values of the ratio , the error on the position of the fitted channel peaks is as small as a few mas. For channels where the emission is sufficiently compact, this method increases the (relative) positional accuracy by a large factor, while retaining the essential information of the P-V plots.
In Fig. 9 we show that the spatial distribution of the high-velocity emission of CH3OH and CH3CN is elongated along the same PA = 183°, which we take as the direction of the major axis of the molecular disk around the high-mass YSO Bm. As already noted in Sect. 3.2 for the SW-NE gradient, the red-shifted side of the disk is significantly longer than the blue-shifted side. Along the red-shifted side, 015 or 500 au in extent, the gas increases monotonically approaching the YSO, ranging from 62 km s*-1* up to 69 km s*-1*. On the contrary, the blue-shifted side of the disk is traced only at the lowest velocities, 50–55 km s*-1*; the mildly blue-shifted channels, in the range 55–60 km s*-1*, show more extended structure, which tends to be elongated to the W of Bm along the radio jet (see Fig. 7).
Comparing the two molecular tracers in Fig. 9, the red-shifted side of the disk appears to be better traced by the CH3OH lines, whose spatial distribution is flatter and more extended than that of the CH3CN lines. Table 2 shows that the upper energy level (Eu) of the CH3OH transitions is on average lower than that of the CH3CN lines. Since the gas temperature in the central layers of the disk is expected to be relatively low, it is reasonable that the CH3OH transitions are found to be better tracers of the disk midplane. Accordingly, examining the different CH3OH transitions (see Table 2), we find that the ones with Eu 150 K present a significantly flatter and more elongated spatial distribution. Considering only the CH3OH transitions with 20 Eu 150 K, Fig. 10 plots versus positions projected along the disk major-axis. While the radial profile of the red-shifted velocities is well reproduced with a Keplerian curve (as described below), the blue-shifted emission concentrates within a small offset range (004) and cannot be adequately fitted. However, the average position and of the blue-shifted emission is useful to constrain the position and the of the YSO.
The free parameters of the Keplerian fit are the YSO’s positional offset, , LSR velocity, , and mass, . Indicating with the inclination of the disk rotation axis with the line of sight, the formulation of the latter parameter takes into account that the disk plane is actually seen at an angle from the line of sight, and the fitted correspond to the actual rotation velocities multiplied by the factor . We have minimized the following expression:
[TABLE]
where and are the channel (in km s*-1*) and corresponding peak positions (in arcsecond), the index runs over all the fitted channels, and the and symbols hold for red- and blue-shifted velocities, respectively. The YSO mass is given in . In order to take into account both the uncertainty on the velocity and that on the position, the global velocity error was obtained by summing in quadrature two errors: that on the velocity (taken equal to half of the channel width) and that obtained by converting the error on the offset into a velocity error through the function fitted to the data. In Sect. 3.2, based on the symmetrical patterns of the P-V plots, we constrained the ranges for the YSO positional offset and to: , 60.0 km s*-1* 61.0 km s*-1*. The mass of the YSO is searched over the range 5–15 , consistent with the estimated bolometric luminosity of 104 . Figure 11 reports the plots of the distribution of the as a function of the free parameters. The white contour in these two plots draws the 1- confidence level for the three free parameters, following Lampton et al. (1976). These plots show that we do find an absolute minimum of the , and the determined 1- intervals for the parameter values are: , km s*-1*, and .
Following the analysis by Moscadelli et al. (2013, see in particular their Fig. 5), source B, the HMC, dominates the IR emission of the region, suggesting that our estimate of 104 for the bolometric luminosity of B is reasonable and not too high. This luminosity corresponds to a single ZAMS star of 13 (see Davies et al., 2011), which is an upper limit for the mass of Bm. Comparing this upper limit with the YSO mass from the Keplerian fit, the value of the disk inclination angle is constrained within the interval , that is, the plane of the disk is within 30° of the line of sight. However, if a sizeable fraction of the bolometric luminosity is due to gravitational energy released in the accretion process rather than nuclear burning, the mass of Bm could be less than 13 , and the disk would be almost edge-on. Inside the disk radius of 015, the 1.2-mm continuum flux is 42 mJy, corresponding to 1 (making the same assumptions as in Sect. 3.1). Since this value is much less than the YSO mass 10 , our choice of fitting a Keplerian velocity profile appears to be well justified a posteriori.
Figure 12 (lower panel) compares the kinematics of the disk, traced with thermal CH3OH, with that of the 6.7-GHz CH3OH masers observed with VLBI by Sanna et al. (2010). The 6.7-GHz masers trace a slightly elongated structure oriented along a PA ( 40°) quite different from that (18°) of the YSO disk. The maser bipolar distribution (red-(blue-)shifted to NW(SE)) and the proper motion pattern were interpreted by Sanna et al. (2010) in terms of rotation, and the 6.7-GHz masers were the first indication of the existence of a rotating disk around Bm. However, the new ALMA data indicate now that the 6.7-GHz masers are not tracing the disk midplane, as originally assumed. While the positions and of the NW red-shifted 6.7-GHz cluster are in reasonable agreement with the red-shifted side of the YSO disk, the SE blue-shifted cluster is placed 01–02 SE of the disk midplane. Looking at Fig. 12, the two groups of maser features with measured proper motions are projected on the sky close to the disk rotation axis (i.e., perpendicular to the disk major axis crossing Bm, at the peak of the compact 22-GHz continuum) and the proper motions are mainly directed perpendicular to this axis. These findings still suggest that the 6.7-GHz masers are mainly tracing rotation about Bm, although they may be partly offset from the disk midplane.
5 The YSO, the disk, and the jet
In this section, we discuss in more detail the interactions among the YSO, the disk, and the jet.
5.1 Jet structure and orientation
Looking at Fig. 9, one can note that, near Bm, the slightly resolved 13-GHz continuum is elongated to NW along a direction roughly perpendicular to the disk. As shown in Figs. 7 and 8, the axis of the funnel-like structure on top of the radio jet traced by the CH3CN emission at V_{\rm LSR}$$\approx59 km s*-1* also has a similar NW orientation. This structure can be interpreted in terms of the jet cavity, and together with the shape of the 13-GHz emission near Bm, could mark the direction of ejection of the jet close to the YSO. At larger separation from the YSO, the 13-GHz continuum seems to bend and approach the E-W direction, which could suggest that precession or recollimation is taking place.
The nonthermal continuum emission in the two lobes of the radio jet, shown in the upper panel of Fig. 12, emerges from shocks responsible for the acceleration of the electrons to relativistic velocities. These shocks originate near Bm where the jet impinges on high-density material and propagate away along the jet direction at a speed, assuming momentum conservation, of = , where and are the jet density and ejection velocity, respectively, and is the ambient density (see, e.g., Masson & Chernin, 1993). Looking at the upper panel of Fig. 12, one can note that the western lobe is significantly closer to Bm, which could indicate that the nonthermal shock has moved more slowly towards W because of the higher ambient density, as already discussed in Sect. 3.3. From the JVLA 6-GHz map we derive that the eastern lobe is about three times more distant from Bm than the western lobe, which, assuming the jet is ejected symmetrically, agrees well with our previous estimate of a density contrast in the ambient gas by a factor of approximately ten between the western and eastern side. We denote with and the separations (projected onto the line connecting the lobes – see Fig. 12) between the position of Bm and the emission peaks of the western and eastern lobes, respectively, and with and the shock propagation velocities towards W and E, respectively. The time elapsed since the episode of ejection responsible for the present emission in the jet lobes is then = / = /. From the 6-GHz map we obtain 033 or 1200 au, and 6000/ yr, where is expressed in km s*-1*.
5.2 Proper motion and precession
Comparing the upper to the lower panel of Fig. 12, it is clear that the line connecting the 6-GHz lobes of the radio jet crosses source B near the 1.2-mm peak but is displaced from Bm (pinpointed by the 22-GHz emission) by 100 mas towards N. This offset is significantly larger than the expected positional error of a few tens of milliarcseconds between the 6- and 22-GHz JVLA images666We note that the same phase calibrator, J1832-1035, was used for both the 6- and 22-GHz JVLA observations, which guarantees a good relative astrometry between the images at the two frequencies. (Moscadelli et al., 2013, 2016). In Sect. 3.2 we noted the clear asymmetry between the NE red-shifted and SW blue-shifted sides of the YSO envelope–disk, with the NE side being much more extended than the SE one (see Figs. 4 and 12). We argue now that both the displacement of Bm from the jet axis and the disk asymmetry could result from the relative motion of Bm with respect to the disk. We assume that Bm has moved from its original position, at the disk center, towards S-SW, along the disk plane.
What is causing the motion of Bm? One possibility is that Bm is orbiting in a gravitationally bound, multiple stellar system. This would naturally explain its motion relative to the disk. In this case, the observed disk would rotate around the multiple system and mediate the accretion onto it. Recent observations of bound systems of low-mass YSOs surrounded by a disk show that the regular distribution in mass and velocity of the disk is truncated at an inner radius comparable to the separation among the most massive stellar members (Tobin et al., 2016; Artur de la Villarmois et al., 2018). At radii comparable to these stellar orbits, the disk fragments and gaps, rings, and spirals appear, like those observed in protoplanetary disks. Looking at Fig. 9, one can note that the disk around Bm presents a regular (Keplerian) velocity pattern until reaching the position of the YSO, marked by the compact 22-GHz continuum. The mass responsible for the observed velocity pattern appears to be confined inside a radius 200 au from Bm, which implies that other (putative) YSOs embedded in the parental mm source B are not dynamically relevant for the disk or the motion of Bm.
An alternative explanation for the motion of Bm is that the YSO has been ejected from its original position at the disk center by dynamical interaction with one or more companions. The YSO moved through the disk plane until it reached the current position, traced by the 22-GHz continuum. The distribution of the gas in the disk remained essentially unaffected by the movement of the YSO. The fact that we see Keplerian rotation around Bm implies that the material of the disk has been rotating fast enough to re-adjust its velocity field to the new position of the YSO. This sets a lower limit to the crossing time, , needed for the star to go from the original position to the current position. For a stellar mass of 10 and a radius of the Keplerian disk of 015 (540 au), we derive a rotational period = 4000 yr. Thus, the condition yr must be satisfied. Using this estimate of and the distance of 01 traveled by Bm, the average speed of Bm must be 1 km s*-1*. This is in agreement with the result that the LSR velocity of Bm of km s*-1determined from the Keplerian fit (see Sect. 4) corresponds to the systemic velocity of the molecular cloud, km s-1*, obtained from single-dish observations (see, e.g., Hill et al., 2010).
For a plausible mass accretion rate of 10*-3* yr*-1*, is sufficiently long that most of the mass of Bm could be accreted after its ejection from the original position. In this scenario, the structure of the disk has not been significantly affected by the motion of the YSO through it, because the star has become sufficiently massive to dominate the gravitational field of the region, only when it was already close to the current position.
We still have to explain why the jet is offset from the current position of the YSO. One possibility is that the jet was ejected before the YSO left its original position (marked by the intersection between the jet axis and the disk). Following the analysis of Sect. 5.1 and assuming 4000 yr, we derive that the velocities of the shocks must be 1 km s*-1*. Such a low velocity, much less than the typical jet speeds 100 km s*-1* (see, e.g., Masqué et al., 2015), implies a very high density ratio (104) between the ambient gas and the jet. Another possibility is that the jet is ejected from the present location of Bm, but is then recollimated on a larger scale along the axis of the magnetic field, which, on that scale, has not been affected by the movement of the YSO. This latter interpretation is supported by the morphology of the 13-GHz continuum and the funnel-like molecular emission observed near Bm, which, as noted in Sect. 5.1, suggests that the jet emerges from Bm perpendicular to the Keplerian disk.
Looking at Fig. 12, it is also interesting to note that the 1.2-mm peak is slightly offset from the jet axis in the direction of the 22-GHz continuum. This offset, 003–004, is comparable with the error in the relative astrometry between the JVLA and ALMA images, but it could have a physical explanation, too. In fact, it could result from a combination of two components of dust emission with similar intensities: one characterized by high temperature and low column density at the position of the 22-GHz continuum, the other with low temperature and large column density at the disk center. In order to resolve these two putative components, we have redone the 1.2-mm continuum image uniformly weighting the visibilities, thus increasing the angular resolution from 015 to 012, but the image still presents a single peak. We conclude that, if two components are present, their separation must be 01.
6 Conclusions
The main results of our Cycle 3 high-angular resolution (beam FWHM 015) ALMA observations towards the high-mass SFR G16.590.05 can be resumed as follows. At the center of the main clump, the dust emission is resolved into four small (size 1″) mm sources, among which the one (source B) harboring the high-mass YSO (Bm) is the most prominent in molecular emission. Fitting unblended, optically thin lines of CH3OCH3 and CH3OH, we determined temperatures for the gas inside the mm sources in the range 42–131 K, and estimated masses of between 1 and 5 .
A well-defined gradient (prominent in CH3OH, CH3CN and C34S) is traced in many high-density molecular tracers at the position of the high-mass YSO Bm, and is oriented along a direction forming a large (70°) angle with the radio jet previously revealed through sensitive JVLA observations. The P-V plots of this gradient present butterfly-like shapes, and the emission peaks of the molecular lines at high velocity draw linear patterns, indicating that we are observing rotation of the disk–envelope surrounding Bm. The disk radius is estimated to be 500 au, and the radial distribution is well reproduced by Keplerian rotation around a central mass of 102 .
The position of Bm, pinpointed by the compact 22-GHz emission, is found to be offset by 01 S of the jet axis and the mm peak of source B. We explain these findings assuming that, following a multiple stellar event, Bm was ejected from the center of the parental mm source and moved through the disk plane until it reached the current position. While the material of the disk had enough time to re-adjust its velocity field to the new position of the YSO, the distribution of matter and magnetic field, responsible for collimating the jet, remained basically unaffected by the movement of the YSO.
Acknowledgements.
V.M.R. is funded by the European Union’s Horizon 2020 research and innovation programme under the Marie Skłodowska-Curie grant agreement No 664931. We thank the referee Todd Hunter for useful comments, which improved the paper. This paper makes use of the following ALMA data: ADS/JAO.ALMA#2015.1.00408.S. ALMA is a partnership of ESO (representing its member states), NSF (USA) and NINS (Japan), together with NRC (Canada), MOST and ASIAA (Taiwan), and KASI (Republic of Korea), in cooperation with the Republic of Chile. The Joint ALMA Observatory is operated by ESO, AUI/NRAO and NAOJ.
The reference list from the paper itself. Each links out to its DOI / PubMed record.
- 1Artur de la Villarmois et al. (2018) Artur de la Villarmois, E., Kristensen, L. E., Jørgensen, J. K., et al. 2018, A&A, 614, A 26
- 2Beuther et al. (2002) Beuther, H., Schilke, P., Menten, K. M., et al. 2002, Ap J, 566, 945
- 3Beuther & Shepherd (2005) Beuther, H. & Shepherd, D. 2005, in Cores to Clusters: Star Formation with Next Generation Telescopes, ed. M. S. N. Kumar, M. Tafalla, & P. Caselli, 105–119
- 4Beuther et al. (2006) Beuther, H., Zhang, Q., Sridharan, T. K., Lee, C.-F., & Zapata, L. A. 2006, A&A, 454, 221
- 5Bonato et al. (2018) Bonato, M., Liuzzo, E., Giannetti, A., et al. 2018, MNRAS, 478, 1512
- 6Briggs (1995) Briggs, D. S. 1995, in Bulletin of the American Astronomical Society, Vol. 27, American Astronomical Society Meeting Abstracts, 1444
- 7Carpenter et al. (1997) Carpenter, J. M., Meyer, M. R., Dougados, C., Strom, S. E., & Hillenbrand, L. A. 1997, AJ, 114, 198
- 8Davies et al. (2011) Davies, B., Hoare, M. G., Lumsden, S. L., et al. 2011, MNRAS, 416, 972