Prospects for terahertz imaging the human skin cancer with the help of gold-nanoparticles-based terahertz-to-infrared converter
A. V. Postnikov, K. A. Moldosanov, N. J. Kairyev, and V. M. Lelevkin

TL;DR
This paper proposes a novel terahertz-to-infrared converter device using gold nanoparticles for real-time imaging of human skin cancer, enabling non-invasive detection with standard IR cameras.
Contribution
It introduces a new design for a THz-to-IR converter using gold nanoparticles, facilitating real-time skin cancer imaging in vivo or in vitro.
Findings
Design of the THz-to-IR converter with gold nanoparticles.
Operational parameters for in vivo and in vitro imaging.
Potential for real-time, non-invasive skin cancer detection.
Abstract
The design is suggested, and possible operation parameters are discussed, of an instrument to inspect a skin cancer tumour in the terahertz (THz) range, transferring the image into the infrared (IR) and making it visible with the help of standard IR camera. The central element of the device is the THz-to-IR converter, a Teflon or silicon film matrix with embedded 8.5 nm diameter gold nanoparticles. The use of external THz source for irradiating the biological tissue sample is presumed. The converter's temporal characteristics enable its performance in a real-time scale. The details of design suited for the operation in transmission mode (in vitro) or on the human skin in reflection mode {in vivo) are specified.
Click any figure to enlarge with its caption.
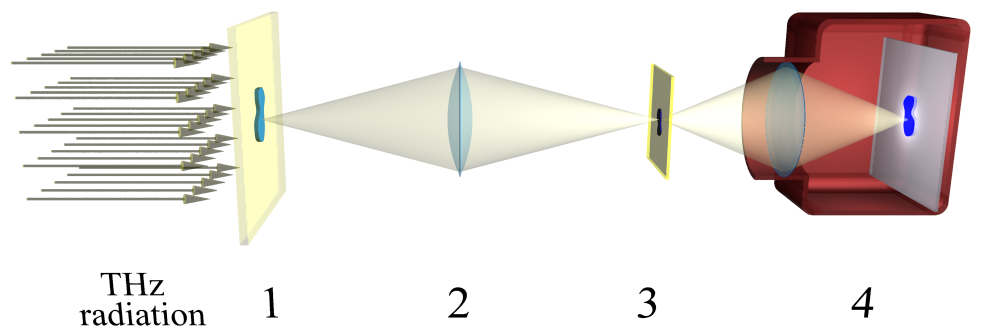 Figure 1
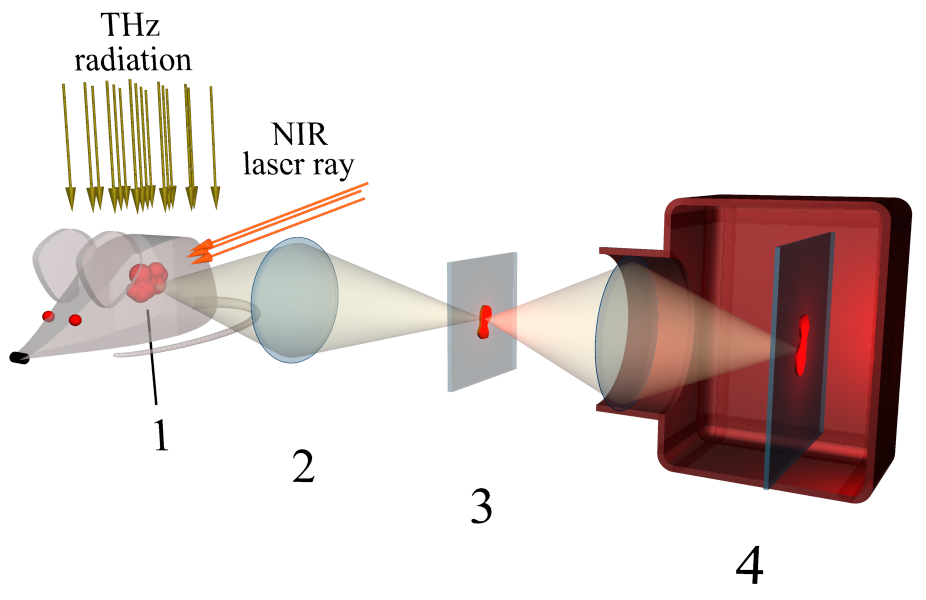 Figure 2
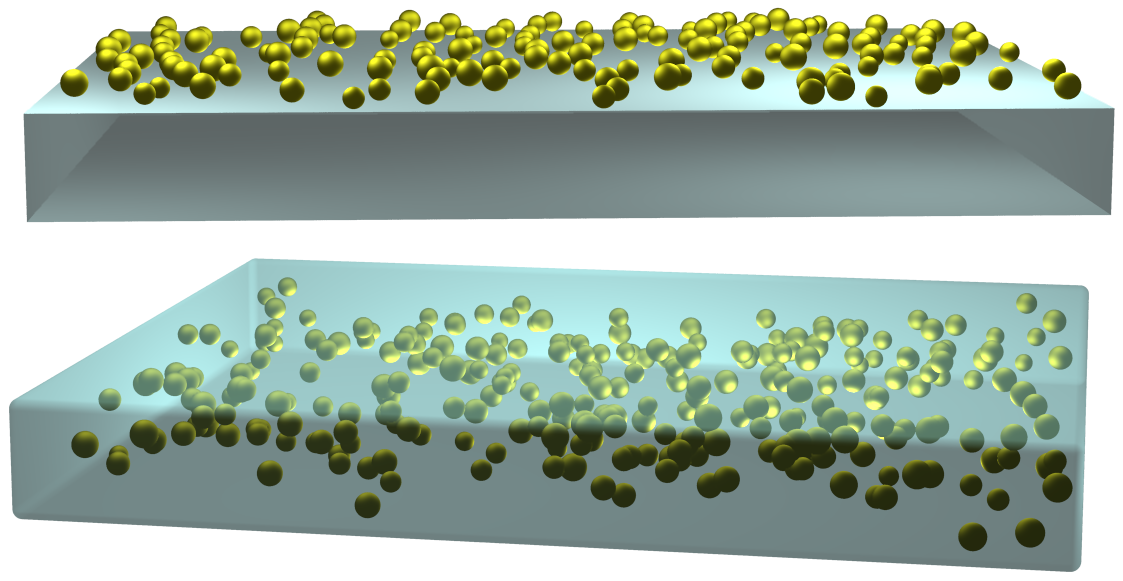 Figure 3
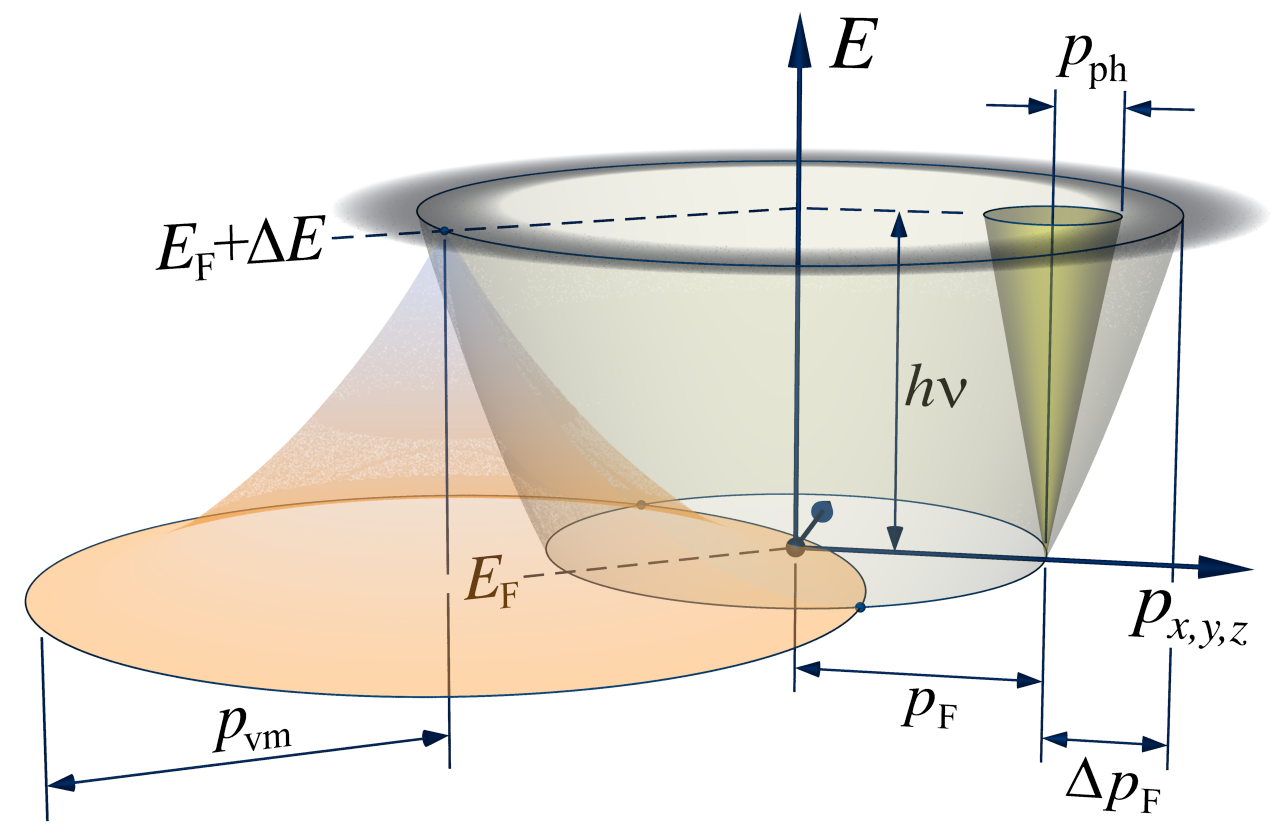 Figure 4
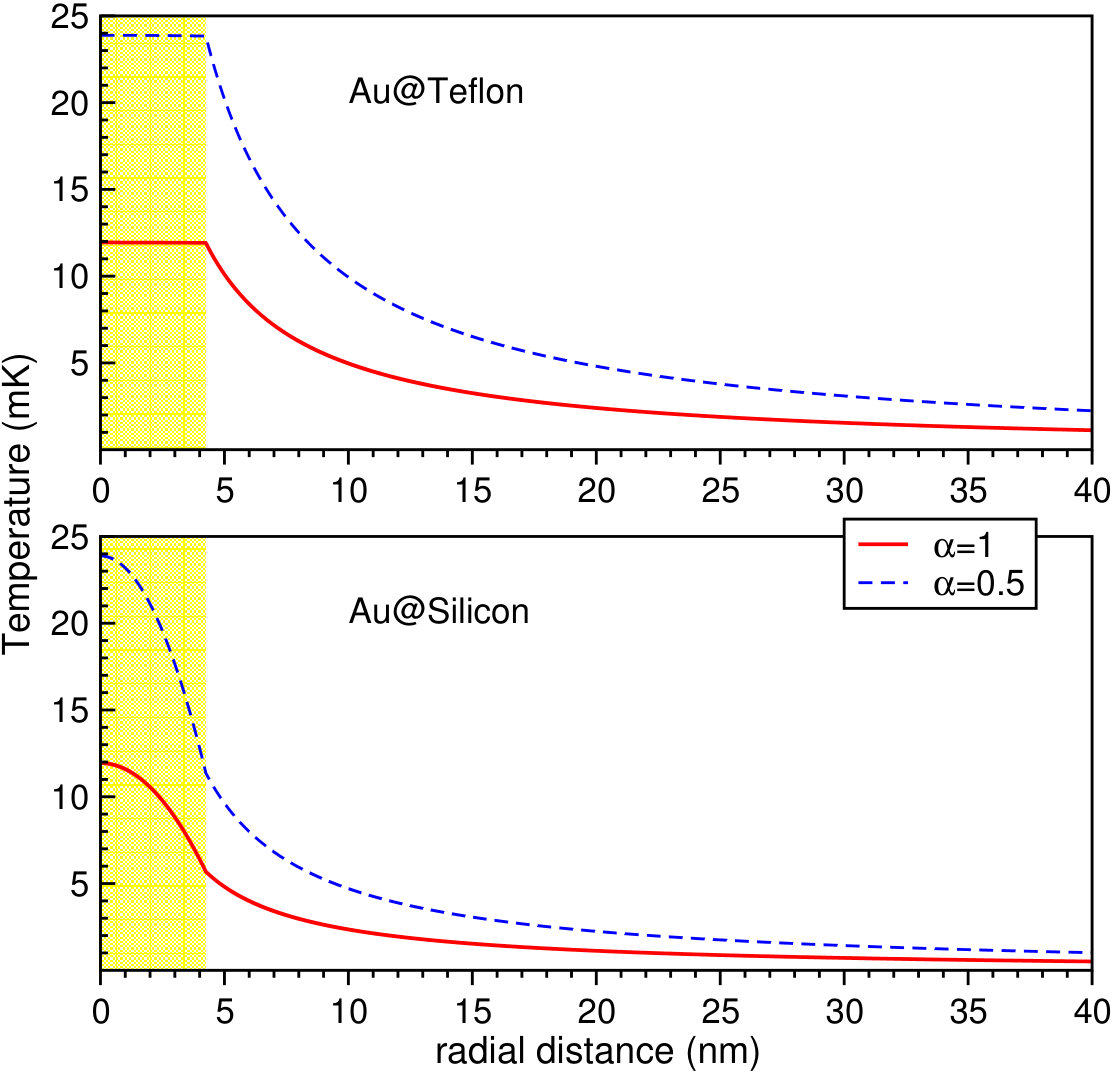 Figure 5
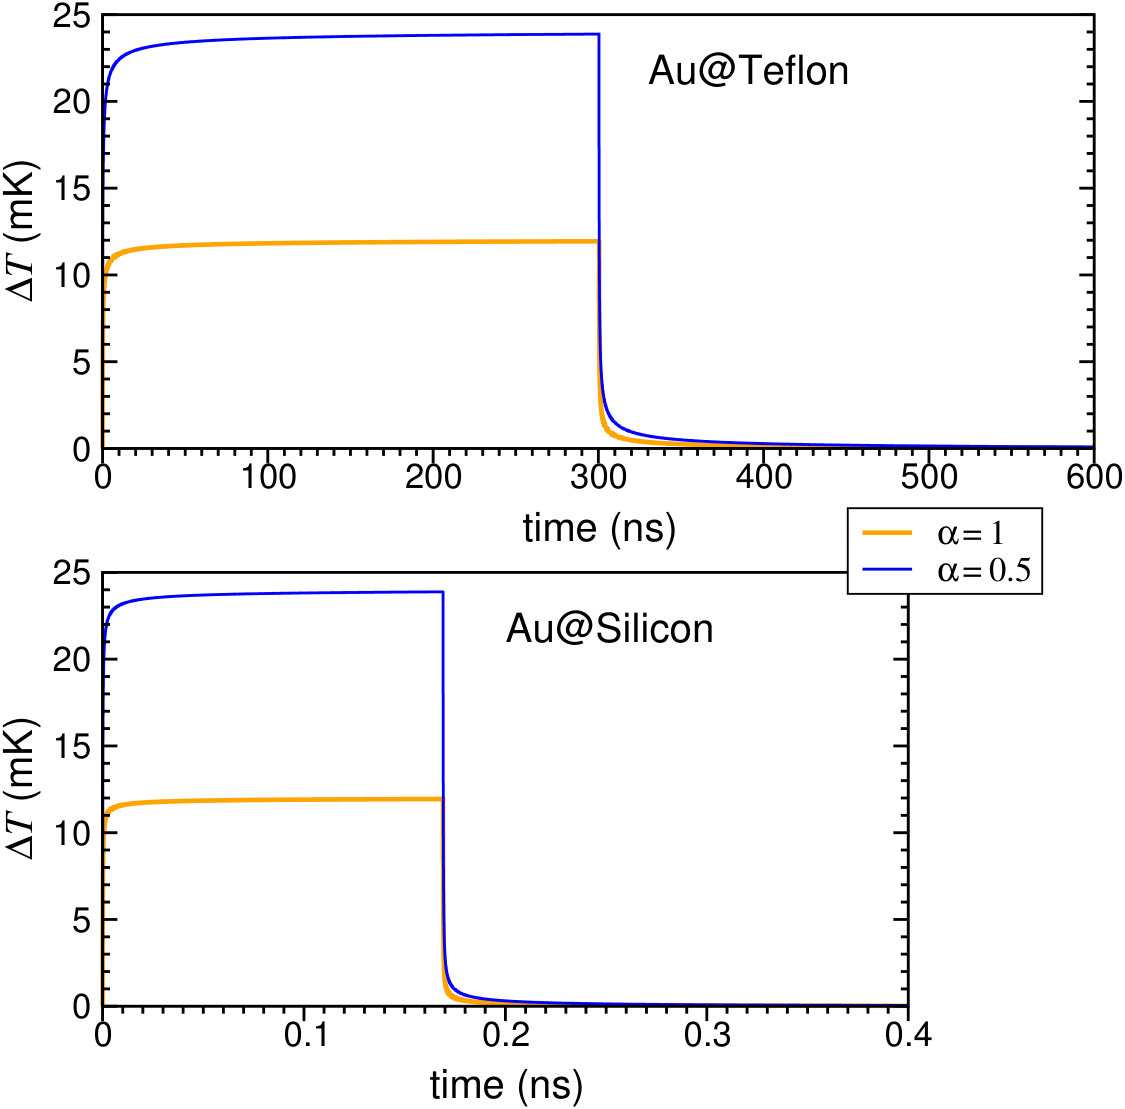 Figure 6
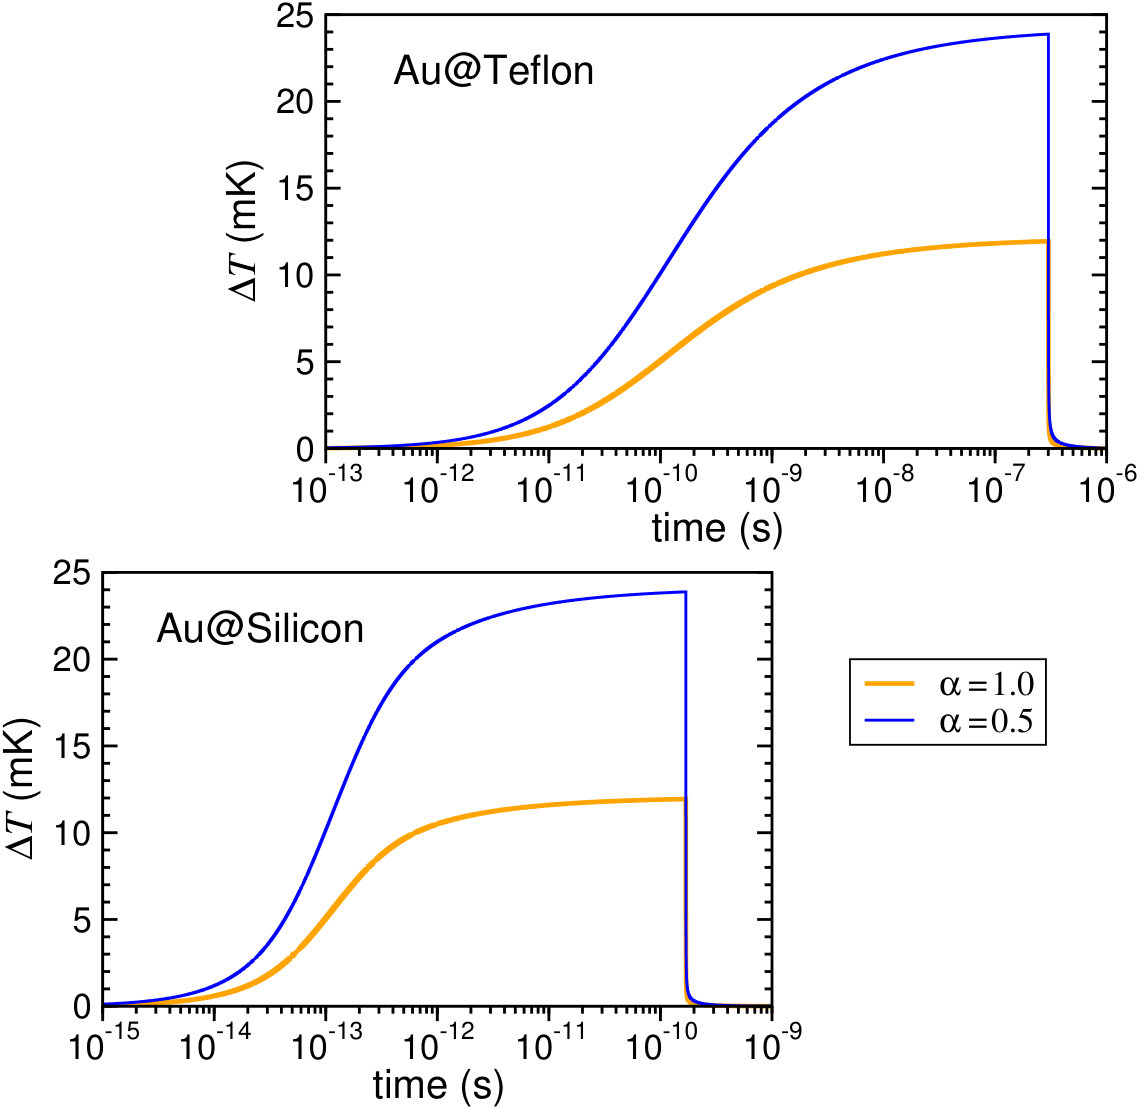 Figure 7
|
Frequency
(THz) |
Wavelength
(m) |
Photon
energy (meV) |
Photon momentum
( gcms-1) |
Objective’s
resolution (m) at mm |
Transmission
of the 0.1 mm thick Teflon® film (%) |
|||||
| 0. | 38 | 789. | 5 | 1. | 57 | 0. | 84 | 395. | 0a | 95 |
| 4. | 2 | 71. | 3 | 17. | 4 | 9. | 3 | 71. | 3b | 85 |
| 8. | 7 | 34. | 5 | 36. | 0 | 19. | 2 | 34. | 5b | 70 |
|
Frequency
(THz) |
Phonon momentum |
Skin
depth (nm) |
(gcms-1) |
(gcms-1) |
||||||
|---|---|---|---|---|---|---|---|---|---|---|
| gcms | ||||||||||
| 0. | 38 | 0. | 048 | 0. | 78 | 121. | 05 | 1. | 79 | |
| 4. | 35 | 0. | 770 | 12. | 5 | 35. | 8 | 1.24 | 41. | 1 |
| Material | Volume density (gcm-3) | Specific heat (JkgK-1) | Thermal conductivity (WmK-1) | |||
| Nanoparticle: nm gold sphere | 19.32 | 133.7 | 73.65 | |||
| Matrix: Teflon® | 2.12 | 1160 | 0.26 | |||
| Matrix: Silicon | 2.33 | 712 | 159 | |||
| Teflon matrix | Silicon matrix | |||||
|---|---|---|---|---|---|---|
| (mK) | (nW) | (nW) | ||||
| 1 | 12 | 0.168 | 0.23 | 49.2 | 0.79 | |
| 0.5 | 24 | 0.335 | 0.23 | 98.4 | 0.79 | |
Peer Reviews
No public reviews on file for this paper yet. If you reviewed it on a platform where reviews are public (OpenReview, ICLR, NeurIPS, ICML), you can paste yours below so the community can read it here.
Videos
No videos yet. Explain this paper in a talk, walkthrough, or lecture? Add one.
Prospects for terahertz imaging the human skin cancer
with the help of gold-nanoparticles-based terahertz-to-infrared converter
A. V. Postnikov
Université de Lorraine, LCP-A2MC, 1 Bd Arago, F-57078 Metz, France
K. A. Moldosanov
Kyrgyz-Russian Slavic University, 44 Kiyevskaya St., Bishkek 720000, Kyrgyzstan
N. J. Kairyev
Kyrgyz-Russian Slavic University, 44 Kiyevskaya St., Bishkek 720000, Kyrgyzstan
V. M. Lelevkin
Kyrgyz-Russian Slavic University, 44 Kiyevskaya St., Bishkek 720000, Kyrgyzstan
Abstract
The design is suggested, and possible operation parameters are discussed, of an instrument to inspect a skin cancer tumour in the terahertz (THz) range, transferring the image into the infrared (IR) and making it visible with the help of standard IR camera. The central element of the device is the THz-to-IR converter, a Teflon*®* or silicon film matrix with embedded 8.5 nm diameter gold nanoparticles. The use of external THz source for irradiating the biological tissue sample is presumed. The converter’s temporal characteristics enable its performance in a real-time scale. The details of design suited for the operation in transmission mode (in vitro) or on the human skin in reflection mode (in vivo) are specified.
(To be pubished in the proceedings of the FANEM-2018 workshop – Minsk, 3-5 June 2018)
I Introduction
In searching for physical prerequisites to visualize a tumour, one can rely on the THz radiation’s sensitivity to water, which is one of the most important components of the biological tissue. Hu and Nuss OptLett20-1716 were likely the first to point out the biomedical THz imaging, as they noted that the different water content of two different tissues (porcine muscle and fat) could yield a sufficient contrast. Even earlier, Ross and Gordon JMicrosc128-7 and Chen et al.Radiology184-427 have shown that the water content in cancerous tumours is higher than that in normal tissues. Further on, the water molecules absorb throughout the entire THz band (0.1 – 10 THz) JLaserApp15-192 . These properties motivated a development of THz imaging the cancer cells in transmission geometry (for in vitro study of thin, clinically prepared tissue sample, see Fig. 1). In this approach, the necessary contrast for imaging the tumour and discerning it from the normal tissue is provided by enhanced water content in cancer cells.
A fact that the water content of cancer cells is higher than that of normal cells, as well as the fact that the THz waves cannot penetrate moist tissue, favoured the development of another approach to the THz medical imaging, namely, the reflection geometry (for investigations in vivo, Fig. 2). Notably when imaging the human skin cancer, the reflection geometry is favoured over the transmission one, which, in its turn, allows to study the biological tissue samples of any organ’s cancer.
The reflectance of THz radiation, and hence the contrast in imaging the area of cancer, is enhanced as the water temperature in cancer cells increases. This observation found its use in the THz imaging technique due to works of Rønne et al. JChemPhys107-5319 and Son JAP105-102033 , who studied the power absorption and the index of refraction of water depending on temperature. Their works prompted progress in optimizing the reflection geometry, e.g., by Oh et al. Oh-conf2008 ; OptExpress17-3469 , who demonstrated that the reflected THz signal grows with the water temperature in cancer cells. Further on, these findings helped to visualise tumour due to its larger contrast, compared with the background of normal cells in in vivo experiments Oh-conf2010 ; OptExpress19-4009 ; JIRMilliTeraWaves33-74 .
To heat water in cancer cells, the gold nanoparticles (GNPs), like the targeted agents in photothermal therapy, are premediatedly delivered into the cancer cells, but not into the normal cells. The approach relies on the fact that the targeted agents, antibody-conjugated gold nanoshells NanoLett5-709 and solid gold nanospheres CancerLett239-129 , are accumulated in cancerous tissue more efficiently than in the normal one. In photothermal therapy, these agents have been demonstrated to selectively kill cancer cells, leaving the normal cells unaffected NanoLett5-709 ; CancerLett239-129 ; JAmChemSoc128-2115 . Thereupon the tumour is non-invasively treated by irradiating with near-infrared (NIR) laser beam at 650 – 1350 nm wavelength; this is the so-called “therapeutic window” where light has its maximum depth of penetration into the tissues. Under irradiation, the surface plasmons are excited in the GNPs; on dumping out the plasmons, the water is heated around the nanoparticles in cancer cells. In consequence, the cancer cells start to reflect the incident THz radiation even more efficiently, and thus can be more readily visualized by a highly sensitive IR camera (Fig. 2).
In works by Woodward et al. SPIE4625-160 ; PhysMedBiol47-3853 , the feasibility of the THz imaging of the body with skin cancer in reflection geometry have been demonstrated.
Refs. JInvestDermatol120-72, ; BJD151-424, ; ApplSpectro60-1127, seem to be the pioneering studies that revealed a possibility of the THz imaging of the basal cell carcinoma. It was shown by Wallace and Pickwell ApplSpectro60-1127 ; JPhysD39-R301 that the maximum difference in refractive index between diseased and healthy tissue occurs at 0.35 – 0.55 THz. The fact that the maximum difference in absorption occurs in the vicinity of 0.5 THz strengthens the choice of the above frequency range as that providing the best imaging contrast when irradiating the biological tissue.
II General idea and setup of the terahertz-to-infrared converter
The availability of commercial IR cameras with temperature sensitivities of 12 to 50 mK Mirage640P-Series ; FLIR-A6700sc allows to suggest two schemes of THz imaging a tumour which are shown in Figs. 1 and 2. These imply an usage of the source of the THz radiation for irradiating the tissue sample in vitro or tumour in skin in vivo. In our work BeilJNano7-983 , we elaborated an idea that gold nanobars and nanorings irradiated by microwaves could become THz emitters with photon energies within the full width at half maximum (FWHM) of the longitudinal acoustic phononic density of states (DOS) of gold (16 – 19 meV, i.e., 3.9 – 4.6 THz), with a maximum at 4.2 THz (17.4 meV). Further on, in Ref. Nanotechnology29-285704, we have shown that gold nanorhombicuboctahedra could be used as emitters of radiation at “soft” (two-phonon difference frequency) 0.54 THz and at “hard” (summary frequency) 8.7 THz. The THz emission is important for the THz imaging of human skin cancer, due to maximal contrast it yields between the cancer and the normal tissue, in the context of findings of Wallace and Pickwell ApplSpectro60-1127 ; JPhysD39-R301 . In the present work, the 0.38 THz radiation will be discussed, instead of 0.54 THz, in numerical estimates, for the reasons explained below. The 8.7 THz radiation, due to its shorter wavelength (see Table 1), might be advantageous for enhancing the spatial resolution of the image. The combined use of imaging at these two frequencies might be quite promising.
Such gold-nanoobjects-based THz sources are expected to be used in schemes of Figs. 1 and 2, therefore, below, when studying feasibility of the THz-to-IR gold-nanoparticles-based converter, we assume that the converter’s nanoparticles absorb the THz photons of these three frequencies: 0.38, 4.2, and 8.7 THz. Some corresponding parameters are given in Table 1. The diffraction limit on the objective’s resolution can be estimated as (: wavelength, : distance between the objective centre and the object, hence patient’s skin; : the objective’s aperture). The estimates show that these frequencies could yield acceptable resolutions for studying the structure of, say, pigmentary skin nevi. Further on, in Table 1, the transmissions of the 0.1 mm thick Teflon*®* film at frequencies of interest are given. Below, it will be shown that this material could be a good choice for the THz-to-IR-converter matrix, in accordance with data of Ref. THZ-Materials, .
In our work FANEM2015 , a physical mechanism has been suggested for heating the GNPs with radiofrequency radiation. At the core of this mechanism are longitudinal acoustic vibration modes (LAVMs), which a priori could have played a role also in the absorption of THz photons. In the Subsection III.1 below, we consider the special case of absorption of THz photons by GNPs without involvement of LAVMs, so that the momentum conservation law is fulfilled due to uncertainty in momentum of the Fermi electrons of gold.
First, we consider the transmission geometry setup (Fig. 1). The idea implies that an image (in the THz rays) of the tissue sample (position 1 in Fig. 1) is projected by the objective (position 2 in Fig. 1) onto the two-dimensional THz-to-IR-converter, which is a matrix, transparent both in THz and IR rays, with embedded GNPs (position 3 in Fig. 1). The GNPs, on irradiation with THz rays, convert the energies of THz photons into heat, being so the bright spots for subsequent detection by the IR-camera (position 4 in Fig. 1).
The idea of cancer cells detection is that the latter, rich in water, will strongly absorb the THz radiation; consequently, the corresponding (eclipsed) areas in the projected image on the detector plane will generate less heat and appear dark in the resulting IR image, over the otherwise bright background.
Now we turn to the reflection geometry (Fig. 2). In this setup, it is additionally assumed that the GNPs are delivered to the tumour in advance like the targeted agents in photothermal therapy, and are irradiated in situ with the NIR laser. The laser’s radiation penetrates the skin and the tissue and excites surface plasmons in the therein implanted GNPs. The surface plasmons heat the tumour, that in its turn enhances reflection of the THz radiation (that is known to be efficiently scattered by water at elevated temperatures) from it. The THz rays reflected from the tumour are focused by a lens on the THz-to-IR converter’s matrix, creating in this plane a (bright) THz image of the tumour. Further on, like in the previous case depicted in Fig. 1, the GNPs within the THz-to-IR converter absorb the THz radiation, generate heat and become IR sources, producing a bright image detectable by the IR camera.
Concerning the realisation of the THz-to-IR converter, two schemes shown in Fig. 3 may come into discussion. That in the form of a thick film with embedded GNPs (Fig. 3, lower scheme) seems preferable over single-layer deposition (Fig. 3, upper scheme), because it allows to achieve larger “projected” density of GNPs per surface unit, avoiding at the same time to place them too closely. We’ll see that these both considerations are important. The spatial resolution and the depth of focus of the IR camera are the essential parameters to guide the optimal design.
The following considerations help to specify the lens system and sizes of the THz-to-IR converter:
(1) the objective of the IR camera ensures the close up operation mode with a magnification . For infrared cameras, which are kept in mind (Mirage 640 P-Series Mirage640P-Series and FLIR A6700sc MWIR FLIR-A6700sc ), this imposes a short distance (22 – 23 mm) between the “object” (i.e., the THz-to-IR converter’s matrix with GNPs) and the objective’s edge, as well as small sizes (9.6 mm7.7 mm) of the “object”. The THz-to-IR converter being so small seems technologically advantageous. At small sizes of the converter’s matrix, the distortions caused by the first lens (the THz objective) would be small, too. The second lens (the IR camera objective) is simplistically shown in Figs. 1 and 2, whereas its real structure may be much more complex.
(2) It is convenient to assume the THz objective to be changeable, with different magnifications, say, , whereby the two latter values can be obtained by inverting the same objective. Magnification of would serve a preliminary examination of the patient’s skin area, over the field of view (FOV) of about (9.6 mm7.7 mm)0.2 = 48 mm38.5 mm. Operating with the magnification of , one could inspect a chosen object within the FOV of 9.6 mm7.7 mm (for example, a pigmentary skin nevi). The magnification with its corresponding FOV of (9.6 mm7.7 mm)5 = 1.92 mm1.54 mm would enable inspecting details of the pigmentary skin nevi.
The diffraction limits on the objective’s resolution are given in Table 1. At frequency 4.2 THz and (in the close up operation mode) and pixel size =15 m this means that the linear “uncertainty” of the image is covered, on the average, by (71.3 m)(15 m)5 pixels of the IR camera detector, that seems acceptable to resolve a meaningfully detailed pattern. At frequencies 0.38 and 8.7 THz and the linear “uncertainties” would be covered, on the average, by 26 and 3 pixels, respectively.
The lenses with desirable parameters (focal distance, diameter) for the THz range, made out of various materials, can be selected from the lists of commercially available products – see, e.g., Ref. THZ-Lenses, .
III Energy and momentum conservation relations within the photon – electron – phonon system
III.1 Absorption of THz photons by GNPs
helped by uncertainty of the Fermi electrons’ momenta
We come now to discussion of the physical background of the THz to IR conversion. Let us consider a situation in GNP, when the energy interval between the Fermi level and a nearby accessible vacant electron energy level equals the energy of the THz photon, . Fig. 4 depicts a case of absorption of a THz photon by Fermi electron without involvement of the LAVM; the subsequent relaxation of the excited electron releases a longitudinal phonon. The surface of revolution around the vertical (energy) axis in Fig. 4 schematically shows the energy dispersion of free electrons (as function of just two momentum coordinates), delimited at the bottom by Fermi momentum / energy and at the top – by a discrete energy level accessible following an excitation. The smearing in the upper momentum plane indicates the uncertainty of the electron momentum due to spacial confinement (see below), that helps to match the momentum conservation condition involving a photon. The dispersion of a THz photon is shown by a narrow cone, starting from some momentum / energy value of a Fermi electron. In the follow-up of an excitation to the energy , the electron can relax releasing a longitudinal phonon. The phonon dispersion is depicted by a descending (inverted) bell mouth, starting from some momentum / energy of the excited electron. Essential observations are that () for small enough nanoparticles, the momentum and energy conservation in the course of an immediate electron excitation by a THz photon can be assured by the uncertainty relation; () following the relaxation of an excited electron via releasing a phonon, the electron’s momentum may undergo a large reorientation (largely retaining its magnitude). Let us now consider some details more attentively.
First we try to estimate the sizes of gold nanospheres which could be efficiently used in the THz-to-IR converter. The nanoparticle diameter allows to “tune” the electron energy separation , according to the Kubo formula for the level spacing in a nanoparticle, JPSJ17-975 ; JPhysColloq38-C2-69 (see also Appendix 1 in Ref. FANEM2015, ). The energy delivered by a THz photon should match an integer number of steps, , in the electron excitation ladder; simultaneously it should fit an integer number of energy steps for the vibration mode, :
[TABLE]
For simplicity and order-of-magnitude estimates, we assume for the beginning a linear dispersion law for the longitudinal phonons, supposing that they are propagating along the linear size for which we take the diameter , possessing the nominal sound velocity , hence . A reference to the Kubo formula modifies Eq. (1) as follows:
[TABLE]
where is the Fermi energy of gold, is the number of gold atoms in the nanosphere, that is otherwise the ratio of the nanosphere’s volume to the volume per atom in the gold’s fcc lattice, , hence . With this, the diameter is expressed via the and parameters as follows:
[TABLE]
or, with the material constants inserted and specifying the units,
[TABLE]
It follows from the right parts of Eqs. (1) and (2) that
[TABLE]
For given and , we can hope that, by force of Eqs. (4) and (5), certain combinations of and would emerge as “resonance” ones. The optimal choice of all related values comes about from the following considerations:
For securing a sufficient conrast of the image of cancer / normal tissue, the frequency ought to be in the range 0.35 – 0.55 THz.
The diameter must exceed nm, in order to prevent the GNP’s cooling via spontaneous emission of THz photons. This observation was guided by our study arXiv:1808.10607 dedicated to a suggested explanation of the size effect in the heterogeneous catalysis on GNPs. Nanoparticles with sizes inferior to 7 nm tend to cool down due to a spontaneous emission of THz photons, hence become useless if the objective is opposite, to heat the GNPs in the THz-to-IR converter by incoming THz radiation. On the other side, an increased would degrade the converter’s sensitivity, since an elevated THz power level will be required to efficiently heat the GNPs.
and must be integer. With respect to the latter condition, we acknowledge that it can be imposed only approximately, because the exact quantisation criteria would be difficult to control under practical variations of GNPs’ shapes and sizes. Still, the smaller the (, ) the stronger the importance of the confinement effects and hence of the resonance conditions in the energy matching. We note moreover that the estimation of in terms of is only approximate. Anyway, accepting the nominal value of the velocity of sound in gold cm/s, we arrive at the following compromise concerning the parameter values: THz, nm; ; , that was accepted for the following analysis.
Last but not least, the skin depth in gold at frequencies of interest exceeds this GNP size considerably (see Table 2). One can therefore assume that the electric field penetrates the volume and is of the same strength throughout the nanoparticle. Moreover, the GNP size should be smaller than the mean free path of electrons in gold, which is, at 300 K, nm Zhang-NanoMicroHeatTransfer , in order to facilitate the estimation of the thermal conductivity.
In addition to the above arguments based on the energy conservation law, we should pay attention to issues of the momentum conservation. On excitation of a Fermi electron by a photon of energy , the electron momentum (assuming a free-electron dispersion law) gets an increase. The momentum of the absorbed THz photon, , is much smaller and hence cannot help to overcome the mismatch. However, at small enough GNP sizes, the uncertainty in the electron’s momentum might well absorb the value of .
Namely, the modification (an increase) of the Fermi electron’s momentum in the course of absorbing a THz photon is , where cm/s is the Fermi velocity of electrons in gold AshMerm-book , hence gcm. This should be compared to the Heisenberg uncertainty of the electron’s momentum in a confined geometry,
[TABLE]
whence, with Eq. (4) and the parameter values for gold, we get:
[TABLE]
Some numerical estimations are given in Table 2. It follows that, for the GNP size we consider, the condition is by far respected. Therefore, the mismatch of the electron momenum to satisfy the momentum conservation on absorbing a THz quantum with frequency from the range of interest for biomedical applications would be always “absorbed” by the Heisenberg uncertainty relation.
III.2 GNP heating through release of longitudinal phonons
The relaxation of excited electron via releasing longitudinal phonon(s), that would result in heating the GNP, is illustrated by a “descending” scheme in the left part of Fig. 4. From the energy conservation condition, the excitation energy should match the energy of a vibration mode, according to Eq. (1). Fig. 4 depicts for simplicity a single-phonon process. One can moreover imagine two-phonon (or, in principle, multiphonon) processes, following the electron excitation by a “hard” ( THz) photon.
From the side of momentum conservation, it is seen from Fig. 4, in which at least the qualitative relations are roughly respected, that there is no general problem of momentum mismatch like that existing in the case of absorption of a photon, when the photon dispersion surface (a narrow cone) was entirely placed inside the free-electron paraboloid. Indeed, in case of releasing a phonon, the minimal momentum mismatch, i.e., the opening of the bell mouth on the left of Fig. 4 for the case , is , hence times larger than listed in Table 2 (that makes gcms*-1*, for nm), and by far larger than . The momenta values of “genuine” longitudinal phonons having frequencies of interest, as determined from experimental phonon dispersion along the direction PRB8-3493 and its numerical fit given in Ref. Nanotechnology29-285704, , are also shown in Table 2. As could be expected, for THz the “exact” (experimental) value perfectly fits that from the simple linear dispersion model as estimated above. Therefore the matching conditions for both energy and momentum, represented by intersections of respective dispersion-law surfaces, can typically be easily found. Fig. 4 shows two such “hits”, indicated by thick dots, on the circle of radius in the basal plane . In 3-dimensional reciprocal space, such matches will be placed on continuous lines of intersection of isoenergetic surfaces describing the electron and phonon dispersions. Quantum confinement conditions for electrons and phonons will select distinct “spots” along such lines, which will be however smeared by force of the uncertainty relation and the particles’ irregularity and dispersion of sizes. As already mentioned above in relation with the energy conservation, it is difficult to elaborate on specific relations in the most general case; however it seems plausible that the electron/phonon energy/momentum matches can be, in principle, easily found and will “work” in the relaxation mechanism.
A quite general and not trivial observation concerning the energy / momentum conservation in the course of electron-phonon relaxation is that the momentum of the relaxing electron may be scattered, in the process, quite far along the Fermi surface. This follows from the comparison of typical values of and (its superior by orders of magnitude) phonon momentum in Table 2.
Summarizing, the heating of GNP may occur thanks to a combination of two circumstances. The absorption of the THz photon is accompanied by an excitation of a Fermi electron, which is only made possible by uncertainty of the latter’s momentum. The relaxation of the excited electron brings about release of a phonon (or, several phonons), in which process the uncertainty in the momentum of the longitudinal phonon (or, the combined uncertainty in case of several phonons) may also play an auxiliary role as it mitigates the exact energy / momentum matching conditions, however, this is not qualitatively essential. The channeling of initial photon energy into a vibration channel amounts to heating the particle.
IV Estimations of parameters of the THz-to-IR converter
For further quantitative estimates, we consider a model of matrix-based converter (Fig. 3, lower scheme), with Teflon*®* and silicon as possible matrix materials, transparent in both THz and IR wavelength ranges (specifically, throughout 1 to 5 m in IR), and gold nanospheres embedded therein.
As was mentioned above, according to the data of Ref. THZ-Materials, , the good transmission of Teflon*®* film of 0.1 mm thickness at the THz wavelengths of interest makes this material promising as a substrate to host GNPs. The transmission within the IR spectral range (about 80 – 90% for IR wavelength of 3 to 5 m and about 50% for 9 to 12 m) is also acceptable. For the infrared camera, the Mirage 640 P-Series Mirage640P-Series (specifically, the version operating in the wavelength range from 3 to 5 m) could be a good choice, the FLIR A6700sc MWIR FLIR-A6700sc , operating in the same wavelength range, being a reasonable alternative.
Using the previously identified optimal GNP diameter, we calculate now the temporal characteristics and spatial distribution of heat generated within an isolated GNP embedded in the matrix, as well as the power levels of the THz radiation required to maintain the GNPs in thermal equilibrium at, or above, the temperature sensitivity threshold of IR camera.
IV.1 Radiation power required to hold GNPs at temperatures
defined by their emissivity factor
The temperature distribution over, and around, the GNP can be described by the heat conduction equation in spherical symmetry with the source function taken into account:
[TABLE]
where is the temperature, the volume density, the specific heat, the thermal conductivity, the volume density of the heat source, ( being the power at the heat source); depends on the radius and time .
We assume the thermal parameters to be temperature independent and uniform inside and outside the particle, as follows:
[TABLE]
where is the nanoparticle’s radius ( nm, as argued in Subsec. III.1) and is the radius of the Teflon*®* shell, . For practical calculations below, nm was taken as an effective “infinity”, in view of much larger factual matrix thickness (0.1 mm) and the assumption that individual GNPs are too distant to interfere. The initial and edge conditions were as follows:
[TABLE]
A solution for Eqs. (6-8) was sought for by the numerical method of lines relative to , where K, as was described in detail in Ref. JNanophoton6-061716, .
For nanoparticles, both their specific heats and thermal conductivities depend on the nanoparticle’s size (see Table 3). According to Gafner et al. PhysMetMetallogr116-568 , the specific heat of GNPs is just slightly above that of the bulk gold. We extrapolated the specific heat of the 8.5 nm diameter GNP from the data of Ref. PhysMetMetallogr116-568, and estimated it to be 133.7 JkgK*-1*. The difference in the thermal conductivity is much more dramatic. In fact, the electron thermal conductivity on the nanoscale is much higher than the lattice thermal conductivity PRB82-075418 ; ActaPhysSin62-026501 , however lower than that of the bulk metal. When the GNP’s characteristic size (diameter) is smaller than the mean free path of electrons in the bulk gold, i.e., nm at 300 K Zhang-NanoMicroHeatTransfer , the thermal conductivity of the nanoparticle can be estimated as follows Zhang-NanoMicroHeatTransfer : Wm*-1K-1*, where Wm*-1K-1* is the thermal conductivity of bulk gold.
The source term in Eq. (6,7), stationary in our assumption, accounts for the power delivered to the particle. Obviously dependent on the power of the primary THz source, the relevant (threshold) values of for our analysis are those which enable a heating, as a steady solution of Eq. (6) – i.e., after an infinite saturation time, – of the (embedded) GNPs to temperature levels detectable by the IR camera. The dynamics of the heating will be discussed below; for the reasons elaborated in the next section, we fix such reference threshold value at 12 mK, that is the reported temperature sensitivity of the Mirage 640 P-Series IR thermal imaging camera Mirage640P-Series . Individual GNPs, however, may largely vary in their ability to convert absorbed power into heat (depending on the particle’s roughness etc.), that can be grasped into a phenomenological emissivity factor , varying between 1.0 (ideal to conversion) and almost zero. Without a clue as for the actual values of , we consider in the following, for reference purposes, the values and , the generalisation being straightforward. The threshold values needed to yield visibility by the IR camera will be scaled by , hence 12 and 24 mK, correspondingly, for the ’s under discussion. The estimated powers and , defined by GNPs’ emissivity factors , versus the temperature rise for GNP of radius nm in Teflon*®* and silicon spherical shells are given in Table 4. In Fig. 5, the radial distributions of temperature around GNPs embedded in the matrix are shown.
IV.2 Estimations of THz power threshold sensitivity for
the THz-to-IR converter + IR camera operation
On having discussed the “performance” of a single embedded GNP for the THz-to-IR conversion, we turn to an assessment of a realistic device, to be composed of distributed GNPs and “viewed” by practically available IR cameras. Let us consider a spot on the converter plate, which has to be mapped onto the pixel in the IR camera’s focal plane array (FPA). As was mentioned in the beginning of Section II, the IR camera operates in the close up mode, so that its objective’s magnification equals nearly 1. Assuming that is the pixel size, the spot area is . The Stefan – Boltzmann law yields the energy flux from the area radiating as the absolutely black body (i.e., the radiant flux surface density) into a semisphere (solid angle of ), in the wavelength range from 0 to , as , where Wm*-2K-4* is the Stefan – Boltzmann constant, and the surface temperature (taken K in the following). Let us assume that is the nominal temperature sensitivity of the IR camera. This means that the detectable excess (over the background) in the surface density of the radiant flux emitted by the reference spot into the solid angle within the whole wavelength range needs to be at least
[TABLE]
in order to cause a response of the IR camera. We assume further on that the surface spot is expanded into a volume element with the same area and thickness , inferior to the depth of focus of the IR camera’s objective. We specify that the volume element contains GNPs with the emissivity factor , heated by absorbing the THz energy. Those GNPs within heated up to a temperature of 300 K will be perceived by the IR camera.
The properties of the substrate, in what regards the heat exchange, need to be grasped by the model to enable realistic estimates of the temporal characteristics and spatial resolution. Numerical estimations have been done as explained above, assuming that the GNP is placed into a spherical shell of Teflon*®* (or silicon) of 500 nm radius, whereby the power of the THz radiation heats the GNP in a steady-state mode up to the temperature of above the background – see a solution of the heat conduction equation (6) in subsection IV.1, with the values for the source term, Eq. (7), as given by Table 4. In the steady-state heat transport, the surface density of the radiant flux generated by GNPs element and emitted outwards within the solid angle and the wavelength range from 0 to is , where is the transmission of the Teflon*®* matrix within the operating wavelength range of the IR camera. Half of this, i.e., , will be emitted in the direction towards the IR camera. Comparing this latter value against the threshold radiant flux from Eq. (9) specifies the minimal number of GNPs needed in the volume element so that the resulting radiant flux surface density be sufficient to cause the IR camera’s response:
[TABLE]
where (specified in Table 4) accounts for the emissivity factor being different from 1.
The values to use in Eq. (10), as they follow from calculations described in subsection IV.1, are listed in Table 4 for two trial levels of the emissivity factor of GNPs. The and are the steady-state THz powers to be delivered to a GNP placed inside the spherical shell made of, respectively, Teflon*®* or silicon, in order to heat it from temperature = 300 K to . To be specific, the value was chosen to be 12 mK, the reported temperature sensitivity of the Mirage 640 P-Series infrared thermal imaging camera Mirage640P-Series .
In the model considered, the minimal possible thickness of the film matrix is 1 m, the diameter of the spherical shell covering the GNP. For further assessments, Teflon*®* film of 0.1 mm thickness would be an acceptable choice because this is less than the typical depth of focus (0.3 mm). Moreover, the transmission data and in, correspondingly, THz and IR ranges are available for the Teflon*®* film of namely 0.1 mm thickness PRB8-3493 – see the Table 1, where the values are given for three frequencies of interest, whereas % within the wavelength range from 3 to 5 m, that is, the operating range of the Mirage 640 P-Series infrared camera.
As follows from Table 4, the values of or , i.e., the “threshold” numbers of GNPs within the volume element that maps onto a pixel of the IR camera, are by far less than 1 in all combinations of the parameters considered. In order to “sensibilize” each pixel, the number of GNPs within the corresponding volume element must obviously be, at least, one. An increase in the GNPs concentration beyond this number ensures each pixel to be successfully addressable.
Assuming or , the concentration of GNPs in the substrate must be . Taking the Mirage 640 P-Series IR camera detector as an example, the pixel size is , therefore, for the above justified thickness of the Teflon*®* layer being 0.1 mm, the GNP concentration is mm*-3*. This will suffice to make every pixel addressable.
We can further on estimate the power of THz radiation source needed for a Teflon*®* matrix of the 9.6 mm mm size and 0.1 mm thickness to work. The total amount of the GNPs in the matrix is mm mm mm3 . Typically for rough estimates one takes the emissivity factor , then the power needed to heat such GNP by 24 mK is nW, and the required power of the whole THz source would be nW 110 W. For silicon matrix, the corresponding values of power are 98.4 nW and 3.28 nW 32.3 mW, respectively, i.e., larger than those for the Teflon*®* matrix by a factor of 300.
The values 110 W and 32.3 mW can be considered as the conventional powers required for operating the THz-to-IR converters built around the Teflon*®* and silicon matrices, respectively, in the transmission mode (Fig. 1). For the reflection mode (Fig. 2), these values could classify a sensitivity of the “THz-to-IR converter + IR camera” system.
IV.3 Temporal characteristics of the THz-to-IR converter + IR camera system
Being also interested in the detector’s reaction time, we turn now to time-dependent solution of Eq. (6), using the “threshold” values from Table 4. The time evolution of temperature at the center of GNP (towards the target value for the steady solution), , are shown in Fig. 6 (in the linear time scale) and in Fig. 7 (in the logarithmic scale). The heating phase was set on until the value reached an (arbitrarily chosen) level of 99.5% of the saturatton value, after which the heating was set off. The resulting “response functions” provide a measure of the detector’s characteristic reaction time. In silicon, thermal conductivity is much higher than that in Teflon*®* (see Table 3). Accordingly, the heating/cooling times of 8.5 nm diameter GNPs in silicon matrix are much shorter than those in Teflon*®* matrix. In the logarithmic scale (Fig. 7), one can easily see that the characteristic time at which half of the target temperature is attained is by three orders of magnitude longer in the Teflon*®* matrix (10*-10* s) than in silicon (10*-13* s). However, even for the Teflon*®-based converter the response time is likely to be well below microseconds and hence sufficient for real-time imaging of tissue or patient. The “bonus” of the “slow” Teflon®* matrix is that much lower THz power levels are required to achieve comparable heating.
Because of its very short heating / cooling time, the THz-to-IR converter on the GNP / silicon basis might be used for registering fast processes in the course of which an appreciable power of THz radiation is released. For medical imaging, on the contrary, the GNP / Teflon*®* converter seems to be advantageous, since it would afford an acceptable registration rate even at THz powers two orders of magnitude lower than those needed in combination with the silicon matrix.
As a general observation based on a number of trial calculations for a nanoparticle immersed in the matrix of as low thermal conductivity as that of Teflon*®*, the exact choice of transport parameters for the nanoparticle (confinement-dependent and estimated for a given particle size vs bulk) becomes relatively irrelevant. As is evident from Eq. (6), the temperature evolution would follow the uniform scaling of the heat source term, therefore the response time wouldn’t depend on the emissivity factor of individual particles, but only on the GNP size and the embedding material. The temperature sensitivity of the IR camera may be a limiting factor, though.
IV.4 On enhancement of conversion efficiency of THz radiation into heat in GNPs
We selected gold as promising metal for nanoparticles because it does not oxidise at room temperatures, hence, surfaces of GNPs are clear of oxides, which could absorb THz radiation. However, in gold, a number of Fermi electrons able to absorb the THz photons is not large. We think, it is possible to enhance the number of electrons at the Fermi level of gold by two ways: (a) by introducing impurity atoms like Fe or Ta, which form electron states at the Fermi level of gold JNP6-061709 ; (b) by alloying gold with palladium, which possesses peak of electron DOS at the Fermi level PRB14-3446 and form continuous row of solid solutions with gold BullAlloy6-229 . Palladium, like gold, does not oxidise in air at room temperatures. The alloys with compositions close to 50 at.%Au – 50 at.%Pd seem promising in the sense of being the most distorted, because they are “as much as possible away” from lattices of pure constituents. The distortion induces intense scattering of electrons, which may absorb the energy of THz photons and channel this energy into lattice vibrations. Consequently, the conversion of THz radiation into heat is expected to be enhanced by alloying. Indeed, the de Broglie wavelength of the Fermi electrons (as well as electrons, which absorbed the THz photons) is 0.5 nm. This happens to be reasonably commensurate with the expected areas with distorted periodicity in the alloy made out of Au and Pd, characterized by lattice parameters of 0.408 nm and 0.389 nm, respectively BullAlloy6-229 . The following observations summarize the arguments as for the “usefulness” of alloying:
as compared to pure gold, the Au-Pd alloys possess enhanced electron DOS at the Fermi level SurfInterfAna36-793 ; PRB58-9817 ; JElecSpec78-43 ; in these conditions, due to a thermal smearing of the DOS distribution, the electron states near to the Fermi level are occupied partially. Therefore, in Au-Pd alloys, on the one hand, a number of Fermi electrons-absorbers of THz photons is larger than in pure gold, and on the other hand, an enhanced number of unoccupied electron states close by the Fermi level causes an intensive scattering of excited electrons (which absorbed THz photons);
the specific electrical resistivity of the Au-Pd alloys are several times higher than that of pure gold; moreover, at compositions at.%Au – 50 at.%Pd, it reaches maximum values and one order of value higher than that of pure gold GoldBull5-74 ; JPhysF4-2189 .
V Discussion
When operating the schemes shown in Figs. 1 and 2, the previously suggested THz emitters BeilJNano7-983 ; Nanotechnology29-285704 and the present THz-to-IR converter are intended to be used in tandem. The advantage would be that the GNPs in the THz-to-IR converter would absorb THz photons emitted by gold nanoobjects of the emitter, i.e. photons of the same energies (1.57 or 36.0 meV). This absorption (by the Fermi electrons of 8.5 nm diameter GNPs) would happen resonantly and directly, i.e. without contributions of LAVMs considered in Ref. FANEM2015, .
Estimated length width sizes of both Teflon*®* and silicon matrices are 9.6 mm 7.7 mm. Thermal conductivity of silicon is much higher than that of Teflon*®, therefore, in Table 4, the powers are much larger than , which results in shorter heating/cooling times as compared to those in Teflon®* matrix-based the THz-to-IR converter (see Figs. 6 and 7).
Estimated heating/cooling times of 8.5 nm diameter GNPs (169 ps / 1.16 ns and 300 ns / 1.25 s in, respectively, silicon and Teflon*®* matrices) show that the considered THz-to-IR converters would response to any object’s evolution instantly, for all practical applications envisaged. For technical operation, either a pulsed THz radiation source (the pulse duration 169 ps for silicon matrix and 300 ns for Teflon*®* matrix, with pauses between pulses longer than, correspondingly, 1.16 ns and 1.25 s), or a continuous THz radiation source would be required. In this context, the use of the THz radiation sources described in Ref. BeilJNano7-983, ; Nanotechnology29-285704, would be a good choice. The conventional powers required for operating the THz-to-IR converters built around the Teflon*®* and silicon matrices are correspondingly about 110 W and 32.3 mW, that is, within accessible limits of contemporary THz radiation sources Proc2004FEL-216 .
Kuznetsov et al. APL99-023501 ; TechnMessen78-526 ; PIER122-93 ; ProcSPIE8423-15 ; JPhysConfSer490-012174 ; TechPhysLett42-1130 ; SciRep6-21079 used the THz-to-IR converter with a topological pattern of split-ring resonators. Its drawbacks are the so-called “comet tail” and image blooming effects, which deteriorate the converter’s response time and spatial resolution. No such effects are likely to occur in the THz-to-IR converter based on GNPs. Indeed, in the Teflon*®* and silicon matrices, the edge of a reference cuboid accounted for one GNP is equal to
[TABLE]
therefore, the distance exceeds by far the maximum radii of radial distributions of temperature around heated GNPs shown in Fig. 6. Hence, the temperature fields of neighboring heated GNPs would not overlap. Moreover, the cooling times of GNPs are quite small. Therefore, no effects like the “comet tail” or the image blooming are a priori expected.
Characteristics of the FPA imaging devices are being improved, new types of FPAs are now making their appearance with temperature sensitivity mK DALI_D900-Series and pixel’s size m Daphnis-HD-MWIR . With this, the power sensitivities of the THz-to-IR converters would be correspondingly enhanced.
We have patented our approaches to conversion of THz vibrations into THz electromagnetic radiation Patent-RU2650343 , the THz-to-IR converter Patent-RU2642119 , as well as the source of THz radiation Patent-RU2622093 . Also, we have published our papers Nanotechnology29-285704 ; Ferroel509-158 related to these issues and now hope that these works would promote introducing the THz imaging method of the human skin cancer to the modern medical practice.
VI Conclusion
Contrary to ionizing X-rays, the THz radiation is a non-ionizing one and hence not harmful to living organisms. The THz medical imaging is expected to become a promising non-invasive technique for monitoring the human skin’s status and for early detection of pathological conditions. In this context, the development of terahertz imaging setups emerged as one of the “hottest” areas in nanotechnology-supported modalities for the cancer diagnostics. The THz-assisted diagnostics in reflection geometry allows for non-invasive (in vivo) THz imaging of skin cancer’s surface features. It could be performed in situ, without time losses on standard in vitro histological tests, which require more time. In the reflection geometry, one could investigate only skin’s surface features and depth information, because the THz radiation is strongly absorbed by water and does not penetrate tissue to any significant depth. In the transmission geometry, one could study the clinically prepared tissue samples both of inner organs and the skin.
Other areas of dermatology, where the THz imaging in reflection geometry might be advantageous, are the following: skin burns and wound inspection through bandages; monitoring the treatment of skin conditions (like psoriasis), since this allows to avoid the direct contact with the skin as e.g. under ultrasound investigation. These advantages are moreover supported by the fact that the THz imaging is cheaper than the magnetic resonance one.
Summarizing, the currently available offer of highly sensitive infrared cameras allows to design schemes for the THz medical imaging of malignant tumours in biological tissue both in vitro and in vivo. The schemes contain two main parts, the terahertz-to-infrared converter and the infrared thermal imaging camera. The obtained theoretical results demonstrate that the suggested approach can be realized with the THz-to-IR converter made of Teflon*®* film of 0.1 nm thickness, containing gold nanoparticles, ideally of 8.5 nm diameter. In order for this concept to be embodied, an elaboration of the process for making the Teflon*®* film containing gold nanoparticles is yet required. The principles applied when designing this THz-to-IR converter could be also useful in development of other devices for screening goods, non-destructive monitoring quality control, etc.
References
- (1)
B. B. Hu and M. C. Nuss, “Imaging with terahertz waves,” Opt. Lett., vol. 20, p. 1716, Aug 1995.
- (2)
K. F. A. Ross and R. E. Gordon, “Water in malignant tissue, measured by cell refractometry and nuclear magnetic resonance,” J. Microsc., vol. 128, p. 7, oct 1982.
- (3)
J. H. Chen, H. E. Avram, L. E. Crooks, M. Arakawa, L. Kaufman, and A. C. Brito, “In vivo relaxation times and hydrogen density at 0.063-4.85 T in rats with implanted mammary adenocarcinomas,” Radiology, vol. 184, p. 427, aug 1992.
PMID: 1620841.
- (4)
E. Berry, G. C. Walker, A. J. Fitzgerald, N. N. Zinov’ev, M. Chamberlain, S. W. Smye, R. E. Miles, and M. A. Smith, “Do in vivo terahertz imaging systems comply with safety guidelines?,” Journal of Laser Applications, vol. 15, no. 3, p. 192, 2003.
- (5)
C. Rønne, L. Thrane, P.-O. Åstrand, A. Wallqvist, K. V. Mikkelsen, and S. R. Keiding, “Investigation of the temperature dependence of dielectric relaxation in liquid water by THz reflection spectroscopy and molecular dynamics simulation,” The Journal of Chemical Physics, vol. 107, p. 5319, oct 1997.
- (6)
J.-H. Son, “Terahertz electromagnetic interactions with biological matter and their applications,” Journal of Applied Physics, vol. 105, p. 102033, May 2009.
- (7)
S. J. Oh, I. Maeng, H. J. Shin, J. Lee, J. Kang, S. Haam, Y.-M. Huh, J. suck Suh, and J. Hiuk Son, “Nanoparticle contrast agents for Terahertz medical imaging,” in 2008 33rd International Conference on Infrared, Millimeter and Terahertz Waves, pp. 1–2, Sept 2008.
- (8)
S. J. Oh, J. Kang, I. Maeng, J.-S. Suh, Y.-M. Huh, S. Haam, and J.-H. Son, “Nanoparticle-enabled terahertz imaging for cancer diagnosis,” Opt. Express, vol. 17, p. 3469, Mar 2009.
- (9)
S. J. Oh, J. Choi, I. Maeng, J.-S. Suh, Y.-M. Huh, S. Haam, and J.-H. Son, “High-sensitivity terahertz imaging technique using nanoparticle probes for medical applications,” in 2010 IEEE Photonics Society Winter Topicals Meeting Series (WTM), p. 52, Jan 2010.
- (10)
S. J. Oh, J. Choi, I. Maeng, J. Y. Park, K. Lee, Y.-M. Huh, J.-S. Suh, S. Haam, and J.-H. Son, “Molecular imaging with terahertz waves,” Opt. Express, vol. 19, p. 4009, Feb 2011.
- (11)
S. J. Oh, Y.-M. Huh, J.-S. Suh, J. Choi, S. Haam, and J.-H. Son, “Cancer diagnosis by terahertz molecular imaging technique,” Journal of Infrared, Millimeter, and Terahertz Waves, vol. 33, p. 74, Jan 2012.
- (12)
C. Loo, A. Lowery, N. Halas, J. West, and R. Drezek, “Immunotargeted nanoshells for integrated cancer imaging and therapy,” Nano Letters, vol. 5, p. 709, Apr 2005.
- (13)
I. H. El-Sayed, X. Huang, and M. A. El-Sayed, “Selective laser photo-thermal therapy of epithelial carcinoma using anti-egfr antibody conjugated gold nanoparticles,” Cancer Letters, vol. 239, no. 1, p. 129, 2006.
- (14)
X. Huang, I. H. El-Sayed, W. Qian, and M. A. El-Sayed, “Cancer cell imaging and photothermal therapy in the near-infrared region by using gold nanorods,” Journal of the American Chemical Society, vol. 128, p. 2115, Feb 2006.
- (15)
R. M. Woodward, V. P. Wallace, B. E. Cole, R. J. Pye, D. D. Arnone, E. H. Linfield, and M. Pepper, “Terahertz pulse imaging in reflection geometry of skin tissue using time-domain analysis techniques,” in Proc. SPIE 4625, Clinical Diagnostic Systems: Technologies and Instrumentation, p. 160, Jun 2002.
- (16)
R. M. Woodward, B. E. Cole, V. P. Wallace, R. J. Pye, D. D. Arnone, E. H. Linfield, and M. Pepper, “Terahertz pulse imaging in reflection geometry of human skin cancer and skin tissue,” Physics in Medicine and Biology, vol. 47, p. 3853, nov 2002.
- (17)
R. M. Woodward, V. P. Wallace, R. J. Pye, B. E. Cole, D. D. Arnone, E. H. Linfield, and M. Pepper, “Terahertz pulse imaging of ex vivo basal cell carcinoma,” Journal of Investigative Dermatology, vol. 120, p. 72, nov 2003.
- (18)
V. P. Wallace, A. J. Fitzgerald, S. Shankar, N. Flanagan, R. Pye, J. Cluff, and D. D. Arnone, “Terahertz pulsed imaging of basal cell carcinoma ex vivo and in vivo,” British Journal of Dermatology, vol. 151, p. 424, Aug 2004.
- (19)
V. P. Wallace, A. J. Fitzgerald, E. Pickwell, R. J. Pye, P. F. Taday, N. Flanagan, and T. Ha, “Terahertz pulsed spectroscopy of human basal cell carcinoma,” Applied Spectroscopy, vol. 60, p. 1127, Oct 2006.
- (20)
E. Pickwell and V. P. Wallace, “Biomedical applications of terahertz technology,” Journal of Physics D: Applied Physics, vol. 39, p. R301, sep 2006.
- (21)
“Infrared Cameras Inc., Mirage 640 P-series fixed / process control calibrated thermal camera with temperature measurement.” https://infraredcameras.com/thermal-infrared-products/mirage-640-p-series/.
Accessed: August 6, 2018.
- (22)
“FLIR A6700sc MWIR, science-grade MWIR INSB camera.” https://www.flir.com/products/a6700sc-mwir/.
Accessed: August 6, 2018.
- (23)
K. Moldosanov and A. Postnikov, “A terahertz-vibration to terahertz-radiation converter based on gold nanoobjects: a feasibility study,” Beilstein Journal of Nanotechnology, vol. 7, p. 983, 2016.
- (24)
A. V. Postnikov and K. A. Moldosanov, “Suggested design of gold-nanoobjects-based terahertz radiation source for biomedical research,” Nanotechnology, vol. 29, p. 285704, Jul 2018.
- (25)
“TYDEX® THz materials.” http://www.tydexoptics.com/products/thz_optics/thz_materials/.
Accessed: August 6, 2018.
- (26)
A. Postnikov and K. Moldosanov, “Phonon-assisted radiofrequency absorption by gold nanoparticles resulting in hyperthermia,” in Fundamental and Applied Nano-Electromagnetics (A. Maffucci and S. A. Maksimenko, eds.), The NATO Science for Peace and Security Programme, Series B: Physics and Biophysics, pp. 171 – 201, Dordrecht, The Netherlands: Springer, 2016.
Proceedings of the NATO Advanced Research Workshop on Fundamental and Applied Electromagnetics, Minsk, Belarus, 25-27 May, 2015.
- (27)
“TYDEX® THz lenses.” http://www.tydexoptics.com/products/thz_optics/thz_lens/.
Accessed: August 6, 2018.
- (28)
R. Kubo, “Electronic properties of metallic fine particles. i.,” J. Phys. Soc. Jpn., vol. 17, no. 6, pp. 975–986, 1962.
- (29)
R. Kubo, “Discreteness of energy levels in small metallic particles,” J. Phys. Colloques, vol. 38, pp. C2–69, jul 1977.
- (30)
K. Moldosanov and A. Postnikov, “On the plausible nature of the size effect in heterogeneous catalysis on gold nanoparticles”, https://arxiv.org/abs/1808.10607 (unpullished), 2018.
- (31)
Z. M. Zhang, Nano/Microscale Heat Transfer.
McGraw Hill professional, McGraw-Hill Education, 2007.
- (32)
N. W. Ashcroft and N. D. Mermin, Solid State Physics.
Saunders College, 1976.
- (33)
J. W. Lynn, H. G. Smith, and R. M. Nicklow, “Lattice dynamics of gold,” Phys. Rev. B, vol. 8, pp. 3493–3499, Oct 1973.
- (34)
K. A. Moldosanov, V. M. Lelevkin, P. V. Kozlov, and A. K. Kaveev, “Terahertz-to-infrared converter based on metal nanoparticles: potentialities of applications,” Journal of Nanophotonics, vol. 6, p. 061716, 2012.
- (35)
Y. Y. Gafner, S. L. Gafner, S. Zamulin, L. V. Redel, and V. S. Baidyshev, “Analysis of the heat capacity of nanoclusters of FCC metals on the example of Al, Ni, Cu, Pd, and Au,” Physics of Metals and Metallography, vol. 116, p. 568, Jun 2015.
original Russian text published in: Fizika Metallov i Metallovedenie, 2015, Vol.116, No.6, pp.602-609.
- (36)
N. Stojanovic, D. H. S. Maithripala, J. M. Berg, and M. Holtz, “Thermal conductivity in metallic nanostructures at high temperature: Electrons, phonons, and the Wiedemann-Franz law,” Phys. Rev. B, vol. 82, p. 075418, Aug 2010.
- (37)
C.-L. Huang, Y.-H. Feng, X.-X. Zhang, J. Li, G. Wang, and A.-H. Chou, “Thermal conductivity of metallic nanoparticle,” Acta Physica Sinica, vol. 62, p. 026501, Jan 2013.
- (38)
A. V. Postnikov and K. A. Moldosanov, “Non-plasmonic hyperthermia: prerequisites for realization and materials,” Journal of Nanophotonics, vol. 6, p. 061709, Oct 2012.
- (39)
N. E. Christensen, “Electronic structure of palladium and its relation to uv spectroscopy,” Phys. Rev. B, vol. 14, p. 3446, Oct 1976.
- (40)
H. Okamoto and T. B. Massalski, “The Au-Pd (gold-palladium) system,” Bulletin of Alloy Phase Diagrams, vol. 6, p. 229, Jun 1985.
- (41)
B. Lesiak and A. Jozwik, “Quantitative analysis of AuPd alloys from the shape of XPS spectra by the fuzzy rule,” Surface and Interface Analysis, vol. 36, p. 793, Aug 2004.
- (42)
T.-U. Nahm, R. Jung, J.-Y. Kim, W.-G. Park, S.-J. Oh, J.-H. Park, J. W. Allen, S.-M. Chung, Y. S. Lee, and C. N. Whang, “Electronic structure of disordered Au-Pd alloys studied by electron spectroscopies,” Phys. Rev. B, vol. 58, p. 9817, Oct 1998.
- (43)
S.-J. Oh and T.-U. Nahm, “Electronic structures of noble metal-Pd binary alloys studied by photoemission using synchrotron radiation,” Journal of Electron Spectroscopy and Related Phenomena, vol. 78, p. 43, May 1996.
- (44)
A. S. Darling, “Gold alloys for precision resistances,” Gold Bulletin, vol. 5, p. 74, Dec 1972.
- (45)
T. Rowland, N. E. Cusack, and R. G. Ross, “The resistivity and thermoelectric power of the palladium-gold alloy system,” Journal of Physics F: Metal Physics, vol. 4, p. 2189, Dec 1974.
- (46)
G. P. Gallerano and S. Biedron, “Overview of terahertz radiation sources,” in Proceedings of the 2004 FEL Conference, p. 216, 2004.
- (47)
S. A. Kuznetsov, A. G. Paulish, A. V. Gelfand, P. A. Lazorskiy, and V. N. Fedorinin, “Bolometric THz-to-IR converter for terahertz imaging,” Applied Physics Letters, vol. 99, p. 023501, Jul 2011.
- (48)
S. A. Kuznetsov, A. G. Paulish, A. V. Gelfand, P. A. Lazorskiy, V. N. Fedorinin, and A. V. Arzhannikov, “THz imaging system based on THz-to-IR converter,” Technisches Messen, vol. 78, p. 526, Nov 2011.
- (49)
S. A. Kuznetsov, A. G. Paulish, A. V. Gelfand, P. A. Lazorskiy, and V. N. Fedorinin, “Matrix structure of metamaterial absorbers for multispectral terahertz imaging,” Progress in Electromagnetics Research, vol. 122, p. 93, 2012.
- (50)
S. A. Kuznetsov, A. G. Paulish, A. V. Gelfand, M. A. Astafiev, A. V. Arzhannikov, V. N. Fedorinin, and M. K. A. Thumm, “Extremely thin metamaterial absorbers for subterahertz waves: from fundamentals towards applications in uncooled bolometric sensors,” Proc.SPIE, vol. 8423, pp. 8423–84230S–1, 2012.
- (51)
P. S. Zagubisalo, A. G. Paulish, and S. A. Kuznetsov, “Simulation of thermal processes in metamaterial MM-to-IR converter for MM-wave imager,” Journal of Physics: Conference Series, vol. 490, no. 1, p. 012174, 2014.
- (52)
A. G. Paulish and S. A. Kuznetsov, “A selective pyroelectric detector of millimeter-wave radiation with an ultrathin resonant meta-absorber,” Technical Physics Letters, vol. 42, p. 1130, Nov 2016.
published in: Pis’ma v Zhurnal Tekhnicheskoi Fiziki, 2016, Vol. 42, No. 22, pp.64-71.
- (53)
S. A. Kuznetsov, A. G. Paulish, M. Navarro-Cía, and A. V. Arzhannikov, “Selective pyroelectric detection of millimetre waves using ultra-thin metasurface absorbers,” Scientific Reports, vol. 6, p. 21079, 2016.
- (54)
“DALI D900-series – cooled FPA module.” http://www.dali-tech.us/products/d900-series-68.html.
Accessed: August 6, 2018.
- (55)
“Sofradir DAPHNIS-HD MWIR detector.” http://www.sofradir.com/product/daphnis-hd-mw/.
Accessed: August 6, 2018.
- (56)
K. A. Moldosanov and A. V. Postnikov, “Converter of terahertz vibrations into terahertz electromagnetic radiation. Russian patent RU 2650343. Priority: 20.03.2017, date of publication: 11.04.2018 (Bull. 11).” http://www1.fips.ru/fips_servl/fips_servlet?DB=RUPAT&DocNumber=2650343&TypeFile=html, 2017.
Accessed : August 7, 2018.
- (57)
K. A. Moldosanov, V. M. Lelevkin, N. Z. Kairyev, and A. V. Postnikov, “Terahertz-infrared converter for visualiation of sources of terahertz radiation. Russian patent RU 2642119. Priority: 21.06.2016, date of publication: 24.01.2018 (Bull. 3).” http://www1.fips.ru/fips_servl/fips_servlet?DB=RUPAT&DocNumber=2642119&TypeFile=html, 2016.
Accessed : August 7, 2018.
- (58)
K. Moldosanov and A. Postnikov, “Source of terahertz radiation. Russian patent RU 2622093. Priority: 13.05.2016, date of publication: 09.06.2017 (Bull. 16).” http://www1.fips.ru/fips_servl/fips_servlet?DB=RUPAT&DocNumber=2622093&TypeFile=html, 2016.
Accessed : August 7, 2018.
- (59)
K. A. Moldosanov, A. V. Postnikov, V. M. Lelevkin, and N. J. Kairyev, “Terahertz imaging technique for cancer diagnostics using frequency conversion by gold nano-objects,” Ferroelectrics, vol. 509, no. 1, p. 158, 2017.
The reference list from the paper itself. Each links out to its DOI / PubMed record.
- 1(1) B. B. Hu and M. C. Nuss, “Imaging with terahertz waves,” Opt. Lett. , vol. 20, p. 1716, Aug 1995.
- 2(2) K. F. A. Ross and R. E. Gordon, “Water in malignant tissue, measured by cell refractometry and nuclear magnetic resonance,” J. Microsc. , vol. 128, p. 7, oct 1982.
- 3(3) J. H. Chen, H. E. Avram, L. E. Crooks, M. Arakawa, L. Kaufman, and A. C. Brito, “In vivo relaxation times and hydrogen density at 0.063-4.85 T in rats with implanted mammary adenocarcinomas,” Radiology , vol. 184, p. 427, aug 1992. PMID: 1620841.
- 4(4) E. Berry, G. C. Walker, A. J. Fitzgerald, N. N. Zinov’ev, M. Chamberlain, S. W. Smye, R. E. Miles, and M. A. Smith, “Do in vivo terahertz imaging systems comply with safety guidelines?,” Journal of Laser Applications , vol. 15, no. 3, p. 192, 2003.
- 5(5) C. Rønne, L. Thrane, P.-O. Åstrand, A. Wallqvist, K. V. Mikkelsen, and S. R. Keiding, “Investigation of the temperature dependence of dielectric relaxation in liquid water by T Hz reflection spectroscopy and molecular dynamics simulation,” The Journal of Chemical Physics , vol. 107, p. 5319, oct 1997.
- 6(6) J.-H. Son, “Terahertz electromagnetic interactions with biological matter and their applications,” Journal of Applied Physics , vol. 105, p. 102033, May 2009.
- 7(7) S. J. Oh, I. Maeng, H. J. Shin, J. Lee, J. Kang, S. Haam, Y.-M. Huh, J. suck Suh, and J. Hiuk Son, “Nanoparticle contrast agents for Terahertz medical imaging,” in 2008 33rd International Conference on Infrared, Millimeter and Terahertz Waves , pp. 1–2, Sept 2008.
- 8(8) S. J. Oh, J. Kang, I. Maeng, J.-S. Suh, Y.-M. Huh, S. Haam, and J.-H. Son, “Nanoparticle-enabled terahertz imaging for cancer diagnosis,” Opt. Express , vol. 17, p. 3469, Mar 2009.