Measurement of the Antineutrino Spectrum from $^{235}$U Fission at HFIR with PROSPECT
PROSPECT Collaboration, J. Ashenfelter, A. B. Balantekin, H. R. Band,, C. D. Bass, D. E. Bergeron, D. Berish, N. S. Bowden, J. P. Brodsky, C. D., Bryan, J. J. Cherwinka, T. Classen, A. J. Conant, A. A. Cox, D. Davee, D., Dean, G. Deichert, M. V. Diwan, M. J. Dolinski
TL;DR
This paper presents the first precise measurement of the $^{235}$U antineutrino energy spectrum at a highly-enriched uranium reactor using PROSPECT, revealing deviations from theoretical models in specific energy regions.
Contribution
It provides the first large-scale measurement of the $^{235}$U antineutrino spectrum at a HEU reactor, highlighting discrepancies with existing models.
Findings
Observed 31,678 antineutrino events, the largest from HEU fission to date.
Detected deviations in the measured spectrum compared to the Huber model.
Found the spectrum shape consistent with low-enriched uranium reactor anomalies.
Abstract
This Letter reports the first measurement of the U energy spectrum by PROSPECT, the Precision Reactor Oscillation and Spectrum experiment, operating 7.9m from the 85MW highly-enriched uranium (HEU) High Flux Isotope Reactor. With a surface-based, segmented detector, PROSPECT has observed 31678304 (stat.) -induced inverse beta decays (IBD), the largest sample from HEU fission to date, 99% of which are attributed to U. Despite broad agreement, comparison of the Huber U model to the measured spectrum produces a , driven primarily by deviations in two localized energy regions. The measured U spectrum shape is consistent with a deviation relative to prediction equal in size to that observed at low-enriched uranium power reactors in the energy region of…
Click any figure to enlarge with its caption.
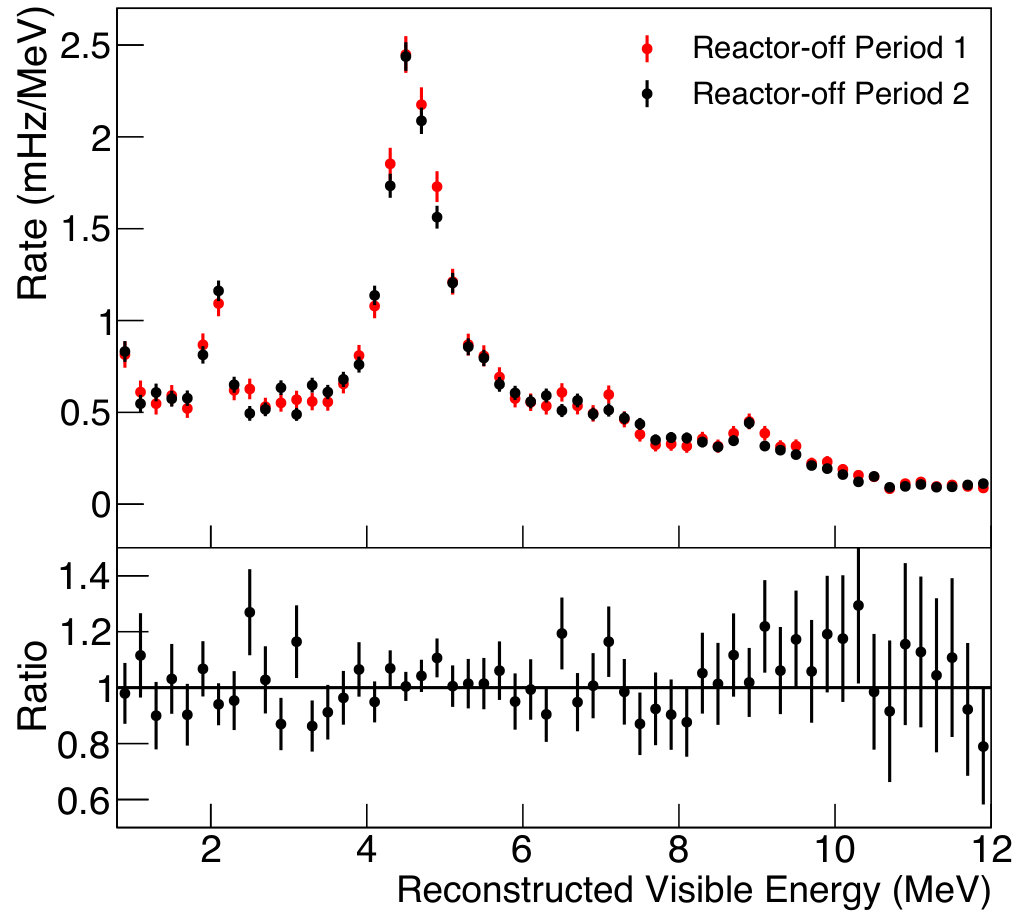 Figure 1
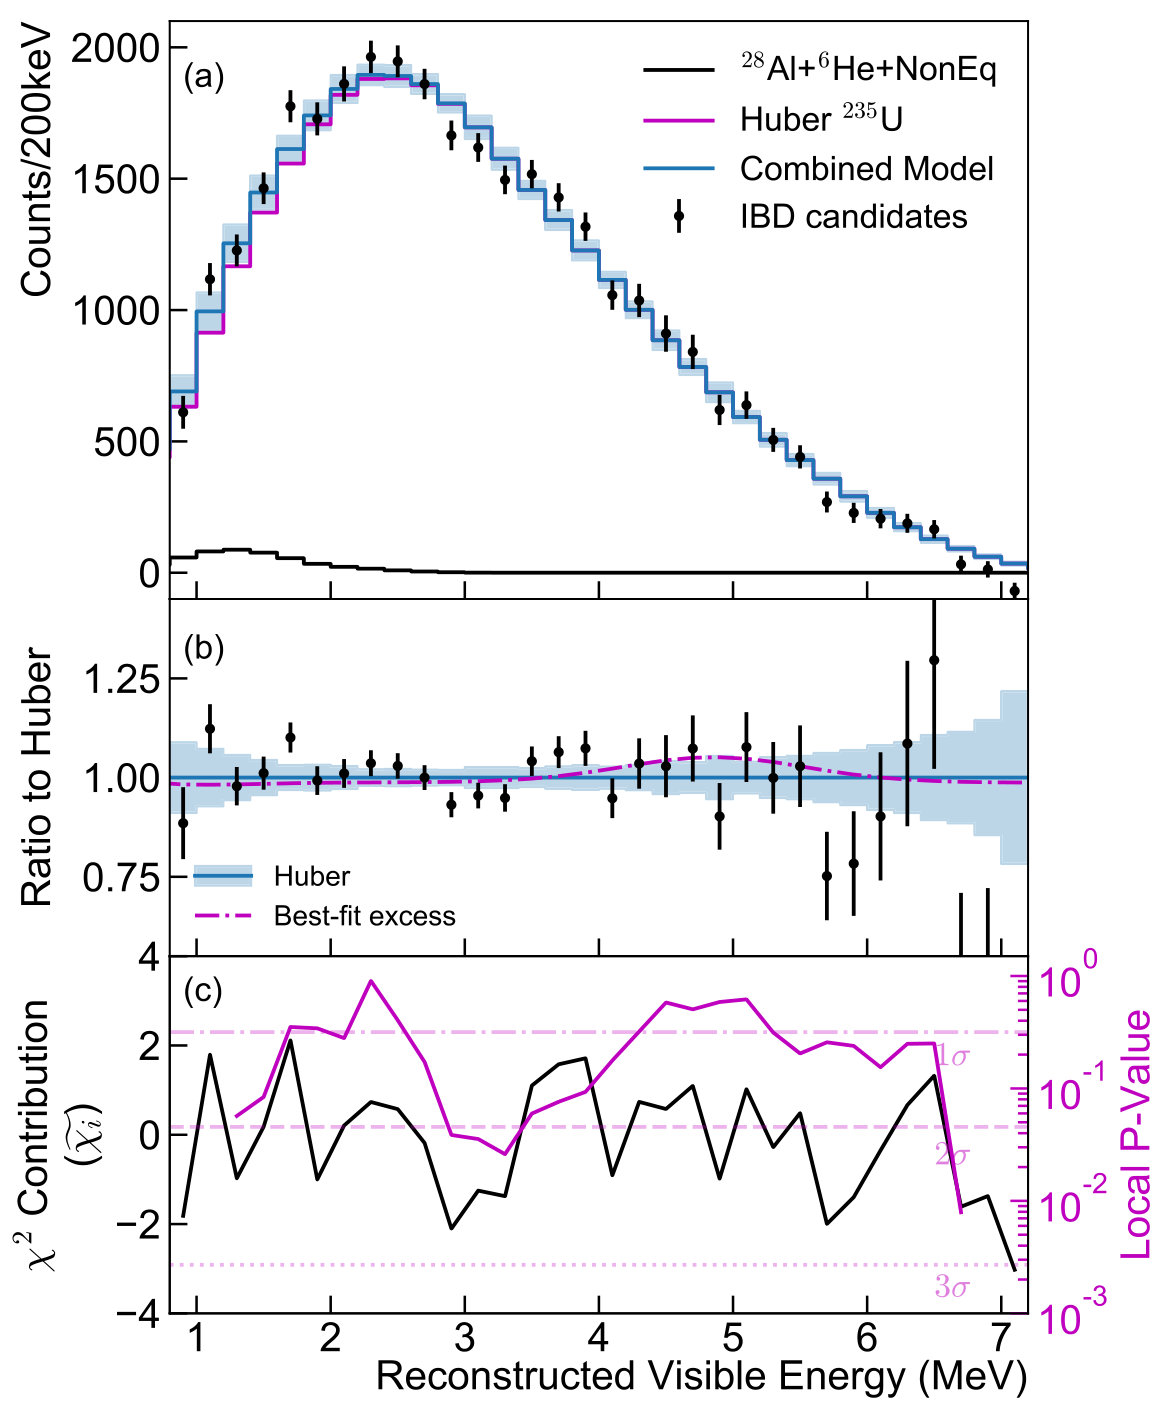 Figure 2
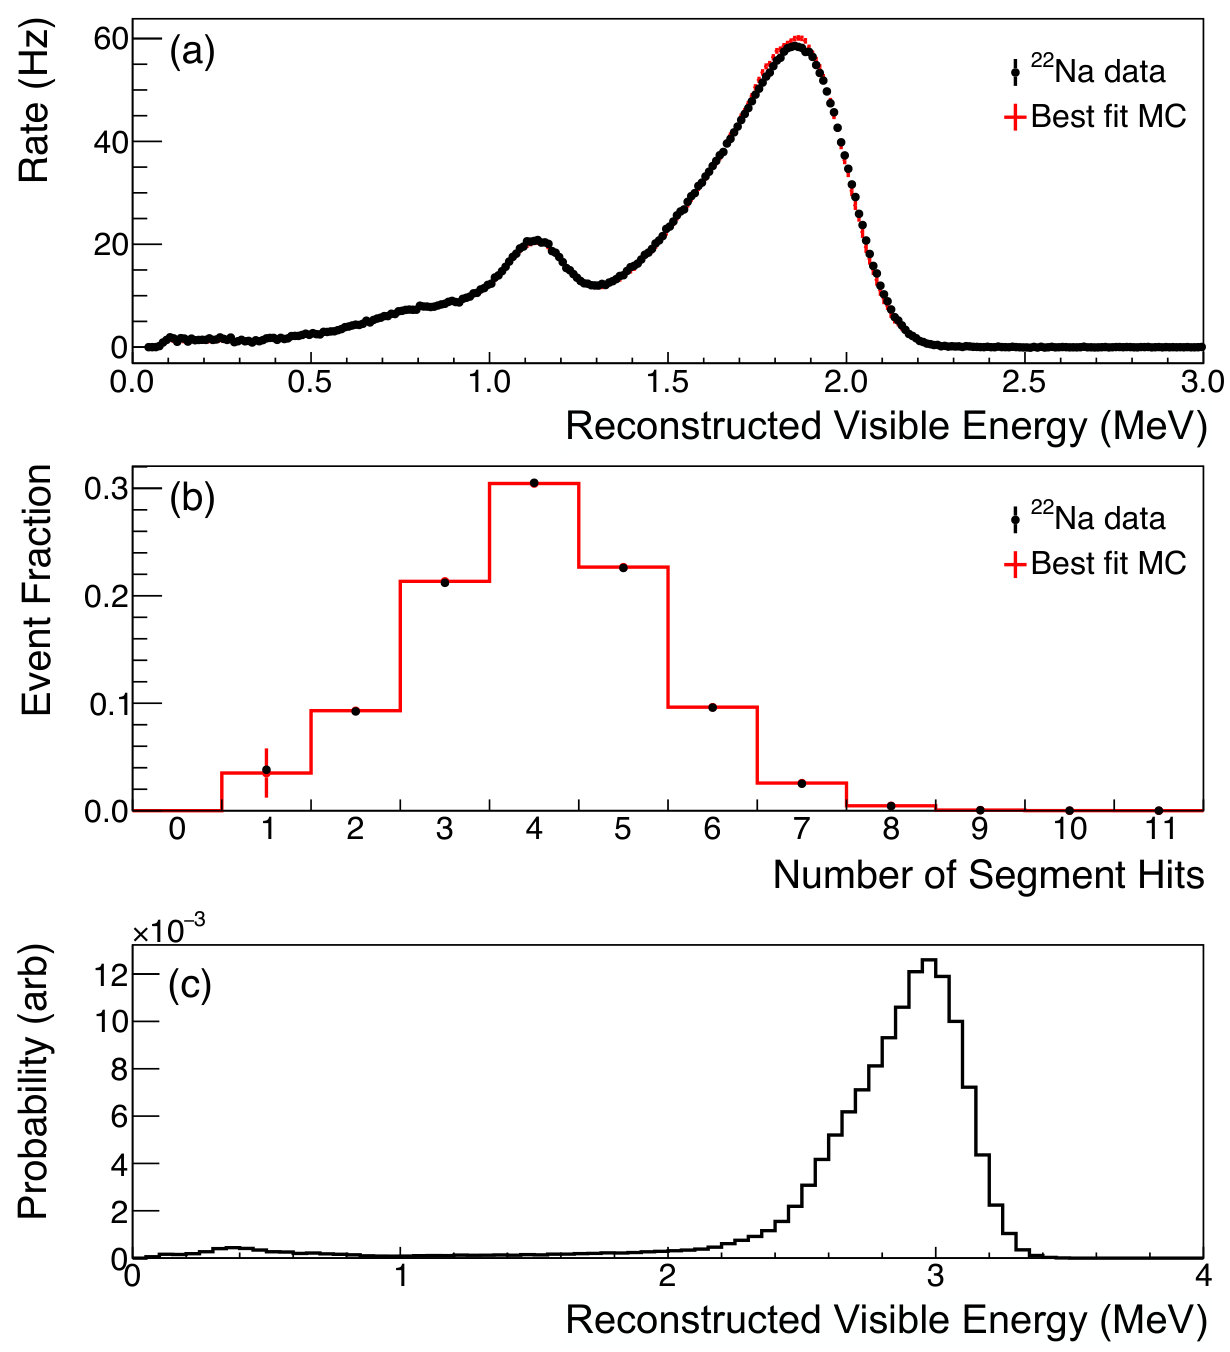 Figure 3
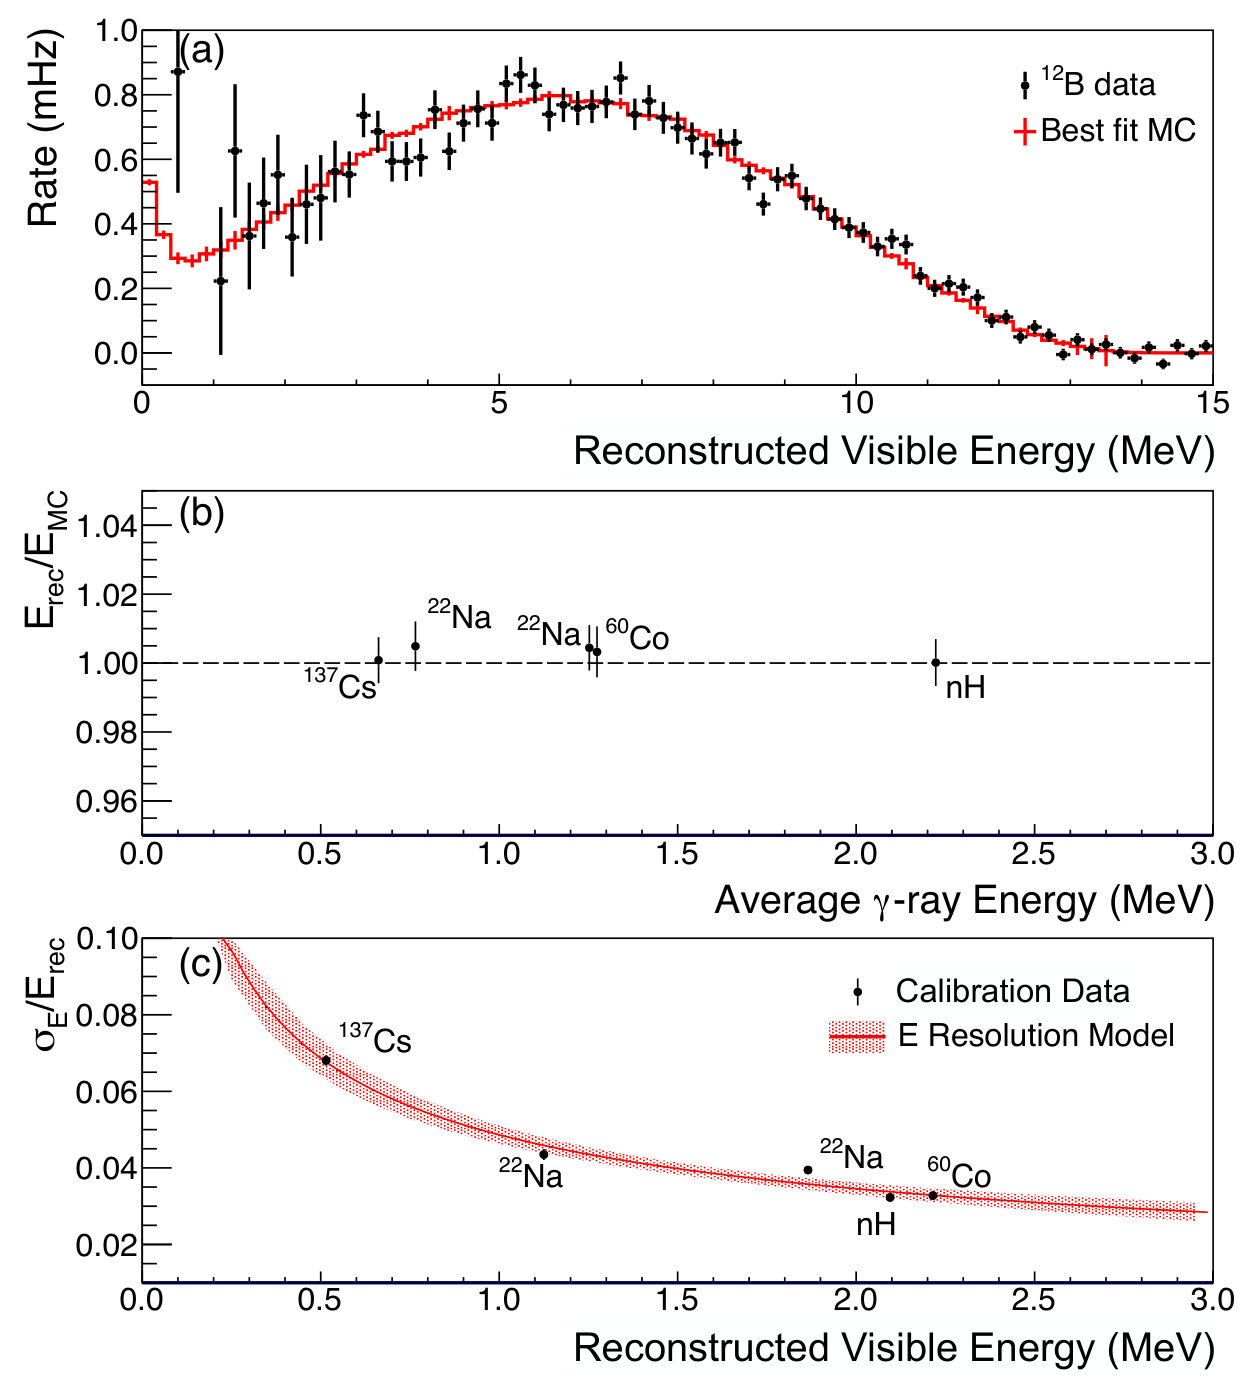 Figure 4
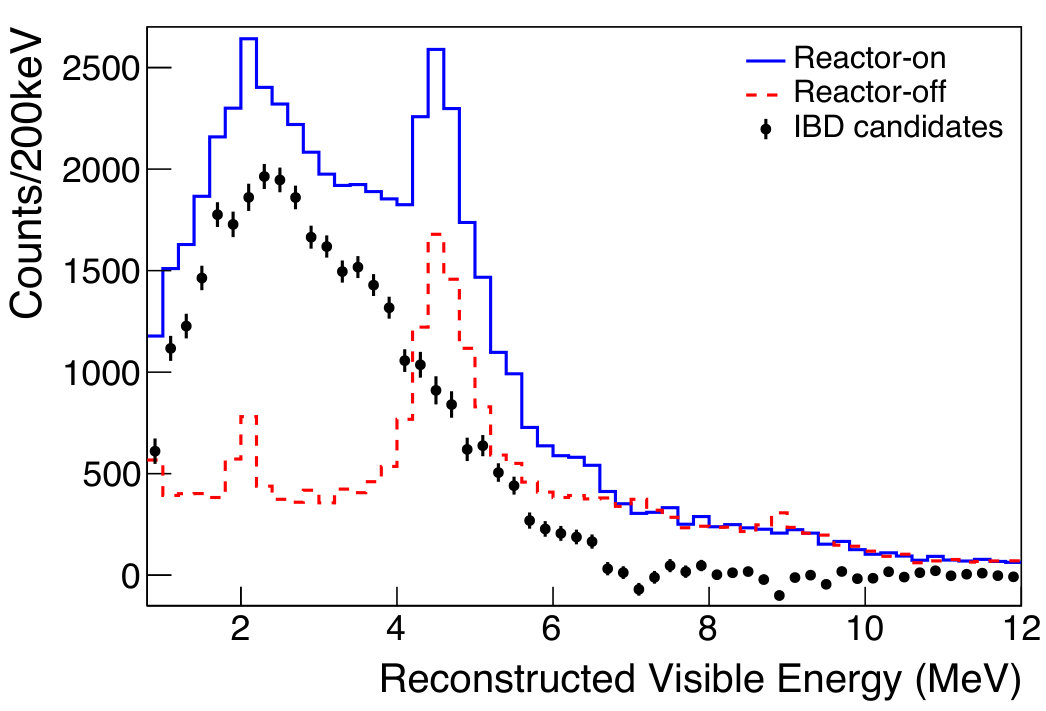 Figure 5
Peer Reviews
No public reviews on file for this paper yet. If you reviewed it on a platform where reviews are public (OpenReview, ICLR, NeurIPS, ICML), you can paste yours below so the community can read it here.
Videos
No videos yet. Explain this paper in a talk, walkthrough, or lecture? Add one.
††thanks: Also at: Department of Chemistry and Chemical Technology, Bronx Community College, Bronx, NY, USA.††thanks: Also at: Yale Center for Research Computing, Yale University, New Haven CT 06520
The PROSPECT Collaboration
Measurement of the Antineutrino Spectrum from 235U Fission at HFIR with PROSPECT
J. Ashenfelter
Wright Laboratory, Department of Physics, Yale University, New Haven, CT, USA
A. B. Balantekin
Department of Physics, University of Wisconsin, Madison, Madison, WI, USA
H. R. Band
Wright Laboratory, Department of Physics, Yale University, New Haven, CT, USA
C. D. Bass
Department of Physics, Le Moyne College, Syracuse, NY, USA
D. E. Bergeron
National Institute of Standards and Technology, Gaithersburg, MD, USA
D. Berish
Department of Physics, Temple University, Philadelphia, PA, USA
N. S. Bowden
Nuclear and Chemical Sciences Division, Lawrence Livermore National Laboratory, Livermore, CA, USA
J. P. Brodsky
Nuclear and Chemical Sciences Division, Lawrence Livermore National Laboratory, Livermore, CA, USA
C. D. Bryan
High Flux Isotope Reactor, Oak Ridge National Laboratory, Oak Ridge, TN, USA
J. J. Cherwinka
Physical Sciences Laboratory, University of Wisconsin, Madison, Madison, WI, USA
T. Classen
Nuclear and Chemical Sciences Division, Lawrence Livermore National Laboratory, Livermore, CA, USA
A. J. Conant
George W. Woodruff School of Mechanical Engineering, Georgia Institute of Technology, Atlanta, GA, USA
A. A. Cox
Institute for Quantum Computing and Department of Physics and Astronomy, University of Waterloo, Waterloo, ON, Canada
D. Davee
Department of Physics, College of William and Mary, Williamsburg, VA, USA
D. Dean
Physics Division, Oak Ridge National Laboratory, Oak Ridge, TN, USA
G. Deichert
High Flux Isotope Reactor, Oak Ridge National Laboratory, Oak Ridge, TN, USA
M. V. Diwan
Brookhaven National Laboratory, Upton, NY, USA
M. J. Dolinski
Department of Physics, Drexel University, Philadelphia, PA, USA
A. Erickson
George W. Woodruff School of Mechanical Engineering, Georgia Institute of Technology, Atlanta, GA, USA
M. Febbraro
Physics Division, Oak Ridge National Laboratory, Oak Ridge, TN, USA
B. T. Foust
Wright Laboratory, Department of Physics, Yale University, New Haven, CT, USA
J. K. Gaison
Wright Laboratory, Department of Physics, Yale University, New Haven, CT, USA
A. Galindo-Uribarri
Physics Division, Oak Ridge National Laboratory, Oak Ridge, TN, USA
Department of Physics and Astronomy, University of Tennessee, Knoxville, TN, USA
C. E. Gilbert
Physics Division, Oak Ridge National Laboratory, Oak Ridge, TN, USA
Department of Physics and Astronomy, University of Tennessee, Knoxville, TN, USA
K. E. Gilje
Department of Physics, Illinois Institute of Technology, Chicago, IL, USA
B. T. Hackett
Physics Division, Oak Ridge National Laboratory, Oak Ridge, TN, USA
Department of Physics and Astronomy, University of Tennessee, Knoxville, TN, USA
S. Hans
Brookhaven National Laboratory, Upton, NY, USA
A. B. Hansell
Department of Physics, Temple University, Philadelphia, PA, USA
K. M. Heeger
Wright Laboratory, Department of Physics, Yale University, New Haven, CT, USA
J. Insler
Department of Physics, Drexel University, Philadelphia, PA, USA
D. E. Jaffe
Brookhaven National Laboratory, Upton, NY, USA
X. Ji
Brookhaven National Laboratory, Upton, NY, USA
D. C. Jones
Department of Physics, Temple University, Philadelphia, PA, USA
O. Kyzylova
Department of Physics, Drexel University, Philadelphia, PA, USA
C. E. Lane
Department of Physics, Drexel University, Philadelphia, PA, USA
T. J. Langford
Wright Laboratory, Department of Physics, Yale University, New Haven, CT, USA
J. LaRosa
National Institute of Standards and Technology, Gaithersburg, MD, USA
B. R. Littlejohn
Department of Physics, Illinois Institute of Technology, Chicago, IL, USA
X. Lu
Physics Division, Oak Ridge National Laboratory, Oak Ridge, TN, USA
Department of Physics and Astronomy, University of Tennessee, Knoxville, TN, USA
D. A. Martinez Caicedo
Department of Physics, Illinois Institute of Technology, Chicago, IL, USA
J. T. Matta
Physics Division, Oak Ridge National Laboratory, Oak Ridge, TN, USA
R. D. McKeown
Department of Physics, College of William and Mary, Williamsburg, VA, USA
M. P. Mendenhall
Nuclear and Chemical Sciences Division, Lawrence Livermore National Laboratory, Livermore, CA, USA
J. M. Minock
Department of Physics, Drexel University, Philadelphia, PA, USA
P. E. Mueller
Physics Division, Oak Ridge National Laboratory, Oak Ridge, TN, USA
H. P. Mumm
National Institute of Standards and Technology, Gaithersburg, MD, USA
J. Napolitano
Department of Physics, Temple University, Philadelphia, PA, USA
R. Neilson
Department of Physics, Drexel University, Philadelphia, PA, USA
J. A. Nikkel
Wright Laboratory, Department of Physics, Yale University, New Haven, CT, USA
D. Norcini
Wright Laboratory, Department of Physics, Yale University, New Haven, CT, USA
S. Nour
National Institute of Standards and Technology, Gaithersburg, MD, USA
D. A. Pushin
Institute for Quantum Computing and Department of Physics and Astronomy, University of Waterloo, Waterloo, ON, Canada
X. Qian
Brookhaven National Laboratory, Upton, NY, USA
E. Romero-Romero
Physics Division, Oak Ridge National Laboratory, Oak Ridge, TN, USA
Department of Physics and Astronomy, University of Tennessee, Knoxville, TN, USA
R. Rosero
Brookhaven National Laboratory, Upton, NY, USA
D. Sarenac
Institute for Quantum Computing and Department of Physics and Astronomy, University of Waterloo, Waterloo, ON, Canada
P. T. Surukuchi
Department of Physics, Illinois Institute of Technology, Chicago, IL, USA
A. B. Telles
Wright Laboratory, Department of Physics, Yale University, New Haven, CT, USA
M. A. Tyra
National Institute of Standards and Technology, Gaithersburg, MD, USA
R. L. Varner
Physics Division, Oak Ridge National Laboratory, Oak Ridge, TN, USA
B. Viren
Brookhaven National Laboratory, Upton, NY, USA
C. White
Department of Physics, Illinois Institute of Technology, Chicago, IL, USA
J. Wilhelmi
Department of Physics, Temple University, Philadelphia, PA, USA
T. Wise
Wright Laboratory, Department of Physics, Yale University, New Haven, CT, USA
M. Yeh
Brookhaven National Laboratory, Upton, NY, USA
Y.-R. Yen
Department of Physics, Drexel University, Philadelphia, PA, USA
A. Zhang
Brookhaven National Laboratory, Upton, NY, USA
C. Zhang
Brookhaven National Laboratory, Upton, NY, USA
X. Zhang
Department of Physics, Illinois Institute of Technology, Chicago, IL, USA
Abstract
This Letter reports the first measurement of the 235U energy spectrum by PROSPECT, the Precision Reactor Oscillation and Spectrum experiment, operating 7.9 m from the 85 MWth highly-enriched uranium (HEU) High Flux Isotope Reactor. With a surface-based, segmented detector, PROSPECT has observed 31678 304 (stat.) -induced inverse beta decays (IBD), the largest sample from HEU fission to date, 99 % of which are attributed to 235U. Despite broad agreement, comparison of the Huber 235U model to the measured spectrum produces a , driven primarily by deviations in two localized energy regions. The measured 235U spectrum shape is consistent with a deviation relative to prediction equal in size to that observed at low-enriched uranium power reactors in the energy region of 5-7 MeV.
Reactor experiments have been central to the understanding of neutrinos, including the first observation of Cowan et al. (1956), the discovery of oscillations Eguchi et al. (2003), observation of produced within the Earth Araki et al. (2005), and the measurement of the neutrino mixing angle An et al. (2012); Ahn et al. (2012); Abe et al. (2012). Most of these experiments were located at low-enriched uranium (LEU) nuclear power reactors where more than 99 % of emitted come from the beta decay of fission products of four isotopes (235U, 238U, 239Pu, and 241Pu). At power reactors, the emitted flux and spectrum evolve over time as the isotopic composition changes in the fuel cycle. Comparisons between theoretical predictions and experimental results reveal a 6 % global flux deficit Mueller et al. (2011); Mention et al. (2011); Huber (2011); Fallot et al. (2012) and disagreement of the energy spectrum An et al. (2016); Abe et al. (2014); Seo (2015); Ko et al. (2017) and flux-evolution An et al. (2017a); Bak et al. (2018). Explanations for these possibly independent phenomena may lie in the complex nuclear physics of reactors Hayes et al. (2014); Dwyer and Langford (2015); Hayes et al. (2015); Wang et al. (2016); Wang and Hayes (2017); Sonzogni et al. (2017); Gebre et al. (2018); Littlejohn et al. (2018), physics beyond the Standard Model such as eV-scale sterile neutrinos Mention et al. (2011), or both Giunti et al. (2017); Dentler et al. (2017); Giunti et al. (2019). New experiments at compact-core, highly enriched uranium (HEU) research reactors enable short baseline searches for sterile neutrino oscillations and the measurement of the nearly time-independent emission of from 235U fission Allemandou et al. (2018); Abreu et al. (2017); Ashenfelter et al. (2019a). PROSPECT has recently reported a search for sterile neutrinos at the High Flux Isotope Reactor (HFIR) Ashenfelter et al. (2018a). This Letter reports the first measurement of the energy spectrum from HFIR by the PROSPECT experiment and the highest-statistics 235U spectral measurement since the ILL experiment observed 5000 candidates in 1981 Kwon et al. (1981).
Located at Oak Ridge National Laboratory, HFIR is an 85 megawatt thermal (MWth) HEU research reactor. The cylindrical reactor core (diameter: 0.435 m, height: 0.508 m) contains 93 % 235U enriched fuel, leading to a 99 % 235U fission fraction. Each 24-day operating cycle uses fresh fuel, minimizing 239Pu and 241Pu production. The PROSPECT detector is deployed in a ground-level room at a center-to-center distance of (7.9 0.1) m from the reactor core. The core center is located 40° below the horizontal and the surrounding building provides less than one meter-water-equivalent of concrete overburden.
PROSPECT uses inverse beta decay (IBD), , to detect within a 4-tonne 6Li-loaded liquid scintillator (6LiLS) target divided into an 11x14 array of optically isolated rectangular segments Ashenfelter et al. (2018b, 2019b, 2019c). The measured energy of ionization and annihilation, or prompt signal, carries the energy information. The delayed neutrons principally capture on 6Li (nLi) with an average time separation of 50 s. This prompt-delay coincident pair identifies IBD-like events. Each 14.5 cm 14.5 cm 117.6 cm segment is read out on both ends by 12.7 cm photomultiplier tubes (PMTs). Segments are rotated by 5 to create space for hollow plastic support rods at each corner, allowing radioactive sources and optical calibration inserts to be deployed adjacent to all fiducial segments.
Waveform digitizers (WFDs, 250 MHz, 14-bit) record signals generated by scintillation light collected by PMTs. The triggering scheme balances overall throughput with the need to capture small energy depositions from Compton scattering of 511 keV annihilation -rays. Observation of coincident signals in the two PMTs of any segment (combining to 150 keV deposition threshold) triggers waveform acquisition of all WFD channels. PMT signals that exceed a zero-suppression threshold are stored for offline analysis. Individual pulses are integrated to determine the amount of light observed by each PMT. The time-separation and charge-ratio of the two PMT signals from each segment are combined to determine the interaction position (z) along the segment length. The energy deposition per segment is determined from a position-corrected PE count. The relative energy scale of each segment is determined from fitting the nLi capture peak. Depositions occurring within 20 ns are summed to produce the total reconstructed visible energy (Erec). Variations in hardware digitization thresholds and light collection along segments are controlled by the application of a segment-wise 85 keV analysis threshold resulting in uniform event acceptance across the entire detector volume. A metric for particle identification, Pulse Shape Discrimination (PSD), is determined from the ratio of the PMT pulse tail to the total pulse integral, effectively separating interactions from heavy and light charged particles. Further information on the detector design and data acquisition are given in Ref. Ashenfelter et al. (2019a).
The measured response from deployed and environmental radioactive calibration sources are used to constrain the PROSPECT GEANT4-based Allison et al. (2016) Monte Carlo model (PG4). The spectra from cosmogenic 12B electrons (between [3, 13.4] MeV), neutron-hydrogen capture -rays, and centrally-deployed -ray sources (137Cs, 60Co, and 22Na) are simultaneously fit to the PG4 detector response to determine the Erec scale, nonlinearity, and resolution summed over all detector segments (Fig. 1). The segment multiplicity distributions from each calibration source are used as inputs to the fitting procedure. The event topology of 22Na events closely resembles IBD positrons (a primary interaction accompanied by annihilation -rays). Fig. 2 shows the comparison of the event multiplicity with the best-fit MC model. Nonlinear scintillator response at low energies is parameterized using a combined Birks and Cherenkov model BIRKS (1964); Patrignani et al. (2016), and a photo-statistics dominated energy resolution of 4.8 % is observed at 1 MeV.
As described in Ashenfelter et al. (2018a), a wide range of observables are used to track detector response stability and uniformity. For the data taking period considered here, Erec and energy resolutions are stable to within 1 % and 10 %, respectively, and z-position and z-resolution are stable to 5 cm and 10 %, over all times and segments. Small variation of segment-level resolutions are unified through the addition of event-level smearing resulting in a 5 % energy resolution at 1 MeV for all segments.
A detector response matrix is constructed by generating narrow bands, 50 keV wide, of energies spanning 1.8 to 10 MeV in PG4 and recording their separate Erec spectra. One of these simulated Erec spectra (4.0-4.05 MeV ) is shown in Fig. 2. The main peak is shifted downward due to scintillator non-linearity and broadened from escaping annihilation -rays. Events with low prompt energy (0.5 MeV) are observed from IBD interactions which originate in inactive material but whose annihilation -rays and neutrons are detected in the active volume. The response matrix is used to convert from energy to the experimental prompt Erec space sup .
During the data collection period considered here, a number of PMTs displayed current instabilities. These were powered down and a total of 33 segments are excluded from the analysis. This has two main impacts on the analysis. Disabled segments reduce the efficiency of neighboring segments by lowering the acceptance of neutron captures outside of the primary interaction segment. The increase in inactive material in the fiducial volume leads to an enhanced number of events with degraded energy, from missing either positron or annihilation -ray energy depositions. The disabled segments are included in PG4 to ensure that the detector response matrix accurately captures this effect.
The selection criteria to identify IBD candidates based on the prompt positron signal and a time- and position-correlated delayed nLi signal are similar to that described in Ref. Ashenfelter et al. (2018a). PSD cuts are based on measured segment-wise performance to minimize bias between segments. A time-separation selection of (1,120) s and position separation cut of 15 cm reduce accidental coincidences. Prompt and delayed events with reconstructed positions in an outermost veto layer (1 segment width top and sides, two segment width bottom, 44.8 cm from segment center) are rejected to reduce backgrounds from cosmogenic showers and -rays from nearby experimental activity. IBD candidates that occur within 200s after a muon interaction are vetoed to suppress multiple neutron capture events. Candidates that occur within a (-250, 250) s window of a neutron capture or nuclear recoil with Erec 0.25 MeV are rejected. The frequency of the veto conditions above is used to determine the veto dead time throughout detector operation, which ranges from 11 % to 14 % due to time-varying -ray backgrounds that enter the nuclear recoil band.
IBD candidate events with prompt Erec from 0.8 to 7.2 MeV are considered. The 40.3 (37.8) exposure-day reactor-on (reactor-off) data set includes 70811 267 (stat.) (20036 145 (stat.)) IBD candidates and 20534 16 (stat.) (1436 4 (stat.)) accidental coincidences measured by a 10 ms wide off-time window, resulting in 50277 267 (stat.) (18600 145 (stat.)) correlated events. A bin-wise subtraction of reactor-on and reactor-off correlated candidates yields the prompt Erec spectrum of 31678 304 (stat.) detected shown in Fig. 3. A correlated signal-to-background ratio of 1.7:1 is observed.
After all cuts are applied, the dominant backgrounds are produced by cosmogenic activity. The IBD-like background spectrum is comprised of three components. The 4.4 MeV peak and continuum are from fast neutron primary inelastic scattering on carbon and other material in the detector volume. The observed 2.2 MeV peak is from multiple neutron events where the first captures on hydrogen. These are produced by a combination of muon and fast neutron primaries. The correlation of background rate with local atmospheric pressure is characterized during reactor-off periods and results in a correction factor of 0.991 0.004 based on the average pressure during reactor-on periods Lockwood and Yingst (1956); orn .
Multiple validations of the energy reconstruction, background subtraction methods, and the PG4 detector model have been performed. This is particularly important given the segmented nature of the PROSPECT detector, the presence of inactive volume, and the prominent features present in the near-surface background spectrum. Subdivisions of the dataset based on acquisition time and event position are used as the primary validation method. The reactor-off data are split into two time periods (Fig. 4) and their ratio between 0.8-12 MeV is compared to unity, yielding a of 35.6/56 and validating the atmospheric pressure scaling and energy reconstruction stability. Similarly, the reactor-on and off data are each split into two independent data sets and the full analysis is performed on each portion separately. Their ratio is compared to unity in the analysis window yielding a of 18.6/32. Several division schemes based on event position were also examined by splitting the detector in quadrants, near and far halves from the reactor, and inner and outer segment regions. Consistency was found between the spectra independently measured in the first two cases, while differences in relative spectral shape due to greater energy leakage in the outer segments were successfully reproduced by the PG4 model.
A test is employed to quantify the comparison of the background-subtracted experimental data to model prediction:
[TABLE]
where is the difference between the measured and predicted spectra including a free-floating nuisance parameter for normalization () and is the full covariance matrix. Simulations are performed separately varying detector parameters, including energy scale, inactive material, energy thresholds, and fiducialization according to experimental uncertainties. Covariance matrices are generated for each parameter to capture both correlated and uncorrelated uncertainties. The observed variation between the two reactor-off periods is used to construct a background subtraction covariance matrix. An additional background subtraction uncertainty (4 %) is included to account for observed variation between the muon-induced and fast-neutron induced background components. Finally, the uncorrelated statistical uncertainties from the reactor-on and off periods are used to build the full covariance matrix sup .
The Huber 235U spectrum Huber (2011) is adjusted for the IBD cross-section and passed through the PROSPECT detector response matrix to response matrix to translate energy to a prompt energy prediction. The three-neutrino framework is assumed and no correction is made for possible spectral distortions from sterile neutrino oscillations. Corrections for non-equilibrium isotopes produced during the 24-day reactor cycle are calculated according to the procedure in Ref. Mueller et al. (2011). A detailed SCALE (ORIGEN) model of the core is used to estimate the flux generated via beta decay of 28Al and 6He nuclei produced by neutron capture on the fuel cladding and beryllium reflector Ilas et al. (2015); Oak Ridge National Laboratory (2011); X-5 Monte Carlo Team (2005). The spectra are generated according to ENDF and ENSDF data using the Oklo toolkit Schmidt et al. (1982); Dwyer (2015) and added to the model with 100 % uncertainties. Integrated over the full spectrum, each correction amounts to less than 1 % of the total flux sup . Spent nuclear fuel does not contribute a significant number of interactions.
The shape-only comparison between the measured and predicted spectra is shown in Fig. 5. A high is observed (51.4/31), with a one-sided p-value of 0.01. The bottom panel of Fig. 5 shows the signed contribution per bin (). Due to non-zero off-diagonal covariance matrix elements, is determined by adding an additional free-floating nuisance parameter to each bin separately and observing the change in the minimized :
[TABLE]
To quantify the significance of local deviations from the Huber prediction, a procedure similar to Ref. An et al. (2017b) is employed. Additional free-floating nuisance parameters are included to modify from Eqn. 1 for each bin within a 1 MeV-wide sliding energy window and a new minimum is determined. The change in , representative of the fraction of the global contributed by that energy window, is then converted into a local p-value with five degrees of freedom, one for each bin in the window. As shown in Fig. 5, there is not one region that dominates the disagreement. Two regions of the spectrum have local p-values between 2-3, 2.8-3.5 MeV and 6.5 MeV.
Spectral measurements at LEU reactors, with 50-60 % 235U fission-fraction, have observed large deviations from predictions between 5 and 7 MeV energy region. To compare PROSPECT’s measured HEU spectrum with those from LEU reactors, an ad-hoc model is constructed from the addition of a Gaussian to the Huber 235U model whose mean and width are fitted to the reported spectrum in Ref. An et al. (2017b), following studies detailed in Refs. Buck et al. (2017); Huber (2017). The normalization of this Gaussian, , is fit to the prompt Erec spectrum through a regression utilizing the full covariance matrix. A best-fit distortion, shown in Fig. 5b, of = 0.69 0.53 is observed. PROSPECT’s behavior in this region is compatible with both the Huber 235U model and a local deviation of equal size to that observed by Daya Bay ( = 1). A Gaussian normalization of =1.78 would be required for 235U to be solely responsible for the observed LEU spectral distortion, which is disfavored at 2.1.
With a surface-based, segmented detector, PROSPECT has produced the highest statistics measurement of 235U spectrum to date. Despite broad agreement, the Huber 235U model exhibits a large with respect to the measured spectrum. This observed 235U spectrum is consistent with an ad-hoc model representing the local deviation relative to prediction observed between 5-7 MeV Eν at LEU reactors. This is a statistics-limited measurement and is expected to improve as more data are collected.
This material is based upon work supported by the following sources: US Department of Energy (DOE) Office of Science, Office of High Energy Physics under Award No. DE-SC0016357 and DE-SC0017660 to Yale University, under Award No. DE-SC0017815 to Drexel University, under Award No. DE-SC0008347 to Illinois Institute of Technology, under Award No. DE-SC0016060 to Temple University, under Contract No. DE-SC0012704 to Brookhaven National Laboratory, and under Work Proposal Number SCW1504 to Lawrence Livermore National Laboratory. This work was performed under the auspices of the U.S. Department of Energy by Lawrence Livermore National Laboratory under Contract DE-AC52-07NA27344 and by Oak Ridge National Laboratory under Contract DE-AC05-00OR22725. Additional funding for the experiment was provided by the Heising-Simons Foundation under Award No. #2016-117 to Yale University.
J.G. is supported through the NSF Graduate Research Fellowship Program and A.C. performed work under appointment to the Nuclear Nonproliferation International Safeguards Fellowship Program sponsored by the National Nuclear Security Administration’s Office of International Nuclear Safeguards (NA-241). This work was also supported by the Canada First Research Excellence Fund (CFREF), and the Natural Sciences and Engineering Research Council of Canada (NSERC) Discovery program under grant #RGPIN-418579, and Province of Ontario.
We further acknowledge support from Yale University, the Illinois Institute of Technology, Temple University, Brookhaven National Laboratory, the Lawrence Livermore National Laboratory LDRD program, the National Institute of Standards and Technology, and Oak Ridge National Laboratory. We gratefully acknowledge the support and hospitality of the High Flux Isotope Reactor and Oak Ridge National Laboratory, managed by UT-Battelle for the U.S. Department of Energy.
The reference list from the paper itself. Each links out to its DOI / PubMed record.
- 1Cowan et al. (1956) C. L. Cowan, F. Reines, F. B. Harrison, H. W. Kruse, and A. D. Mc Guire, Science 124 , 103 (1956) . · doi ↗
- 2Eguchi et al. (2003) K. Eguchi et al. (Kam LAND), Phys. Rev. Lett. 90 , 021802 (2003) , ar Xiv:hep-ex/0212021 [hep-ex] . · doi ↗
- 3Araki et al. (2005) T. Araki et al. , Nature 436 , 499 (2005) . · doi ↗
- 4An et al. (2012) F. P. An et al. (Daya Bay), Phys. Rev. Lett. 108 , 171803 (2012) , ar Xiv:1203.1669 [hep-ex] . · doi ↗
- 5Ahn et al. (2012) J. K. Ahn et al. (RENO), Phys. Rev. Lett. 108 , 191802 (2012) , ar Xiv:1204.0626 [hep-ex] . · doi ↗
- 6Abe et al. (2012) Y. Abe et al. (Double Chooz), Phys. Rev. Lett. 108 , 131801 (2012) , ar Xiv:1112.6353 [hep-ex] . · doi ↗
- 7Mueller et al. (2011) T. A. Mueller et al. , Phys. Rev. C 83 , 054615 (2011) , ar Xiv:1101.2663 [hep-ex] . · doi ↗
- 8Mention et al. (2011) G. Mention, M. Fechner, T. Lasserre, T. A. Mueller, D. Lhuillier, M. Cribier, and A. Letourneau, Phys. Rev. D 83 , 073006 (2011) , ar Xiv:1101.2755 [hep-ex] . · doi ↗