On the absence of dark matter in dwarf galaxies surrounding the Milky Way
Francois Hammer, Yanbin Yang, Jianling Wang, Frederic Arenou, Mathieu, Puech, Hector Flores

TL;DR
This paper proposes that the observed velocity dispersions in Milky Way dwarf spheroidals can be explained without dark matter, attributing them instead to tidal shocks from the Milky Way, challenging traditional dark matter assumptions.
Contribution
It introduces a model where MW dwarf spheroidals are dark matter-free and their properties result from tidal shocks, not dark matter, offering an alternative explanation for their dynamics.
Findings
Velocity dispersions can be explained by tidal shocks in DM-free systems.
The acceleration from tidal shocks matches observed self-gravity acceleration.
Dwarf spheroidals may have negligible dark matter content.
Abstract
This paper presents an alternative scenario to explain the observed properties of the Milky Way dwarf Spheroidals (MW dSphs). We show that instead of resulting from large amounts of dark matter (DM), the large velocity dispersions observed along their lines of sight can be entirely accounted for by dynamical heating of DM-free systems resulting from MW tidal shocks. Such a regime is expected if the progenitors of the MW dwarfs are infalling gas-dominated galaxies. In this case, gas lost through ram-pressure leads to a strong decrease of self-gravity, a phase during which stars can radially expand, while leaving a gas-free dSph in which tidal shocks can easily develop. The DM content of dSphs is widely derived from the measurement of the dSphs self-gravity acceleration projected along the line of sight. We show that the latter strongly anti-correlates with the dSph distance from the…
Click any figure to enlarge with its caption.
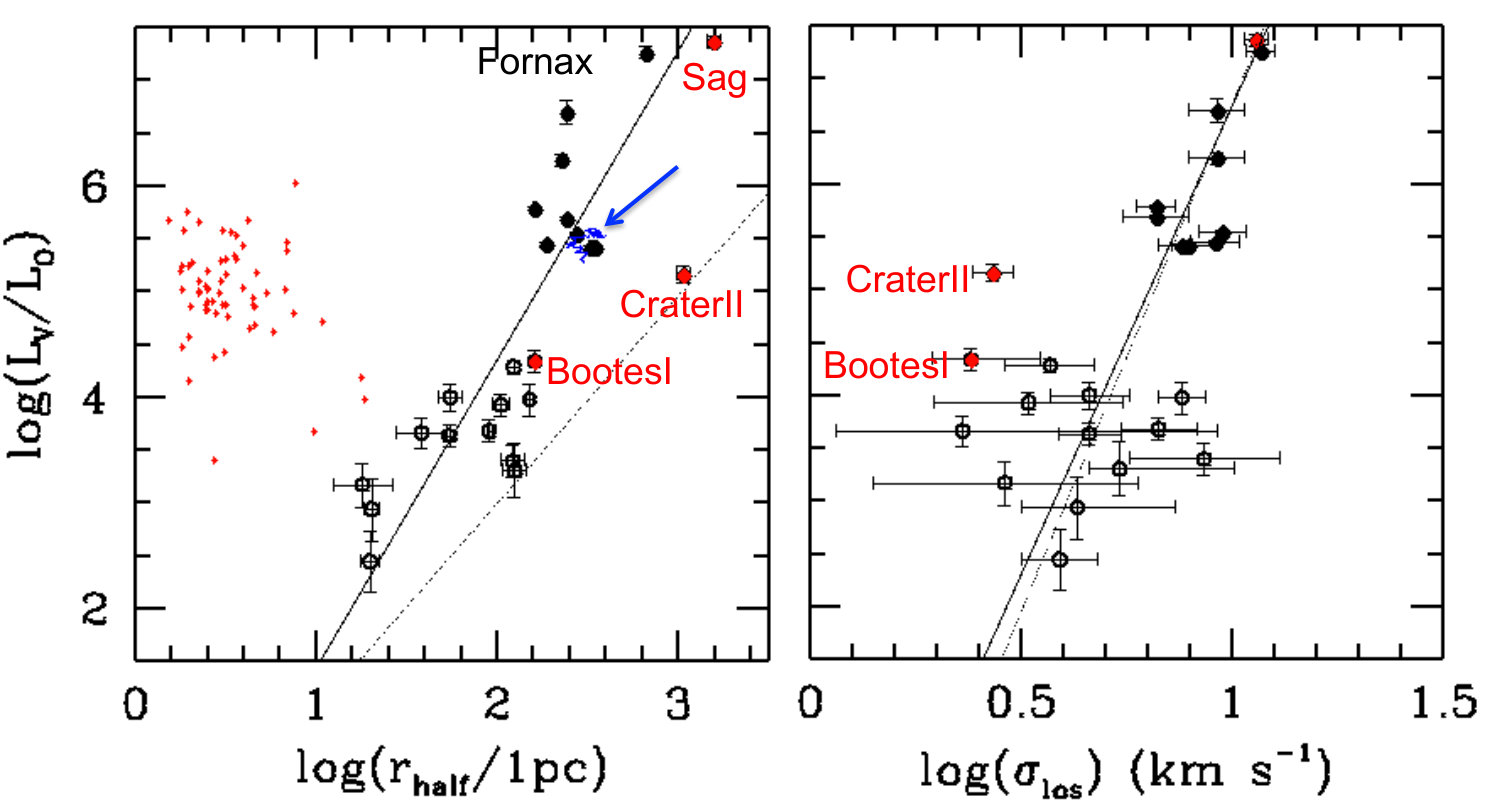 Figure 1
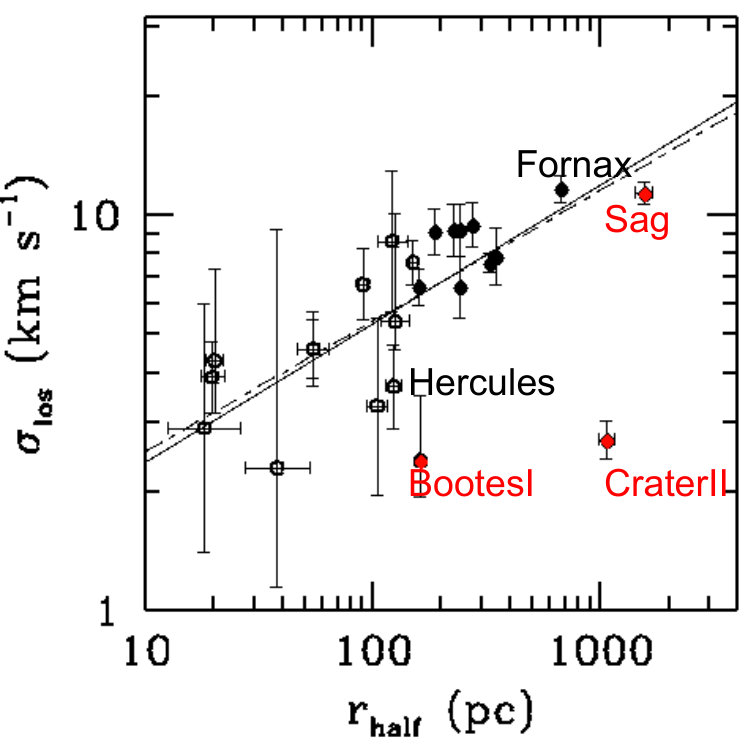 Figure 2
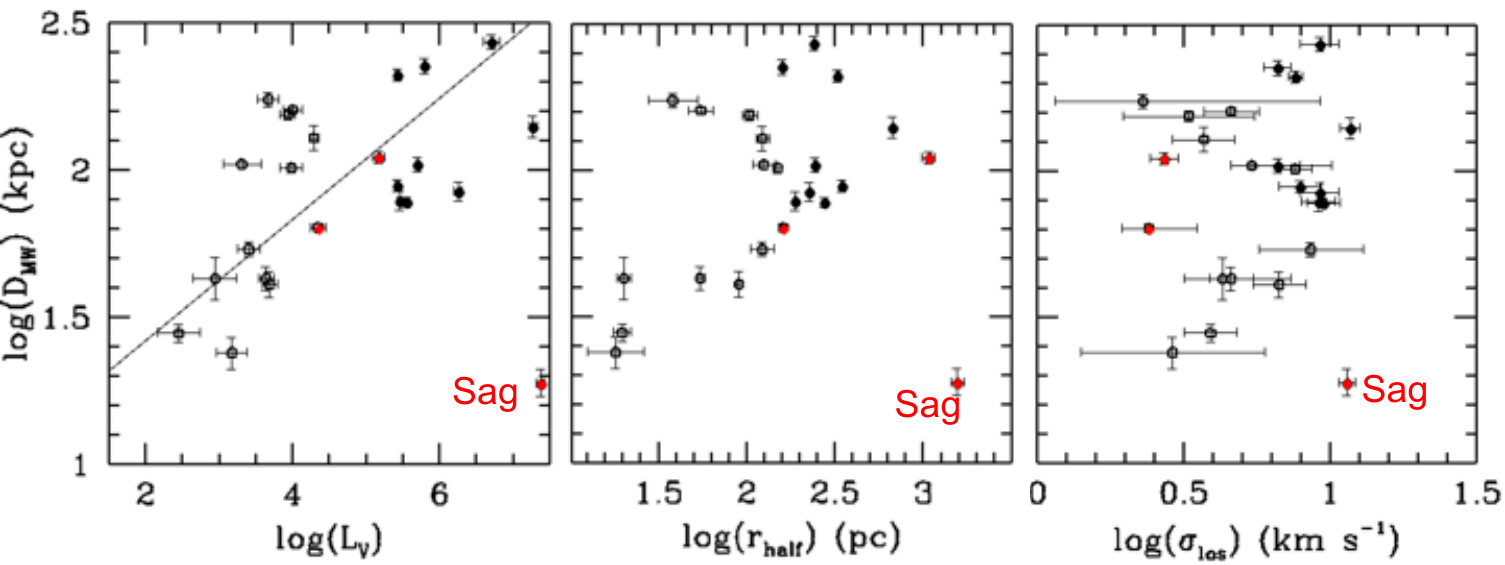 Figure 3
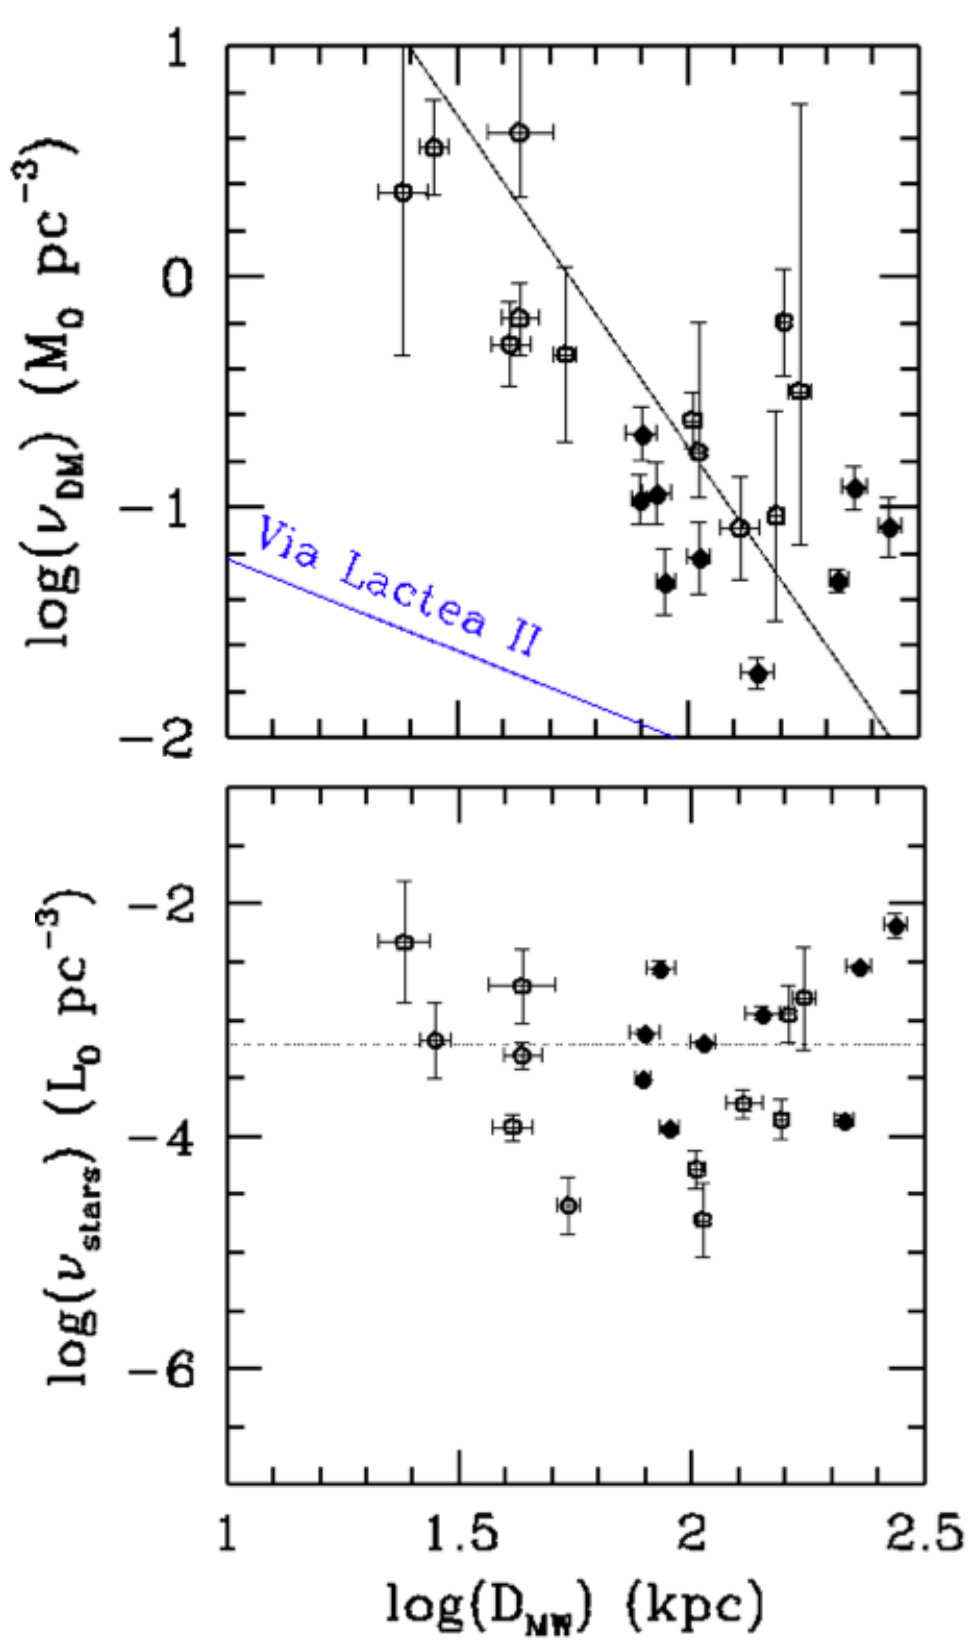 Figure 4
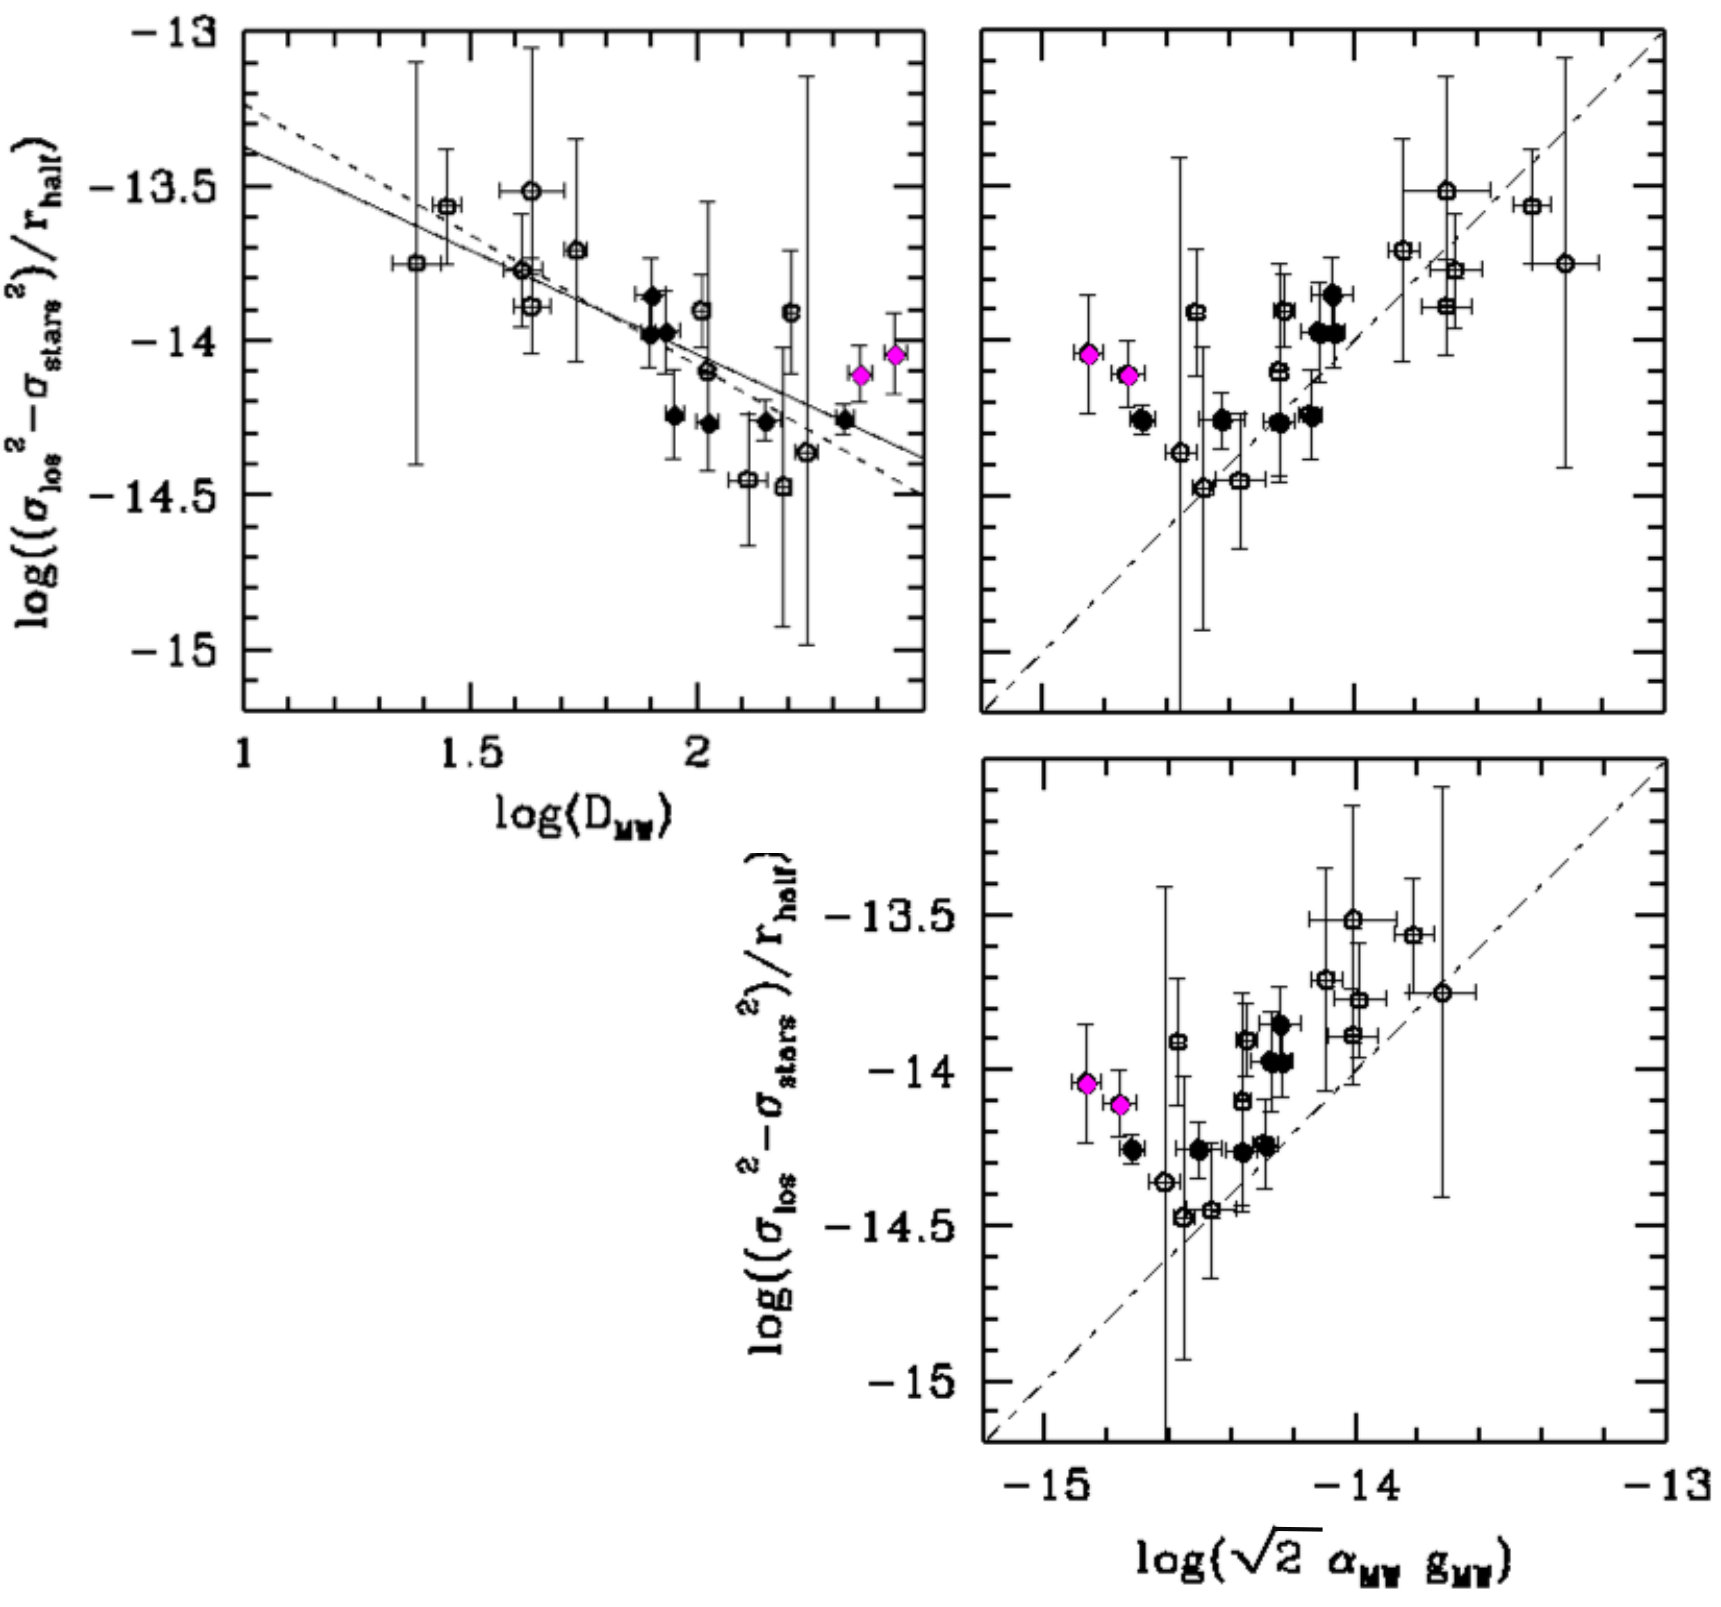 Figure 1
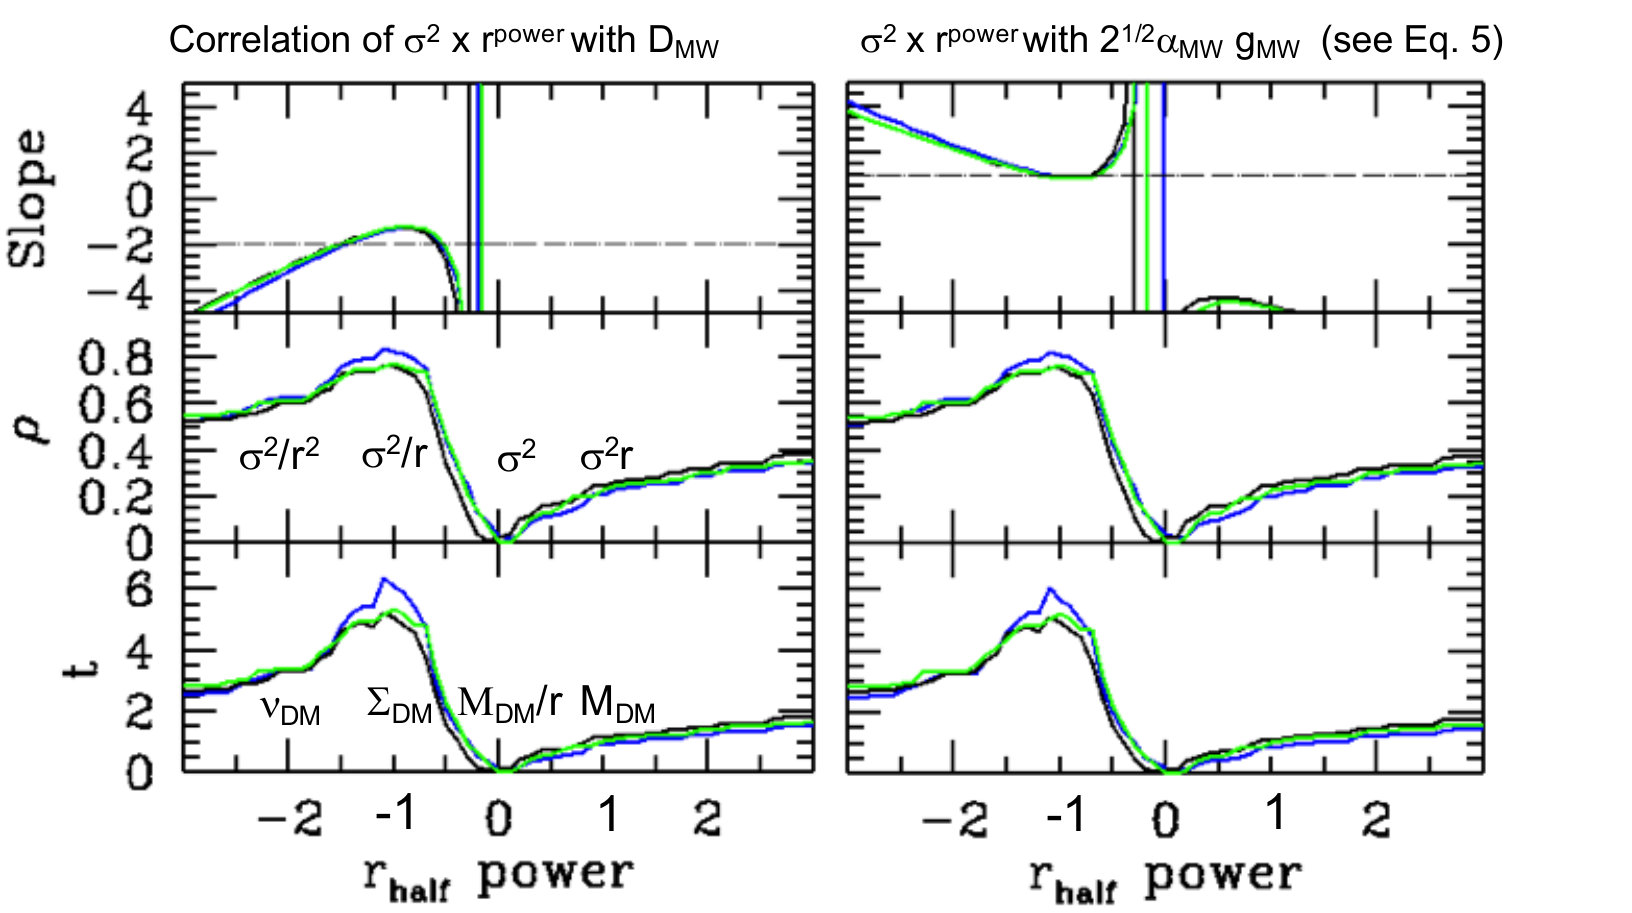 Figure 2
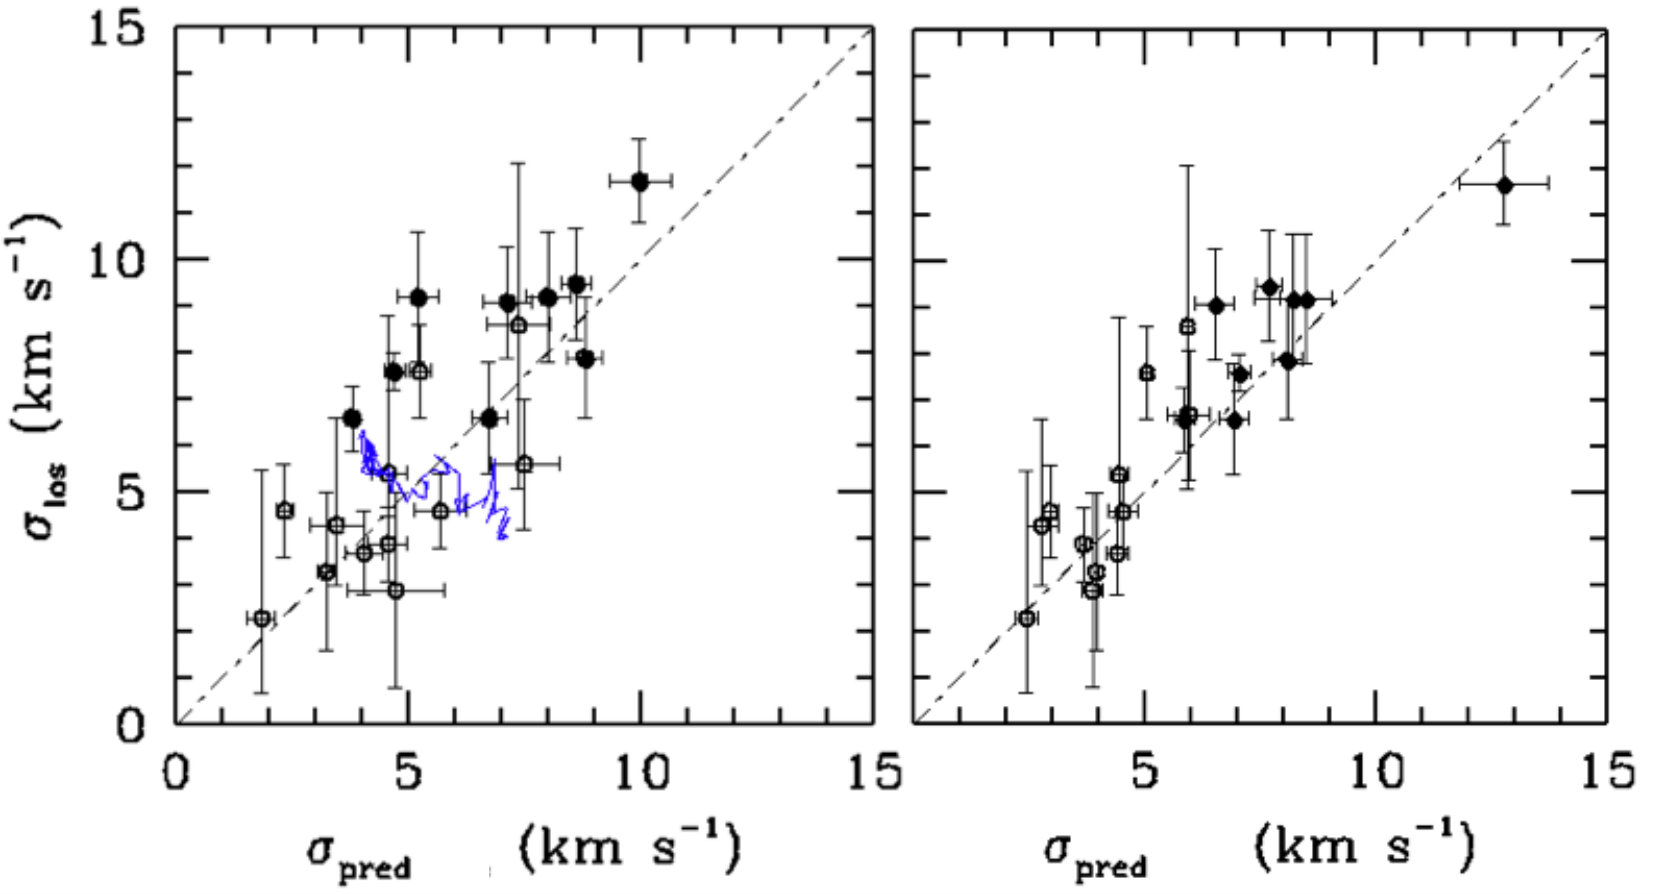 Figure 3
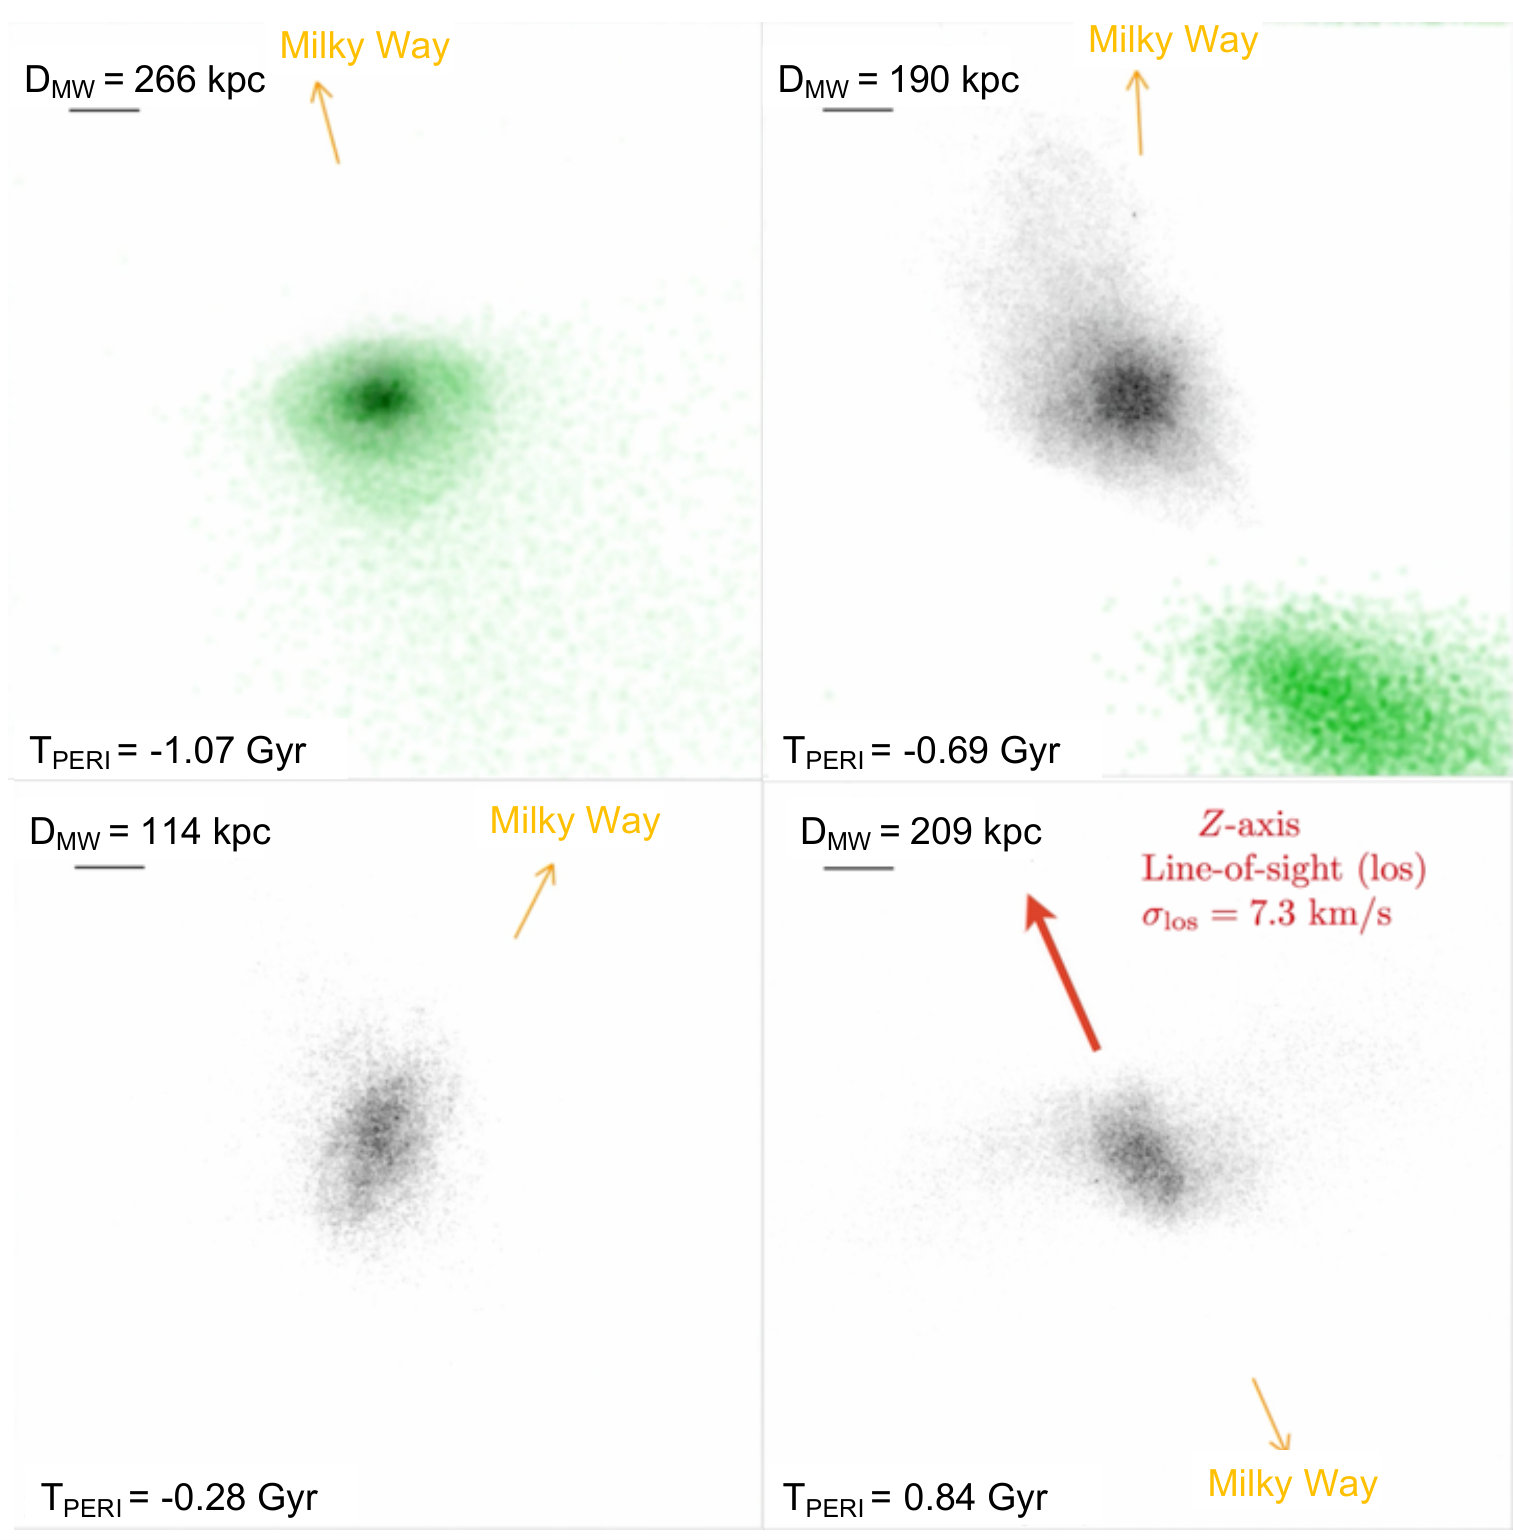 Figure 8
| name | + | - | DMW | |||||||||||||
| ( ) | (pc) | ( ) | (kpc) | ( ) | (kpc) | () | ( ) | () | ||||||||
| (1) | (2) | (3) | (4) | (5) | (6) | (7) | (8) | (9) | (10) | (11) | (12) | (13) | (14) | (15) | (16) | (17) |
| Draco2 | 0.001497 | 7.14 | 20.73 | 7.636 | 2.9 | 2.1 | 2.1 | 24.46 | 3 | -335.0 | 1.6 | 24 | 2.5 | -175.5 | 24.0 | 0.24 |
| Segue1 | 2.811 | 1.888 | 24.11 | 2.79 | 3.9 | 0.8 | 0.8 | 24.96 | 2 | 203.6 | 0.9 | 28 | 2.5 | 112.6 | 17.0 | 0.33 |
| UMaII | 0.004838 | 0.001157 | 136.3 | 5.325 | 6.7 | 1.4 | 1.4 | 35.69 | 4 | -115.4 | 1.9 | 41 | 2.5 | -34.73 | 13.0 | 0.56 |
| Willman1 | 8.77 | 5.971 | 27.7 | 2.4 | 4.3 | 2.3 | 1.3 | 39.43 | 7 | -9.447 | 2.5 | 43 | 2.5 | 34.51 | 9.8 | 0.47 |
| Coma | 0.004351 | 0.001001 | 68.59 | 3.615 | 4.6 | 0.8 | 0.8 | 43.33 | 4 | 103.5 | 0.9 | 43 | 2.5 | 81.89 | 10.5 | 0.37 |
| TucanaII | 0.002513 | 8.975 | 156.3 | 23.68 | 8.6 | 3.5 | 3.5 | 58.64 | 3 | -133.0 | 2.0 | 54 | 2.5 | -204.1 | 0.0 | 0.39 |
| Draco | 0.2822 | 0.01299 | 222.4 | 2.079 | 9.1 | 1.2 | 1.2 | 79.83 | 6 | -276.3 | 0.1 | 79 | 2.5 | -95.74 | 6.4 | 0.29 |
| UMi | 0.3516 | 0.01617 | 407.0 | 2.0 | 9.5 | 1.2 | 1.2 | 76.92 | 3 | -235.4 | 0.1 | 78 | 2.5 | -84.65 | 6.0 | 0.55 |
| Sculptor | 1.782 | 0.2295 | 276.4 | 0.9872 | 9.2 | 1.4 | 1.4 | 85.67 | 6 | 103.2 | 0.1 | 85 | 2.5 | 78.37 | 5.6 | 0.33 |
| Sextans | 0.2612 | 0.01443 | 412.1 | 2.993 | 7.9 | 1.3 | 1.3 | 86.65 | 4 | 217.3 | 0.1 | 89 | 2.5 | 71.69 | 5.0 | 0.3 |
| UMaI | 0.009591 | 0.003353 | 234.2 | 10.01 | 7.6 | 1.0 | 1.0 | 97.81 | 4 | -52.95 | 1.4 | 102 | 2.5 | -7.887 | 4.7 | 0.59 |
| Aquarius2 | 0.00203 | 0.0012 | 160.0 | 24.0 | 5.4 | 3.4 | 0.9 | 108.1 | 3 | -67.03 | 2.5 | 105 | 2.5 | 41.55 | 13.0 | 0.39 |
| Carina | 0.4921 | 0.02264 | 303.1 | 2.952 | 6.6 | 1.2 | 1.2 | 104.0 | 6 | 207.2 | 0.1 | 105 | 2.5 | 6.571 | 2.7 | 0.36 |
| Hercules | 0.01934 | 0.003025 | 221.1 | 17.4 | 3.7 | 0.9 | 0.9 | 134.8 | 12 | 62.04 | 1.1 | 129 | 2.5 | 146.5 | 2.7 | 0.69 |
| Fornax | 18.56 | 2.39 | 792.5 | 2.837 | 11.7 | 0.9 | 0.9 | 139.4 | 12 | 41.98 | 0.1 | 141 | 1.5 | -34.03 | 3.2 | 0.29 |
| LeoIV | 0.008555 | 0.002047 | 114.3 | 12.03 | 3.3 | 1.7 | 1.7 | 154.8 | 6 | 131.3 | 1.4 | 155 | 2.5 | 13.3 | 3.0 | 0.17 |
| CVenII | 0.01009 | 0.002969 | 70.83 | 11.22 | 4.6 | 1.0 | 1.0 | 160.8 | 4 | -120.8 | 1.2 | 161 | 2.5 | -95.23 | 3.0 | 0.4 |
| LeoV | 0.004659 | 0.001544 | 50.41 | 16.15 | 2.3 | 3.2 | 1.6 | 173.6 | 10 | 172.3 | 3.1 | 174 | 2.5 | 58.53 | 0.0 | 0.43 |
| CVenI | 0.2651 | 0.01463 | 437.9 | 12.59 | 7.6 | 0.4 | 0.4 | 211.5 | 10 | 40.65 | 0.6 | 211 | 2.5 | 78.16 | 0.0 | 0.44 |
| LeoII | 0.6242 | 0.02298 | 164.7 | 1.926 | 6.6 | 0.7 | 0.7 | 224.7 | 14 | 78.34 | 0.1 | 227 | 2.5 | 23.31 | 0.0 | 0.07 |
| LeoI | 4.987 | 1.285 | 287.9 | 2.133 | 9.2 | 1.4 | 1.4 | 269.4 | 15 | 277.2 | 0.1 | 273 | 1.5 | 173.6 | 0.0 | 0.3 |
| Sagittarius | 23.4 | 3.343 | 1636.0 | 52.78 | 11.4 | 0.7 | 0.7 | 26.93 | 2 | 150.1 | 2.0 | 19 | 1.5 | 170.9 | 7.1 | 0.64 |
| Bootes1 | 0.02212 | 0.005088 | 192.5 | 5.039 | 2.4 | 0.9 | 0.5 | 67.27 | 2 | 109.5 | 2.1 | 64 | 2.5 | 107.0 | 7.3 | 0.3 |
| CraterII | 0.1481 | 0.02677 | 1066 | 86 | 2.7 | 0.3 | 0.3 | 112.6 | 5 | 85.33 | 99.0 | 111 | 2.5 | -73.96 | 4.2 | 0.0 |
| name | torbit | |||||||||||
| () | () | - | () | () | (yr) | (yr) | (yr) | (yr) | ||||
| (1) | (2) | (3) | (4) | (5) | (6) | (7) | (8) | (9) | (10) | (11) | (12) | (13) |
| Draco2 | 0.09275 | 22.23 | 0.002086 | 0.5089 | 4.727 | 2.9 | 6.1 | 2.792 | 5.809 | 6.693 | 0.04577 | 0.001602 |
| Segue1 | 0.01595 | 20.81 | 0.0003831 | 0.5021 | 4.564 | 3.9 | 4.953 | 9.325 | 1.53 | 1.217 | 0.01883 | 0.0002032 |
| UMaII | 0.05991 | 56.2 | 0.0005331 | 0.5054 | 7.501 | 6.7 | 1.321 | 6.16 | 3.616 | 5.778 | 0.04663 | 0.0005679 |
| Willman1 | 0.04869 | 11.98 | 0.002032 | 0.5074 | 3.47 | 4.3 | 4.591 | 2.478 | 8.946 | 6.098 | 0.5399 | 0.009235 |
| Coma | 0.08948 | 32.2 | 0.001389 | 0.5074 | 5.684 | 4.6 | 1.158 | 7.141 | 1.781 | 2.57 | 0.06164 | 0.001336 |
| TucanaII | 0.02305 | 54.32 | 0.0002121 | 0.521 | 7.372 | 8.6 | 1.389 | 5.494 | 7.871 | 1.295 | 0.003954 | 2.327e-05 |
| Draco | 1.686 | 48.71 | 0.01731 | 0.5529 | 7.123 | 9.1 | 2.016 | 1.398 | 1.413 | 4.038 | 0.6934 | 0.03298 |
| UMi | 1.442 | 72.35 | 0.009965 | 0.5517 | 8.607 | 9.5 | 2.813 | 8.988 | 2.226 | 4.51 | 0.3195 | 0.01346 |
| Sculptor | 8.819 | 53.29 | 0.08274 | 0.5598 | 7.992 | 9.2 | 2.407 | 8.784 | 7.457 | 5.308 | 3.649 | 0.3926 |
| Sextans | 0.8482 | 76.33 | 0.005556 | 0.5642 | 8.795 | 7.9 | 4.272 | 6.752 | 3.665 | 6.076 | 0.158 | 0.006142 |
| UMaI | 0.07161 | 27.45 | 0.001304 | 0.5775 | 5.248 | 7.6 | 1.931 | 1.651 | 5.485 | 6.33 | 0.8548 | 0.01003 |
| Aquarius2 | 0.01819 | 20.99 | 0.0004332 | 0.5803 | 4.584 | 5.4 | 2.265 | 1.072 | 9.07 | 1.237 | 0.04731 | 0.0003938 |
| Carina | 2.272 | 42.81 | 0.02654 | 0.5803 | 6.748 | 6.6 | 3.596 | 4.151 | 1.575 | 7.821 | 11.54 | 0.8788 |
| Hercules | 0.1759 | 16.21 | 0.005425 | 0.6006 | 4.053 | 3.7 | 3.257 | 4.676 | 2.873 | 4.31 | 0.1436 | 0.005424 |
| Fornax | 18.67 | 77.28 | 0.1208 | 0.6094 | 9.985 | 11.7 | 5.587 | 4.899 | 1.513 | 2.028 | 8.769 | 1.08 |
| LeoIV | 0.09199 | 10.5 | 0.004379 | 0.6185 | 3.258 | 3.3 | 3.089 | 4.995 | 3.361 | 5.704 | 1.617 | 0.04954 |
| CVenII | 0.2059 | 5.235 | 0.01967 | 0.6222 | 2.341 | 4.6 | 1.167 | 3.255 | 1.184 | 8.274 | 2.788 | 0.09167 |
| LeoV | 0.1371 | 3.247 | 0.0211 | 0.6295 | 1.847 | 2.3 | 1.62 | 6.141 | 1.006 | 1.455 | 3.791 | 0.2034 |
| CVenI | 0.9058 | 20.96 | 0.0216 | 0.6474 | 4.696 | 7.6 | 4.221 | 5.709 | 3.37 | 1.321 | 1.353 | 0.05646 |
| LeoII | 4.4 | 9.097 | 0.2419 | 0.6539 | 3.792 | 6.6 | 2.356 | 2.305 | 7.412 | 4.766 | 97.87 | 10.37 |
| LeoI | 13.91 | 10.4 | 0.6687 | 0.6698 | 5.205 | 9.2 | 2.563 | 1.029 | 6.322 | 7.697 | 40.16 | 5.427 |
Peer Reviews
No public reviews on file for this paper yet. If you reviewed it on a platform where reviews are public (OpenReview, ICLR, NeurIPS, ICML), you can paste yours below so the community can read it here.
Videos
No videos yet. Explain this paper in a talk, walkthrough, or lecture? Add one.
On the absence of dark matter in dwarf galaxies surrounding the Milky Way
Francois Hammer
GEPI, Observatoire de Paris, Université PSL, CNRS, Place Jules Janssen 92195, Meudon, France
Yanbin Yang
GEPI, Observatoire de Paris, Université PSL, CNRS, Place Jules Janssen 92195, Meudon, France
Jianling Wang
GEPI, Observatoire de Paris, Université PSL, CNRS, Place Jules Janssen 92195, Meudon, France
NAOC, Chinese Academy of Sciences, A20 Datun Road, 100012 Beijing, PR China.
Frederic Arenou
GEPI, Observatoire de Paris, Université PSL, CNRS, Place Jules Janssen 92195, Meudon, France
Mathieu Puech
GEPI, Observatoire de Paris, Université PSL, CNRS, Place Jules Janssen 92195, Meudon, France
Hector Flores
GEPI, Observatoire de Paris, Université PSL, CNRS, Place Jules Janssen 92195, Meudon, France
Carine Babusiaux
Université de Grenoble-Alpes, CNRS, IPAG, F-38000 Grenoble, France
GEPI, Observatoire de Paris, Université PSL, CNRS, Place Jules Janssen 92195, Meudon, France
(Received 04-24-2019; Revised 06-27-2019; Accepted 07-26-2019)
Abstract
This paper presents an alternative scenario to explain the observed properties of the Milky Way dwarf Spheroidals (MW dSphs). We show that instead of resulting from large amounts of dark matter (DM), the large velocity dispersions observed along their lines of sight () can be entirely accounted for by dynamical heating of DM-free systems resulting from MW tidal shocks. Such a regime is expected if the progenitors of the MW dwarfs are infalling gas-dominated galaxies. In this case, gas lost through ram-pressure leads to a strong decrease of self-gravity, a phase during which stars can radially expand, while leaving a gas-free dSph in which tidal shocks can easily develop.
The DM content of dSphs is widely derived from the measurement of the dSphs self-gravity acceleration projected along the line of sight. We show that the latter strongly anti-correlates with the dSph distance from the MW, and that it is matched in amplitude by the acceleration caused by MW tidal shocks on DM-free dSphs. If correct, this implies that the MW dSphs would have negligible DM content, putting in question, e.g., their use as targets for DM direct searches, or our understanding of the Local Group mass assembly history. Most of the progenitors of the MW dSphs are likely extremely tiny dIrrs, and deeper observations and more accurate modeling are necessary to infer their properties as well as to derive star formation histories of the faintest dSphs.
Galaxy: general – galaxies: dwarf – (cosmology:) dark matter
1 Introduction
The MW halo within 300 kpc is populated by the two Magellanic Clouds and by ten to a million times fewer massive dwarf-spheroidal galaxies (dSphs). Several tens of MW dSphs (McConnachie, 2012; Muñoz et al., 2018; Fritz et al., 2018) have now been discovered and their number may continue to increase. Furthermore, observations of dSphs revealed 1D, line-of-sight (los) velocity dispersions () that are considerably larger than expectations from their stellar mass, which has led to assume the presence of an additional, dominant component of dark matter (DM). The total mass (), including DM, was estimated by assuming that in each dSph a single, dispersion-supported stellar population is in dynamical equilibrium in the underlying gravitational potential (Walker et al., 2009; Wolf et al., 2010). Further assuming spherical symmetry and neglecting the impact of the MW gravitation, the dynamical mass was deduced from dSph star kinematics using the Jeans equation (Walker et al., 2009; Wolf et al., 2010).
However, Hammer et al. (2018) have shown that dSph Jeans masses () and their ratio to luminosity can be derived from the half-light radius () and the gravitational acceleration exerted by the MW, which appears to be at odds with the assumption that dSph kinematics are not affected by the MW. Furthermore, it was found that MW tidal shocks provide enough kinetic energy to dSph stars to predict the observed with a good accuracy. This is supported by the fact that MW tidal shocks are exerted along the radial direction, which coincides with the line of sight along which are measured. This casts doubts about the validity of the dynamical mass estimate using the Jeans equation, hence on the estimates of the DM amount in dSphs. Why tidal shocks appear to be the dominant effect of the MW gravitational tides remains to be clarified. In the meantime, Muñoz et al. (2018) have considerably improved the photometric measurements of most dSphs, improving the accuracy on by one order of magnitude.
Here, we demonstrate from data analysis that, instead of DM, the MW gravitation through tidal shocks can fully account for the dSph kinematics. In Sect. 2 we show that, assuming self-gravity and using the Jeans equation, one can only predict the projected mass density along the line of sight. We then find that this quantity is highly (anti)correlated111Along the manuscript we have used a Spearman’s rank correlation that does not assume any shape for the relationship between variables; the significance of has been tested using t= , which is distributed approximately as Student’s distribution with n - 2 degrees of freedom under the null hypothesis. with the MW distance compared to other DM-related quantities (e.g., mass or 3D mass density). In Sect. 3 we demonstrate that this is fully explained by the effect of MW tidal shocks on DM-free dSphs. We also characterize the time-scales that warrant the impulse approximation regime necessary for tidal shocks to be efficient. Sect. 4 discusses an astronomical scenario in which gas removal by ram-pressure of gas-rich dSph progenitors ensures the predominance of tidal shocks in MW dSphs, then providing dSph properties very similar to that observed. The sample of 21 dSphs with kinematic data and after removing three outliers has been defined in the Appendix A in which scaling relations are analyzed, and which includes two Tables showing the data and the calculated quantities, respectively. In the following we assume ratio of 2.5 for dSphs without young or intermediate age stars, and 1.5 for Carina, Fornax, and Leo I (see, e.g., Lelli et al. (2017) and references therein).
2 Limitations on the Use of the Jeans equation to estimate DM
Wolf et al. (2010) derived the dSph total mass within = ( and are the 3D and 2D half-light radii, respectively, see also Walker et al. 2009). Assuming self-equilibrium and using the Jeans equation:
[TABLE]
The above mass estimate (see, e.g., Walker et al. 2009; Wolf et al. 2010) further assumes that the DM is spherically distributed, although attempts have been made to minimize the impact of the unknown value of the velocity dispersion anisotropy (Wolf et al., 2010). Since the determination of DM is based on a los velocity dispersion (e.g., ), only the mass density projected along the line of sight can be determined without any assumption on anisotropy222To illustrate this, let us consider a mass distribution very elongated along the line of sight: the induced would indeed be much larger than if the (same) mass was spherically distributed.. Under the spherical symmetry assumption, it is also a surface mass density () proportional to . The los projected mass density is proportional to the gravitational acceleration caused by the total mass , whose projection along the line of sight is assumed to induce the observed los velocity dispersion .
One may try to isolate the effect of the DM in Eq. 1 by removing the small and known contribution of the stellar mass. Within r= , the Jeans mass is the sum of the DM and stellar masses, and the DM surface-mass density is then:
[TABLE]
In the following, we estimate333When calculating the 1D velocity dispersion of a Plummer body made of stars only, we cannot assume a constant sigma profile as done in Eq. 1; Eq. 31 of Evans & An (2005) yields , instead of in Eq. 2 of Wolf et al. (2010). It leads to a value of = 0.9127 . the 1D los velocity dispersion () associated with the sole stellar mass by inverting Eq. 1 and replacing by . By multiplying Eq. 2 by the gravitational constant G it leads to the acceleration caused by the DM () for which only its projection along the line of sight is robustly known, which is:
[TABLE]
Left panel of Figure 1 shows that the acceleration due to the DM is strongly anticorrelated ( and , see Appendix C) with the distance to the center of the MW (). Could this be due to a combination of correlations, e.g., between surface mass density () and radius, and between radius and MW distance? Appendix A.2 indicates that correlates well (=0.80 for the 21 dSph sample) with , following:
[TABLE]
Combining Eq. 4 with Eq. 1, it results that scales as . If spherical symmetry is assumed, = should depend weakly on radius, i.e., . Such a behavior is verified by the data (logarithmic slope=-0.33 with = 0.49). The radius is weakly correlated with the distance (see Appendix A.3, logarithmic slope=0.87 with = 0.45). Combining a weak anticorrelation with a weak correlation can neither provide the strong anticorrelation nor the slope (-0.62) of the relation shown in the left panel of Figure 1.
Here we have discovered that the most accurately determined DM quantity, (or ), is unexpectedly anticorrelated to the MW distance. This indicates that MW dSphs cannot be further considered as isolated, which questions the validity of the DM mass estimates provided by self equilibrium deduced from the Jeans equation.
The left side of Figure 2 is made up of three panels showing the slope, correlation strength, and Student parameter of a generalized correlation between and . By replacing by in Eq. 3, it identifies the DM mass and its 1D to 3D-mass densities (see indications in the bottom panel), after neglecting the effect of MW tides. As for Eq. 1, the above equations assume spherical symmetry for the dSphs and DM-related quantities are calculated at r= = 4/3 .
The right side of Eq. 3 illustrates dSph observed quantities (, , ) without any dependence on modeling or on the nature of dSphs, and Figure 2 is only based on them. Concerning the DM content of dSphs, Figure 2 is illustrative because:
- •
Data show significant anticorrelations for power -1, with a prominent peak at r power= -1 (), i.e., for the quantity robustly estimated from observations; it suggests that the anticorrelation between the DM 3D-mass density, , and the MW distance is only due to that between with ;
- •
Data confirm the absence of correlation between and distance (r power = 0), as well as between the assumed total DM mass (r power = 1) derived from Eq. 1 and the MW distance.
This may also explain why the “DM in isolated dSph” hypothesis received so much credit, given that its associated mass appears to not be correlated with the host galaxy properties. Reproducing Figures 1 and 2 is likely a challenge for the standard scenario of DM-dominated MW dSphs. For example, why by multiplying (or ) by , which is weakly correlated with the MW distance, the strong anticorrelation found in Fig. 1 disappears (at r power= 0 in Fig. 2)?
In fact an anticorrelation between DM 3D-mass density () and distance to the MW has been found by Diemand et al. (2008) and by Moliné et al. (2017), in the frame of a tidal stripping of pure DM subhalos, which would be denser when lying near the MW center. Could such an anticorrelation be at the root of the relation shown in Figure 1? Top left panel of Figure 2 reveals that shows a logarithmic slope of -2.9, implying that at 30 kpc from the MW, sub-haloes would be 340 times denser than at 250 kpc. However, stellar densities stay unchanged within the same MW distance range, and it would require a considerably more efficient stripping of DM444If DM particles have strongly radially biased orbits (but see Taylor 2011) they will be more affected by tidal stripping than stars. than that of stars while they lie within a similar volume in the dSph (see details in Appendix B).
3 Why is the acceleration correlating with the MW distance?
Indeed the anticorrelation between and hints to Eqs. (2) and (B16) of Hammer et al. (2018) established in the frame of the impulse and distant-tide approximations, and assuming DM-free dSphs. They show that MW tidal shocks bring sufficient kinetic energy to generate an additional term to the los velocity dispersion, which is . Note that both accelerations, which are due to MW tidal shocks on DM-free dSphs and that are assumed to be due to DM in the frame of self-gravity, are indeed projected along the MW radial direction that coincides with the line of sight. Eq. B16 of Hammer et al. (2018) can be written as:
[TABLE]
where = is the gravitational acceleration of the MW and
[TABLE]
characterizes the shape of the MW mass profile, taking values close to 1 in the Galactic outskirts (\partial$$M_{\rm MW}/\partial$$D_{\rm MW}$$\sim 0) and close to 0 when the slope of the MW mass profile is steep.
Can Eq. 5 be at the root of Figure 1? To verify this we have to compare with . The later term requires the knowledge of the MW potential and we have considered two models reproducing the MW kinematics (Bovy, 2015) and extended rotation curve (Sofue, 2015) from observations of distant massive stars and globular clusters. Right panels of Figure 1 show that the correlation between the two quantities is as strong as the one shown in the left panel. Moreover, for most dSphs, within their error bars, the los gravitational acceleration attributed to the DM self-gravity equals that caused by MW tidal shocks on DM-free dSphs. Why would the acceleration caused by the DM be precisely what it is expected from MW tidal shocks on DM-free dSphs? In other words, why does the latter predict that the DM mass-to-light ratio of Segue 1 is several thousand, while that of Fornax is only 10?
Figure 3 shows the comparison between predictions from Eq. 5 to the observed los velocity dispersions () in dSphs. In the left panel, MW model from Sofue (2015) is found to predict with good precision the observations, with slope = 0.9 and a correlation coefficient . Similar values (slope = 1.17 and ) are found when using the MW model from Bovy (2015). We notice that the two models are based on the Navarro et al. (1997) density profile that does not converge at large distances. It indeed excludes values of larger than 0.7, which allows significant room to use more appropriate MW profiles and optimize them. Although it is beyond the scope of this paper to derive the MW total mass and its profile, the right panel of Figure 3 illustrates the result of a very first attempt, which leads to a total MW mass and a mass profile in very good agreement with mass and extended rotation curve profiles from Bhattacharjee et al. (2014) and Huang et al. (2016).
The right panel of Figure 2 illustrates the correlation between and , the former term involving only observed properties, the later term involving only the MW gravitation and mass density profile. It is essentially similar to the left panel, although the slope of the correlation is exactly 1 for power = -1, which indicates that Eq. 5 fully accounts for energy exchanges between the MW and the dSphs along the line of sight, and that within an acceleration range of almost 2 decades.
Eq. 5 applies to DM-devoid dSphs orbiting into the MW halo, and it is based on the fact that the sizes of the dSphs are much smaller than their distances to the MW (the distant-tide approximation) allowing one to account for smooth variations of the MW potential across dSphs (see Eq. 8.34 in Binney & Tremaine 2008). Furthermore, Eq. 5 requires that dSph stars undergo a fluctuation of the MW gravitational potential over time scales that are smaller than their present-day crossing-time scales (= ). It has been demonstrated by Aguilar & White (1985) that such an impulse approximation holds even for slow encounters (or those with rather low-eccentricities), i.e., if the encounter is as long as, or a few times longer, than (see also Binney & Tremaine 1987, 2008).
This situation might seem similar to that of globular clusters (GCs) progressively destroyed by tidal shocks during their passages near the MW bulge (Aguilar, 1993; Gnedin et al., 1999; Gnedin & Ostriker, 1999). However, dSphs have central densities 10,000–100,000 times smaller than GCs, and their interaction with the MW potential is much more destructive during a single dynamical time = (see footnote 3), which ranges from to yr (see the second table of Appendix A). Gnedin & Ostriker (1999) showed that it takes more than 3 (resp. 10–15) dynamical times for a system to virialize (resp. relax) after a perturbation. In the course of their long orbits555For example, with t_{\rm orbit}$$\sim ), where is the galactocentric projection of the radial velocity. Replacing by calculated by Fritz et al. (2018) does not change the results. within the halo, dSphs are affected by changes of the energy brought by the MW tides. The encountering time () can be evaluated by assuming that these changes have to be larger than the kinetic energy associated with the self-gravity of the DM-free dSphs (). Differentiating Eq. 5 yields:
[TABLE]
in which we have neglected the (slow) variation of with . Then:
[TABLE]
hence a distance change of induces a change of equal to twice the kinetic energy due to DM-free dSph self-gravity (1/2), if:
[TABLE]
Given the small dSph stellar masses, the ratio is usually so small (see Appendix A) that changing by only a few percent warrants a kinetic energy change larger than . In the impulse approximation, the perturbation causes an instantaneous change in the velocity of each star that depends only on its position (Aguilar & White, 1985). It holds when is larger than the encountering time =/, and eventually leads to Eq. 5. Another way to establish the validity of Eq. 5 is to consider the stars that are in resonance with the MW gravitational perturbation: following Weinberg (1994) and Gnedin et al. (1999) the fraction of resonant stars follows , which is 100% for most dSphs. Values of are below 1 for most dSphs, but larger than 10 for Leo I and Leo II (see Appendix A). Intermediate values for Carina and Fornax are likely yielding results consistent with the impulse approximation even if the conditions are not strictly satisfied (Aguilar & White, 1985; Binney & Tremaine, 1987). Moreover, stars in these dSphs would not have time to come back to equilibrium (virialization), since the ratio between and the virializing time (3 ) is always below or very close to 1, except for Leo I and Leo II. It is noteworthy to see that Leo I and Leo II are also outliers in the relations shown in Figure 1 (see magenta dots).
4 Tidal shocks May explain the MW dSph kinematics
It is widely accepted that dSph progenitors have probably lost their gas through ram-pressure effects caused by the diffuse MW halo hot gas (Mayer et al., 2001; Grcevich & Putman, 2009). This is supported by a strong dichotomy in dwarf gas content, those beyond 300 kpc being gas-rich, the others being gas-free (Grcevich & Putman, 2009). The old stellar ages and low metallicities of most of the dSphs have been often considered as evidence for an ancient infall of primordial dwarf galaxies. However, there is mounting evidence for a more recent infall of most dSphs. 74% of them (Fritz et al., 2018) have orbital motions along a gigantic plane perpendicular to the MW disk suggesting a common infall (Pawlowski et al., 2014) with the Magellanic Clouds (MCs), which also belong to this gigantic plane and are at their first passage (Kallivayalil et al., 2013). The MCs show large orbital eccentricities, a property shared by most dSphs as inferred from Gaia measurements (Fritz et al., 2018), with half of them having apocenters in excess of 300 kpc. This is especially true for MW mass666Fritz et al. (2018) have also considered another mass model, which is like that of Bovy (2015) but for which they multiply the halo DM mass by a factor 2 (their model). It is however discrepant with the extended rotation curve of the MW. and profile consistent with most MW structural parameters (Bovy, 2015). In the following we show how the above astronomical context leading to Eq. 5 can fully account for the large measured values of dSph velocity dispersions.
Eq. 5 has been established under the impulse approximation regime (tidal shocks), which is robust for all dSphs but Leo I and II. The factor in Eq. 5 results from the assumed Plummer model for the stellar density in dSphs, assuming further a spherical symmetry and using a radius that is the geometric mean between the major and minor half-light radii. Adopting different models does not affect Eq. 5 by more than a few percent (Hammer et al., 2018).
However, Eq. 5 does not account for tidal stripping. The global instantaneous energy change caused by the MW tides on an individual star with velocity is:
[TABLE]
where is the change in velocity (see Eq. 7–41 of Binney & Tremaine 1987). If dSphs are spherically symmetric, the first term (called ”tidal stripping” or ”diffusion term,” see Binney & Tremaine 2008, P. 663) vanishes when averaged over all stars letting the second term (called ”tidal shocking” or ”heating,” here approximated to ) lead to Eq. 5 (Hammer et al., 2018). The first comprehensive simulations of DM-devoid dwarfs falling into the gravitational potential of the MW has been done by Piatek & Pryor (1995), Kroupa et al. (1997), and Klessen & Kroupa (1998), all assuming gas-free progenitors. During their approach, progenitors are initially at large distances from the MW, which results in weak gravitational field and , leading to a dominant first term in Eq. 10 as described by the diffusive regime (see Binney & Tremaine 2008, P. 663). This led Piatek & Pryor (1995) to model dSphs that experience large star losses by tidal stripping. However, these modeled dSphs were too elongated along the line of sight and had kinematics that were not consistent with observations (see also Klessen et al. 2003; Read et al. 2006). Conversely, in MW dSphs, (approximated by ) is systematically larger than , if approximated by . Furthermore, observations of RR Lyrae stars reveal that dSphs are not particularly elongated along the line of sight (Hernitschek et al., 2018), consistently with expectations and simulations in which tidal shocks dominate.
The above considerations point out a mechanism that has prevented significant tidal stripping of stars during the infall. In fact, if gas dominates dSph progenitors as expected from observations (Grcevich & Putman, 2009), it would have been easily removed by ram pressure stripping. Gas removal leads to a serious decrease of self-gravity, a phase during which stars are left almost free to expand within a spherical geometry, preventing the diffuse regime and letting tidal shocks dominate.
Figure 4 illustrates the overall process from the gas removal by ram-pressure to the expansion of the stars, and later on, how tidal shocks exerted by the MW dynamically heat the stars along the MW direction, which coincides with the line of sight. Figure 3 (see also Fig. 5 of Hammer et al. 2018) shows how hydrodynamical simulations from Yang et al. (2014) based on gas removal by ram-pressure and then tides from MW can reproduce expectations from Eq. 5. These can reproduce the morphologies (see Figs. 9 and 10 of Hammer et al. 2018), the stellar density (see Appendix A.2), and the flat velocity dispersion profiles along the dSph radii (see Figs. 5 and 6 of Yang et al. 2014, see also calculations in Hammer et al. 2018). The prominence of tidal shocks in the case of gas-rich progenitors has been shown by Kazantzidis et al. (2017), who also found that most of the very elongated shapes or bar-like features obtained in gas-free simulations (Łokas et al., 2012) then vanish.
Properties of ’tidally-shocked,’ DM-devoid dSphs are likely undistinguishable from those observed. Tidal features are then not expected to be observed in DM-devoid dSph at recent infall, because MW tidal shocking dominates tidal stripping. This is consistent with the two following observations: (1) there are no obvious tidal features in the relatively bright, so-called classical dSphs except perhaps for Carina (Battaglia et al., 2012), which is likely near its pericenter (Fritz et al., 2018); and (2) wide-field observations of several dSphs have revealed stars beyond their DM tidal radius (Carina: McMonigal et al. 2014; Draco: Kleyna et al. 2001; Ségall et al. 2007, Fornax: Battaglia et al. 2006). Conversely to Aguilar & White (1985), Gnedin et al. (1999), and Gnedin & Ostriker (1999), we have not examined the theoretical evolution with time of the DM-devoid dSphs, although our modeling indicates also mass losses, in particular, for the smallest ones. Tidal shocking could lead to disrupt these objects, and large parts of their stellar content can be expelled toward their surroundings. Hercules is likely in such a stage (Roderick et al., 2015; Garling et al., 2018) and Küpper et al. (2017) recently modeled it as an exploding stellar system after two passages, concluding to an absence of a DM dominant component. This supports our conclusions, since Hercules lies on the relations shown in Figures 1 to 3.
5 Discussion: the DM-free MW dSphs in the near-field cosmology context
We propose a reasonable scenario that successfully explains the MW dSph properties and that excludes DM as being their main mass component. However, before accepting such a major change of paradigm in near field cosmology, one has to verify whether (1) most MW dSphs can be at their first passage, (2) what are their progenitors, and (3) how this could be consistent with their star formation histories.
5.1 A first passage for most dSphs?
A very massive MW (e.g., 2) would lead to more circular orbits for the dSphs after considering their Gaia DR2 proper motions. For example, Fritz et al. (2018) found that one-third of them have orbits with eccentricities larger than 0.66 for their heavy MW mass model (1.6), a fraction that increases to two-thirds for their light mass model (0.8, see also Bovy 2015). Hence for a less massive MW, typically smaller than, e.g., 1.3, most dSphs including the numerous ultra-faint dwarfs, would have large orbital eccentricities suggesting a first infall. This is consistent with the fact that most of them lie in a vast polar structure (Pawlowski et al. 2014) that also includes the Magellanic Clouds, which are at their first passage.
Gaia DR2 has also considerably improved our knowledge of the MW mass distribution up to 20-50 kpc, by establishing a more accurate rotation curve (Eilers et al., 2019; Mróz et al., 2019), better constraints on the Globular Cluster motions (Eadie & Jurić, 2019) and on the estimates of the escape velocity (Deason et al., 2019, see also Grand et al. 2019). Even if they are still using extrapolations of the mass profile to the outer halo, these studies provide MW masses ranging from 0.7 to 1.3, i.e., allowing a scenario of first passage for most dSphs.
5.2 What are the progenitors of DM-free dSphs?
Due to their proximity, MW dSphs are by far the tiniest galaxies for which detailed properties can be derived. Their progenitors are likely gas-rich galaxies, for which Lelli et al. (2016a) provided the most insightful report of their properties, including their rotation curve, their gas content, and the 3.6 photometry for deriving their stellar masses. However, among the sample of 21 dSphs studied here, only Fornax possesses a sufficiently large mass (3), to be compared to, e.g., galaxies belonging to the lowest stellar mass range of the Lelli et al. (2016a)** study, all of which are dIrrs.**
Here we consider the nine dIrrs for which the distance is accurately determined (from the tip of the Red Giant Branch) and with smaller than , corresponding to a stellar mass of 5 according to Lelli et al. (2016a). Among them, two (UGC 07577 and CamB) show no evidence for an excess of mass from their rotation curves, while for four (WLM, D564-8, ESO0444-G084, and NGC 6789) DM seems mandatory to explain their rotational velocity within (= to 2.2 times the disk scalelength). For the remaining three galaxies (UGC 0443, NGC 3741, and DDO154) the necessity for DM within the radius is rather marginal, especially when accounting for systematic errors due to the assumed inclination. We verify that the above results are unchanged by increasing the limit to 2.
It seems quite puzzling at a glance that only DM-free dIrrs are reaching the MW halo, while others would have avoided such an infall. However:
- •
A shallow-distributed DM could be preferentially stripped lowering its fraction in the transformed galaxy (Kazantzidis et al., 2011; Łokas, 2016), including perhaps in their central region if DM particles have radially biased orbits compared to that of stars.
- •
Alternatively, the MW dSph progenitors could have come within a group (D’Onghia & Lake, 2008) at first infall, for which, e.g., the brightest galaxies could be DM-free, which cannot be excluded from the small statistics discussed above. Progenitors might also be gas-rich, tidal dwarf galaxies that are devoid of DM as suggested by Metz & Kroupa (2007). For example, tidal dwarf galaxies have been used with success to reproduce the Magellanic Stream, the Leading Arm, and the disks of satellites surrounding both MW and M31 (Fouquet et al., 2012; Hammer et al., 2013, 2015; Yang et al., 2014; Wang et al., 2019).
The above hypotheses might appear too radical and one may need to investigate further the progenitor problem. For example, the identification of gas-rich progenitors of the MW dSphs is possibly far more complex than that provided by the above short analysis. In an infalling DM-free dIrr scenario, the fraction of stars that have escaped the initial galaxy may be significantly high for some orbits, possibly reaching values up to 90%, and also depending on a detailed description of the gas removal by ram-pressure exerted by the MW halo gas. Under these conditions even Sculptor (= 5) could have a progenitor within the lowest mass range of Lelli et al. (2016a) galaxies. More problematic is the fact that it becomes unclear to which radius DM has to be investigated in the progenitors, perhaps in a region more central than .
Another limitation is due to the fact that stellar masses of field dIrrs have been determined through stellar population synthesis models, i.e., in a very different way than for star-resolved dSphs. Detailed studies of the star formation and chemical enrichment histories lead to / values in excess of 2.1 for Fornax, and up to 4.3 for Sculptor (de Boer et al., 2012a, b). Quoting Kroupa et al. (2013), ”the chemical evolution modeling of the Fornax dwarf-spheroidal satellite galaxy demonstrates that this system must have produced stars up to at most about 25 in agreement with the prediction of the integrated galactic initial mass function (IGIMF) theory given the low star formation rate 3 deduced for this system when it was forming stars in the past.” Since de Boer et al. (2012a, b) assumed a Kroupa (2001) IMF that is extending to large star masses (120 ), the stellar mass of Fornax is perhaps underestimated. This can also apply to the Fornax progenitor as well as to most dIrrs, i.e., their IMF could be rather bottom-heavy according to the IGIMF theory (Kroupa et al., 2013), which could lead to large values of /. For the later, larger values than 0.5 are not excluded by the baryonic Tully Fisher relation according to Lelli et al. (2016b), and, for example, a value of 1 would be consistent with an absence of DM in the radius of UGC 0443, NGC 3741, and DDO154.
Even if one may succeed in identifying the progenitor of Fornax (and perhaps of Sculptor), it leaves unknown the properties of the progenitors of the 19 remaining dSphs studied in this paper. There have been pioneering studies of very tiny dIrrs including the SHIELD (McNichols et al., 2016), the LITTLE THINGS (Oh et al., 2015), and the VLA-ANGST (Ott et al., 2012) surveys, reaching galaxies with stellar masses from 3 to 5, i.e., below the smallest dIrr mass values of Lelli et al. (2016a). Lelli et al. (2016a) have excluded the LITTLE THINGS dIrrs because of irregularities in their rotation curves possibly due to noncircular events. Some attempts (see Oh et al. 2015) have been done to estimate their rotation curves, using the titled ring method that assumes an infinitesimally thin HI layer (see Bosma 2017). However, such low-mass objects have almost a spheroidal geometry (Sánchez-Janssen et al., 2010) and a velocity amplitude similar to that of their dispersion, the latter being mostly associated to star formation and turbulence (Stilp et al., 2013). This likely hampers a robust determination of their rotation curve and hence of their DM content. Stilp (2013) concluded that ”rotation curves for the smallest dwarfs in our (VLA-ANGST) sample may be difficult to obtain due to their complex velocity fields” (see also Ball et al. 2018 for Coma P, Oh et al. 2015 for DDO 210, McNichols et al. 2016 for AGC 748778, and Bernstein-Cooper et al. 2014 for LeoP). This does not mean that there is no DM in the tiniest dIrrs, though it points out the need for a significantly more robust (3D) modeling of individual objects to disentangle effects due to star formation from those due to gravitation.
5.3 Are DM-free MW dSphs consistent with the star formation history?
The above scenario might also appear at odds with the star formation histories of dSphs, which are often dominated by a single, very old population (Weisz et al., 2014). However, star formation histories could be complex and difficult to interpret, especially if unknown amounts of initial gas have been removed by ram-pressure effects leading to a subsequent decrease of self-gravity and then to an expansion of stars within a spherical symmetry. For example, during the last few hundreds of megayears, the star formation history of Fornax (de Boer et al., 2013) has been consistent with a recent gas removal by ram-pressure and then with the tidal shock scenario. While this also applies to Carina, Leo I, and perhaps to Leo II, the cases of Sculptor, Sextans, UMi and Draco (Weisz et al., 2014) are perhaps more problematic. For example, why did the star formation in the Sculptor progenitor stop about 5 Gyr ago (de Boer et al., 2012a)? Only a full hydrodynamical simulation with a well determined orbital history for Sculptor could help us to verify this potential inconsistency. Recently, FIRE2 simulations (Garrison-Kimmel et al., 2019) have shown that gas-rich dwarfs with stellar mass ranging from to have similar star formation histories to Sculptor. Beside this, most of dSphs are much fainter than classical dSphs and they show large orbital eccentricities that may be consistent with a first infall (Simon, 2018), which might be difficult to reconcile with a single old stellar population (Weisz et al., 2014). Perhaps their progenitors were so tiny that these systems were unable to form stars for very long periods. Alternatively, one needs to verify whether or not the faintest dSphs may also contain an intermediate age population, and this is likely out of our reach with the present data because of the small number of giant stars in these very scarcely populated galaxies (V. Hill 2019, private communication).
6 Conclusion
The DM content of dSphs is calculated through the DM projected density along the line of sight. Here we demonstrate that the recently improved data from Muñoz et al. (2018) and Fritz et al. (2018) reveal that the gravitational acceleration attributed to the DM self-gravity is strongly anticorrelated to the MW distance. Assuming a mass modeling of the MW consistent with its kinematics and rotation curve, we find that the los gravitational acceleration attributed to the DM self-gravity is precisely equal to that caused by the MW tidal shocks on DM-free dSphs.
This leads us to conclude that all the observed properties of the dSphs can be explained by the action of the MW only, without having to include any DM in dSphs. In DM-dominated models of dSphs the DM is somewhat shielding the action of the MW, and the DM total mass appears not to be correlated to the MW distance or its gravitational action. The last point is in contradiction with the observed anticorrelation ( for 21 dSphs, 0.83 without Leo I and Leo II) between the MW distance and the los projected acceleration, which is the only quantity related to observations. The probability that this is just a coincidence is only 3, which can be conservatively considered as the chance that DM impacts the kinematics of dSphs. This result questions the search of DM in these evanescent stellar systems, as well as our understanding of dwarfs in the Local Group and their role in cosmology.
To further investigate about the origin of DM-free MW dSphs would require (1) the detection and the analysis of their progenitors that could be extremely low-mass ( from to ) gas-rich galaxies in the field, (2) a significant progress in estimating their stellar ages through the turn-over of their main-sequence stars, and (3) an accurate determination of dSph orbits and of the MW mass distribution to perform detailed and case-by-case hydrodynamical simulations.
We are very grateful to Hadi Rahmani for a careful reading of this paper. We warmly thank Pavel Kroupa for his very useful comments on an early version of the manuscript and Paolo Salucci for his suggestions. We are grateful to the referee for the very insightful comments that have considerably improved the paper’s content. This work was granted access to the HPC resources of TGCC/CINES/IDRIS made by GENCI, and to MesoPSL financed by the Region Ile de France and the project Equip Meso of the program Investissements d Avenir supervised by the Agence Nationale de la Recherche. This work has been supported by the China-France International Associated Laboratory Origins. J.L.W. thanks the China Scholarship Council (No. 201604910336) for the financial support.
Appendix A The data
A.1 Selection of the dSphs
Fritz et al. (2018) provide one of the most complete and up-to-date list of 39 dSphs with spectroscopic data on individual stars that can be used to estimate their line-of-sight velocity dispersions (). The list also includes objects whose nature is still under debate (e.g., Crater I). Our goal is to test the DM estimate in dSphs lying in the virial halo of the MW, i.e., within 300 kpc, leading us to exclude Phoenix (which is indeed not a dSph) and Eridanus II. Objects with only upper limits on must also to be rejected either because their nature as a dSph or a star cluster is under debate (Crater I) or because they cannot lead to DM mass estimates (Segue II, Hydra II, Triangulum II, Tucana III, and Grus I). Velocity dispersion estimates are likely contaminated by the presence of binary stars, which particularly affects galaxies with only a few stars spectroscopically measured (see, e.g., Spencer et al. (2017)). In order to keep the number of dSphs sufficiently high we chose to keep targets having eight or more stars to measure , i.e., excluding Bootes II, Carina III, Horologium, and Pisces II. Finally, since we aim at estimating the influence of the MW on the DM measurements, we chose to further exclude Carina II, Reticulum II, and Hydrus, which lie in between the MW and the LMC.
It results that the sample of dSphs inhabiting the virial halo of the MW and having robust kinematics data for evaluating the DM estimates includes 24 galaxies, enabling us to study the correlation between their fundamental parameters, i.e., their luminosities, radii, velocities,and distances.
A.2 Correlations between , , and
Table 1 lists the properties of the sample of 24 dSphs having robust kinematics data. Half-light radii () and V luminosities () are taken from Muñoz et al. (2018), assuming Plummer density profiles. Following McConnachie (2012) we calculate the geometric mean half-light radius between the major and minor axes to account for the presence of highly elliptical systems. Left panel of Figure 5 shows the very strong correlation for the 24 dSphs but Crater II (= 0.87, t = 8.1) between and , leading to . Such a correlation can also be seen in Fig. 6 of McConnachie (2012). This means that the visible luminosity scales as . Surface-brightness limit may affect the scaling. However, only the discovery of many Crater II type galaxies could change it significantly.
Assuming a Plummer profile, dSphs have an average central density of = 0.0079 , a value about 20 times smaller that of the stellar density in the solar neighborhood. While the scatter between dSph values is quite large (the minimal value is = 0.00025 for Aquarius, a value 350 times smaller than the largest one, for Leo I), the range of values is huge (a factor of 21,000). Also, note that Crater II is definitively an outlier with an ultra-low density, 33,000 lower than the average of other dSphs.
Figure 5 (right) shows that scales with (), i.e., with more than twice the power value expected from the baryon Tully Fisher relationship. This discrepancy has already been noted by McGaugh & Wolf (2010). Combined together, the two relations displayed in Figure 5 lead to the relationship between , and shown in Figure 6 (see the dashed-small dashed line). The latter has also been found by Walker et al. (2009, see their Fig. 6), though the improved data measurements from Muñoz et al. (2018), as well as our choice of a geometrical mean for (see, e.g., the Hercules location that is no more discrepant), have considerably reduced the scatter and increased the significance (= 0.76, t = 5.4 for 23 galaxies). We also notice that the slope of the relation (0.370.04, see Eq. 4) is about twice that from Walker et al. (2009).
A.3 Correlations with
Figure 7 shows the correlations between , , and with the MW distance. After discarding the outlier Sagittarius, there is a weak correlation between the luminosity and the distance (), which can be explained by the fact that only the brightest dSphs have been fully detected in the MW halo. The strength of the - correlation is sufficient to explain the very weak correlation between and distance (). Note that does not correlate at all with distance, as it is also shown in Figure 2.
It results that both Sagittarius and Crater II are outliers in the relations between the MW dSph fundamental properties. This is not surprising since the former was never considered for estimating the DM content as it is evidently dominated by MW tidal forces, which is further evidenced by the associated gigantic stream (Ibata et al., 2003; Majewski et al., 2003). Crater II was discovered recently (see Caldwell et al. (2017)) and was immediately considered as an outlier, due to its extremely small stellar density. From examination of Figures 5 to 7 we find that while being less compelling, Bootes I is also an outlier when it is compared to the properties of the 21 remaining dSphs. Indeed Bootes I has two two distinct components with very discrepant velocity dispersions, and Simon (2019) advised against using these data to derive Bootes I dynamical properties. The 21 remaining dSphs will be considered as the sample of ordinary dSph galaxies, and all Figures in the main manuscript are based on this sample. Table 2 gives the quantities calculated in the paper assuming the MW model of Sofue (2015).
Appendix B Challenges to the scenario of DM-dominated MW dSphs
DSphs made of stars only are consistent with the fact that () scales with (Figure 5). It is unexpected that tidal shocks affect the slope of this relation, because the energy provided by the MW tides is approximately balanced by losses due to (too energetic) stars leaving the system (Binney & Tremaine, 1987, see pages 435-436). In other words the reaction of the system to the MW tidal shocks would be to shrink and to loose stars, i.e., to decrease both (or ) and . Strong deviations from the baryon Tully Fisher (see Figure 5) have led McGaugh & Wolf (2010) to suggest a role for tidal effects. Combining with the weaker correlation between and , is consistent with a weak, or the absence of correlation of, between and . This suggests that DM-free dSphs are consistent with all data and relationships presented in this paper.
Can these relationships be reproduced by models of DM-dominated MW dSphs? Pure DM subhalos in the MW potential (Diemand et al., 2008; Moliné et al., 2017) could yield an anticorrelation, such as that shown in the left panel of Figure 1. This is because tidal stripping dominates in the diffusive regime (see Binney & Tremaine 2008, P. 663) and leads to the evaporation of particles having the lowest binding energy, which results in higher concentrations and densities (Aguilar, 1993). This particularly affects early infall, and dSphs that inhabit the inner part of the halo.
Figure 8 shows that the DM density of dSphs is indeed anticorrelated with the MW distance, however, with a far much steeper slope (54 times higher) than that derived from Fig. 4 of Diemand et al. (2008). In these simulations, dSphs are infalling into the MW halo at different epochs. If tidal stripping caused the correlation shown in the top panel of Figure 8, then stars present at early epochs should be as affected by tides as DM, except if DM particles have much more radial motions than stars. According to Navarro et al. (2010) and Taylor (2011), DM particle motions may not be too anisotropic in the central regions of a DM halo. The bottom panel of Figure 8 shows that on average the stellar density does not change with MW distance, which makes unlikely an explanation based on DM tidal stripping, or, alternatively, that additional investigations are necessary, e.g, by considering the effect of baryons to the Diemand et al. (2008) prediction.
It remains unclear how simulations (presence of gas in progenitors and ram pressure stripping, stellar feedback and winds, radiative cooling, cosmic UV background affecting early star formation, see, e.g., Kazantzidis et al. 2017) of DM-dominated dSphs could reproduce the above relations, including Figures 1 and 2 and the scaling relations presented in the Appendices A.2 and A.3. In spite of our efforts to investigate many simulations that have been performed to reproduce the Local Group content, we find none of them able to reach the properties of the lower half of dSph mass range, impacting their ability to reproduce the relationships discovered in this paper. The main limitation is the resolution, e.g., in one of the highest resolution APOSTLE simulations (Fattahi et al., 2018), the softening length is 134 pc leading to a spatial resolution of 400 pc, i.e., insufficient for most dSphs (see Table 1). However, this limitation should soon be overcome, e.g., by extreme resolution simulations (Wheeler et al., 2018). that might be used in the future to test our relations between host and dSph galaxies. For the moment, even Wheeler et al. (2018, see their Fig. 7) have not fully reproduced the relation shown in the left panel of Figure 5.
Appendix C Accounting for uncertainties in the analysis of the anticorrelation between acceleration and MW distance
The validity of the correlation analysis done in Sect. 2 and shown in the left panel of Figure 1 may be questioned since both axes (here called x and y) suffer from observational errors, which are both heteroschedastic and sometimes large. For each dSphs , we note the uncertainties of the measurement on , the uncertainties of the measurement on and the residuals from the fitting process.
However, the observed dispersion on originates not only from the measurement errors, but also from some (unknown) intrinsic scatter , which increases the observed dispersion, . To account for this, we checked the significance of our correlation analysis by two different methods.
First, we made a weighted regression (Ripley & Thompson, 1987) accounting for errors in both axes, and . Initially starting with a null intrinsic scatter, we iterate twice the regression for the estimation of this intrinsic scatter: we compute the residuals, and we estimate the variance of the intrinsic scatter with the variance of the residuals minus the average variances of the measurement errors, , as it is a consistent estimator of the intrinsic scatter when can be neglected. We then found that the slope is significantly negative with a p-value = 3 .
Second we used an MCMC based Bayesian hierarchical model to fit the data, which derives the posterior distribution function from the data, and considers the observation uncertainties and intrinsic scatter simultaneously777see https://github.com/sanjibs/bmcmc. The slope is , i.e. with a significance similar to what has already been found.
These results show that the correlation found at Figure 1 does not occur by chance only.
The reference list from the paper itself. Each links out to its DOI / PubMed record.
- 1Aguilar (1993) Aguilar L. A., 1993, ASPC, 49, 155
- 2Aguilar & White (1985) Aguilar, L. A., & White, S. D. M. 1985, Ap J, 295, 374
- 3Ball et al. (2018) Ball, C., Cannon, J. M., Leisman, L., et al. 2018, AJ, 155, 65
- 4Battaglia et al. (2006) Battaglia, G., Tolstoy, E., Helmi, A., et al. 2006, A&A, 459, 423
- 5Battaglia et al. (2012) Battaglia, G., Irwin, M., Tolstoy, E., de Boer, T., & Mateo, M. 2012, Ap J, 761, L 31
- 6Bernstein-Cooper et al. (2014) Bernstein-Cooper, E. Z., Cannon, J. M., Elson, E. C., et al. 2014, AJ, 148, 35
- 7Bhattacharjee et al. (2014) Bhattacharjee, P., Chaudhury, S., & Kundu, S. 2014, Ap J, 785, 63
- 8Binney & Tremaine (1987) Binney, J. and Tremaine, S., 1987, Galactic Dynamics, Princeton: Princeton Univ. Press, P. 433.