Exploratory Data Analysis of a Network Telescope Traffic and Prediction of Port Probing Rates
Mehdi Zakroum, Abdellah Houmz, Mounir Ghogho, Ghita Mezzour,, Abdelkader Lahmadi, J\'er\^ome Fran\c{c}ois, Mohammed El Koutbi

TL;DR
This paper analyzes large-scale network probing traffic from a /20 network telescope, exploring its properties, behavior patterns, and evaluating models for predicting port probing rates to enhance cybersecurity strategies.
Contribution
It provides a comprehensive exploratory analysis of network probing activities and assesses the effectiveness of autoregressive models for predicting probing rates.
Findings
Identified key probing behaviors and patterns.
Modeled behavior using transition graphs.
Evaluated predictive models with promising results.
Abstract
Understanding the properties exhibited by large scale network probing traffic would improve cyber threat intelligence. In addition, the prediction of probing rates is a key feature for security practitioners in their endeavors for making better operational decisions and for enhancing their defense strategy skills. In this work, we study different aspects of the traffic captured by a /20 network telescope. First, we perform an exploratory data analysis of the collected probing activities. The investigation includes probing rates at the port level, services interesting top network probers and the distribution of probing rates by geolocation. Second, we extract the network probers exploration patterns. We model these behaviors using transition graphs decorated with probabilities of switching from a port to another. Finally, we assess the capacity of Non-stationary Autoregressive and Vector…
Click any figure to enlarge with its caption.
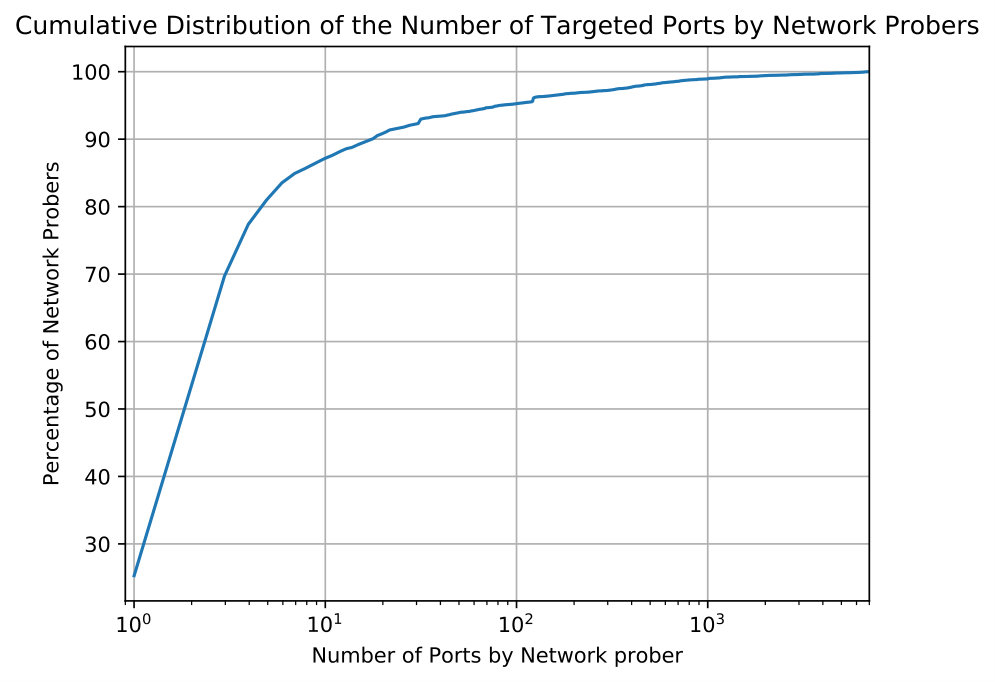 Figure 1
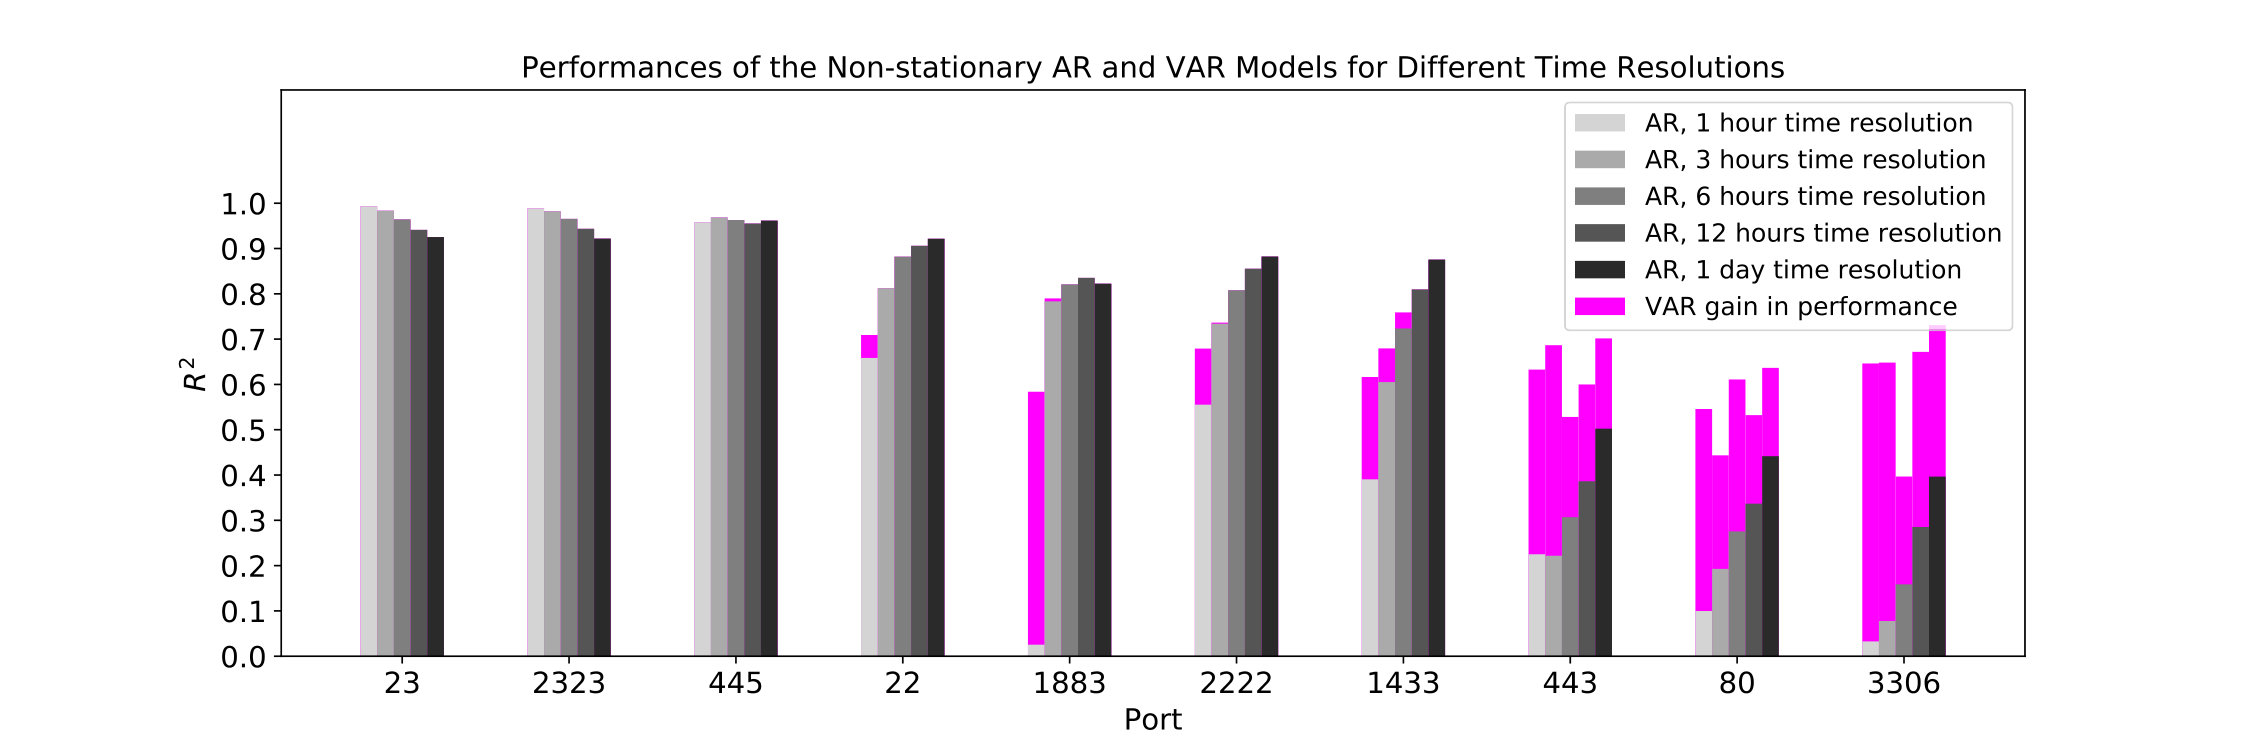 Figure 2
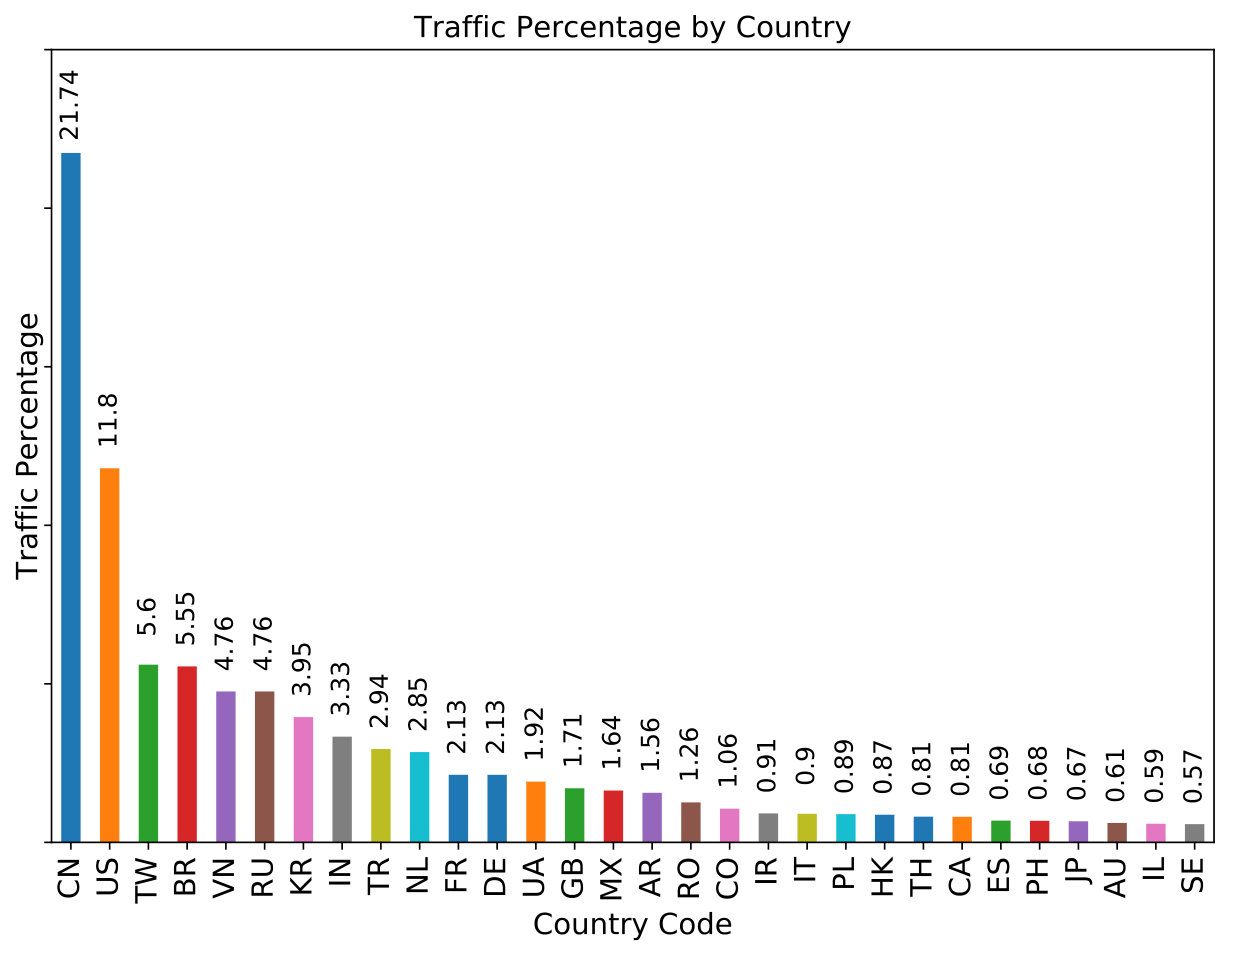 Figure 3
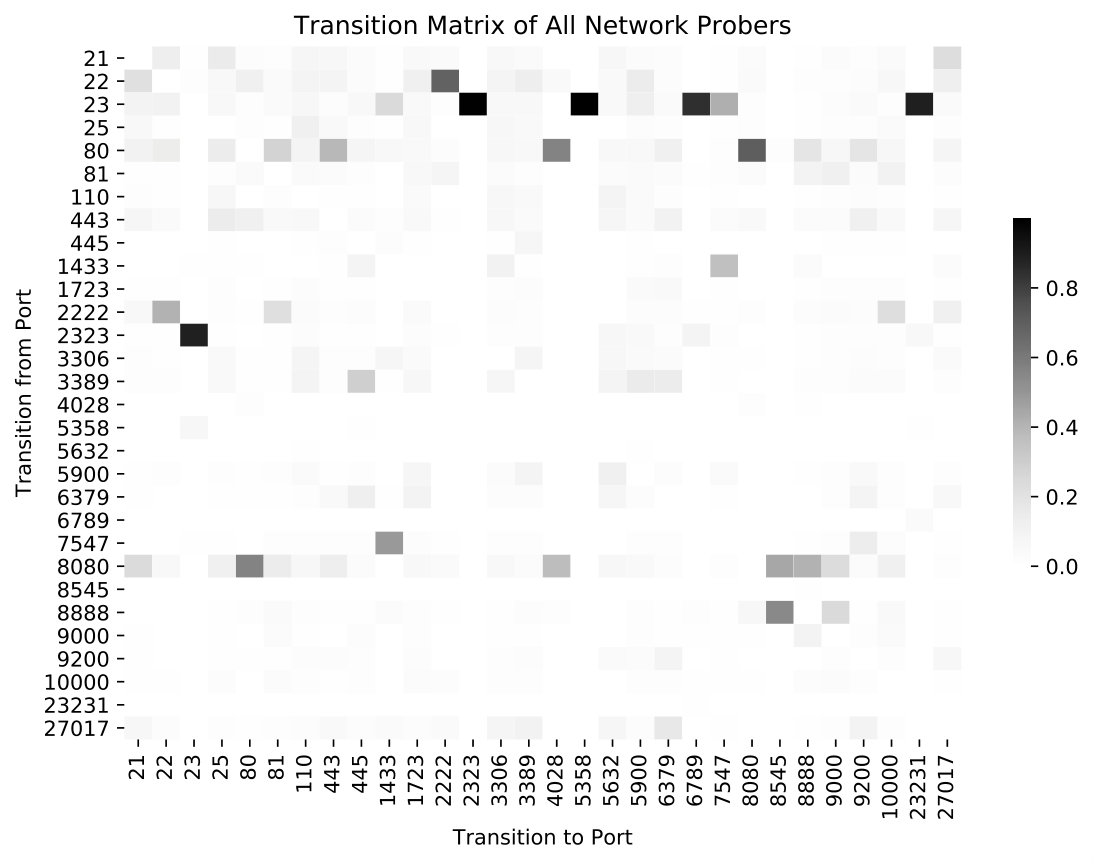 Figure 4
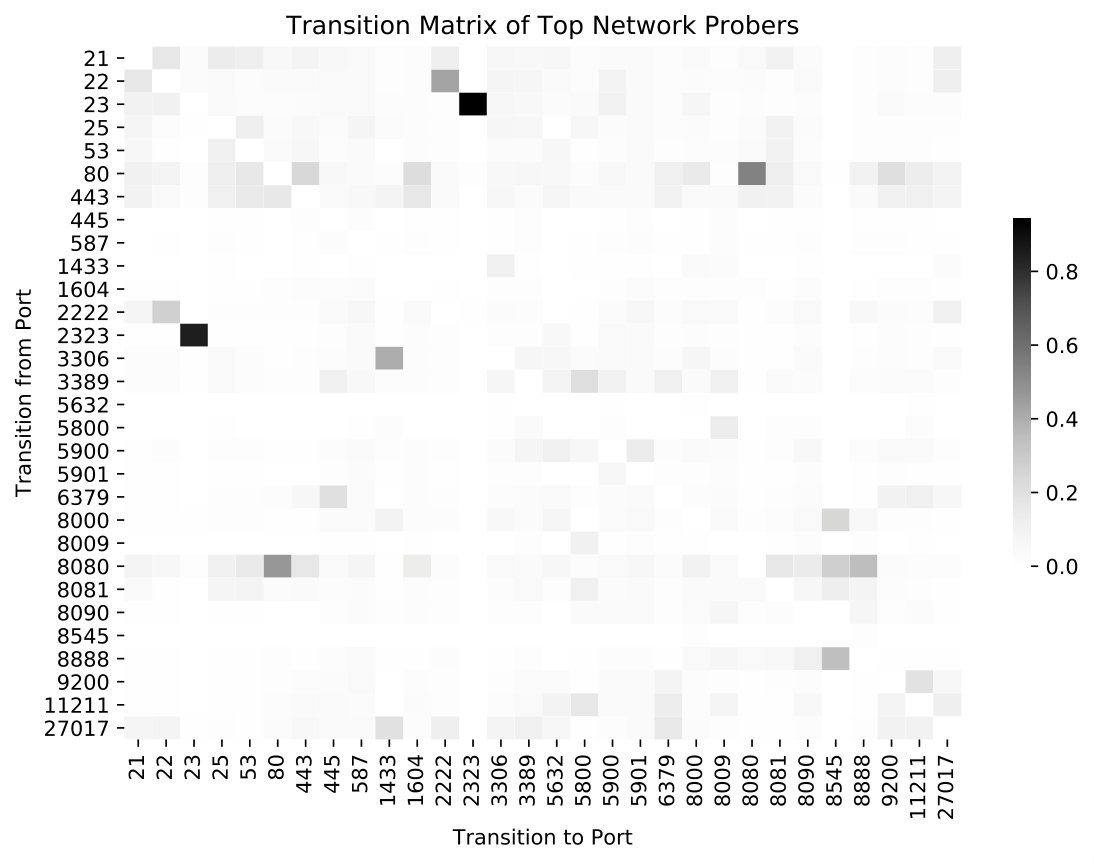 Figure 5
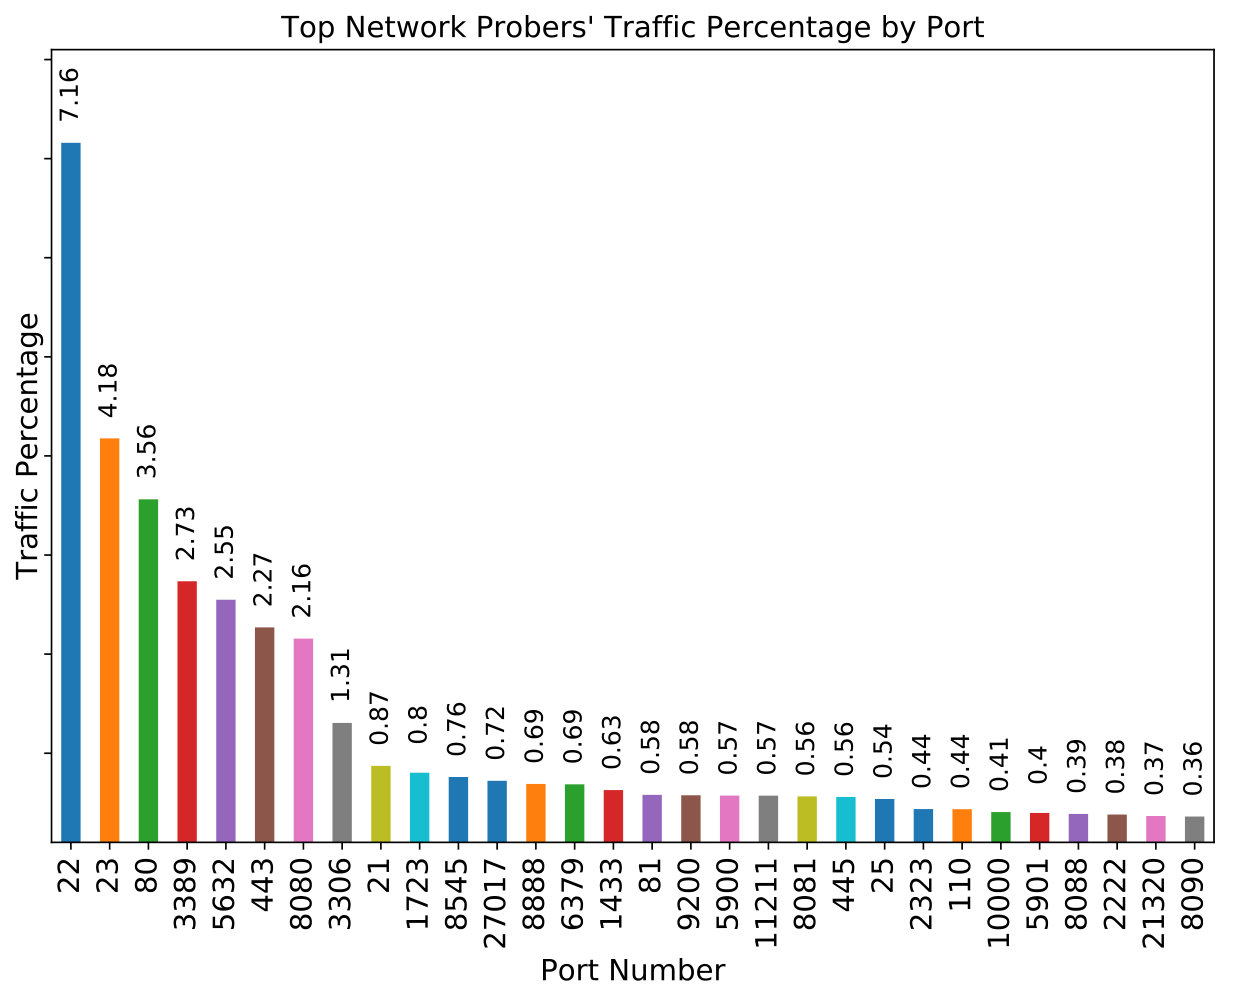 Figure 6
 Figure 7
 Figure 8
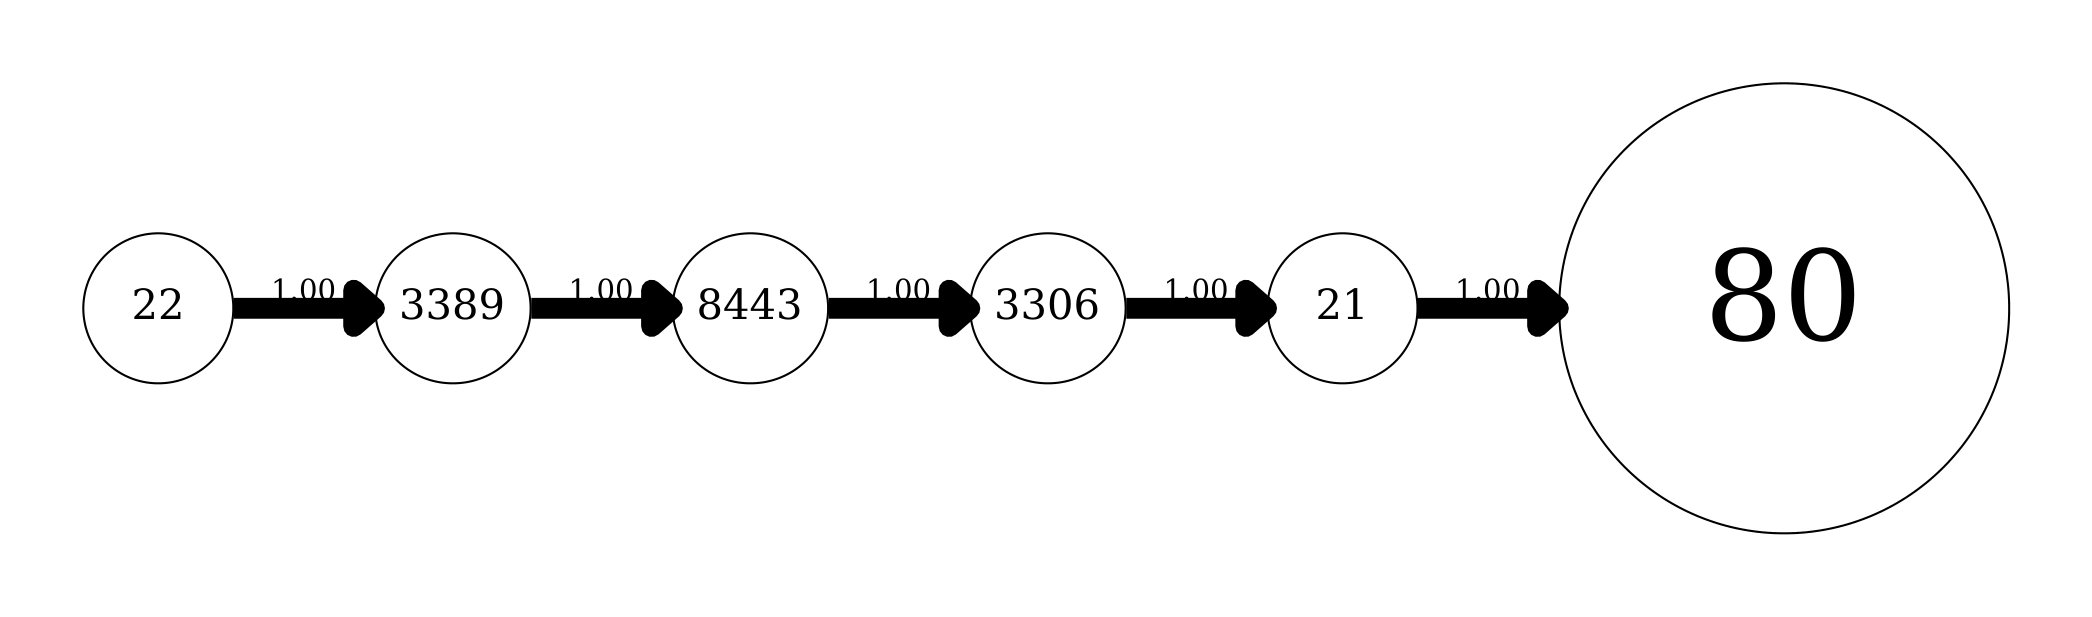 Figure 9
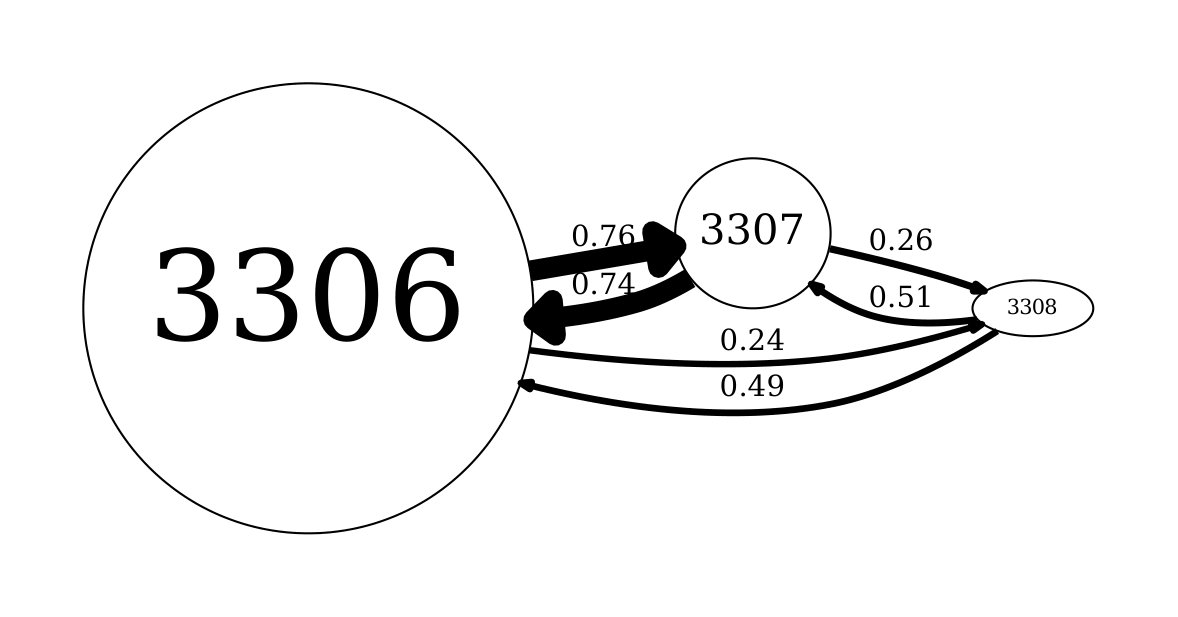 Figure 10
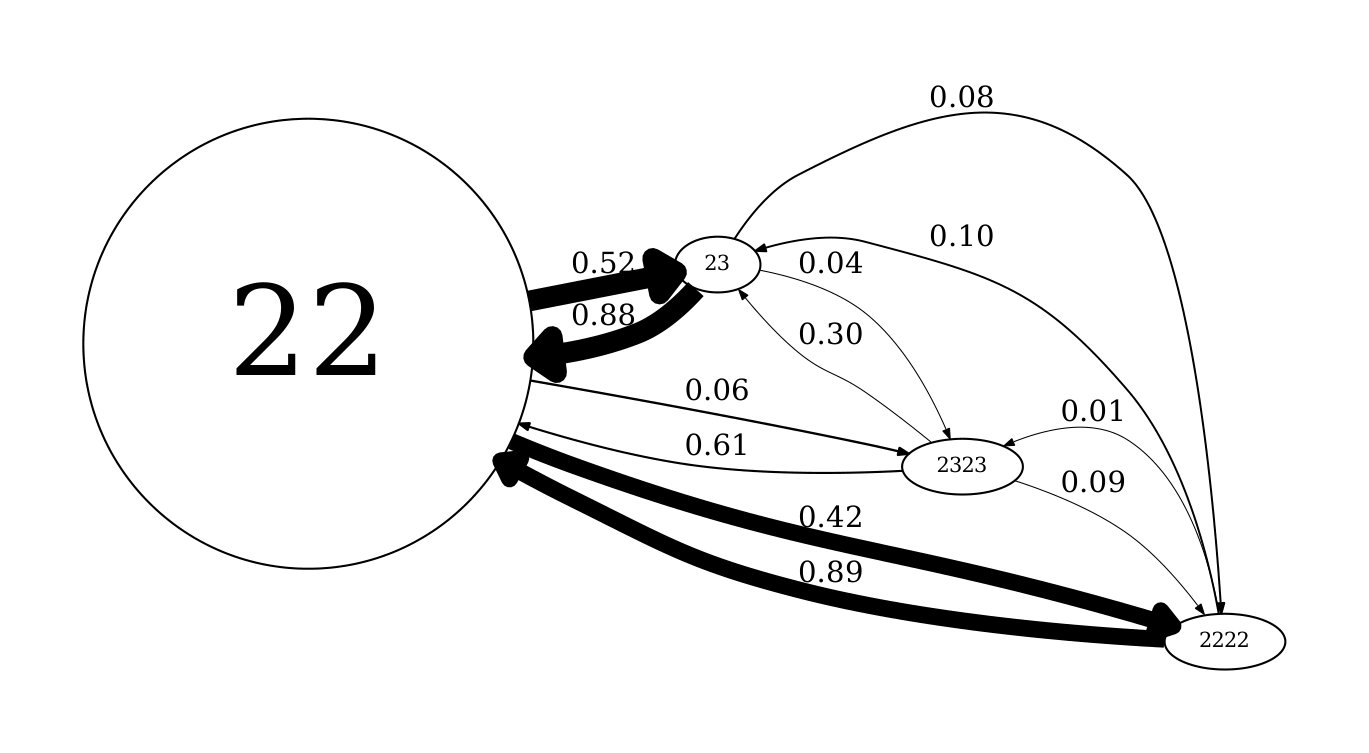 Figure 11
 Figure 12
 Figure 13
| Network | 1 hour | 3 hours | 6 hours | 12 hours | 1 day | |||||||||||||||
|---|---|---|---|---|---|---|---|---|---|---|---|---|---|---|---|---|---|---|---|---|
| Service | ||||||||||||||||||||
| 23 (telnet) | 1 | 17530 | 0.99 | 0.99 | 8 | 5930 | 0.98 | 0.98 | 4 | 2880 | 0.96 | 0.96 | 6 | 1480 | 0.94 | 0.94 | 1 | 60 | 0.93 | 0.93 |
| 2323 (telnet alt.) | 4 | 17400 | 0.99 | 0.99 | 2 | 5760 | 0.98 | 0.98 | 4 | 2880 | 0.97 | 0.97 | 1 | 120 | 0.94 | 0.94 | 1 | 720 | 0.92 | 0.92 |
| 22 (ssh) | 10 | 19090 | 0.66 | 0.71 | 10 | 6380 | 0.81 | 0.81 | 9 | 3190 | 0.88 | 0.88 | 10 | 1590 | 0.91 | 0.91 | 9 | 800 | 0.92 | 0.92 |
| 2222 (ssh alt.) | 10 | 19430 | 0.56 | 0.68 | 10 | 6390 | 0.73 | 0.74 | 8 | 3190 | 0.81 | 0.81 | 9 | 1590 | 0.86 | 0.86 | 6 | 800 | 0.88 | 0.88 |
| 445 (microsoft-ds) | 10 | 16080 | 0.96 | 0.96 | 1 | 160 | 0.97 | 0.97 | 10 | 2960 | 0.96 | 0.96 | 10 | 1590 | 0.96 | 0.96 | 8 | 740 | 0.96 | 0.96 |
| 80 (http) | 10 | 12890 | 0.10 | 0.55 | 8 | 550 | 0.19 | 0.44 | 8 | 2880 | 0.28 | 0.61 | 7 | 1450 | 0.34 | 0.53 | 7 | 800 | 0.44 | 0.64 |
| 443 (https) | 6 | 18870 | 0.23 | 0.63 | 8 | 6430 | 0.22 | 0.69 | 8 | 3230 | 0.31 | 0.53 | 10 | 1610 | 0.39 | 0.60 | 9 | 800 | 0.50 | 0.70 |
| 3306 (mysql) | 1 | 700 | 0.03 | 0.65 | 1 | 250 | 0.08 | 0.65 | 8 | 2860 | 0.16 | 0.40 | 10 | 1440 | 0.29 | 0.67 | 8 | 720 | 0.40 | 0.73 |
| 1433 (mssql) | 1 | 120 | 0.39 | 0.62 | 1 | 60 | 0.61 | 0.68 | 9 | 2940 | 0.72 | 0.76 | 10 | 1460 | 0.81 | 0.81 | 5 | 730 | 0.88 | 0.88 |
| 1883 (mqtt) | 1 | 360 | 0.03 | 0.58 | 9 | 6000 | 0.78 | 0.79 | 9 | 3000 | 0.82 | 0.82 | 10 | 1510 | 0.84 | 0.84 | 7 | 730 | 0.82 | 0.82 |
Peer Reviews
No public reviews on file for this paper yet. If you reviewed it on a platform where reviews are public (OpenReview, ICLR, NeurIPS, ICML), you can paste yours below so the community can read it here.
Videos
No videos yet. Explain this paper in a talk, walkthrough, or lecture? Add one.
Taxonomy
TopicsNetwork Security and Intrusion Detection · Software System Performance and Reliability · Software-Defined Networks and 5G
Exploratory Data Analysis of a Network Telescope Traffic
and Prediction of Port Probing Rates
Mehdi Zakroum1, Abdellah Houmz13, Mounir Ghogho1, Ghita Mezzour1,
Abdelkader Lahmadi4, Jérôme François4, and Mohammed El Koutbi3
1International University of Rabat, TICLab, Morocco
3Mohammed V University of Rabat, ENSIAS, Morocco
4Université de Lorraine, CNRS, Inria, LORIA, F-54000 Nancy, France
{mehdi.zakroum,abdellah.houmz,mounir.ghogho,ghita.mezzour}@uir.ac.ma
{abdelkader.lahmadi,jerome.francois}@inria.fr
Abstract
Understanding the properties exhibited by large scale network probing traffic would improve cyber threat intelligence. In addition, the prediction of probing rates is a key feature for security practitioners in their endeavors for making better operational decisions and for enhancing their defense strategy skills. In this work, we study different aspects of the traffic captured by a /20 network telescope. First, we perform an exploratory data analysis of the collected probing activities. The investigation includes probing rates at the port level, services interesting top network probers and the distribution of probing rates by geolocation. Second, we extract the network probers exploration patterns. We model these behaviors using transition graphs decorated with probabilities of switching from a port to another. Finally, we assess the capacity of Non-stationary Autoregressive and Vector Autoregressive models in predicting port probing rates as a first step towards using more robust models for better forecasting performance.
Index Terms:
Cyber Intelligence, Cyber Security, Network Telescope, Darknet, Probing Patterns, Transition Graphs, Prediction of Probing Rates, Non-stationary Autoregressive Model, Non-stationary Vector Autoregressive Model, Machine Learning
††publicationid: pubid: 978-1-5386-7848-0/18/$31.00 © 2018 IEEE
I Introduction
New cyber threat vectors and vulnerabilities are constantly emerging with the evolution of technology. Attackers commonly scan networks to find vulnerable devices which can be used for malicious intents. One of the major attacks happened in 2016 is the Dyn DDoS attack. The attackers used botnets of vulnerable devices as a primary source of their DDoS traffic generation, making leading internet platforms unavailable for a large number of users.
Improving our knowledge on scan activities will help to prevent cyber attacks through early detection, and in general, to enhance security policies. Many causes can trigger scan campaigns such as vulnerability disclosure, worm spread and zero days. Generally, such malicious traffic is hidden by a large amount of legitimate traffic, making it complex to be identified by internet service providers and network security operators to protect target users.
A passive approach for identifying network probing activities are network telescopes, also known as darknets. A network telescope is a sensor logging the traffic received by a set of passive unallocated network addresses. Therefore, the traffic received by the network telescope is considered suspicious, requiring thus to be examined.
To collect such traffic, we use a network telescope hosted at INRIA Nancy-Grand Est consisting of nearly 4096 IPv4 addresses. By analyzing the collected data, we aim to answer the following questions:
- •
What are the most targeted services? What are the services targeted by the top network probers?
- •
How network probers are exploring the target network? How to model these probing activities?
- •
Can we predict probing rates of the targeted services?
The remainder of this paper is structured as follows. The next section provides a review of the related work to this study. Section III presents an exploratory analysis of the darknet traffic. In section IV, we identify the attackers probing patterns. Finally, in section V, we explore the capacity of Non-stationary Autoregressive and Vector Autoregressive models to forecast the probing rates at the port level.
II Related Work
Reconnaissance is the first phase in the cyber kill chain, where the attacker scans the target infrastructure looking for vulnerabilities. A more generic approach for finding vulnerable devices consists of scanning the whole IPv4 address space, including network telescopes. Many studies leverage the traffic captured by the latter to study different aspects of probing activities. Durumeric et al. [1] studied the traffic acquired by a large network telescope consisting of 5.5M IP addresses. The study includes the origin of scans, the targeted services by network probers and the effect of vulnerability publication on probing activities. Bou-harb et al. [2] used a probabilistic and statistical approach to identify the origin of the probing activities: whether they are generated by scanning tools or by worms and botnets. They also studied whether probing activities are random or they exhibit specific patterns. Eto et al. [3] proposed a method to extract the features of scanning malwares based on the oscillation of destination IP addresses in the captured scan packets. Li et al. [4] proposed a general framework that identifies scanning events and analyzing methods used by botnets in probing compaigns. They applied their framework to extract the scanning characteristics of a set of 6 botnets. Papale et al. [5] analyzed a 12-day world-wide cyber scanning campaign targeting VoIP (SIP) servers caught by a /8 darknet. They found that the origin is the Sality botnet which generated about 20 million packet from roughly 3 million IP addresses.
Few studies explored the dependencies between targeted ports. McNutt and Markus [6] presented a method for detecting the start of anomalous port-specific activity by recognizing deviation from correlated activities. They found a high correlation between time series of flow counts on unassigned or obsolete ports that do not have active services. Therefore, they can detect ports receiving anomalous activities. In contrast to our work, they used in their study a traffic of an organization network (not a darknet traffic), where the amount of benign traffic is large, hiding thus malicious traffic. Lagraa and François [7] inferred the dependency between services using graph analysis. They proposed a graph-based model to discover port scanning behavior patterns. They applied methods utilized for community structure discovery in large graphs in order to identify clusters of ports. Our work generalizes their approach: instead of constructing graphs for each pair of source and destination IP addresses, our graphs aggregate the probing activity by source IP address. This approach shows the general exploration pattern followed by a network prober, regardless of the target host.
III Exploratory Data Analysis
III-A Data Set
The data we use is collected by a /20 network telescope. The traffic was recorded from November 2014 until October 2017 and has a size of 2 TB. The collected traffic consists of timestamped packet headers. We record for each packet the source and the destination IP addresses, the source and the destination ports and the packet’s flags. Our study focuses on stateful connections established from the source. Hence, we consider only packets with a TCP SYN flag which count for approximately 4.5 billion packets.
III-B Traffic by Port
We begin by extracting the traffic received by each port. That is, we aggregate the received traffic by destination port and we count the number of TCP SYN packets for each destination port. Figure 1 shows the 30 most targeted ports. We observe that the most targeted services are remote access services, web servers, database management systems and some Microsoft services. The network probers tend to use alternative ports in addition to the official ones. The port 23 (telnet) generates more than 50% of the traffic. Figure 2 shows that among 65535 ports, only 35 generate 80% of the traffic and 550 generate 90% of the traffic.
III-C Top Network Probers’ Interests
The intent of a network prober might be manifested in the services he targets. Knowing the ports that interest the top network probers determines services requiring particular security efforts. We consider as a top network prober one maintaining an average probing rate higher than 150 TCP SYN packets per day. It is noteworthy that our definition of top network probers does not include probers performing distributed probing activities.
First, we count TCP SYN packets sent by more than 64 million source IP addresses included in our data set. Then, for each top network prober (they are nearly 1500), we extract the probing rates received by each port and we aggregate the counts by port. Figure 3 shows the 30 most targeted ports by top network probers. In contrast to the results in Figure 1, top network probers focuse their probing activities on the port 22 (SSH) rather than the port 23 (telnet).
III-D Traffic by Country
The distribution of the received traffic by geolocation helps determining how likely an occurred probing campaign is originating from a specific country. We extract the total traffic caught by the network telescope by country. We infer the country code from the source IP address using the DB-IP database111URL: https://db-ip.com/. Figure 4 summarizes the received traffic by country code.
IV Probing Patterns
In this section, we model the behavior of network probers using transition graphs. We assess the relationship between targeted services by determining the probability of transition from a port to another, then, we identify different network exploration patterns.
IV-A Graph Modeling
A network communication can be identified by a 5-tuple: source and destination IP addresses, source and destination ports, and the transport protocol. Our aim is to analyze for each network prober the exploration behavior of the whole darknet. Hence, we take into account only two features: the source IP address and the destination port.
To extract the graphs, we begin by aggregating the traffic generated by each network prober. Then, we count the number of transitions from a destination port to another by sequentially browsing the extracted traffic. These counts are finally normalized in order to get the transition probabilities. It is to note that the time dimension is omitted during this process.
Formally, we extract for each source IP address a transition graph , in which is the set of destination ports targeted by the network prober and represents the transition probabilities between destination ports that are elements of . The association between two elements and of represents the probability that the network prober switches from to .
IV-B Extracted Graphs
Figure 5 shows a sample of transition graphs corresponding to 3 network probers. Figure 5a represents a network prober sequentially targeting services typically deployed in web servers: SSH (22), RDP (3389), MySQL (3306) and FTP (21), while focusing on the HTTP (80) server. Figure 5b shows a network prober targeting only the MySQL server port in addition to two of its alternatives. Figure 5c corresponds to a network prober targeting remote access services such as SSH (22) and its alternative (2222), and telnet (23) and its alternative (2323). Many other probing patterns were identified but they are too large to fit in this paper.
The extracted transition graphs differ from each other by two main components: the number of vertices that corresponds to the destination ports and the number of edges describing the exploration behavior of a network prober. Figure 6 represents the cumulative distribution function of the number of target ports by individual network probers. We observe that more than 80% of network probers target less than five ports in the whole darknet space. This means that most attackers are focusing their probing activities only on services of interest, which might be related to a vulnerability disclosure for example.
IV-C Relationship Between Ports
In this section, we aim to identify the relationship between ports in terms of transition probabilities. We begin by aggregating by network prober the number of transitions from a port to another. Then, normalize these counts by the total number of transitions. We repeat this process for all network probers combined together and for top network probers (as defined in section III-C).
Figure 7 represents the transition matrix of the 30 most targeted ports in the whole darknet (see section III-B). Unsurprisingly, the figure shows a high association between ports and their alternatives: 23 and 2323, 80 and 8080, and 22 and 2222. The figure also emphasizes a strong relationship between services of the same type such as MS-SQL SERVER (1433) and MySQL (3306).
Similarly, Figure 8 shows the transition probabilities of the 30 most targeted ports by top network probers. We observe fewer relationships compared to the previous transition matrix. Nevertheless, the SSH and telnet services as well as their alternatives still strongly related.
V Prediction of Port Probing Rates
Predicting probing activities at the service level is a key feature for making better security operational decisions. Observing a significant disparity between the predicted probing rate and the actual value may help detecting an imminent threat. In this section, we forecast the probing rate of a target port by measuring its previous probing rates as well as the traffic received by the other ports. The predictions are performed one step ahead of time using the non-stationary autoregressive model (AR) and the non-stationary vector autoregressive model (VAR), for each port of the 550 most targeted ports (see Section III-B), for different time resolutions.
V-A Data Set
The probing rate is inferred for different time resolutions: 1 hour, 3 hours, 6 hours, 12 hours and 1 day. For each time resolution, we extract a data set consisting of the probing rate time series of the most targeted ports in which each record is a vector of probing rates occurring in the same time interval.
V-B Non-stationarity of Probing Rate Time Series and Design Parameters
The analysis of the port probing rate time series showed non-stationarity of the first and the second order statistics over the period of 3 years. However, we observed that when considering shorter time windows, the non-stationarity tends to be alleviated at least in terms of average. Therefore, we introduce a “rolling window” over the probing rate time series. We train the estimators using the data falling in the rolling window, then the prediction is performed one step ahead of time. The size of the rolling window is a design parameter that could be interpreted as follows: a short rolling window allows to track the trend in time while larger rolling windows has the effect of averaging the trend. Another design parameter to consider is the autoregressive order which allows the model to infer the linear short term dependencies.
V-C Non-stationary AR and VAR Models
To forecast probing rates, we use the non-stationary autoregressive model of order given by:
[TABLE]
where is the probing rate received by the port at time . is the white noise at time . is the vector of the model parameters. These parameters are estimated using data falling in the rolling window (see Section V-B) and they vary in time.
The non-stationary vector autoregressive model of order is given by:
[TABLE]
where is the probing rate received by the port (the target port) at time , is the set of indexes of the retained features (see Section V-F), is the probing rate on the selected port at time , and is the white noise at time . and are the parameters of the model varying in time.
V-D Training Algorithm
After transforming the time series into a supervised learning problem, the algorithm used to train the non-stationary AR and VAR regressors is the straightforward normal equation given by:
[TABLE]
where is the vector of the trainable weights, is the probing rates feature matrix and is the probing rates response vector. In order to reduce the computation complexity, no regularization is used.
V-E Design Parameter Selection
The design parameters, namely the size of the rolling window and the autoregressive order , are determined using a grid search strategy. We varied in for the 5 considered time resolutions. Then, we tried an exhaustive set of rolling window sizes for each autoregressive order . The range of starts with time units and ends with 75% of the time series length (leaving thus at least 25% of data for validation) with an increment of 10 time units. The optimal design parameter values and are given by the estimator providing the best coefficient of determination .
V-F Feature Selection for the Non-stationary VAR Model
To improve the performance of the non-stationary VAR estimators, we select features according to their individual effect on the response variable using the Pearson correlation coefficient. This process has the effect of reducing the noise introduced by uncorrelated features. First, we split the data falling in the rolling window (the one giving the best non-stationary AR performance) into two subsets: a feature selection set including 75% of the data and a validation set . Second, we compute on the univariate correlations in term of probing rates between the target time series and the time series serving as features to the non-stationary VAR model, including the autoregressive features. Third, we iteratively select the most correlated features which we use to train non-stationary VAR model on and we calculate the coefficient of determination on the validation set . The optimal set of features given by our feature selection strategy is the one providing the best coefficient of determination. It is worth mentioning that the selected features may change over time based on the location of the rolling window in the time series. Finally, the selected features are scaled to zero mean and to unit standard deviation.
V-G Results and Discussion
Table I summarizes the performance of the non-stationary AR and VAR models for 5 different time resolutions for a set of popular services. It also includes the optimal design parameters for the non-stationary AR estimators. We used the same design parameters for the non-stationary VAR estimators.
The performance of the regressors tends to increase for larger time resolutions, for all the ports except the telnet service. This is due to lowered stochasticity of probing rates when considering larger time resolutions. Also, we observe that the probing rates of remote access services are the most predictable. The reason is that such services are highly targeted by network probers and their probing rate time series are stationary when considering short time resolutions.
Also, we observe that the non-stationary AR model produces satisfying results for services exhibiting low short term probing rates variability such as telnet (ports 23 and 2323). Figure 9 shows that non-stationary VAR model consistently produces better results for services exhibiting high probing rate variability such as the web services (ports 80 and 443) and the database management systems (ports 1433 and 3306).
It is noteworthy that the non-stationary autoregressive model fails in predicting abrupt probing rate changes because of its persistence property. More powerful and stable models such as FARIMA+GARCH could be used to predict these extreme values if the probing rate time series exhibit long-range dependence phenomenon [8, 9]. Also, such non-stationary AR and VAR models, as defined in our paper, require constant update of their parameters (the trainable weights) and their hyperparameters (the selected features) due to the non-stationarity of the probing rate time series, which is computationally expensive.
VI Conclusion
This work presented an exploratory data analysis performed on 2 TB of traffic collected by a network telescope during the period of 3 years. The investigation of the network telescope traffic showed that 90% of probing activities are targeting only 550 ports of the port space. The latter include remote access services which are the most sought by network probers, followed by database management systems, web services and miscellaneous services as well. This is providing an insight about services requiring particular security efforts.
The second task was about inferring network probers reconnaissance patterns. We modeled these exploration behaviors using transition graphs showing the probabilities of switching from a port to another. This would be exploited in different applications such as port clustering or classifying network probers based on their exploration behaviors.
Finally, we assessed to which extent the non-stationary autoregressive and vector autoregressive models could produce reliable short term probing rate predictions at the port level. Due to their short memory property, such models could be used to learn non-stationary probing rate processes with short term persistence. However, when probing rate processes exhibit long-range dependencies, more robust models could be utilized such as GRU and LSTM recurrent neural networks.
Acknowledgment
This research work is part of the ThreatPredict222https://threatpredict.loria.fr project partly funded by the NATO Science for Peace and Security (SPS) programme under research contract SPS G5319 “ThreatPredict: From Global Social and Technical Big Data to Cyber Threat Forecast”. We acknowledge the support from the National Center of Scientific and Technical Research (CNRST), Rabat, for the grant of an excellence scholarship. The authors would like to thank Frédéric Beck from the High Security Laboratory at INRIA Nancy-Grand Est, LORIA, for his efforts in managing data and computation servers.
The reference list from the paper itself. Each links out to its DOI / PubMed record.
- 1[1] Z. Durumeric, M. Bailey, and J. A. Halderman, “An Internet-Wide View of Internet-Wide Scanning.” pp. 65–78, 2014.
- 2[2] E. Bou-Harb, M. Debbabi, and C. Assi, “A Statistical Approach for Fingerprinting Probing Activities,” in 2013 International Conference on Availability, Reliability and Security . IEEE, Sep. 2013, pp. 21–30.
- 3[3] M. Eto, K. Sonoda, D. Inoue, K. Yoshioka, and K. Nakao, “A proposal of malware distinction method based on scan patterns using spectrum analysis,” in Neural Information Processing , C. S. Leung, M. Lee, and J. H. Chan, Eds. Berlin, Heidelberg: Springer Berlin Heidelberg, 2009, pp. 565–572.
- 4[4] Z. Li, A. Goyal, and Y. Chen, “Honeynet-based botnet scan traffic analysis,” in Botnet Detection . Springer, 2008, pp. 25–44.
- 5[5] A. Dainotti, A. King, k. Claffy, F. Papale, and A. Pescapè, “Analysis of a ”/0” Stealth Scan from a Botnet,” in Proceedings of the 2012 Internet Measurement Conference , ser. IMC ’12. Boston, Massachusetts, USA: ACM, 2012, pp. 1–14.
- 6[6] J. Mc Nutt and D. S. Markus, “Correlations Between Quiescent Ports in Network Flows,” 2005, p. 5.
- 7[7] S. Lagraa and J. François, “Knowledge discovery of port scans from darknet,” in Integrated Network and Service Management (IM), 2017 IFIP/IEEE Symposium On . IEEE, 2017, pp. 935–940.
- 8[8] Z. Zhan, M. Xu, and S. Xu, “Characterizing honeypot-captured cyber attacks: Statistical framework and case study,” IEEE Transactions on Information Forensics and Security , vol. 8, no. 11, pp. 1775–1789, Nov 2013.