TL;DR
This paper introduces persistence bag-of-words, a new stable vectorized representation of persistence diagrams that enhances integration with machine learning and achieves state-of-the-art results efficiently.
Contribution
The paper proposes a novel persistence bag-of-words method that simplifies and stabilizes the use of persistence diagrams in machine learning workflows.
Findings
Achieves state-of-the-art performance on benchmark tasks.
Provides a computationally efficient alternative to existing methods.
Ensures stability and robustness of the representation.
Abstract
Persistent homology (PH) is a rigorous mathematical theory that provides a robust descriptor of data in the form of persistence diagrams (PDs). PDs exhibit, however, complex structure and are difficult to integrate in today's machine learning workflows. This paper introduces persistence bag-of-words: a novel and stable vectorized representation of PDs that enables the seamless integration with machine learning. Comprehensive experiments show that the new representation achieves state-of-the-art performance and beyond in much less time than alternative approaches.
Click any figure to enlarge with its caption.
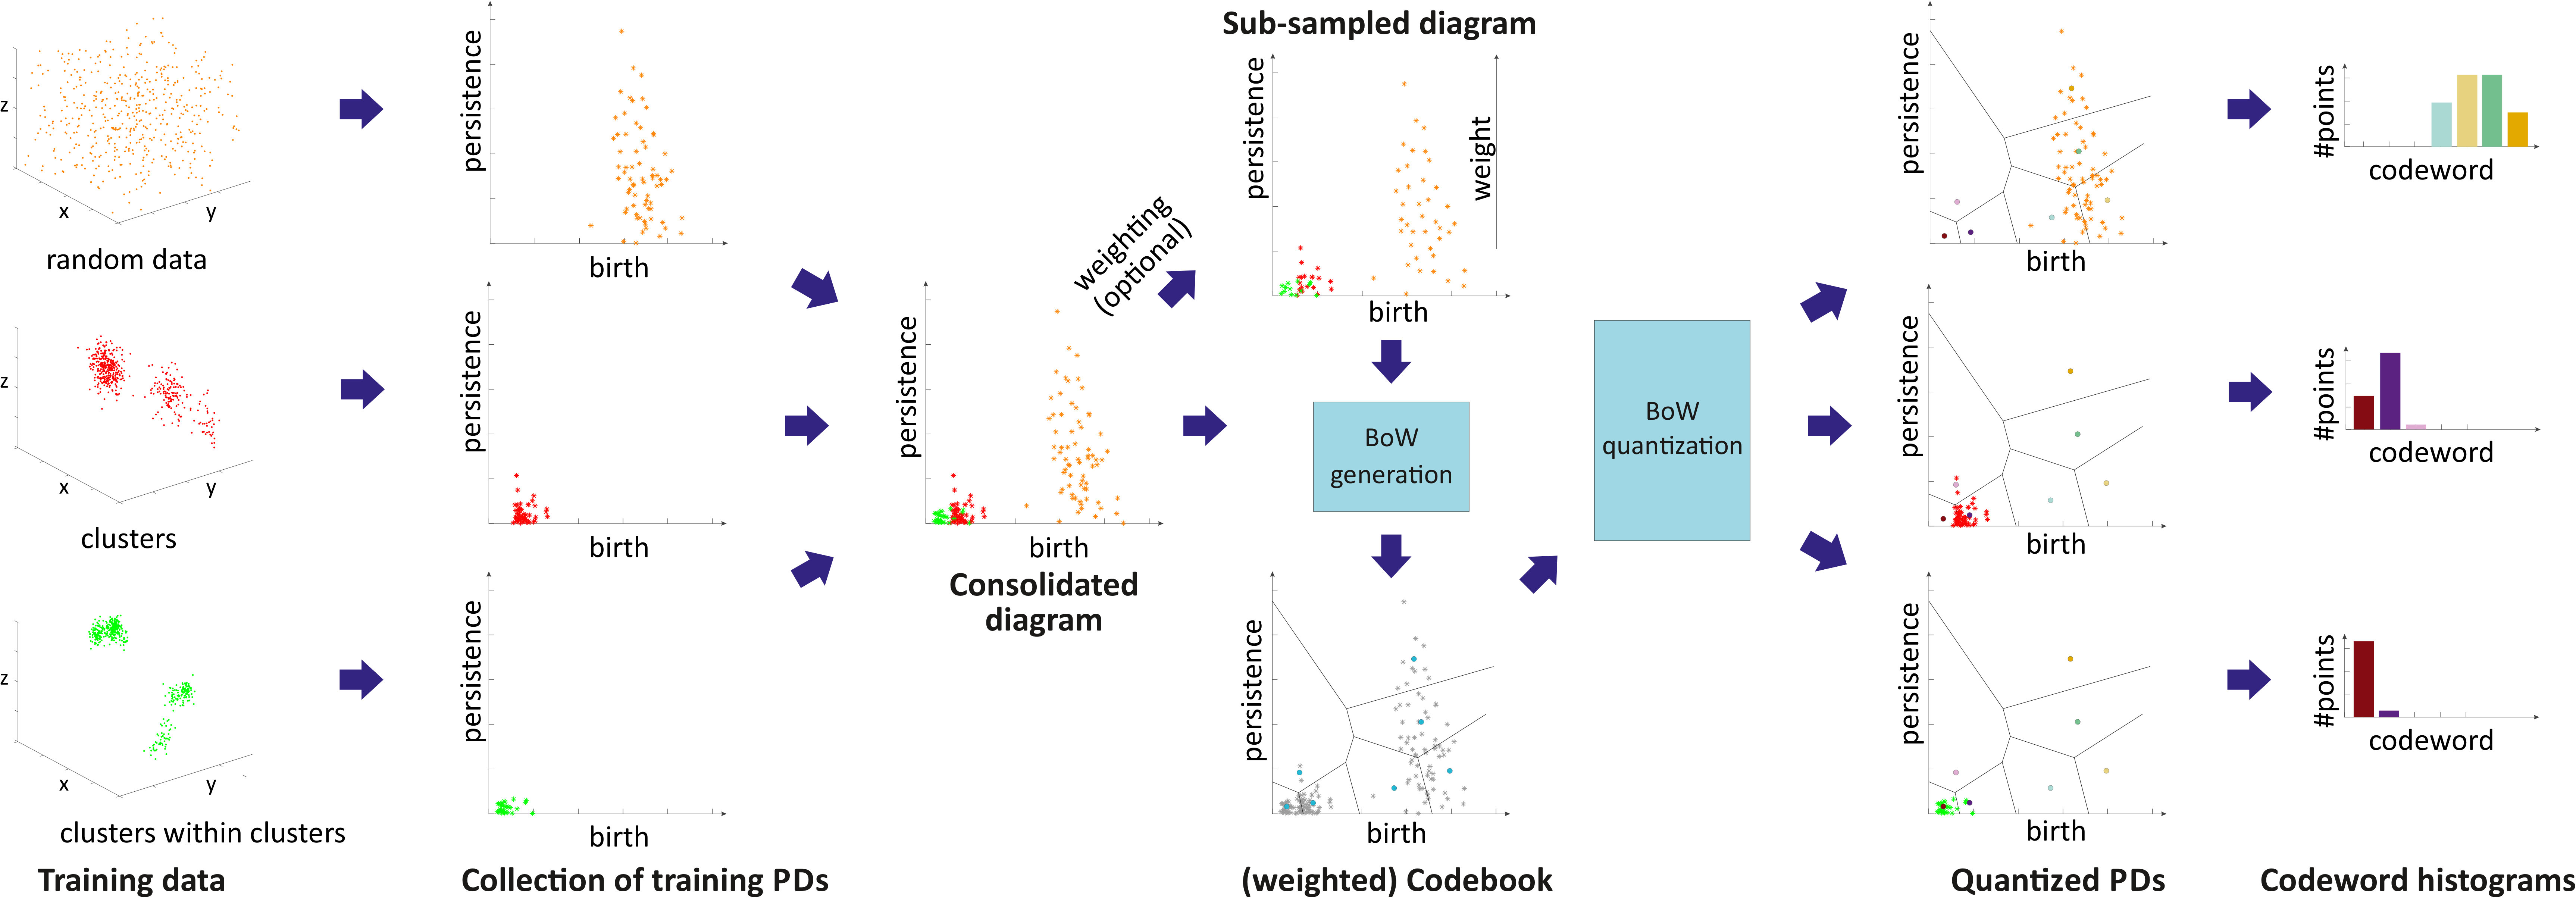 Figure 1
 Figure 2
 Figure 3
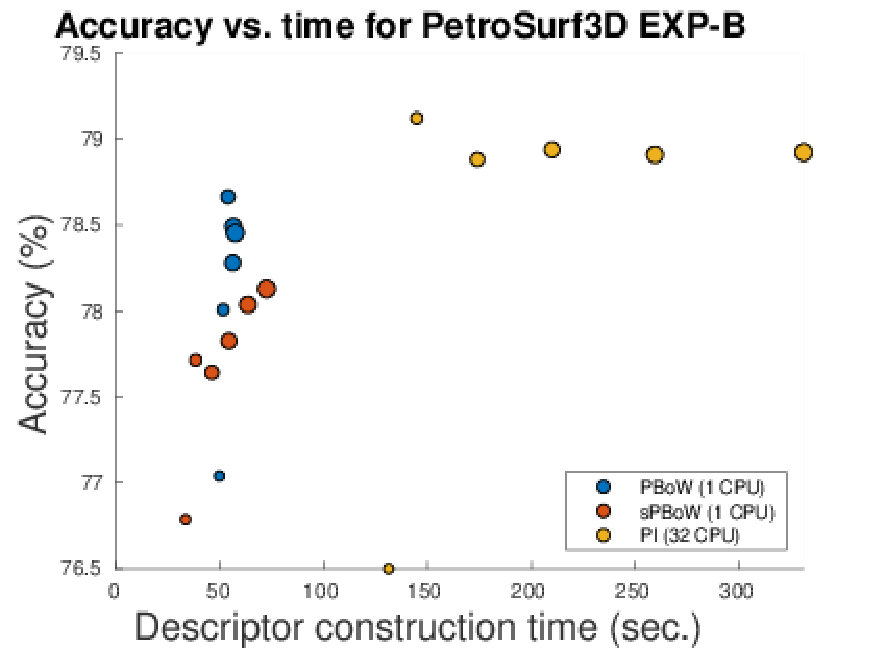 Figure 4
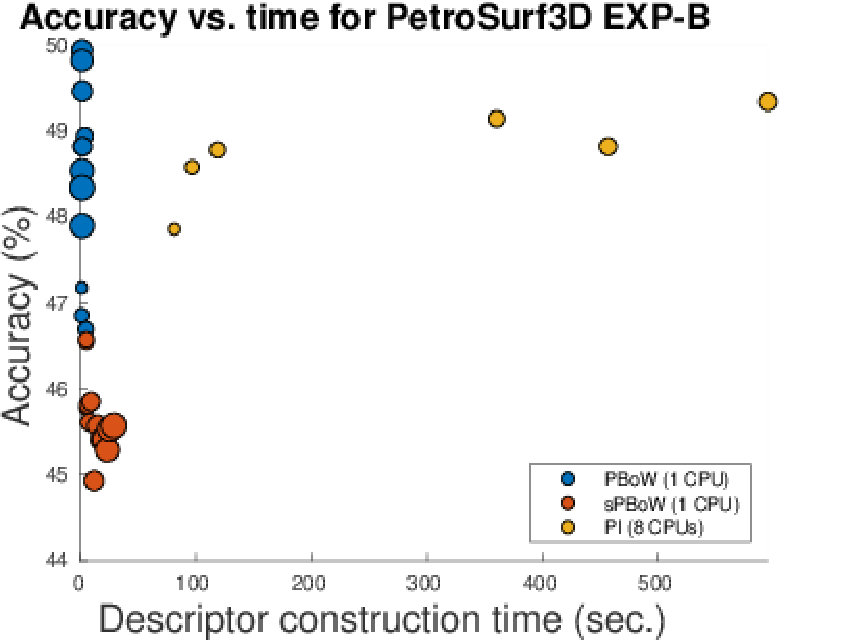 Figure 5
 Figure 6
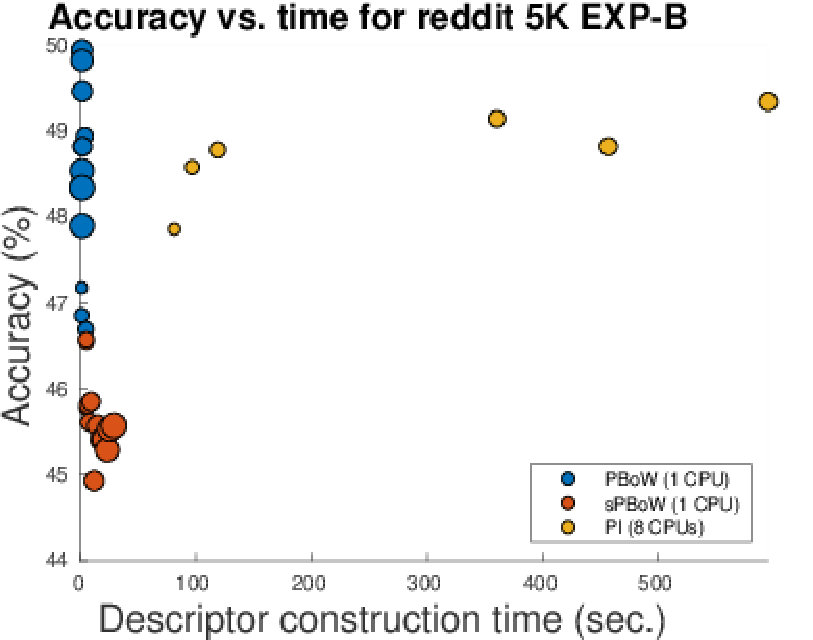 Figure 7
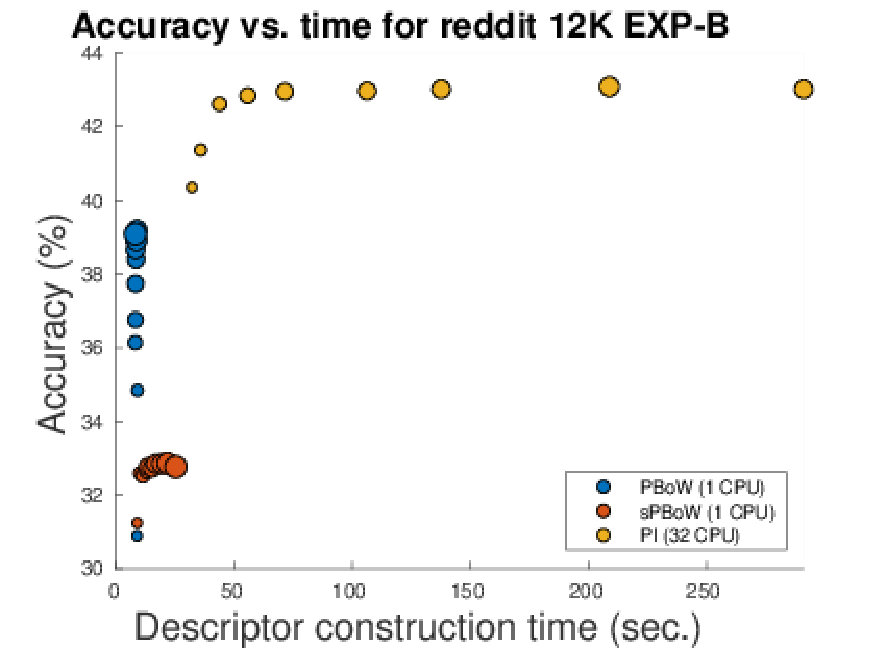 Figure 8
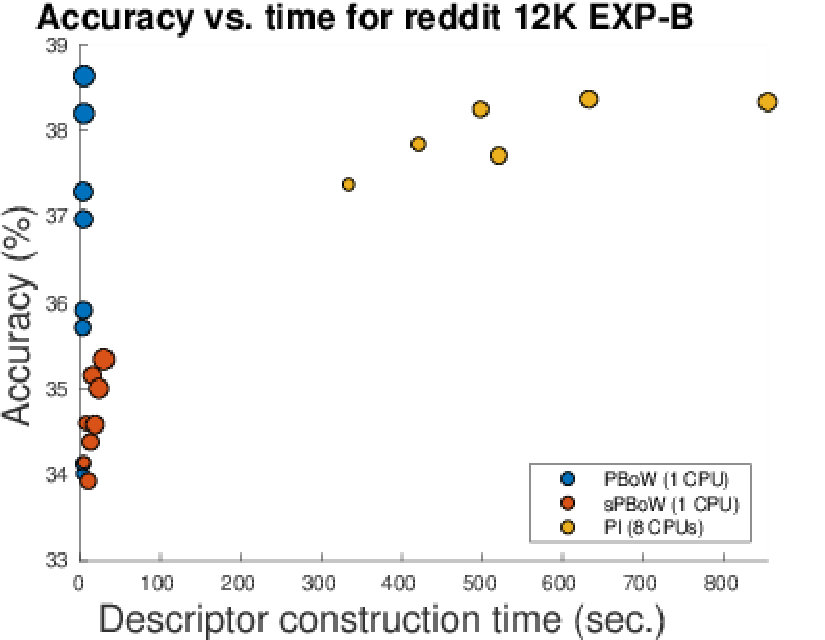 Figure 9
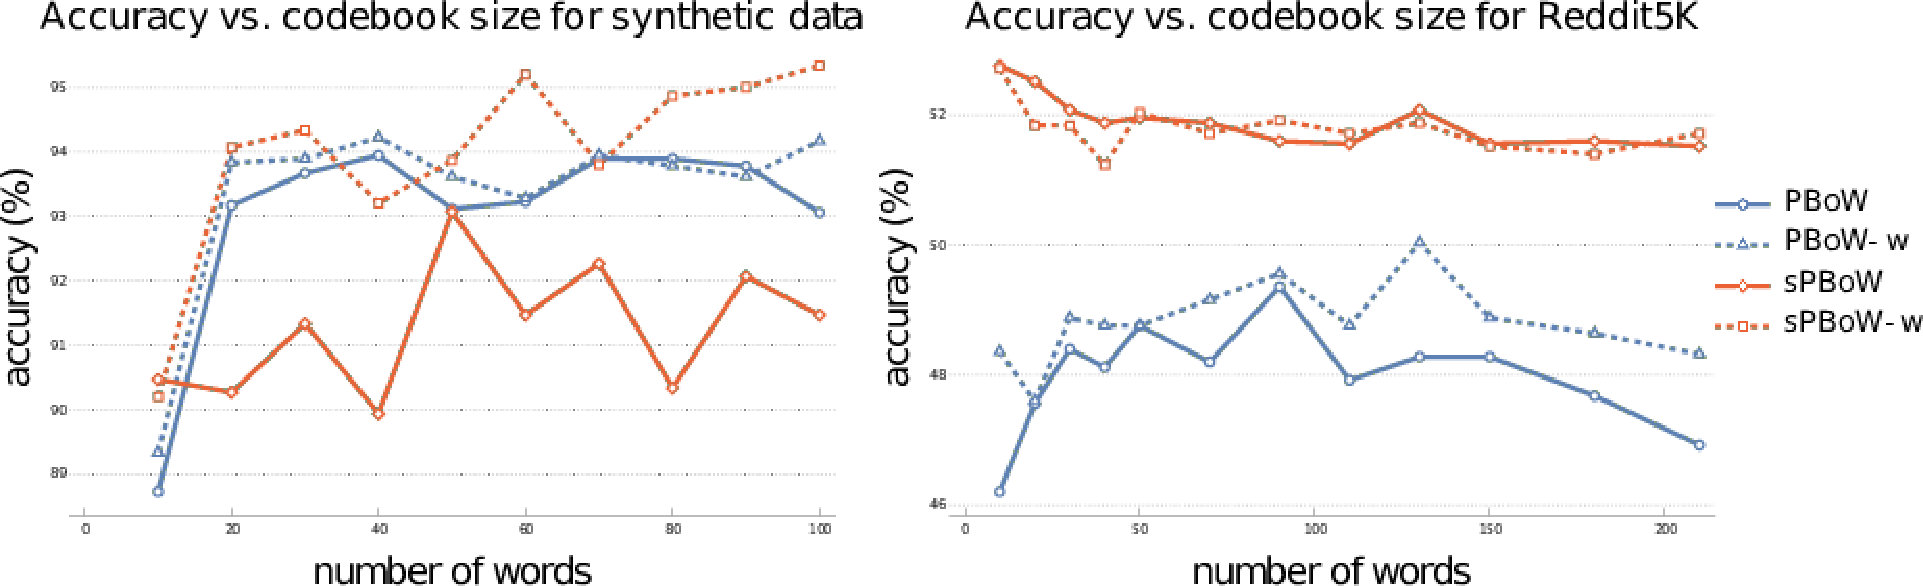 Figure 10
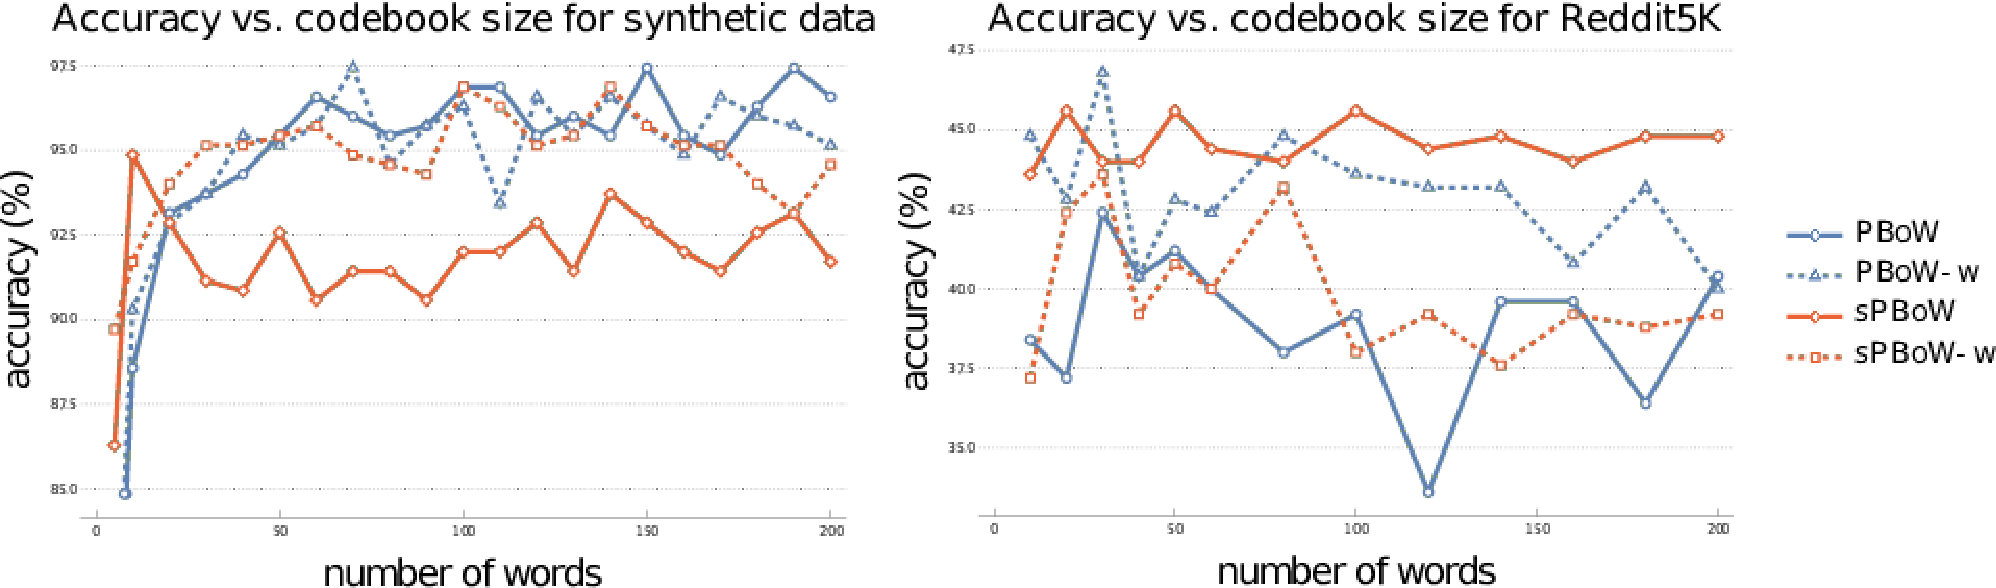 Figure 11
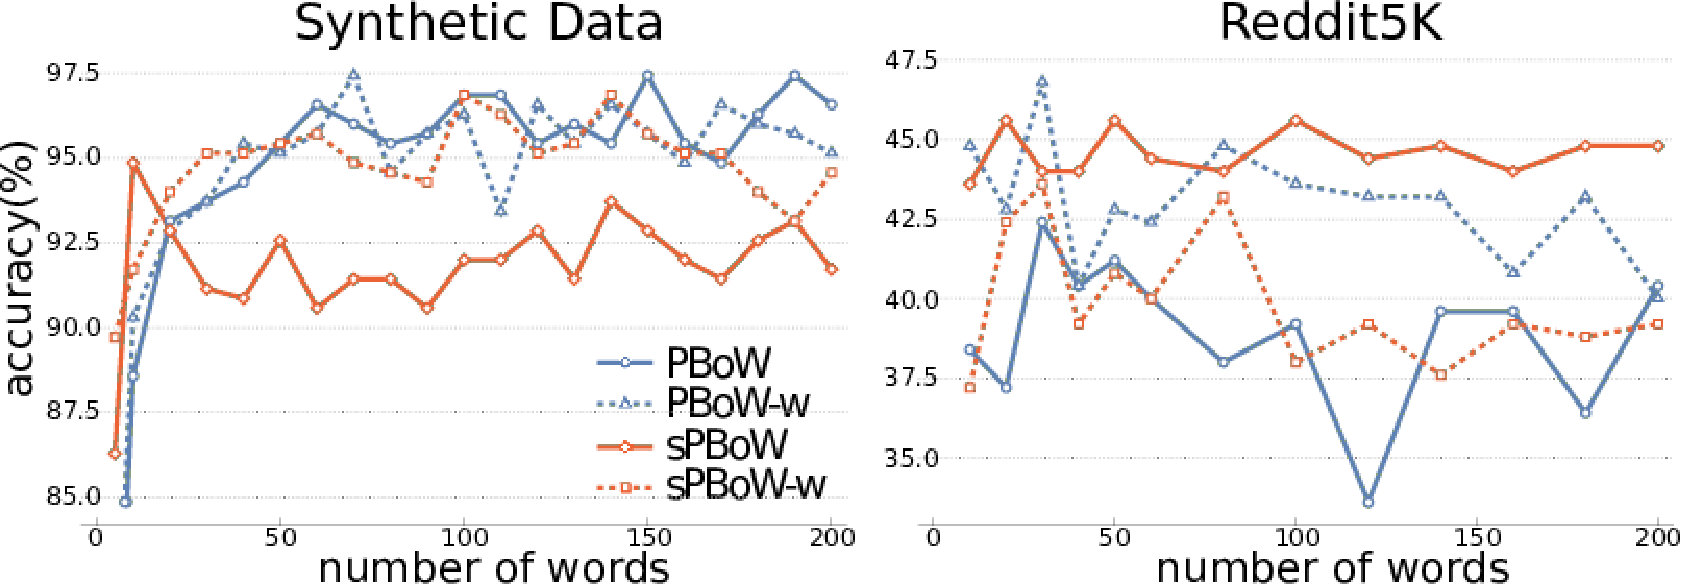 Figure 12
 Figure 13
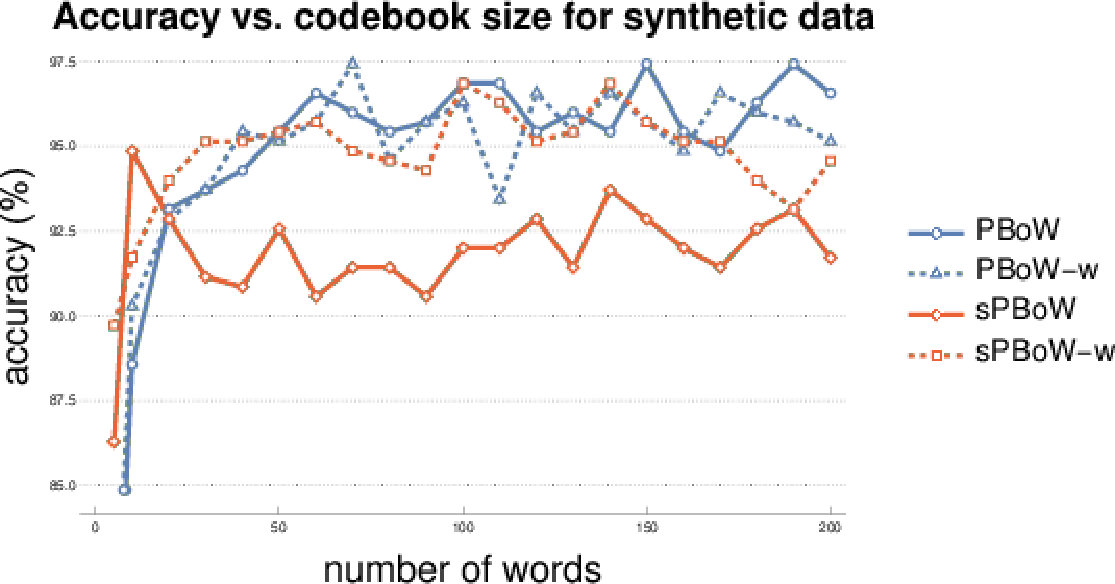 Figure 14
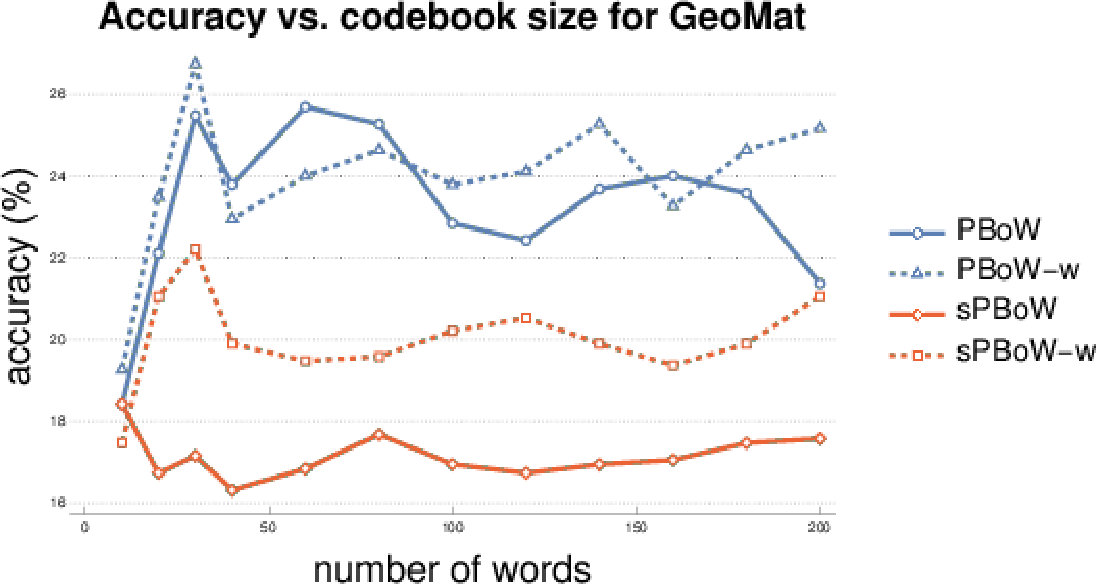 Figure 15
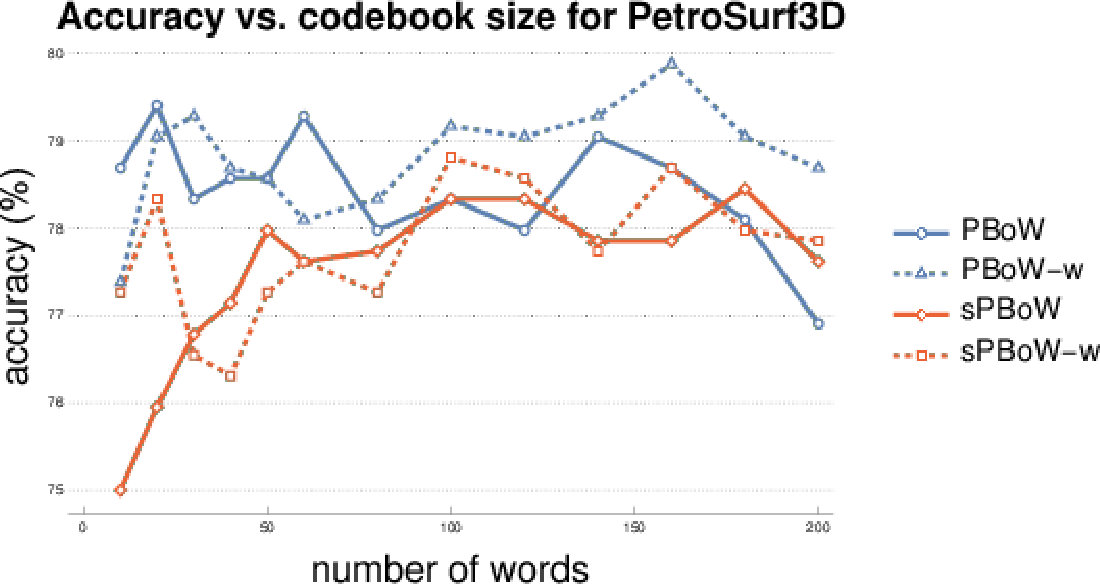 Figure 16
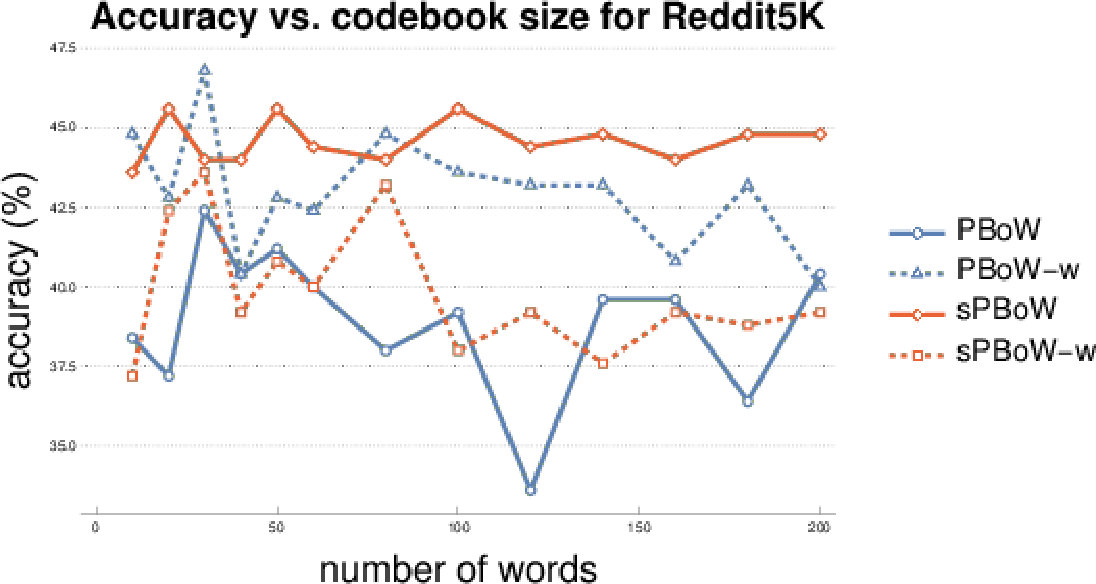 Figure 17
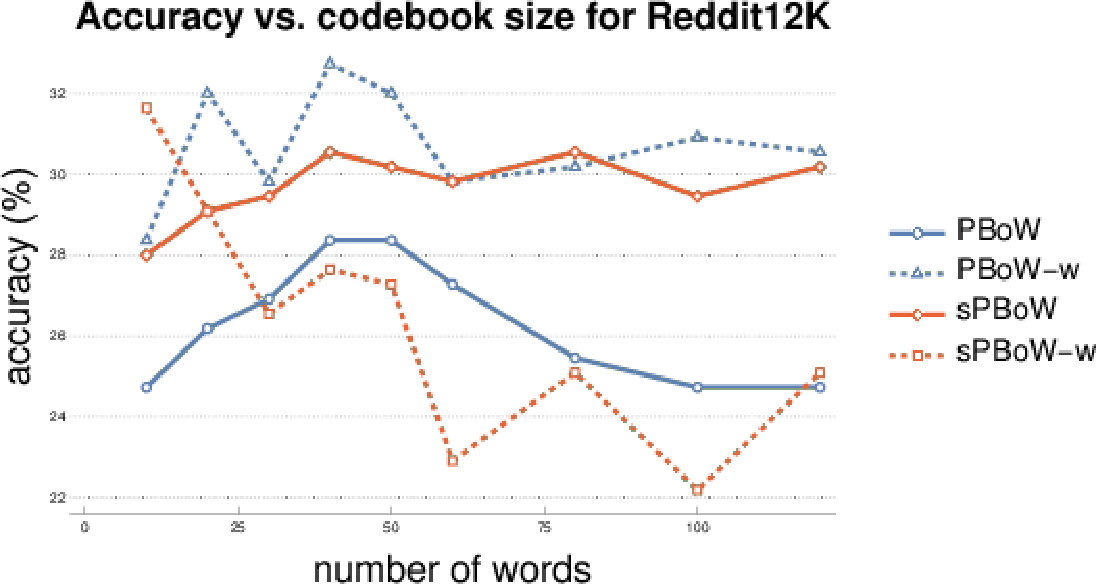 Figure 18
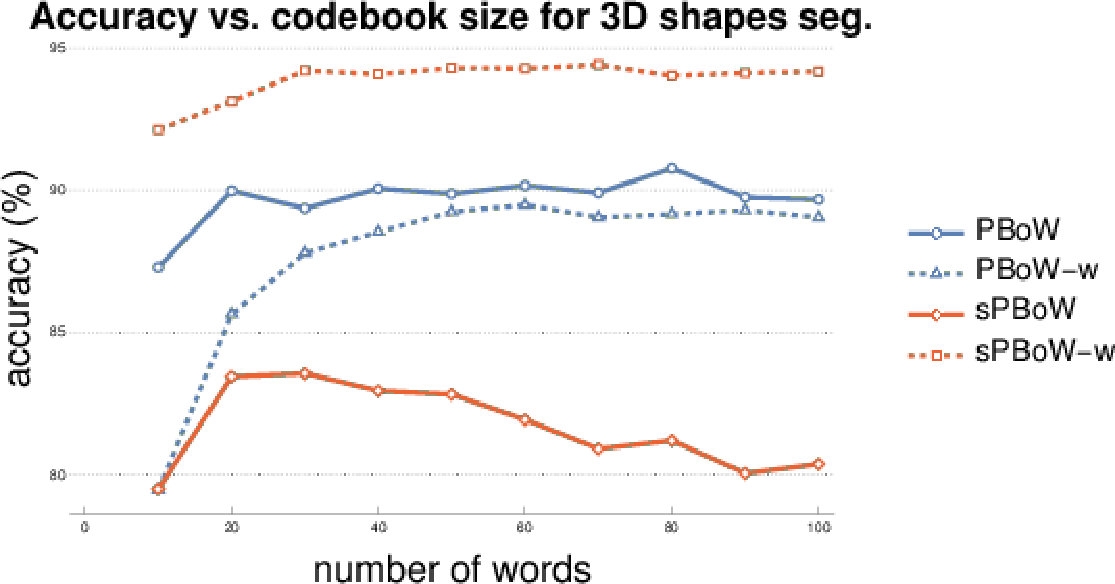 Figure 19
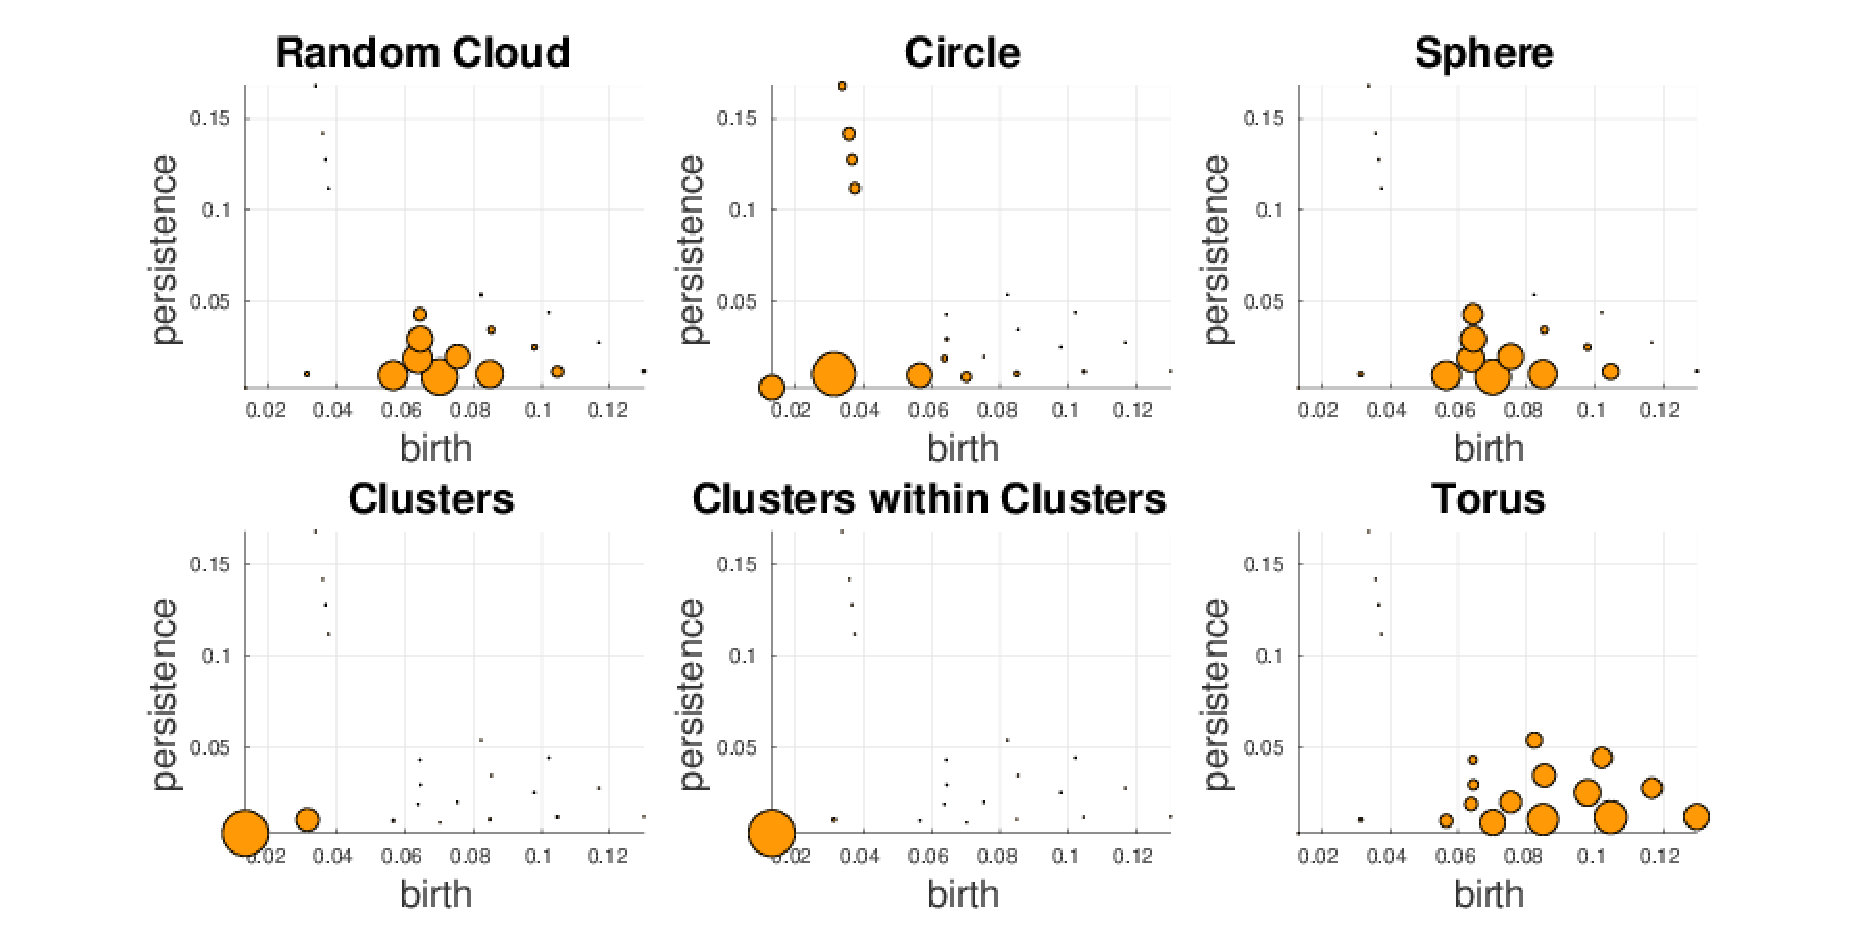 Figure 20
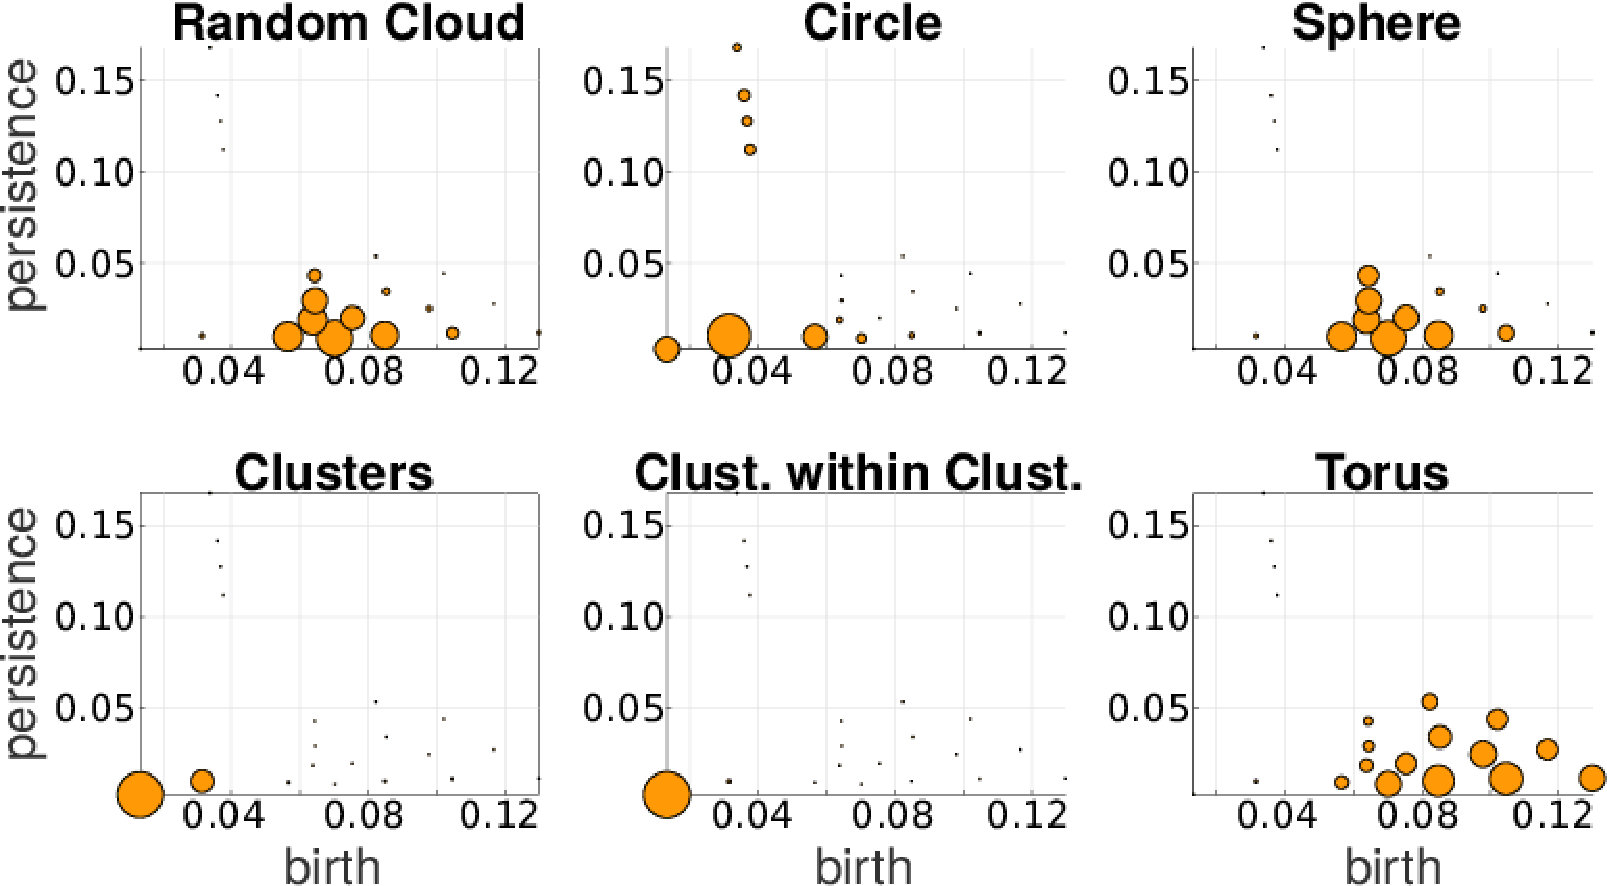 Figure 21
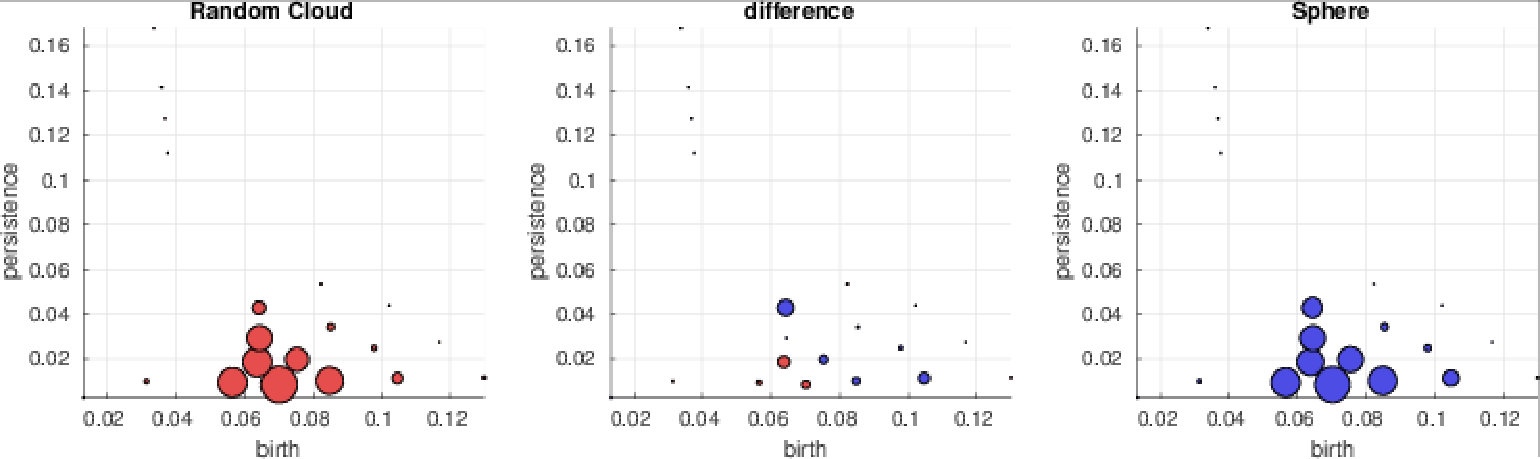 Figure 22
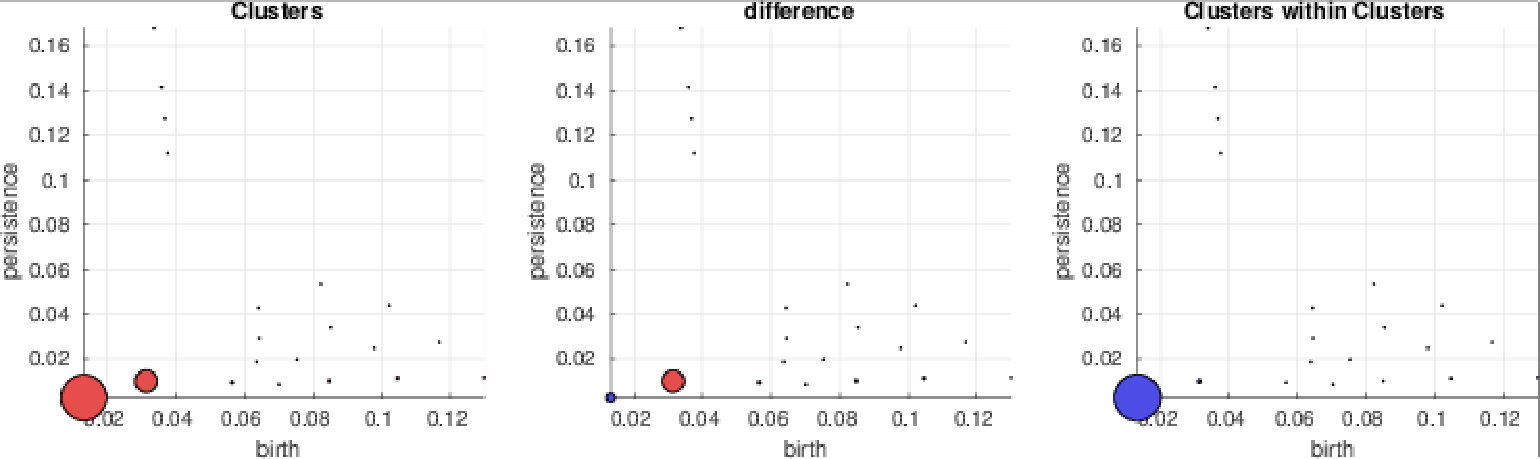 Figure 23
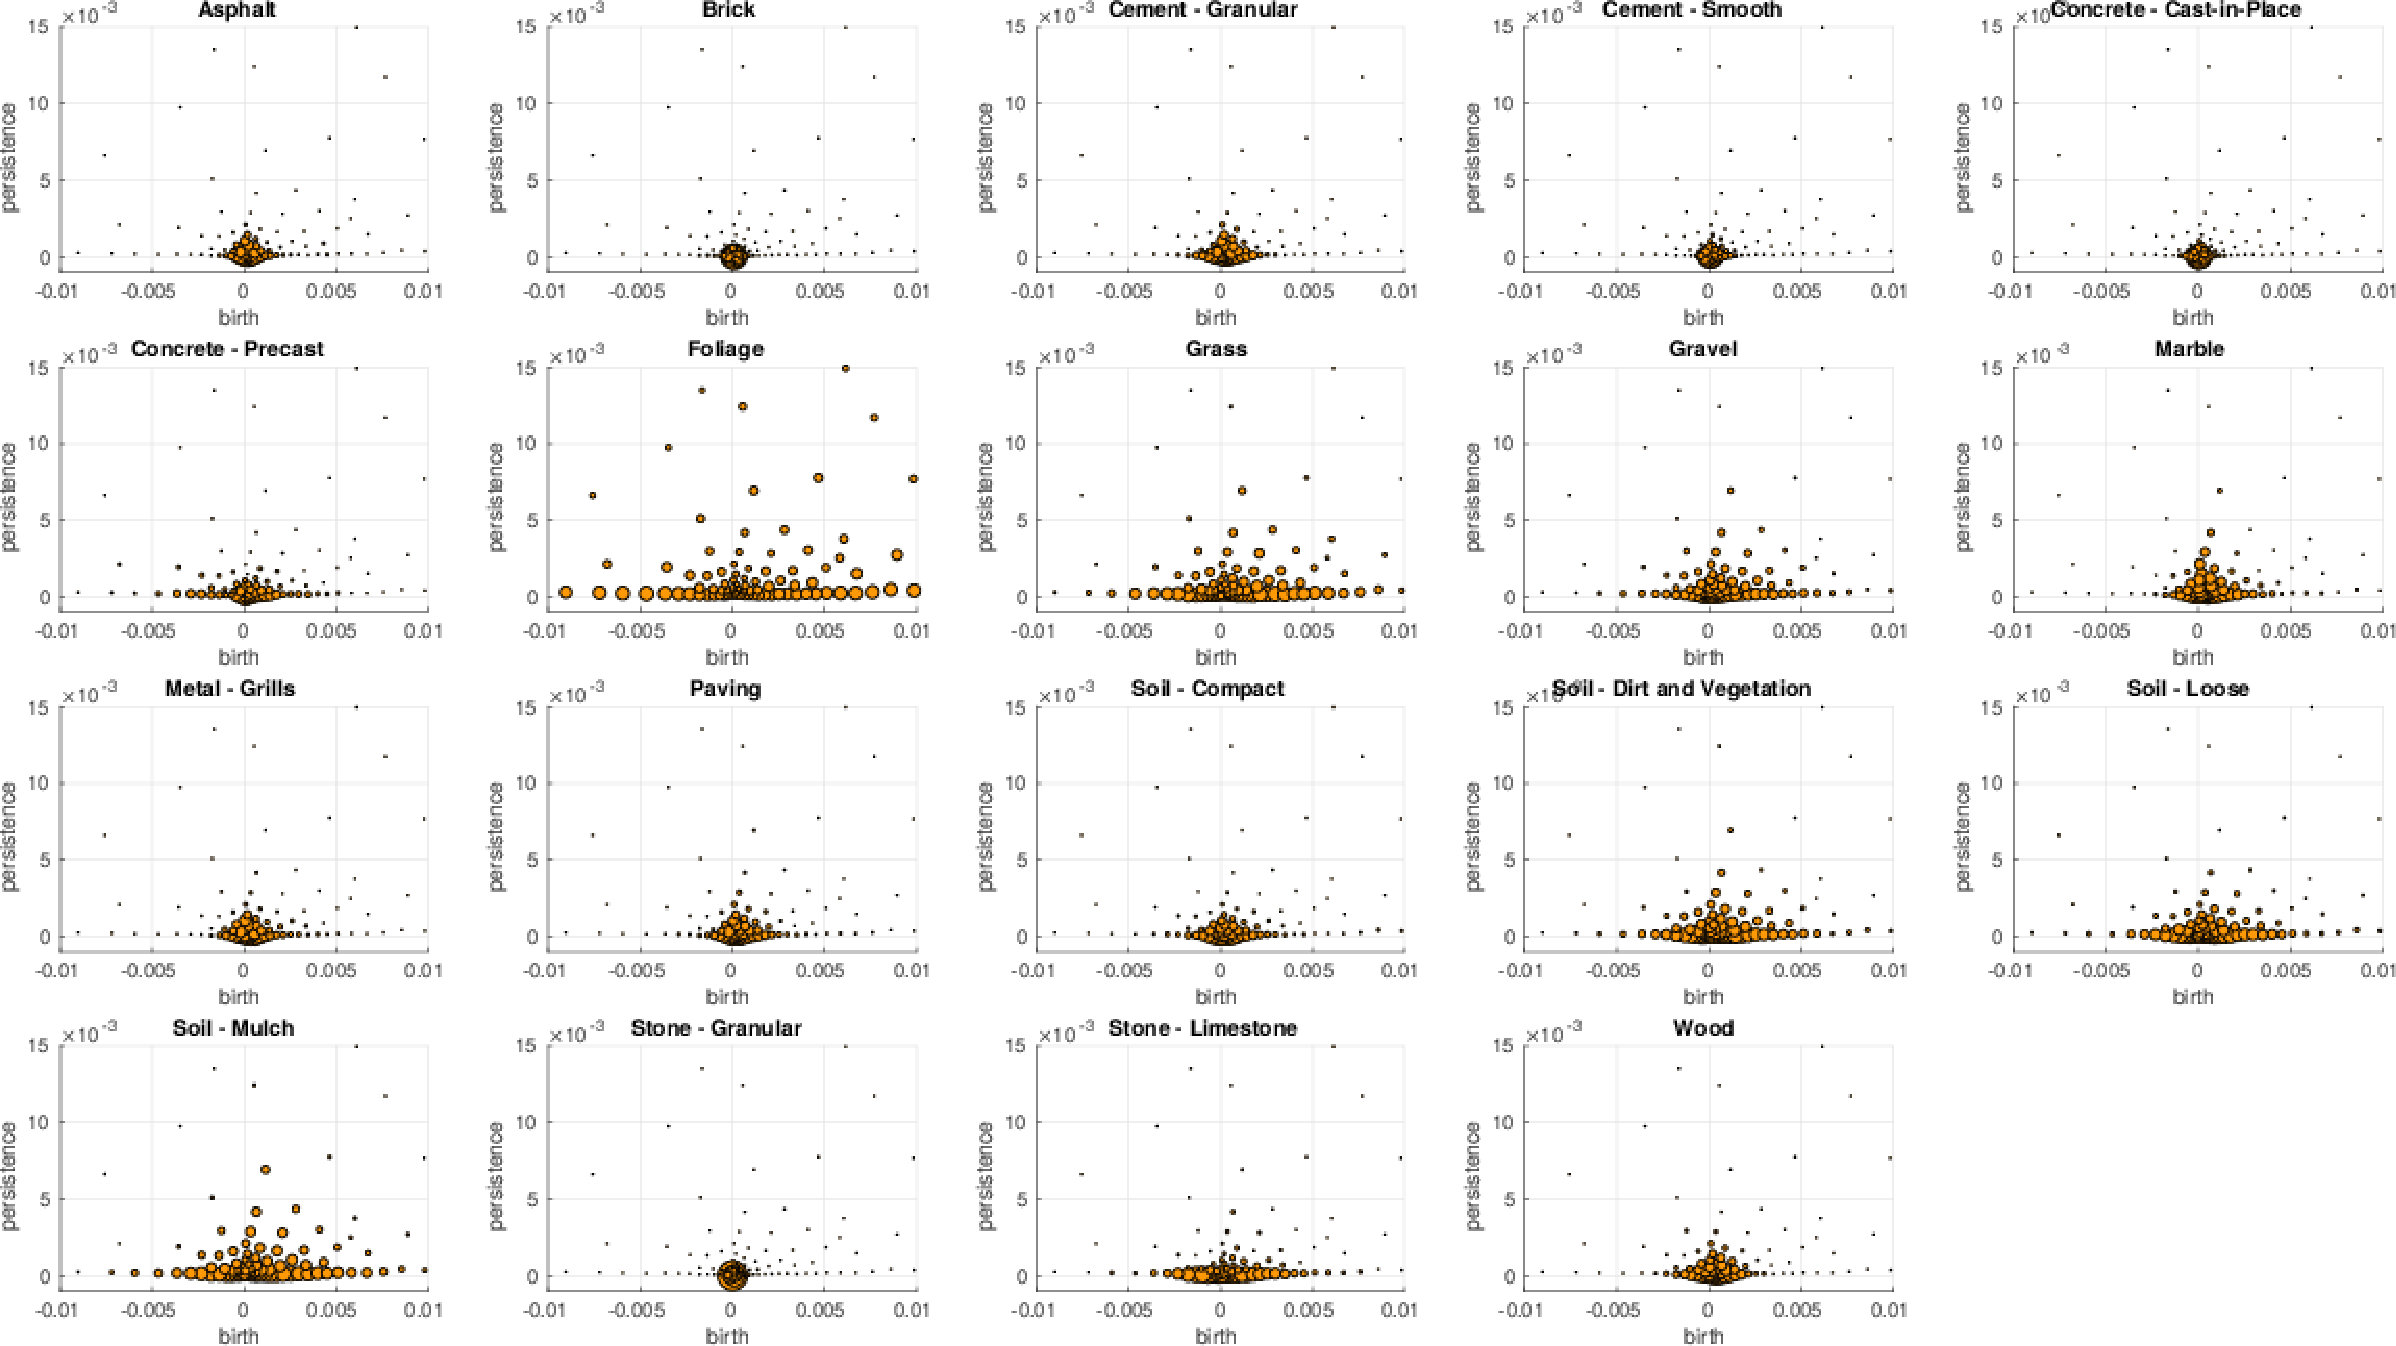 Figure 24
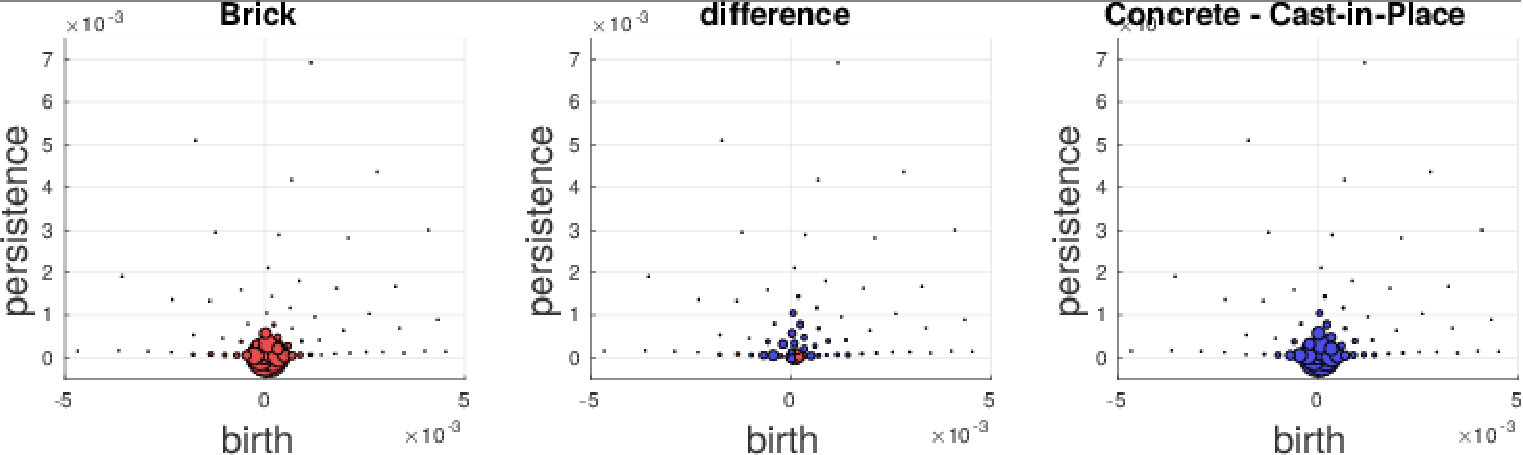 Figure 25
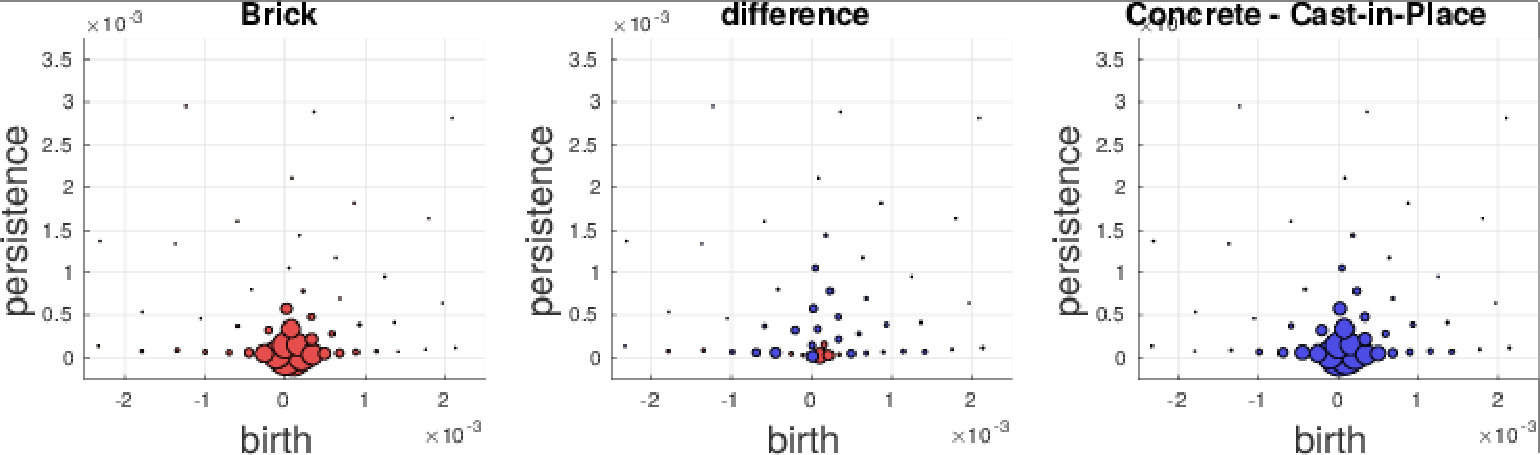 Figure 26
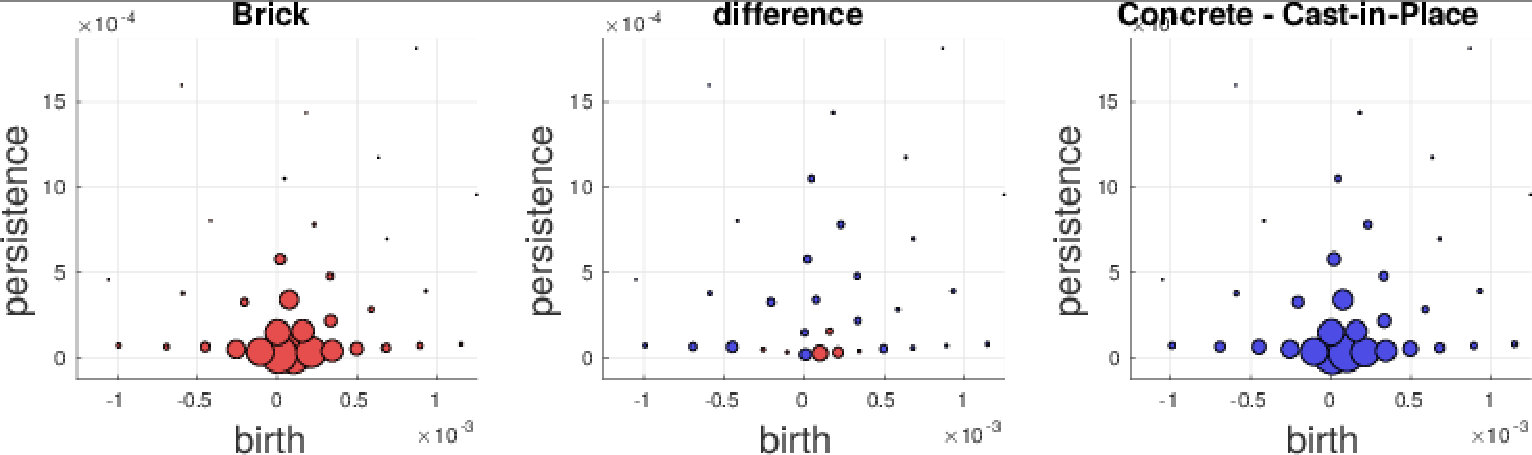 Figure 27
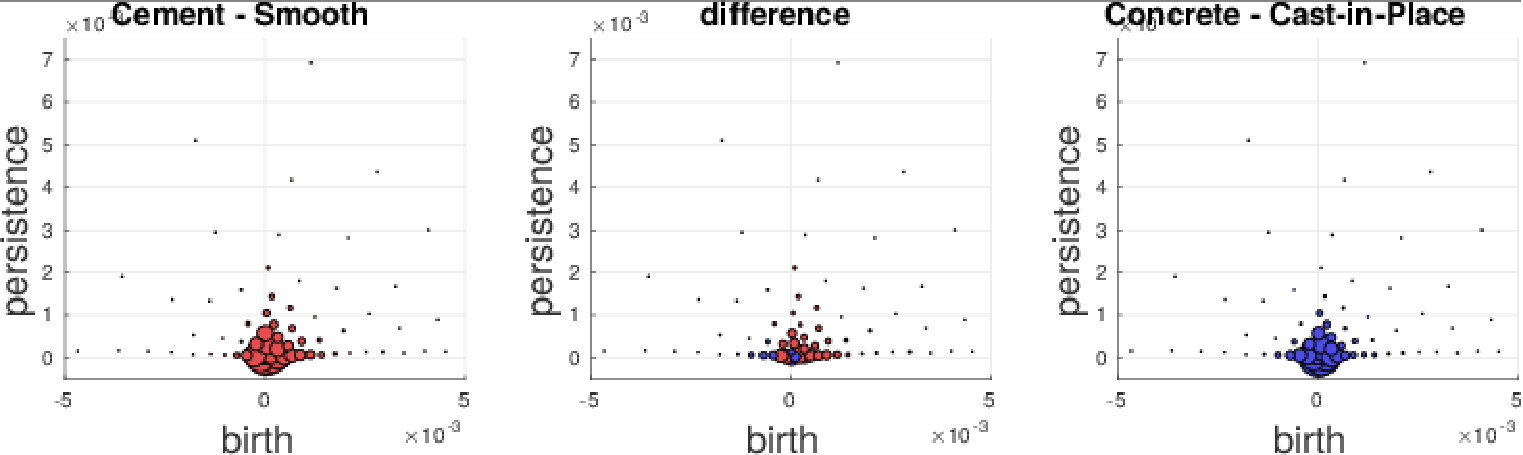 Figure 28
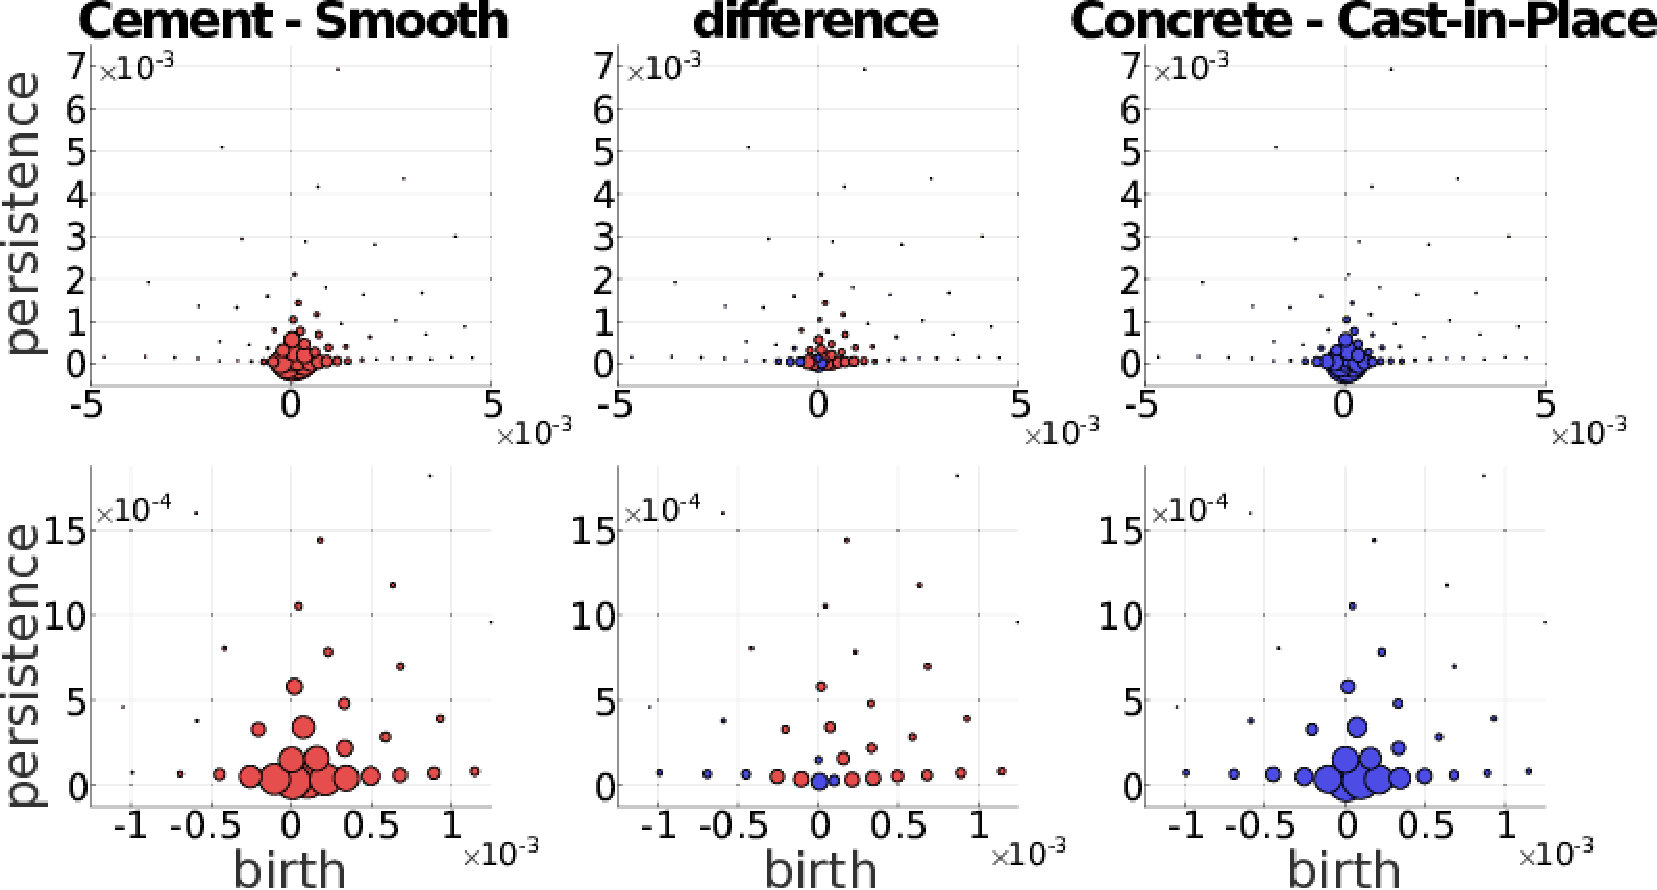 Figure 29
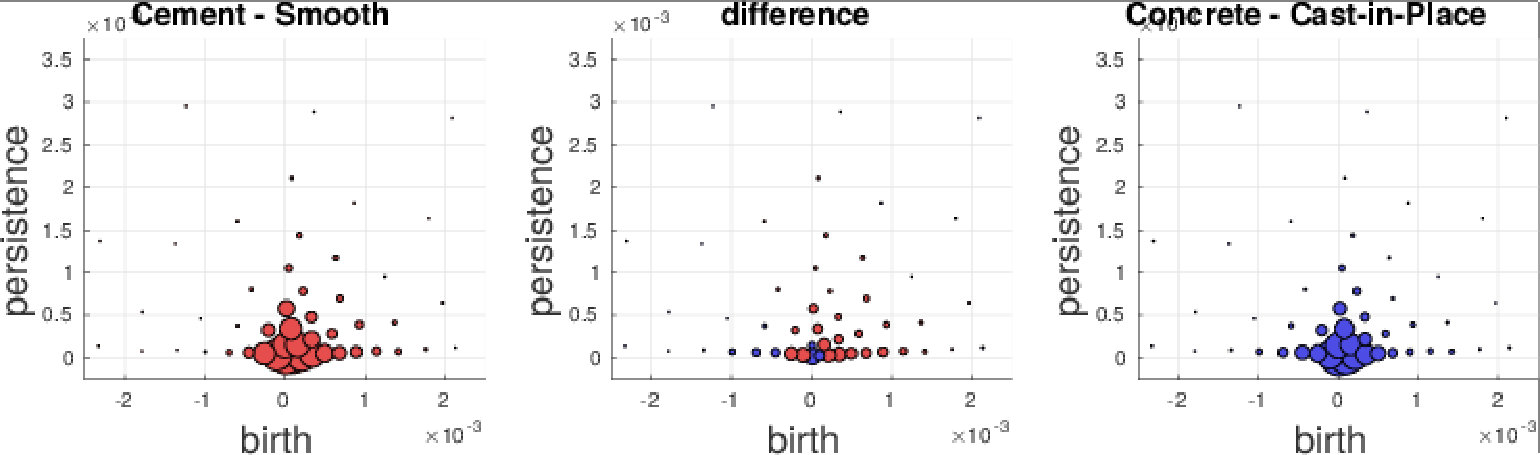 Figure 30
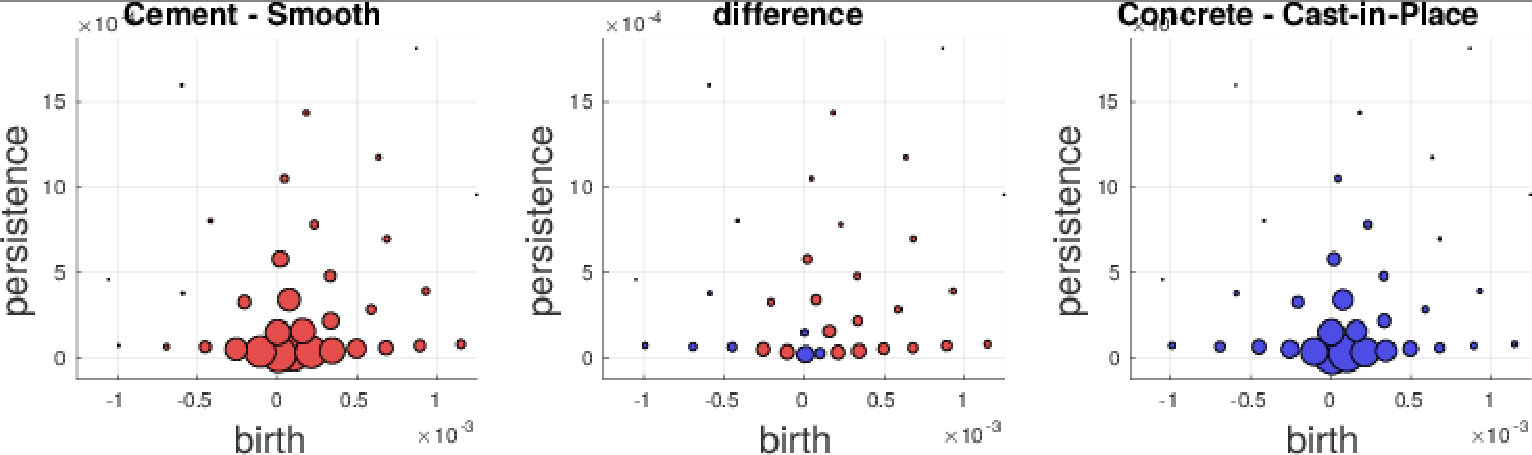 Figure 31
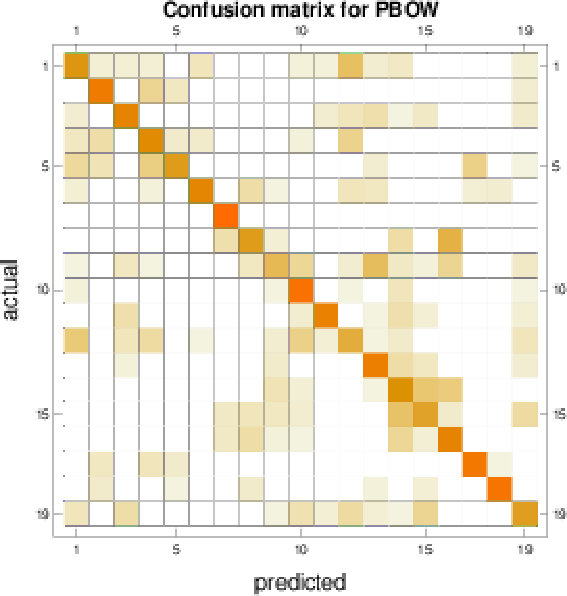 Figure 32
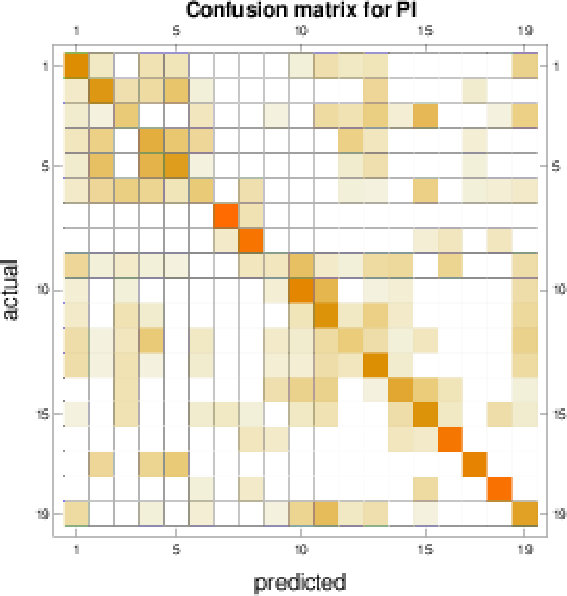 Figure 33
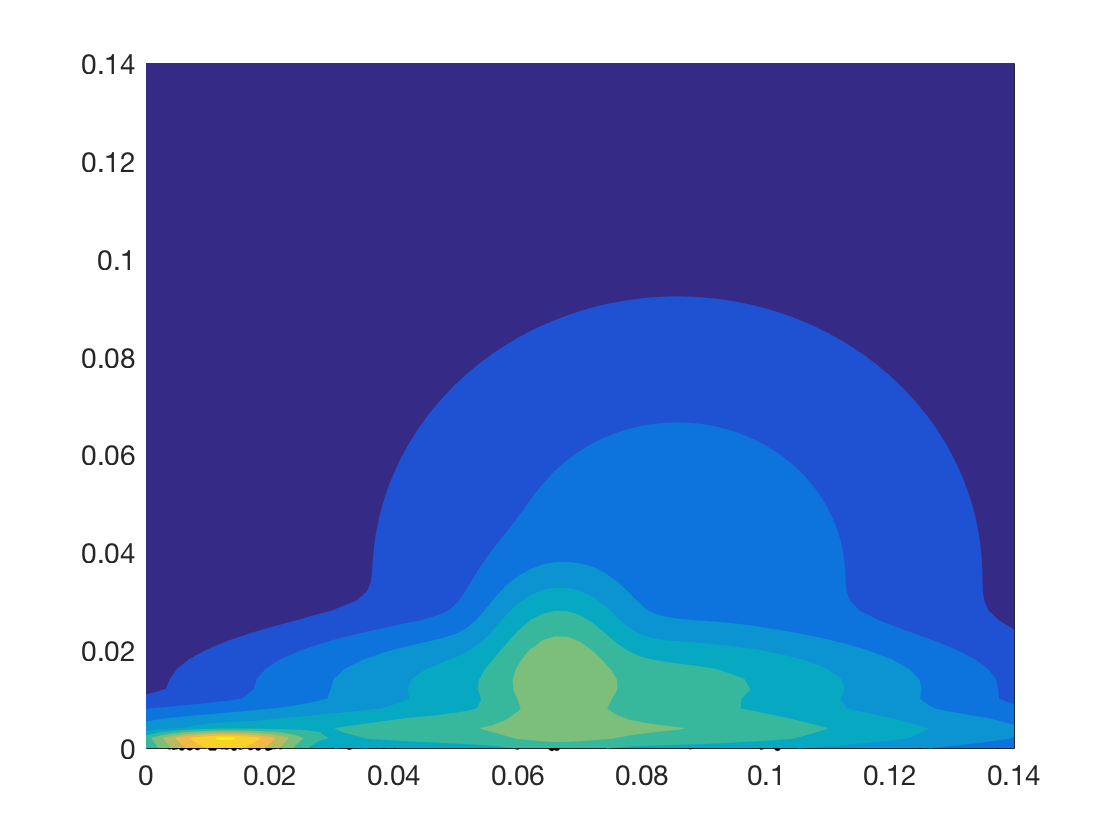 Figure 34
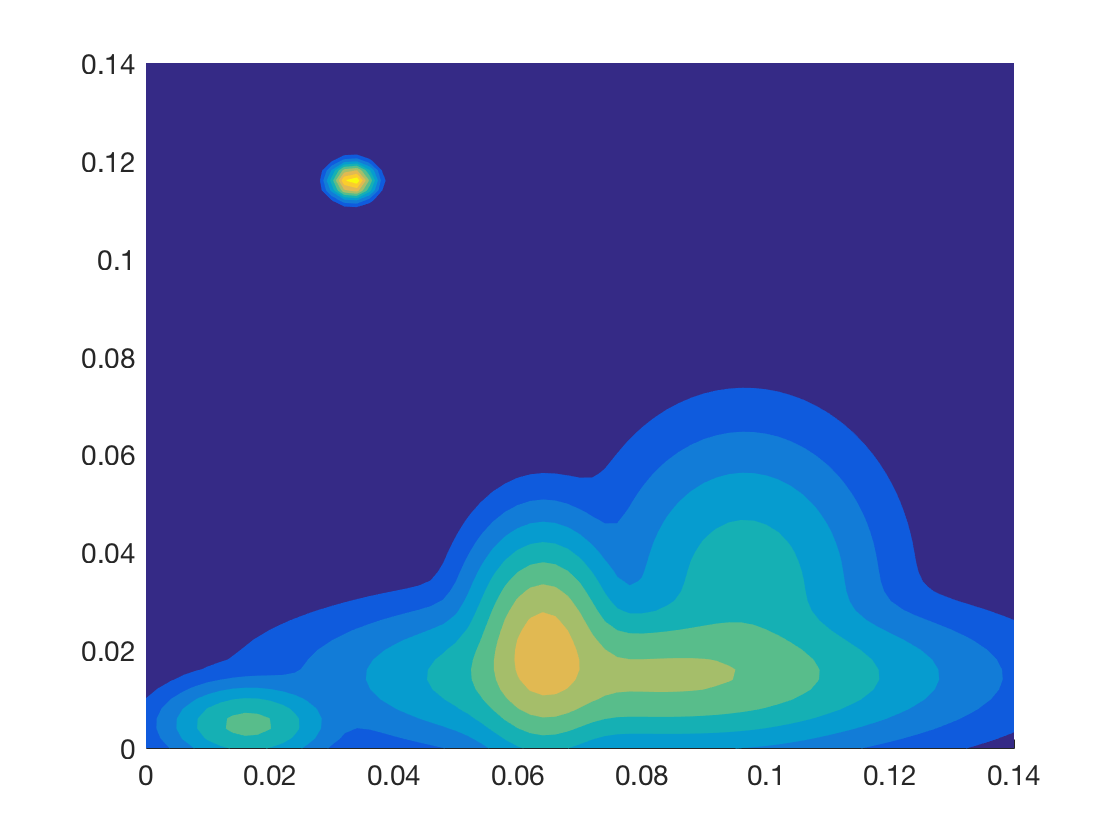 Figure 35
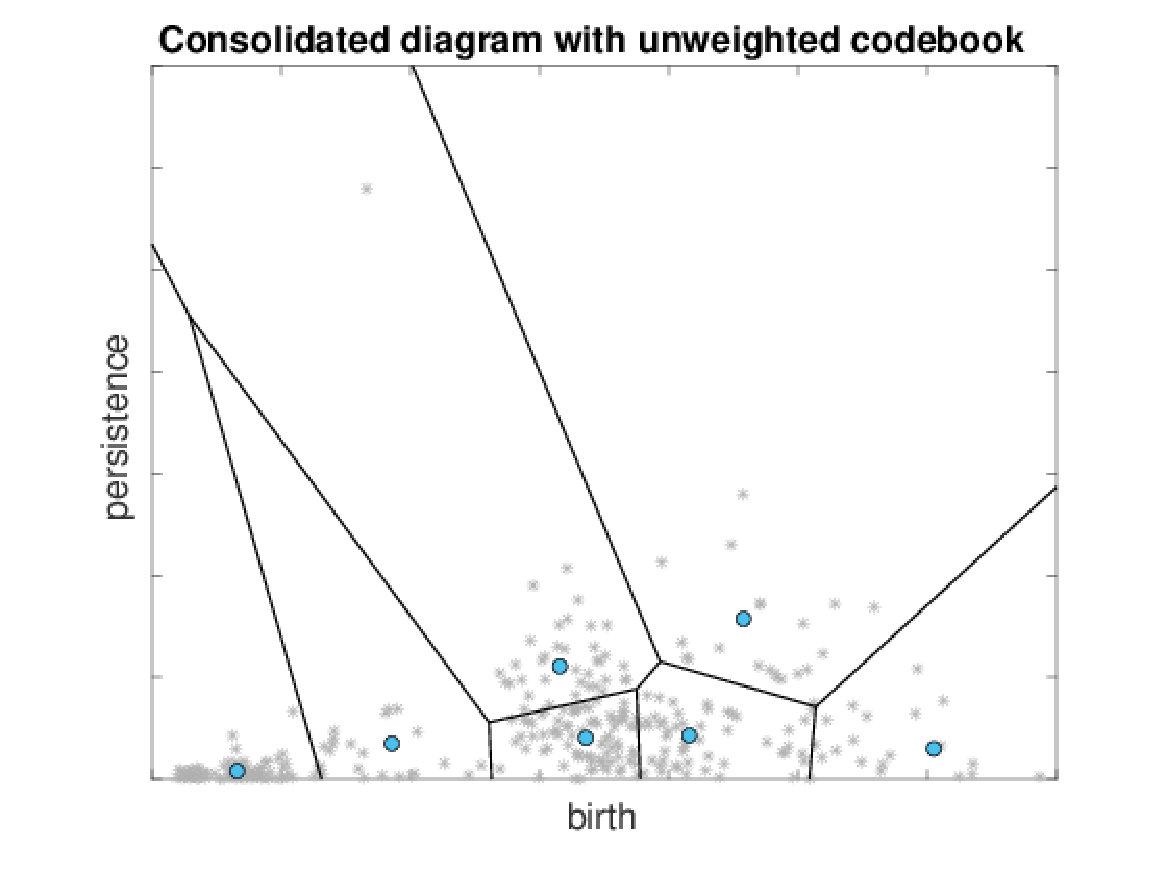 Figure 36
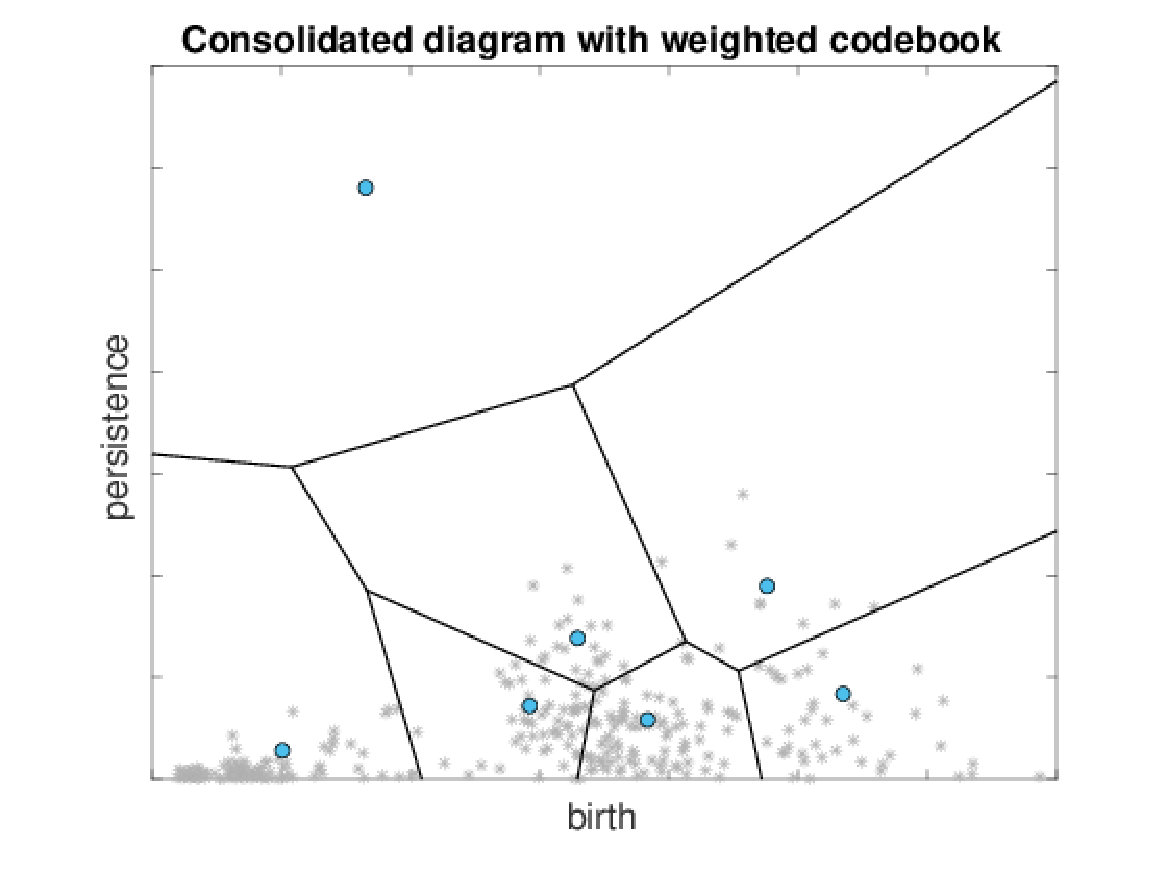 Figure 37
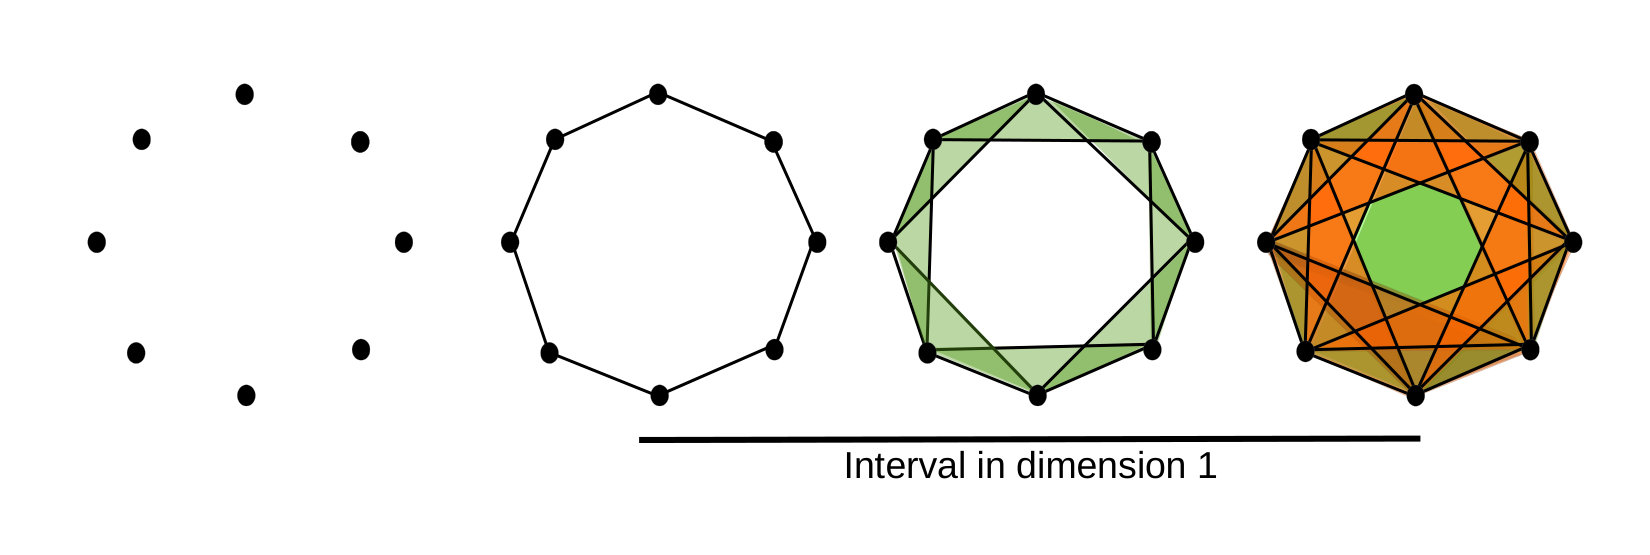 Figure 38
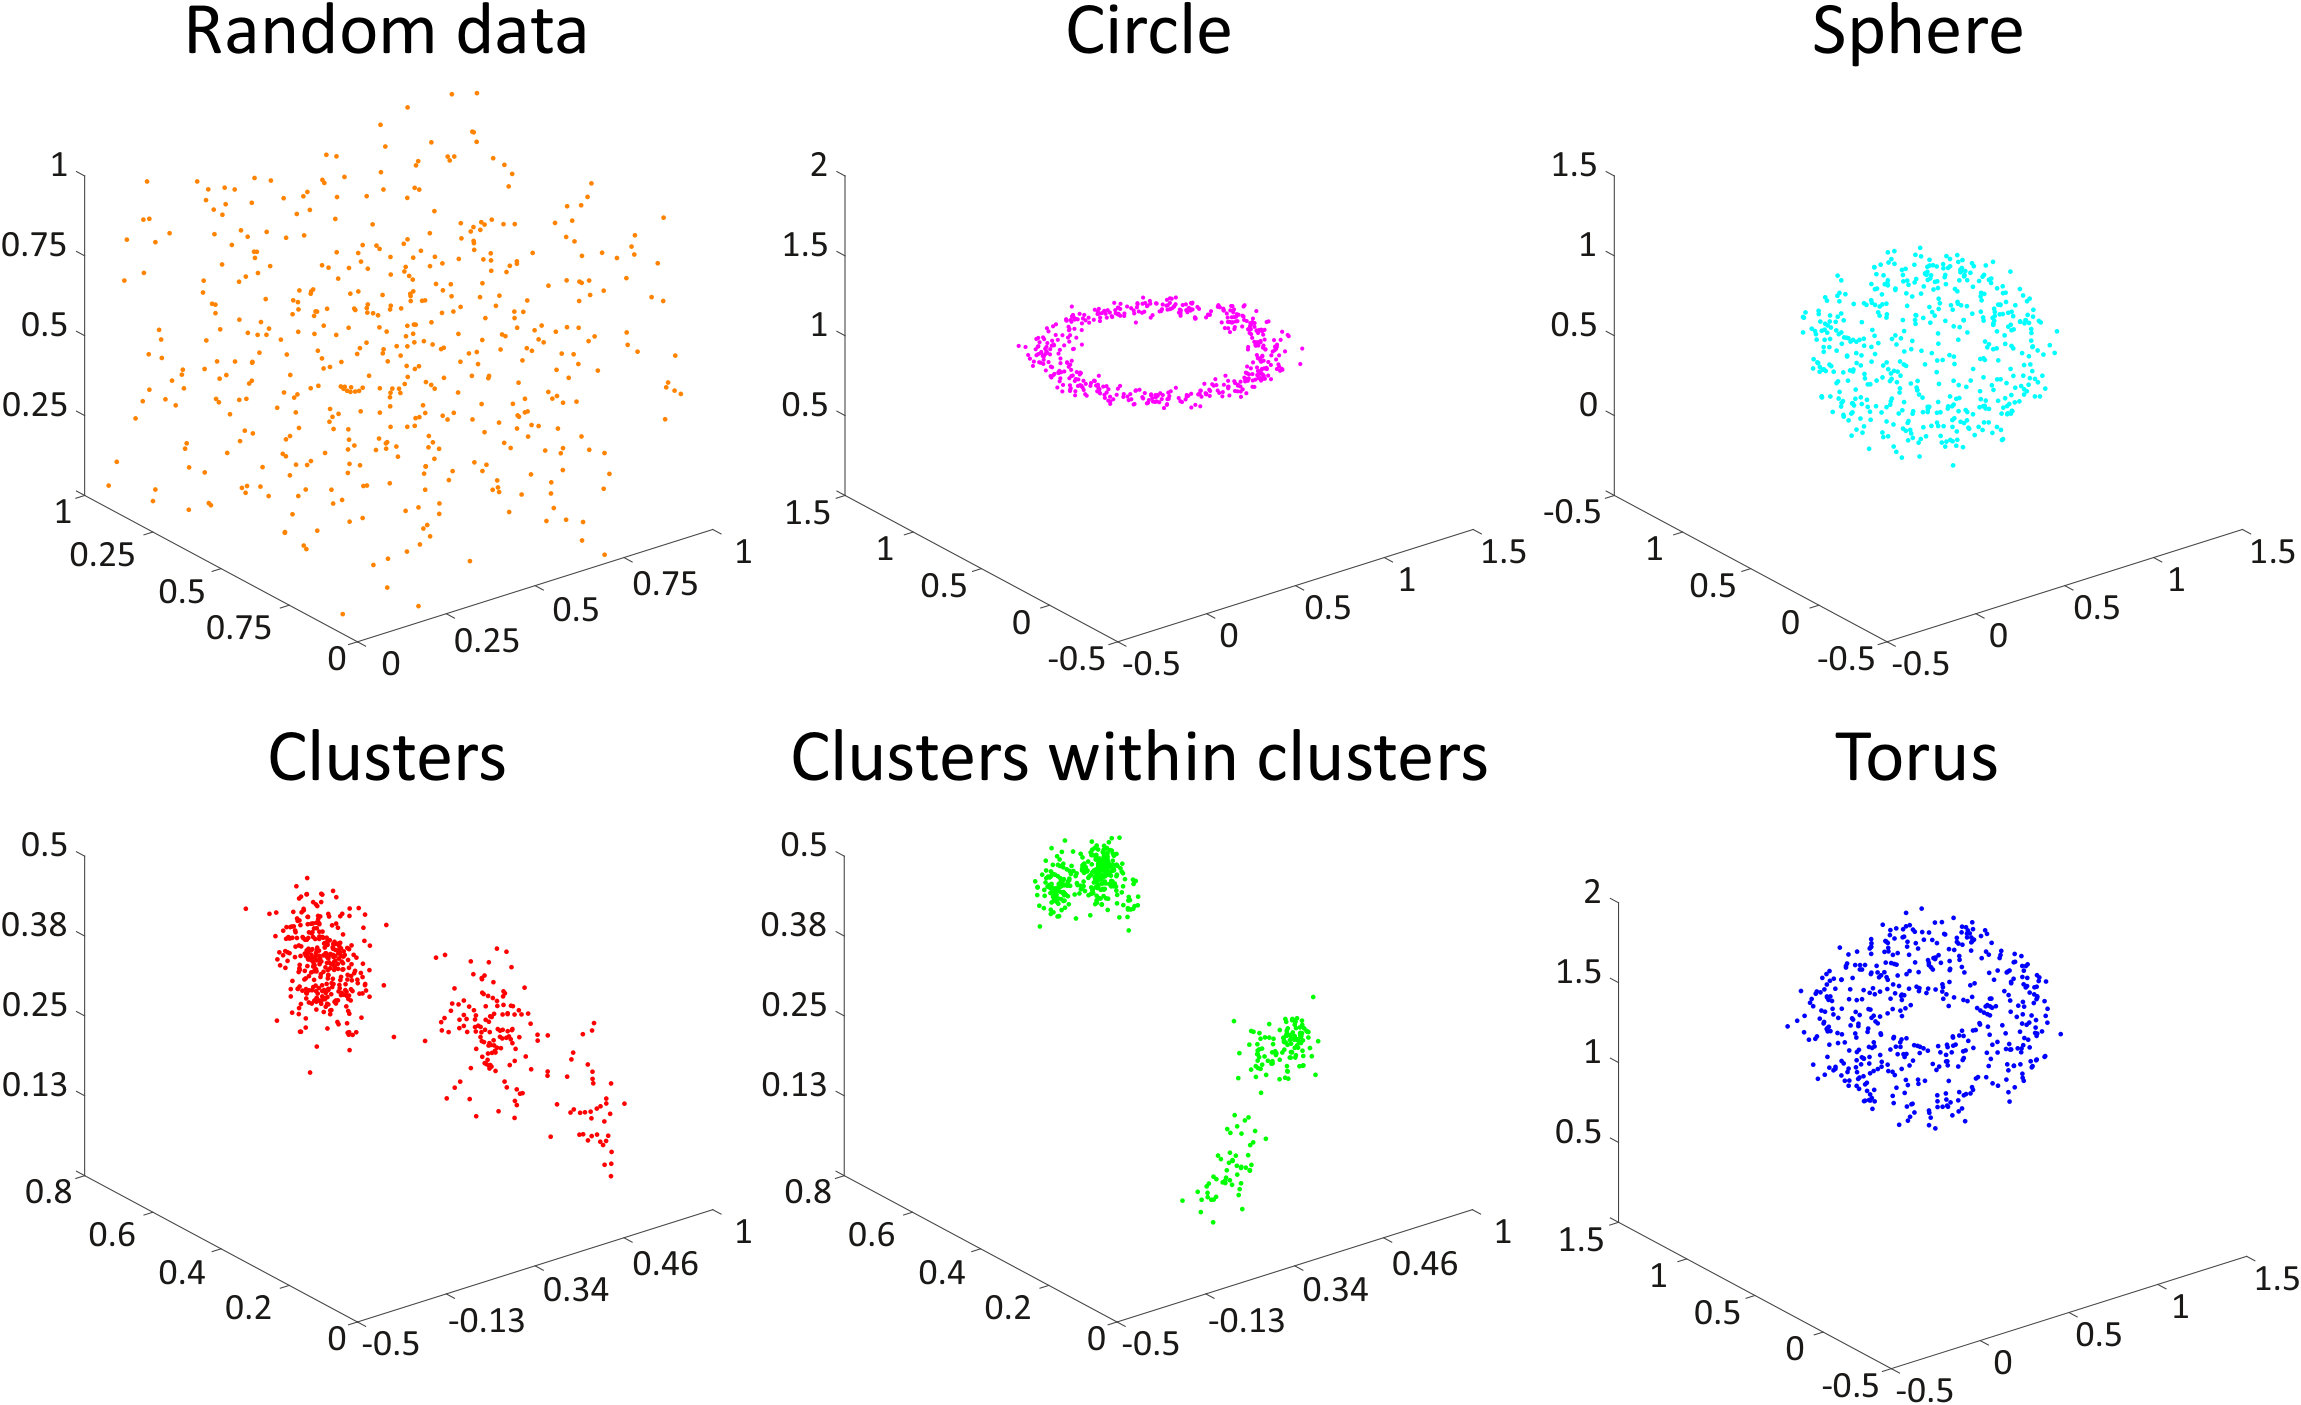 Figure 39
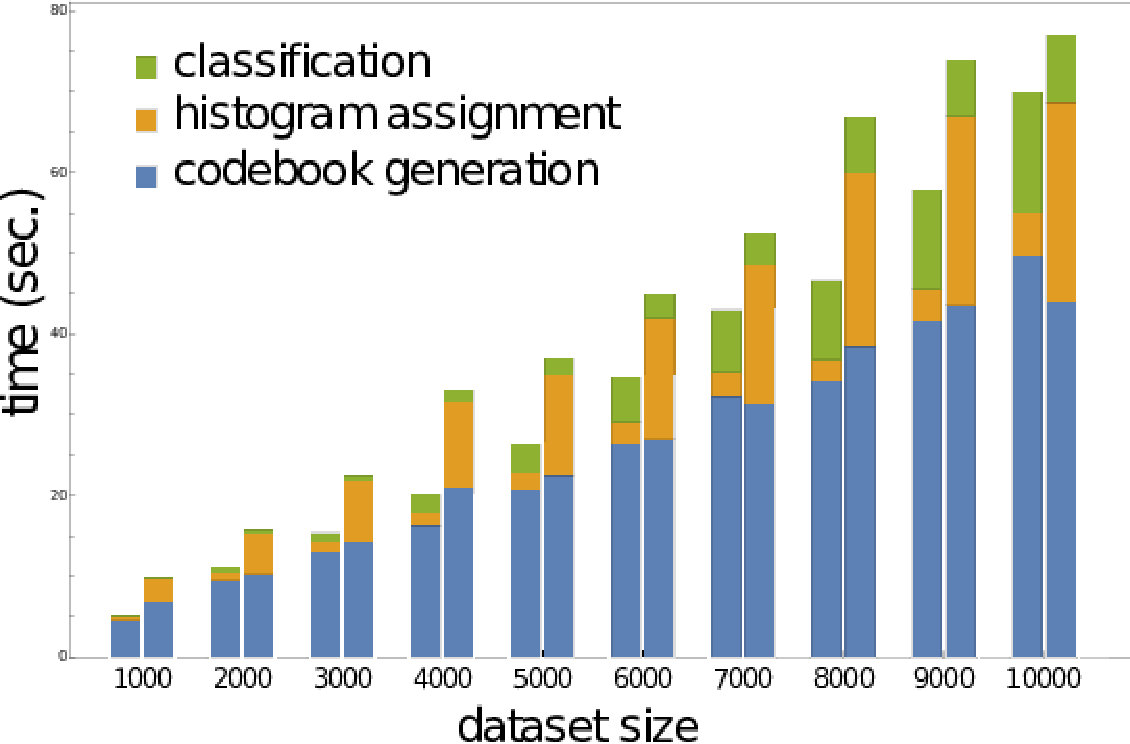 Figure 40
| EXP-A | ||||||||||||
| Descr. | Synthetic | GeoMat | Reddit-5k | Reddit-12k | PetroSurf3D | 3D Shape Segm. | ||||||
| Score | Time (sec.) | Score | Time (sec.) | Score | Time (sec.) | Score | Time (sec.) | Score | Time (sec.) | Score | Time (sec.) | |
| 2Wd | ||||||||||||
| MK | ||||||||||||
| SWK | ||||||||||||
| PL | ||||||||||||
| PI | ||||||||||||
| RM | ||||||||||||
| PBoW | ||||||||||||
| sPBoW | ||||||||||||
| EXP-B | ||||||||||||
| PI | same as EXP-A | same as EXP-A | ||||||||||
| RM | ||||||||||||
| PBoW | ||||||||||||
| sPBoW | ||||||||||||
| SoA | Adams et al. (2017) | DeGol et al. (2016) | Hofer et al. (2017) | Hofer et al. (2017) | n/a | n/a | ||||||
Peer Reviews
No public reviews on file for this paper yet. If you reviewed it on a platform where reviews are public (OpenReview, ICLR, NeurIPS, ICML), you can paste yours below so the community can read it here.
Code & Models
Videos
No videos yet. Explain this paper in a talk, walkthrough, or lecture? Add one.
Persistence Bag-of-Words for Topological Data Analysis
Bartosz Zieliński1
Michał Lipiński1
Mateusz Juda1
Matthias Zeppelzauer2&Paweł Dłotko3 1The Institute of Computer Science and Computer Mathematics,
Faculty of Mathematics and Computer Science, Jagiellonian University
2Media Computing Group, Institute of Creative Media Technologies,
St. Pölten University of Applied Sciences,
3Department of Mathematics and Swansea Academy of Advanced Computing,
Swansea University {bartosz.zielinski, michal.lipinski, mateusz.juda}@uj.edu.pl, [email protected], [email protected]
Abstract
Persistent homology (PH) is a rigorous mathematical theory that provides a robust descriptor of data in the form of persistence diagrams (PDs). PDs exhibit, however, complex structure and are difficult to integrate in today’s machine learning workflows. This paper introduces persistence bag-of-words: a novel and stable vectorized representation of PDs that enables the seamless integration with machine learning. Comprehensive experiments show that the new representation achieves state-of-the-art performance and beyond in much less time than alternative approaches.
1 Introduction
Topological data analysis (TDA) provides a powerful framework for the structural analysis of high-dimensional data. A main tool of TDA is Persistent Homology (PH) Edelsbrunner and Harer (2010), which currently gains increasing importance in data science Ferri (2017). It has been applied to a number of disciplines including, biology M. Gameiro (2014), material science Y. Lee (2017), analysis of financial markets M. Gidea (2018). Persistence homology is also used as a novel measure of GANs (Generative Adversarial Networks) performance Khrulkov and Oseledets (2018), and as a complexity measure for neural network architectures Rieck et al. (2018). PH can be efficiently computed using various currently available tools Bauer et al. (2017); Dey et al. (2019); Maria et al. (2014). A basic introduction to PH is given in the supplementary material (SM in the following)aaaSupplementary material: https://arxiv.org/abs/1812.09245.
The common output representation of PH are persistence diagrams (PDs) which are multisets of points in . Due to their variable size, PDs are not easy to integrate within common data analysis, statistics and machine learning workflows. To alleviate this problem, a number of kernel functions and vectorization methods for PDs have been introduced. Kernel-based approaches have a strong theoretical background but in practice they often become inefficient when the number of training samples is large. As the entire kernel matrix must usually be computed explicitly (like in case of SVMs), this leads to roughly quadratic complexity in computation time and memory with respect to the size of the training set. Furthermore, such approaches are limited to kernelized methods, such as SVM and kernel PCA. Vectorized representations in contrast are compatible with a much wider range of methods and do not suffer from complexity constraints of kernels. Since they require a spatial quantization of the PD they might suffer from a loss in precision compared to kernels, especially since PDs are sparsely and unevenly populated structures.
In this work, we present a novel spatially adaptive and thus more accurate representation of PDs, which aims at combining the large representational power of kernel-based approaches with the general applicability of vectorized representations. To this end, we extend the popular bag-of-words (BoW) encoding (originating from text and image retrieval) to TDA to cope with the inherent sparsity of PDs McCallum et al. (1998); Sivic and Zisserman (2003). The proposed adaptation of BoW gives a universally applicable fixed-sized feature vector of low-dimension. It is, under mild conditions, stable with respect to a standard metric in PDs. Experiments demonstrate that our new representation achieves state-of-the-art performance and even outperforms numerous competitive methods while requiring orders of magnitude less time and being more compact. Due to the run-time efficiency of our approach it may in future enable the application of TDA for larger-scale data than possible today.
The paper is structured as follows. Section 2 reviews related approaches. In Section 3 we introduce persistence bag-of-words and prove its stability. Sections 5 and 6 present experimental setup, results and discussion. Please consider the SMa for additional information.
2 Background and Related Work
Different kernel based and vectorized representations have been introduced to make PDs compatible with statistical analysis and machine learning methods. The goal of kernel-based approaches on PDs is to define dissimilarity measures (also known as kernel functions) used to compare PDs and thereby make them compatible with kernel-based machine learning methods like Support Vector Machines (SVMs) and kernel Principal Component Analysis (kPCA). Li et al. Li et al. (2014) use the traditional bag-of-features (BoF) approach combining various distances between [math]-dimensional PDs to generate kernels. On a number of datasets (SHREC 2010, TOSCA, hand gestures, Outex) they show that topological information is complementary to the information of traditional BoF. Reininghaus et al. Reininghaus et al. (2015) turns PDs into a continuous distribution by appropriate placing of Gaussian distributions and use the scalar product of the distributions to define a kernel function. Carrière et al. Carrière et al. (2017) propose a kernel based on sliced Wasserstein approximation of the Wasserstein distance. Le and Yamada Le and Yamada (2018) proposed a Persistence Fisher (PF) kernel for PDs. It has a number of desirable theoretical properties such as stability, infinite divisibility, and linear time complexity in the number of points in the PDs. Lacombe et al. Lacombe et al. (2018) reformulated the computation of diagram metrics as an optimal transport problem. This approach allows for efficient parallelization and scalable computations of a PD’s barycenters. Another representation of PDs are Persistence Landscapes, PL Bubenik (2015). PL is a transformation of PD into a sequence of piece-wise linear functions. distance between those functions or their scalar products can be used to define kernels.
Vectorized representations of PDs can be used directly as an input to most machine learning methods. Adams et al. Adams et al. (2017), propose the persistence image (PI) building upon earlier work Donatini et al. (1998); Ferri et al. (1998). PI first fits a distribution to the PD and then samples it at regular intervals to obtain a vectorized representation. Anirudh et al. Anirudh et al. (2016) propose an approach based on Riemannian manifold (RM). It transforms PD into a Gaussian kernel being a Riemannian manifold with Fisher-Rao metric and subsequently into a vector space which is reduced by PCA to a fixed-size representation.
Recently, a third type of approach has been introduced. It aims at learning areas/points in the PD which are of particular importance for a given task in a supervised manner Hofer et al. (2017). Despite promising properties this approach can be used only in cases where supervisory information (labels) are available, requires a large training set and long training time. Additionally, it requires specifically adapted architectures for different data sets and data types Hofer et al. (2017).
3 Persistence Bag of Words
In this section, we adopt the Bag-of-Words (BoW) model McCallum et al. (1998); Sivic and Zisserman (2003), introduced in text and image retrieval, for the quantization of PDs. The idea behind BoW is to quantize variable length input data into a fixed-size representation by a so called codebook. The codebook is generated from the input data in an unsupervised manner by clustering. The basic assumption behind BoW is that the clusters (i.e. codewords) capture the intrinsic structure of the data and thereby represent a suitable vocabulary for the quantization of the data. Given a codebook , every input point (in a potentially high-dimensional space) is encoded by assigning points from to the nearest codeword from . In traditional BoW this encoding leads to a codeword histogram where each codeword from is a bin and counts how many points from are closest to it.
For BoW approaches, three important hyperparameters need to be set: (1) the clustering algorithm used to generate the codebook, (2) the size of the codebook, i.e., the number of clusters, and (3) the type of proximity encoding which is used to obtain the final descriptors, i.e. hard or soft assignment. We employ k-means and Gaussian Mixture Models (GMM) for clustering. The size of each codebook is optimized to maximize performance. In the following sections, we will describe two ways of generating codeword histograms based on the proximity of points from to codewords in .
The overall approach is visualized in Fig. 1. The input consists of a set of PDs extracted from all instances of a given dataset and transformed into birth-persistence coordinates using transformation for each point in the PD. Next, all PDs are consolidated into one diagram which may then be sub-sampled to reduce the influence of noise. Based on the consolidated diagram, the codebook is generated by clustering. For a given codebook we generate codeword histograms by different quantization strategies.
3.1 Persistence Bag of Words
In order to directly adapt BoW Baeza-Yates et al. (1999); Sivic and Zisserman (2003) to PDs, let us consolidate a collection of training diagrams into in order to obtain a codebook by using -means clustering on . Let denote the centers of obtained clusters. Given a new PD let be equal to if for all . We define a persistence bag of words (PBoW) as a vector:
[TABLE]
where . In other words, captures the number of points from , which are closer to than to any other . Next, is normalized by taking the square root of each component (preserving the initial sign) and dividing it by the norm of the vector. This is a standard normalization for BoW Perronnin et al. (2010) used to reduce the influence of outliers.
This direct adaptation of BoW to PDs is, however, not 1-Wasserstein stable. To show this, let us assume that we have two clusters with centers , and PD containing only one point , for some small . Then, , because is closer to than . However, a small perturbation in , e.g. by , changes the assignment of from to . In this case and . In order to be stable in 1-Wasserstein sense, PBoW should fulfill the following condition:
[TABLE]
therefore . As can be arbitrarily small, there does not exist a constant that meets this condition. Therefore PBoW is not stable. In the next section, we adopt BoW to better fit the structure of PDs and to deal with the instability.
3.2 Stable Persistence Bag of Words
In this section we present two important adaptations of BoW for PDs. Firstly, we enforce the codeword selection to be preferential to higher persistence points. Secondly, we adopt soft assignment of points to the clusters and prove that such an approach guarantees stability of the representation.
A consequence of the stability theorem for PDs is that points with higher persistence are typically considered more important than points with lower persistence. Therefore, when selecting the cluster centers in BoW, preference should be given to higher persistence points. To integrate this into codebook generation we perform the clustering on a subset of points obtained by a weighted sampling of . For the sub-sampling we use a piece-wise linear weighting function . Given :
[TABLE]
and use it to weight the second coordinate (persistence) of the points in the PD. In our experiments we set and to the persistence values corresponding to and quantiles of the persistence coordinate of the points in . Consequently, persistence points having higher values for function are more likely to be sampled. Note that the sub-sampling does not guarantee that the points of highest persistence will be selected as centers of clusters, but it makes the probability of such an event considerably larger.
To account for the instability of PBoW (see Section 3.1), we propose Stable Persistence Bag of Words (sPBoW). Similarly to PBoW, we first consolidate PDs in the initial step of construction. Next, we generate a GMM based on the sub-sampled points (by expectation maximization Nasrabadi (2007)). This approach was originally introduced in Van Gemert et al. (2008). Let the parameters of the fitted GMM be , where , and denote the weight, mean vector and covariance matrix of Gaussian and denotes the number of Gaussians. Given a PD its stable PBoW is defined as:
[TABLE]
where , , and is the likelihood that observation was generated by Gaussian :
[TABLE]
See SMa for a complexity analysis of PBoW and sPBoW.
4 Stability Proof
Theorem. Let and be persistence diagrams with a finite number of non-diagonal points. Stable persistence bag of words, sPBoW with words is stable with respect to 1-Wasserstein distance between the diagrams, that is
[TABLE]
where is a constant.
Proof. Let be an optimal matching in the definition of 1-Wasserstein distance. For a fixed we have:
[TABLE]
Note that are Lipschitz continuous (as they are 2-dimensional Gaussian distributions). Let be their Lipschitz constant. We get
[TABLE]
Consequently for we have
[TABLE]
5 Experimental Setup
5.1 Datasets
We incorporate datasets which cover a wide range of different retrieval problems. Firstly, to provide a proof-of-concept, we evaluate all approaches on a set of synthetically generated shape classes from Adams et al. (2017). It consists of six shape classes represented by point clouds of the geometrical objects. The task is to differentiate them by the derived representations. Additionally, we evaluate the approaches on real-world datasets for geometry-informed material recognition (GeoMat) DeGol et al. (2016), classification of social network graphs (reddit-5k, reddit-12k) Hofer et al. (2017), analysis of 3D surface texture (PetroSurf3D) Zeppelzauer et al. (2017), and 3D shape segmentation Carrière et al. (2017). Where available, we have used pre-computed PDs available with datasets to foster reproducibility and comparability. More detail on the datasets is provided in the SMa.
5.2 Compared Approaches
We compare our bag-of-word approaches with both kernel-based techniques and vectorized representations. Kernel-based approaches include: 2-Wasserstein distancebbbhttps://bitbucket.org/grey_narn/hera (2Wd) Kerber et al. (2017), the multi-scale kernelccchttps://github.com/rkwitt/persistence-learning (MK) of Reininghaus et al. (2015), and sliced Wasserstein kerneldddcode obtained from Mathieu Carrière (SWK) Carrière et al. (2017). Furthermore, we employ the persistence landscapeeeehttps://www.math.upenn.edu/~dlotko,fffhttps://github.com/queenBNE/Persistent-Landscape-Wrapper (PL) representation and generate a kernel matrix by the distance metric defined in Bubenik (2015). Vectorized PD representations include: persistence imageggghttps://github.com/CSU-TDA/PersistenceImages (PI) Adams et al. (2017) and the Riemannian manifold approachhhhhttps://github.com/rushilanirudh/pdsphere (RM) Anirudh et al. (2016).
5.3 Setup
For all datasets, we aim at solving a supervised classification task. The classification pipeline is as follows: for the kernel-based approaches we take the PDs as input and compute the kernel matrices for the training and test samples. Next we train an SVM from the explicit kernel matrices and evaluate it on the test data. For the vectorized representations we compute the respective feature vectors from the PDs and feed them into a linear SVM for training. This procedure allows for directly comparing kernel-based approaches and vectorized representations. To enhance the comparability we employ (if available) the original train/test division of the datasets. To find optimal parameters for each evaluated approach, we run a grid search including cross-validation over the hyperparameters of all approaches (see Table 1 in SMa).
As the computation times for some of the considered methods, especially for kernel-based approaches, do not scale well with the sizes of datasets (computation time and space required for explicit kernel matrices grows exponentially), we have decided to split the evaluation into two parts: EXP-A uses all related approaches on smaller randomly sub-sampled versions of the datasets (see SMa for details on sub-sampling), while EXP-B operates only on the vectorized representations and uses larger datasets.
The mean accuracy is obtained as an average over 5 runs with the same train/test divisions used by the compared methods. A Wilcoxon signed-rank tests is used to show the statistical significance of differences between the scores of the best and the remaining methods. As the number of repetitions is small, the p-value is set to 0.1 and no multiple testing correction is applied.
The code of our experiments is implemented in Matlabiiihttps://github.com/bziiuj/pcodebooks. For external approaches we use the publicly available implementations of the original authors. For bag-of-words we employ the VLFeat library Vedaldi and Fulkerson (2008).
6 Results and Discussion
Table 1 summarizes the results obtained in our experiments for EXP-A and EXP-B. For each combination of dataset and approach we provide the obtained classification accuracy (including the standard deviation) and the processing time needed to construct the representations (excluding the time for classification). Note that for the synthetic dataset and the 3D shape segmentation dataset, results of EXP-A and EXP-B are equal, as no sub-sampling was needed to perform EXP-A.
Overall, for all experiments in EXP-A and EXP-B, PBoW or sPBoW achieve state-of-the-art performance or even above. From EXP-A we further observe that vectorized representations (including the proposed ones) in all cases outperform kernel-based approaches. Among the compared vectorized representations, PI in most cases outperforms RM and will thus serve as the primary approach for further comparison. When comparing the stable vs. unstable variants of PBoW, we observe that PBoW in most cases outperforms its stable equivalent. This is further studied in Section 6.1.
Large differences exist in processing times of the different approaches. The slowest vectorized approach is PI. The runtimes, however, vary strongly, depending on the resolution used for PI, which depends on the optimally estimated resolution during grid search. The RM representation is one to two magnitudes faster than PIjjjFor both representations the original implementations are used. All kernel methods are about one magnitude or more slower then PI. (s)PBoW outperform almost all state of the art approaches in runtime for all datasets (in EXP-A and EXP-B). The gain in runtime efficiency ranges from one to up to four orders of magnitude. For the largest dataset (PetrSurf3D), for example, the PBoW and sPBoW require and seconds while RM requires 1.451 seconds and PI 12.136 seconds. In the following, we analyze selected aspects of the proposed representations in greater detail.
6.1 Accuracy vs. Codebook Size
The most important parameter for BoW representations is the codebook size , i.e. the number of clusters. There is no commonly agreed analytic method to estimate the optimal codebook size, thus the estimation is usually performed empirically. To investigate the sensitivity of (s)PBoW and their performance on the codebook size, we evaluate both approaches for a range of values of for each dataset. Results are shown in Fig. 2, both without (solid lines) and with weighted sub-sampling (dashed lines) of the consolidated PD.
On the synthetic dataset we observe that without weighting PBoW outperforms sPBoW. However, when codebook weighting is introduced, the stable variant sPBoW starts to work equally well. The trend shows that larger codebook sizes are better than small ones but also that with already 20 words a high performance can already be achieved. Using weighting and the stable formulation of PBoW clearly improves the performance on this dataset.
Unlike to the synthetic data, in the case of social network graphs (reddit-5k) there is no recognizable increase in performance for larger codebook sizes. We assume that this is caused by the larger variation between training and test data in real data sets. More precisely, larger codebooks result in codewords which tend to overfit on the training PDs. Such codewords do not generalize well to test data, which can result in the observed behavior.
Over all datasets we observe that the benefit of weighting is dataset dependent and that no general recommendation can be derived (see results for the remaining datasets in SMa). The stable formulation of PBoW, however, performs equally well or even better than the unstable one in 4/6 datasets.
6.2 Qualitative Analysis
In this section we investigate the proposed representations with a special focus on their discriminative abilities. We employ the synthetic dataset as proof-of-concept and GeoMat as example of a complex real-world dataset. We compute PBoW with clusters for the synthetic dataset and visually analyze the codeword histograms obtained by (hard) assignment. For each of the six shape classes we compute the average codebook histogram (over all samples of each class) to obtain one representative PBoW vector per class. The averaged PBoW histograms for each classes are presented in Fig. 3. Instead of only providing the histograms themselves, we plot for each codeword of the histogram the corresponding cluster center as a circle in the original birth-persistence domain and encode the number of assigned codeworks (the actual values of the histograms) in the area of the circles, i.e. the larger the count for a cluster, the larger the circle. The advantage of this representation is that the spatial distribution of the codewords in the PD is preserved.
From Fig. 3 we can see that except for the classes “random cloud” and “sphere” (which are difficult to differentiate) all classes generate strongly different cluster distributions. Class “circle”, for example, uniquely activates four clusters with strong persistence (top-left corner) and the “torus” class distributes its corresponding code words across a large number of clusters representing less persistent components.
Fig. 3 further illustrates an important property of persistence bag-of-words, namely its sparse nature. More specifically, areas with no points in the consolidated persistence diagram will contain no codewords (clusters). In Fig. 3, for example, no codeword is obtained in the upper-right quadrant of the diagram, since no components are located there for the underlying data. Thus these unimportant areas are neglected and not encoded into the final representation. This not only reduces the dimension of the final representation but further makes the representation adaptive to the underlying data and increases the information density of the representation.
We further investigate the performance on the GeoMat dataset. For GeoMat (s)PBoW significantly outperforms all other representations (see Table 1), first and foremost PI, which is the best related approach on this dataset in EXP-B. To this end, we generate confusion matrices for PI and PBoW that show that PBoW yields a better class separation (see Fig. 6 in SMa). Averaged PBoW histograms for two example classes (“cement smooth” and “concrete cast-in-place”) are shown in Fig. 4. For both classes the histograms are on the first sight similar (upper row in Fig. 4). However, by zooming-in towards the birth-persistence plane in Fig. 4 (bottom row), differences become visible. The plots in the center illustrate the difference between the class distributions (red color means left class is stronger, blue means right class is stronger for this cluster). The classes distinguish themselves by fine-grained spatial differences. The set of three blue points around birth time of 0 (which are characteristic for class “concrete cast-in-place”) surrounded by red points (which are characteristic for class “cement smooth”) illustrates this well (see lower central plot). For the discrimination of these two classes a particularly fine-grained codebook with many clusters is needed. The PI has problems with such fine-grained structures, because due to its limited resolution, all topological components in the most discriminative area would most likely fall into one pixel. Therefore, an extraordinary high resolution would be necessary to capture the discriminative patterns between those two classes. The bag-of-words model makes our approaches independent of the resolution and enables to efficiently capture such fine-grained differences. More examples from the GeoMat dataset can be found in SMa in Section 5.4 together with additional evaluations of (s)PBoW on computation time, dataset size and accuracy, see Sections 5.2 and 5.3.
Acknowledgements
This work was supported by the National Science Centre, Poland under grants no. 2015/19/D/ST6/01215, 2015/19/B/ST6/01819 and 2017/25/B/ST6/01271, the Austrian Research Promotion Agency FFG under grant no. 856333 and 866855, the Lower Austrian Research and Education Company NFB under grant no. LSC14-005 and by EPSRC grant no. EP/R018472/1.
The reference list from the paper itself. Each links out to its DOI / PubMed record.
- 1Adams et al. [2017] H. Adams, T. Emerson, M. Kirby, R. Neville, C. Peterson, P. Shipman, S. Chepushtanova, E. Hanson, F. Motta, and L. Ziegelmeier. Persistence images: a stable vector representation of persistent homology. Journal of Machine Learning Research , 18(8):1–35, 2017.
- 2Anirudh et al. [2016] R. Anirudh, V. Venkataraman, K. Natesan Ramamurthy, and P. Turaga. A riemannian framework for statistical analysis of topological persistence diagrams. In Proc. of IEEE CVPR - Workshops , pages 68–76, 2016.
- 3Baeza-Yates et al. [1999] Ricardo Baeza-Yates, Berthier Ribeiro-Neto, et al. Modern information retrieval , volume 463. ACM press New York, 1999.
- 4Bauer et al. [2017] U. Bauer, M. Kerber, J. Reininghaus, and H. Wagner. Phat–persistent homology algorithms toolbox. Journal of Symbolic Computation , 78:76–90, 2017.
- 5Bubenik [2015] P. Bubenik. Statistical topological data analysis using persistence landscapes. JMLR , 16(1):77–102, 2015.
- 6Carrière et al. [2017] M. Carrière, M. Cuturi, and S. Oudot. Sliced wasserstein kernel for persistence diagrams. In ICML , 2017.
- 7De Gol et al. [2016] Joseph De Gol, Mani Golparvar-Fard, and Derek Hoiem. Geometry-informed material recognition. In Proc. of CVPR , pages 1554–1562, 2016.
- 8Dey et al. [2019] Tamal K. Dey, Dayu Shi, and Yusu Wang. Simba: An efficient tool for approximating rips-filtration persistence via simplicial batch collapse. J. Exp. Algorithmics , 24(1):1.5:1–1.5:16, January 2019.
