Compton-thick AGN in the NuSTAR era III: A systematic study of the torus covering factor
Stefano Marchesi, Marco Ajello, Xiurui Zhao, Lea Marcotulli, Mislav, Balokovic, Murray Brightman, Andrea Comastri, Giancarlo Cusumano, Giorgio, Lanzuisi, Valentina La Parola, Alberto Segreto, Cristian Vignali

TL;DR
This study systematically analyzes a sample of 35 nearby Compton-thick AGNs using NuSTAR data to measure torus covering factors and compare spectral models, revealing correlations with obscuration and luminosity.
Contribution
It provides the first systematic comparison of torus covering factors in Compton-thick AGNs using NuSTAR data and evaluates different spectral models for consistency.
Findings
High covering factor AGNs tend to have more uniform gas distributions.
Low covering factor AGNs are associated with patchy, over-dense regions.
An inverse relation between covering factor and AGN luminosity is suggested.
Abstract
We present the analysis of a sample of 35 candidate Compton thick (CT-) active galactic nuclei (AGNs) selected in the nearby Universe (average redshift <z>~0.03) with the Swift-BAT 100-month survey. All sources have available NuSTAR data, thus allowing us to constrain with unprecedented quality important spectral parameters such as the obscuring torus line-of-sight column density (N_{H, z}), the average torus column density (N_{H, tor}) and the torus covering factor (f_c). We compare the best-fit results obtained with the widely used MyTorus (Murphy et al. 2009) model with those of the recently published borus02 model (Balokovic et al. 2018) used in the same geometrical configuration of MyTorus (i.e., with f_c=0.5). We find a remarkable agreement between the two, although with increasing dispersion in N_{H, z} moving towards higher column densities. We then use borus02 to measure f_c.…
Click any figure to enlarge with its caption.
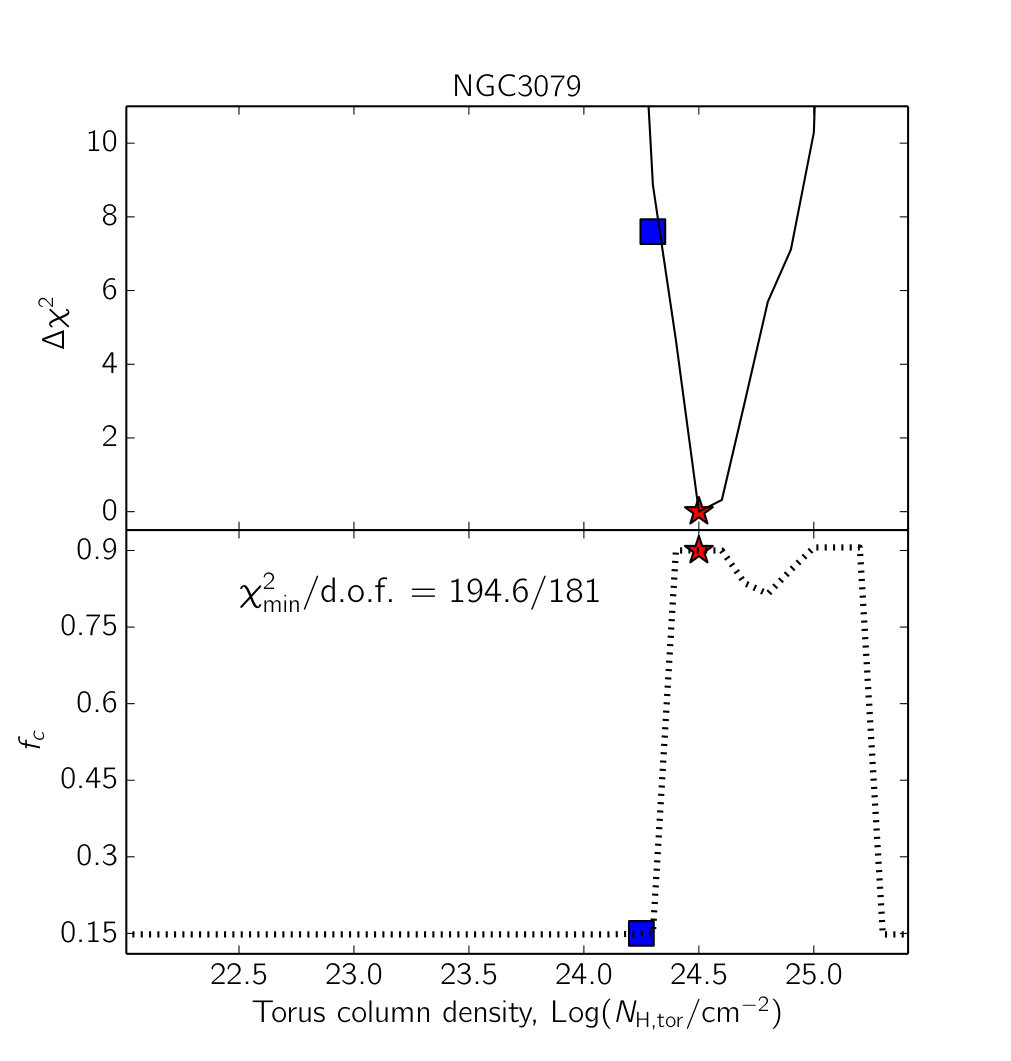 Figure 1
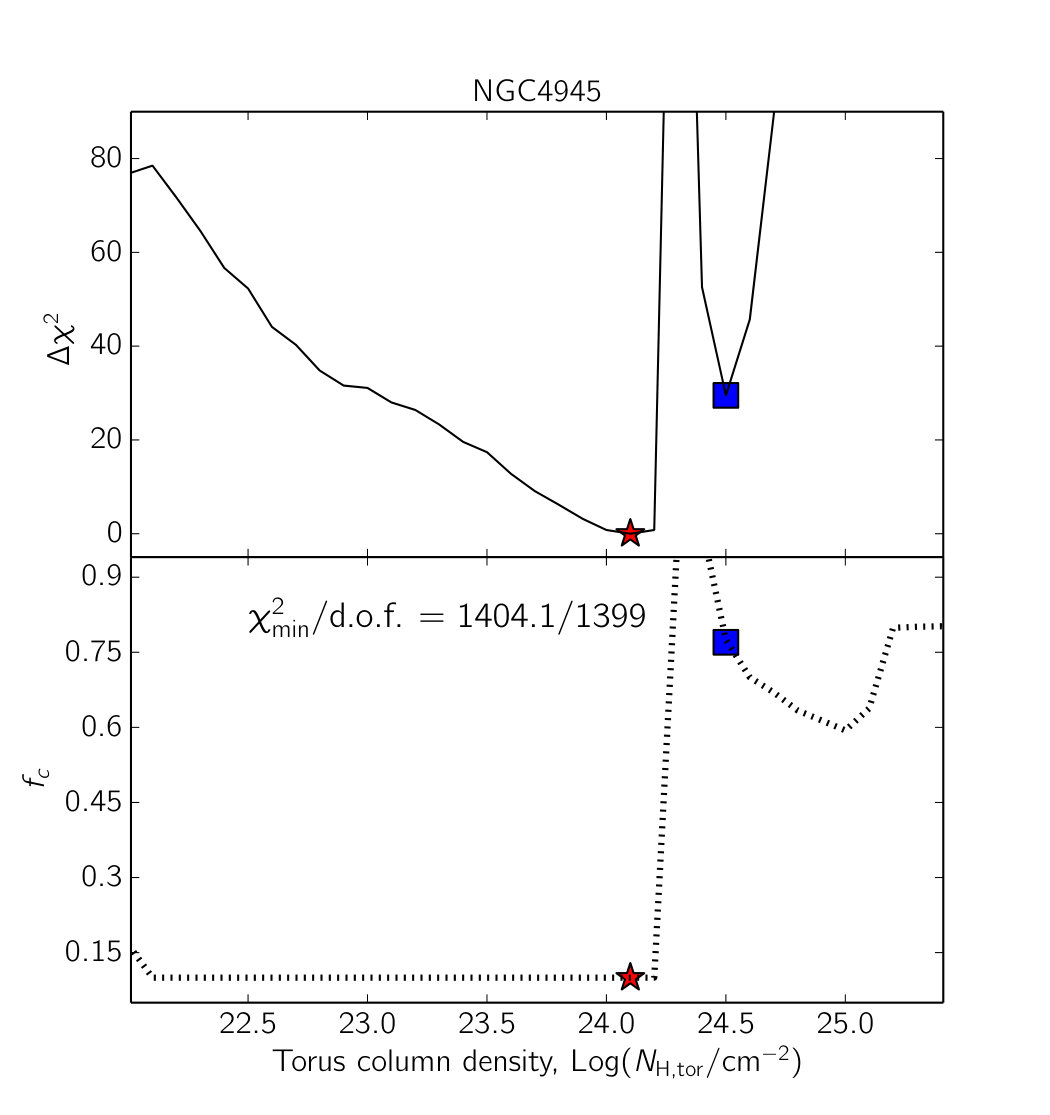 Figure 2
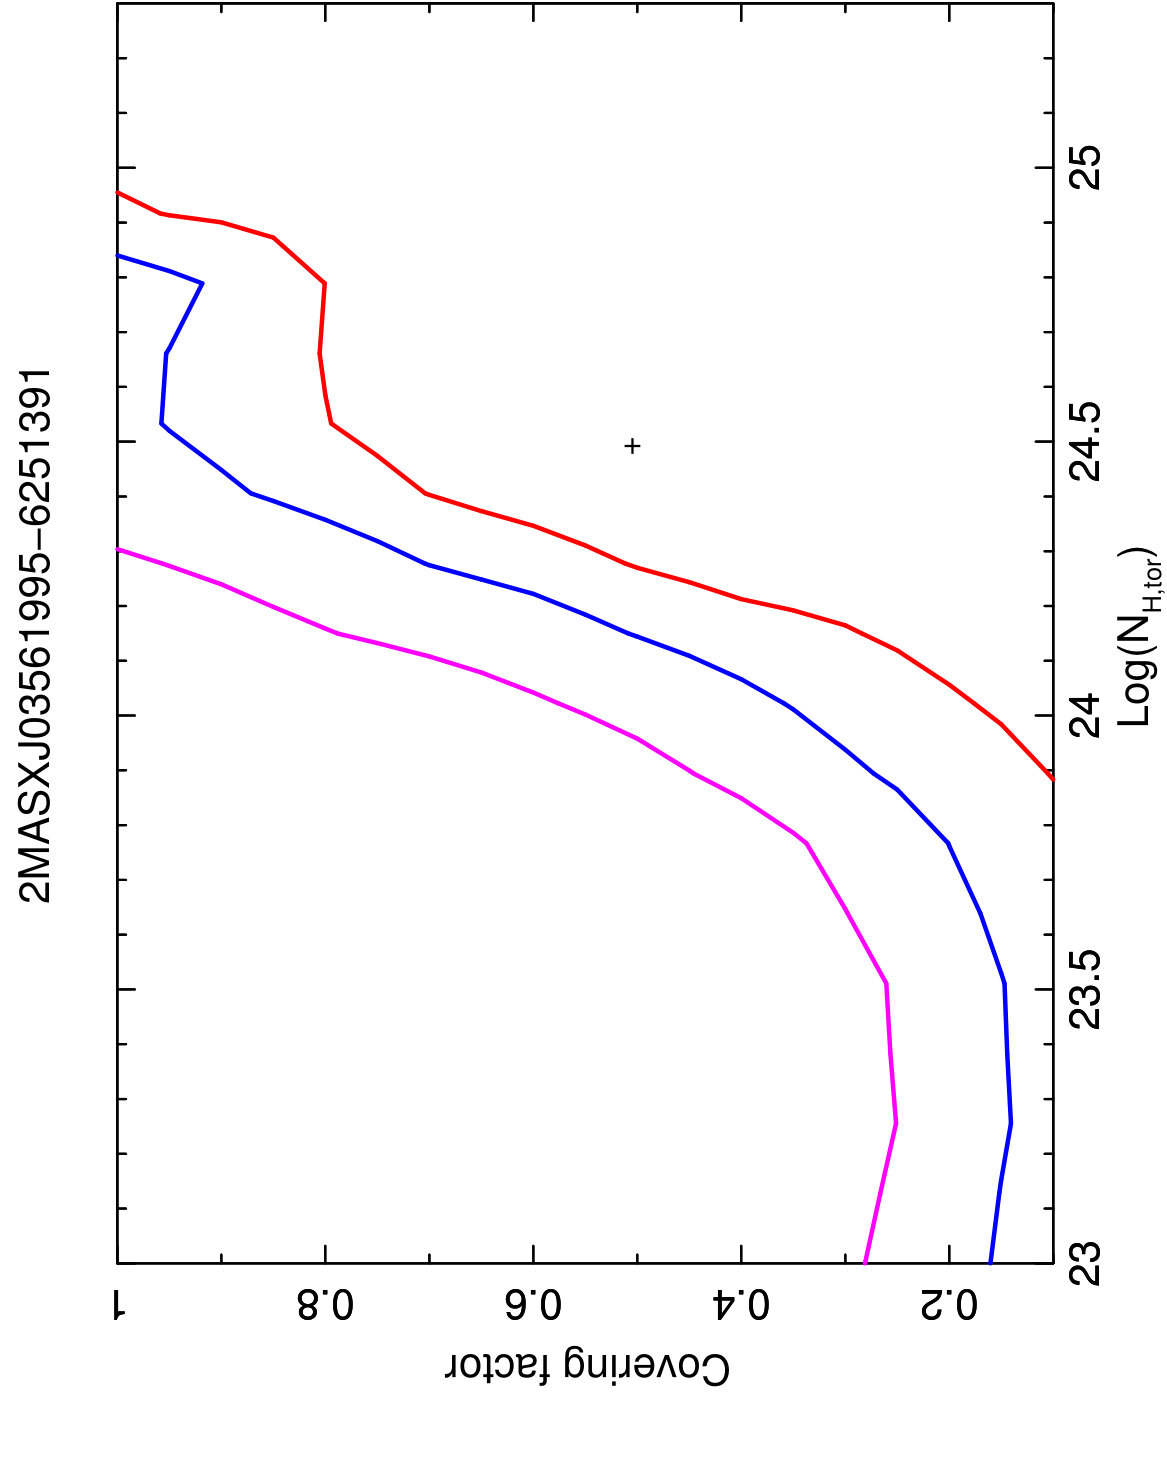 Figure 3
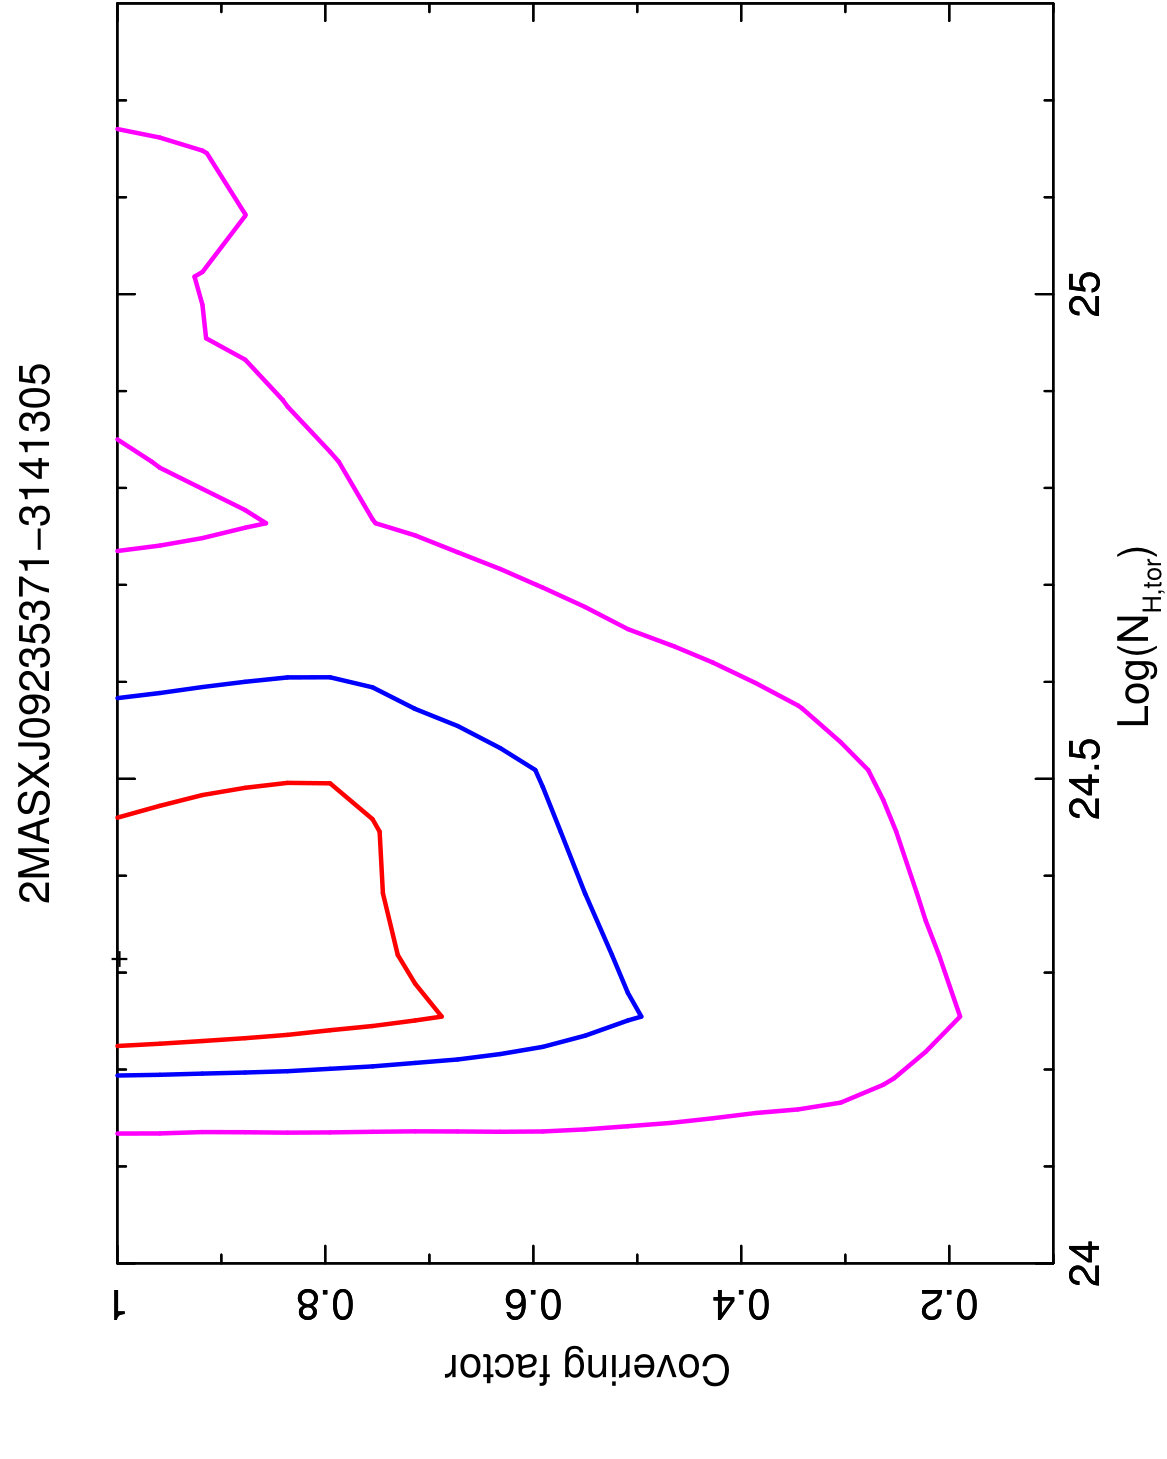 Figure 4
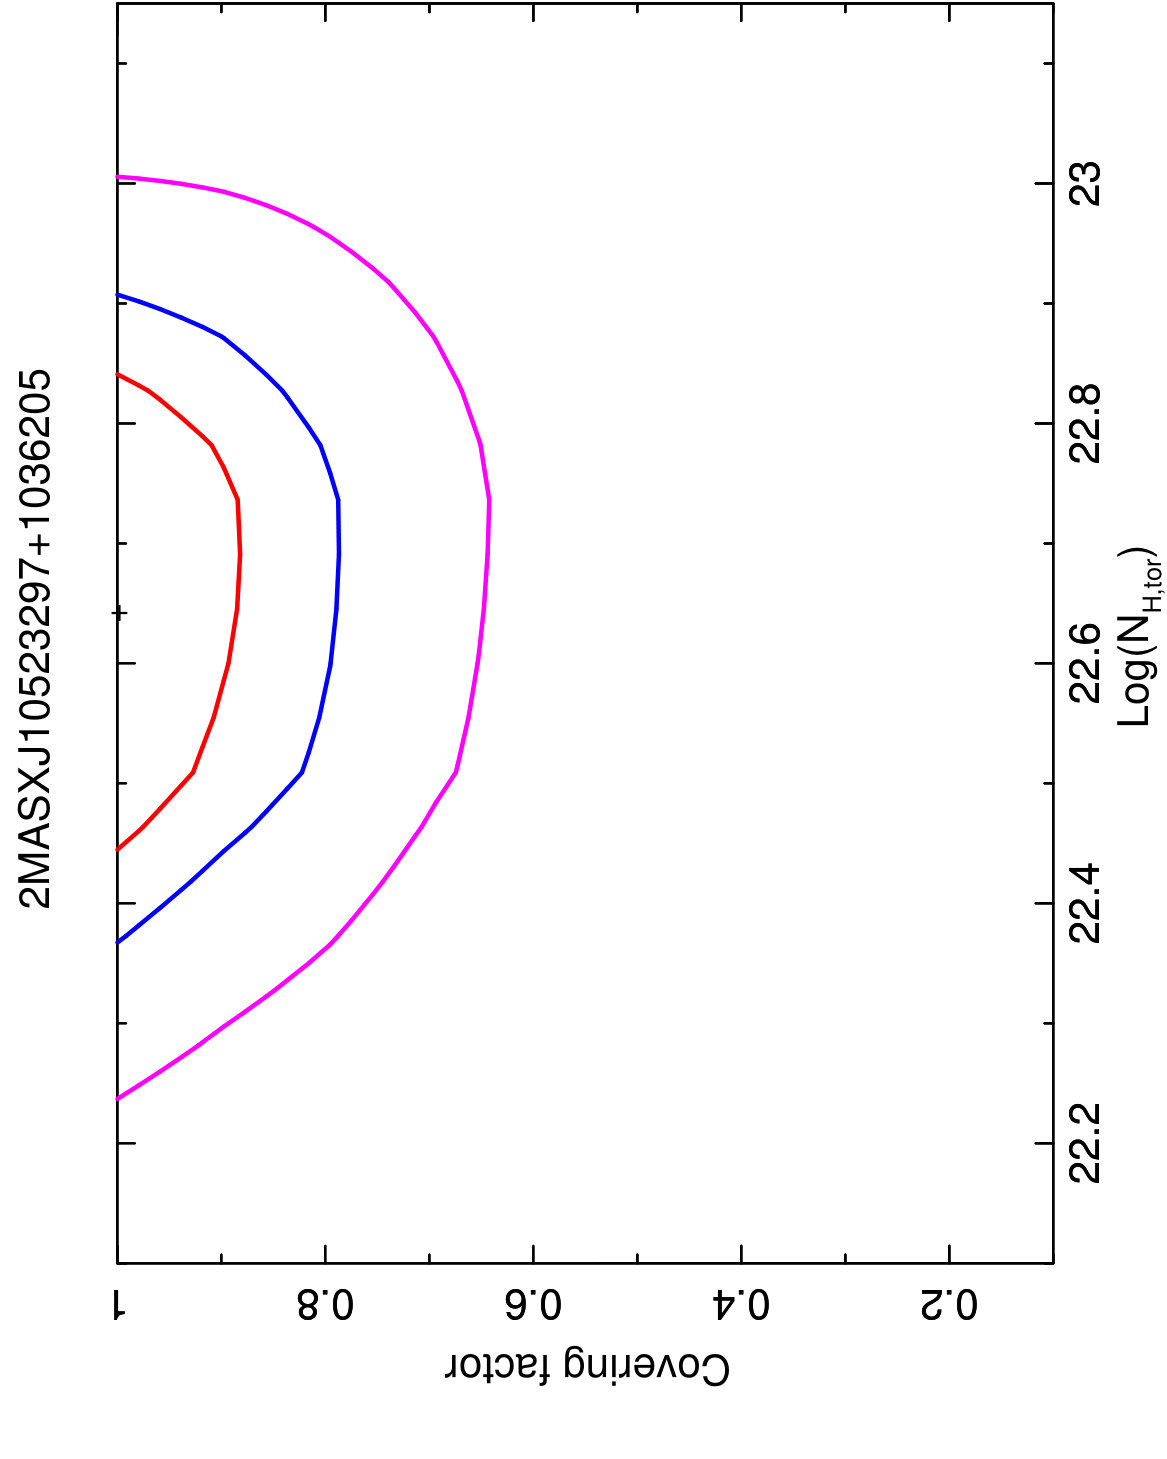 Figure 5
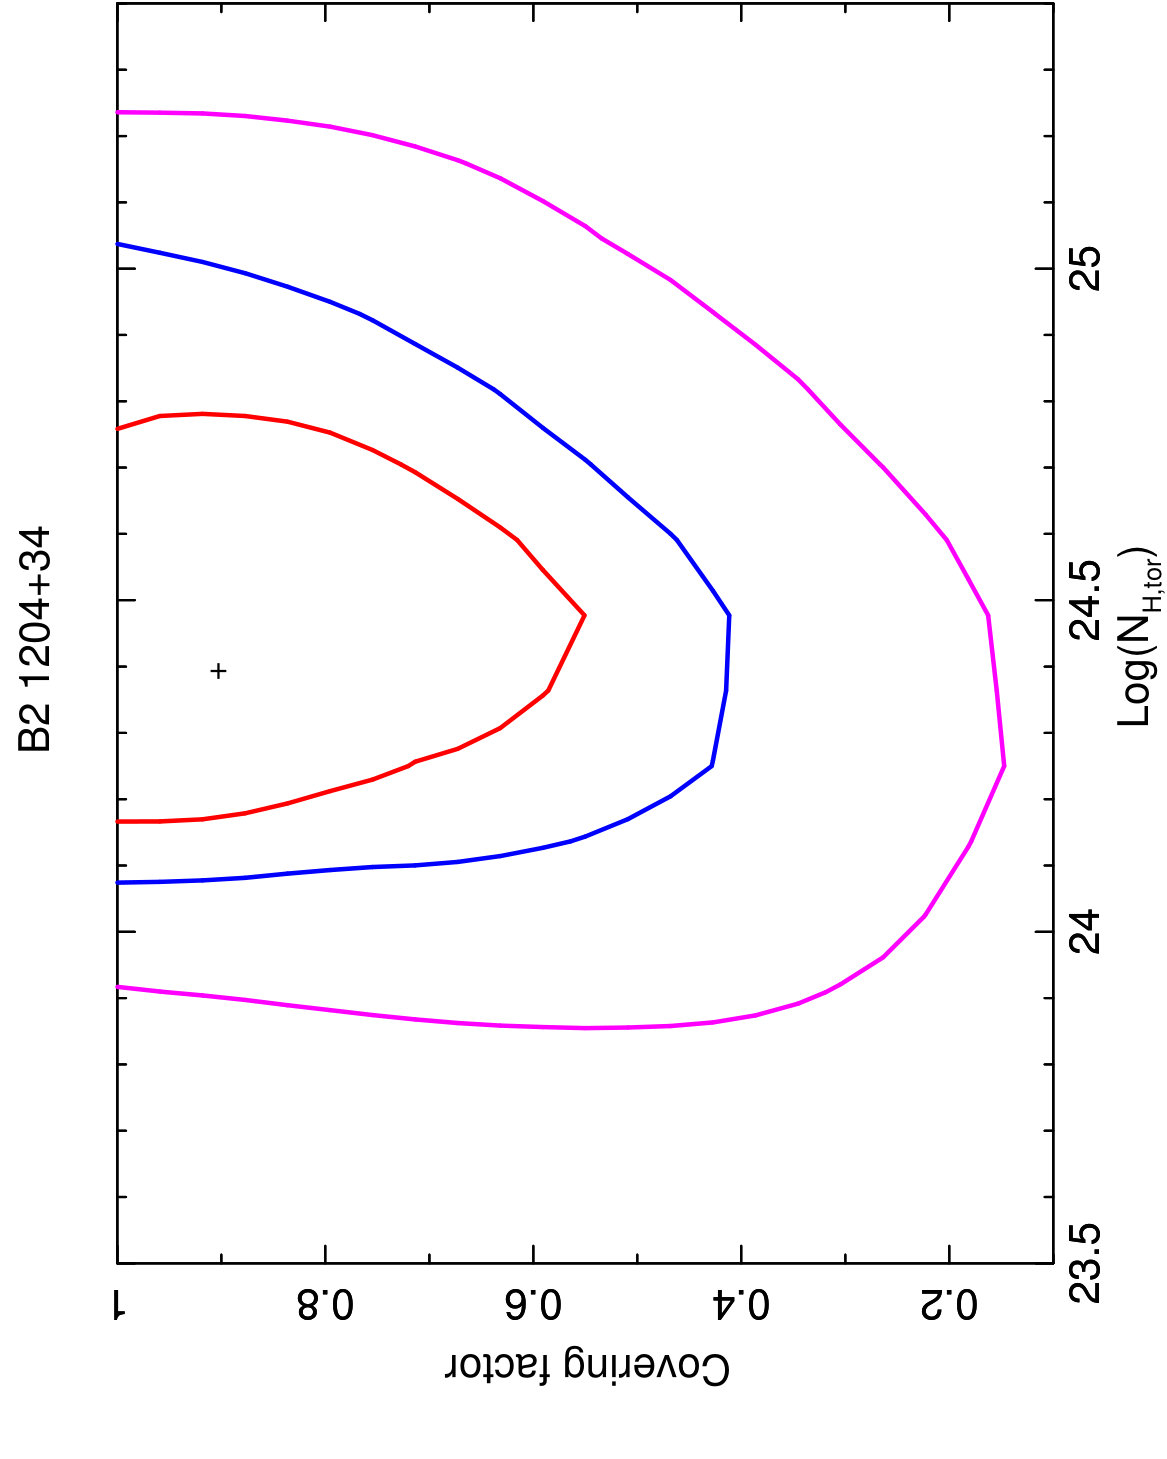 Figure 6
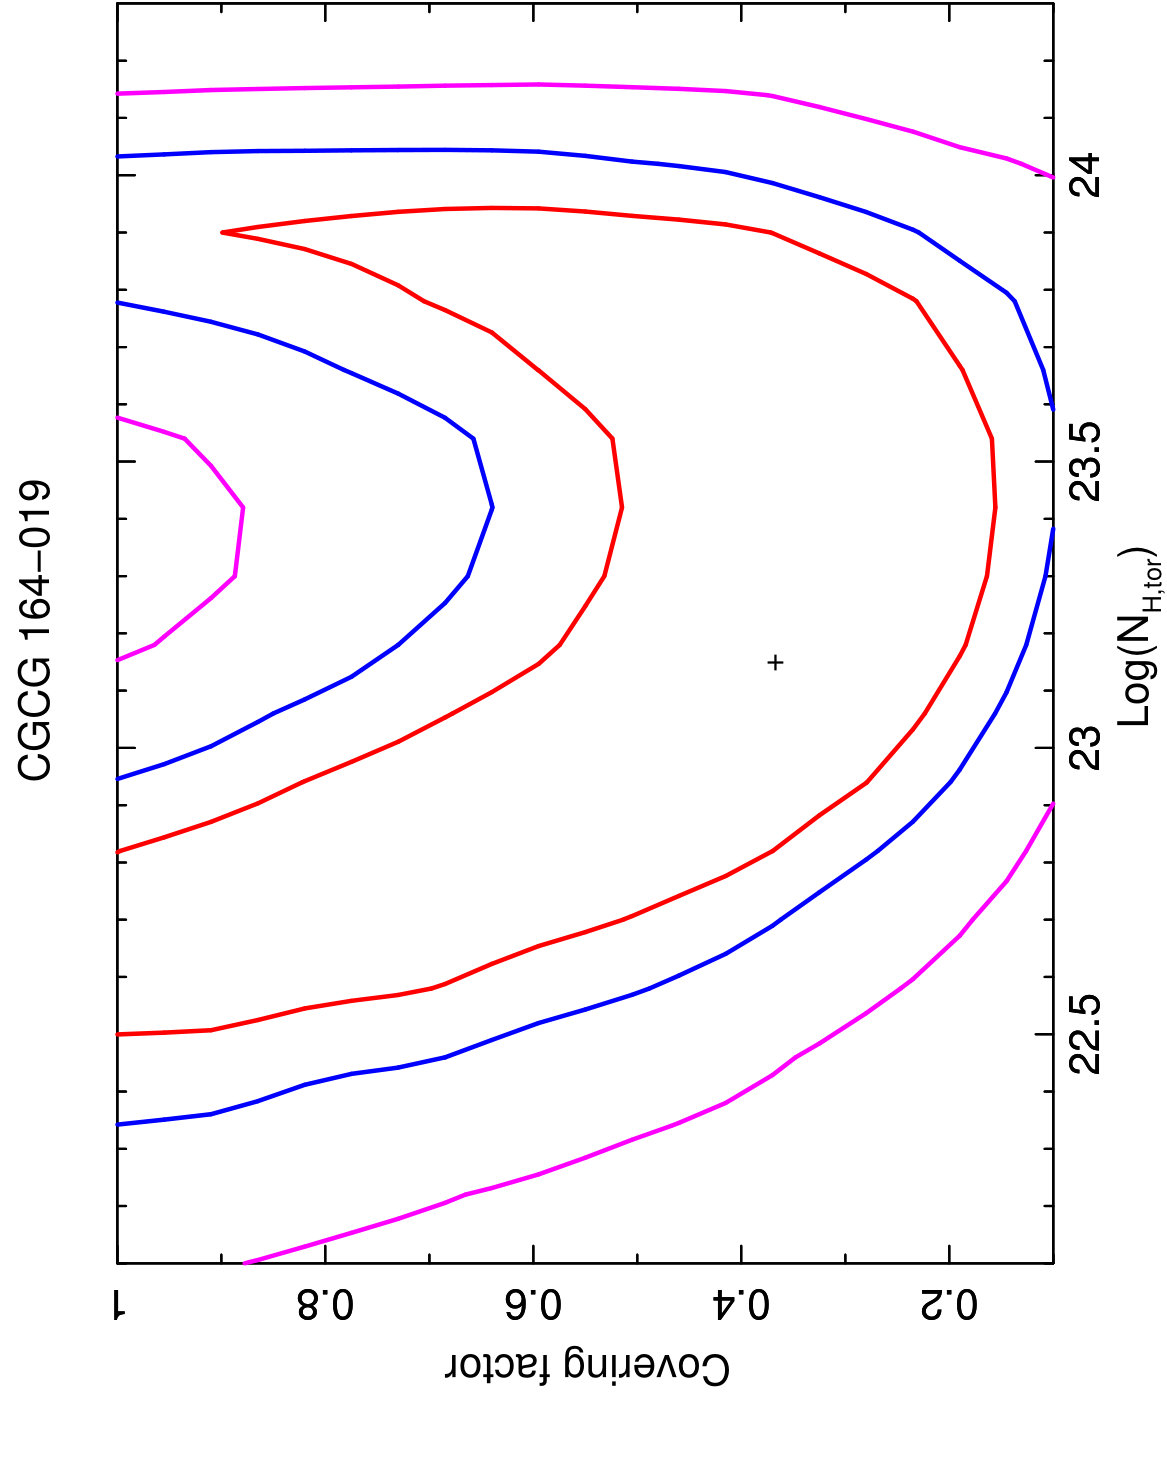 Figure 7
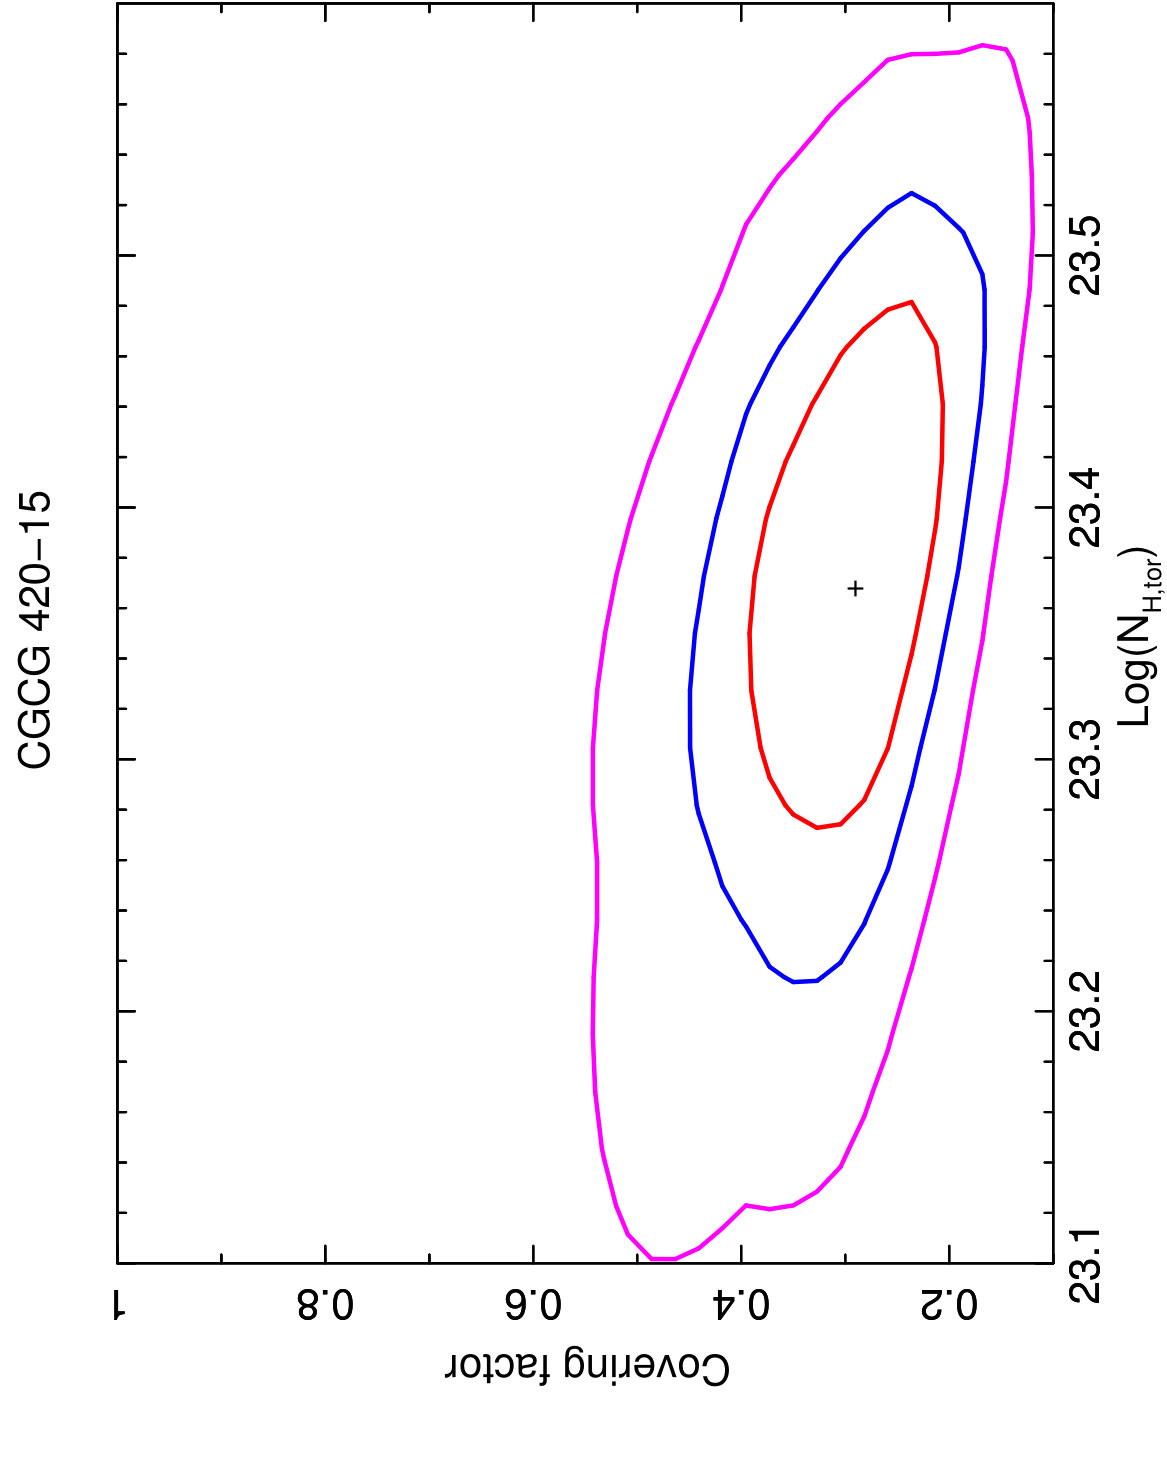 Figure 8
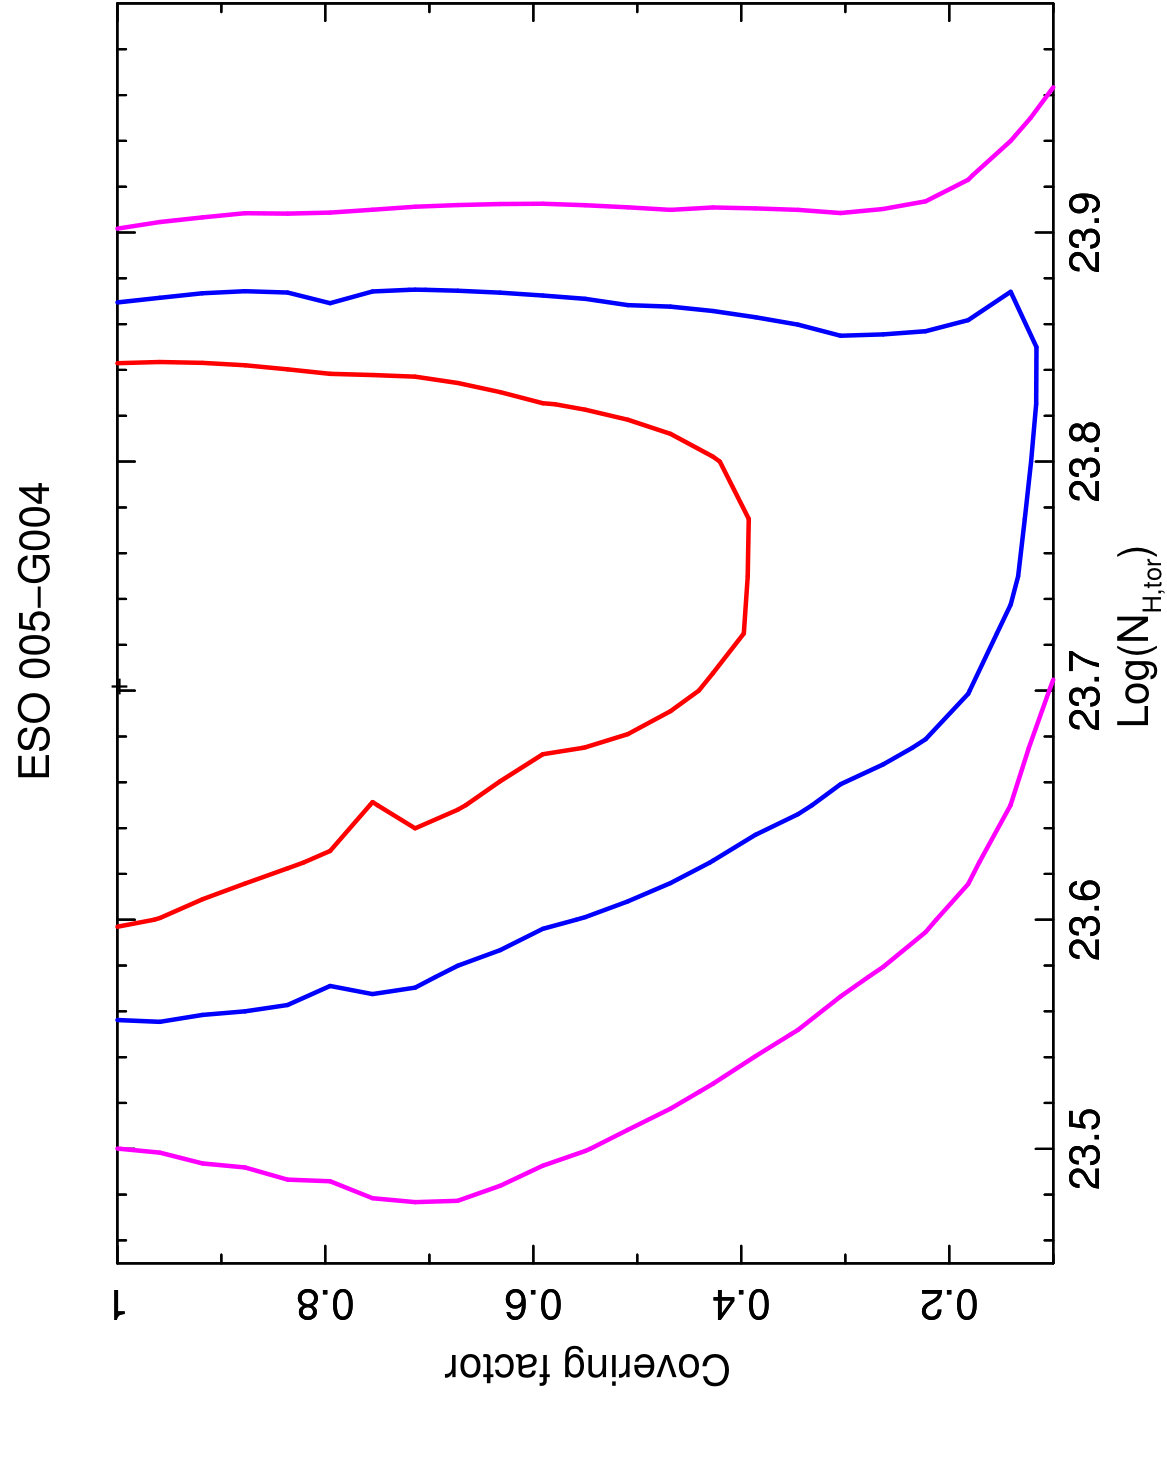 Figure 9
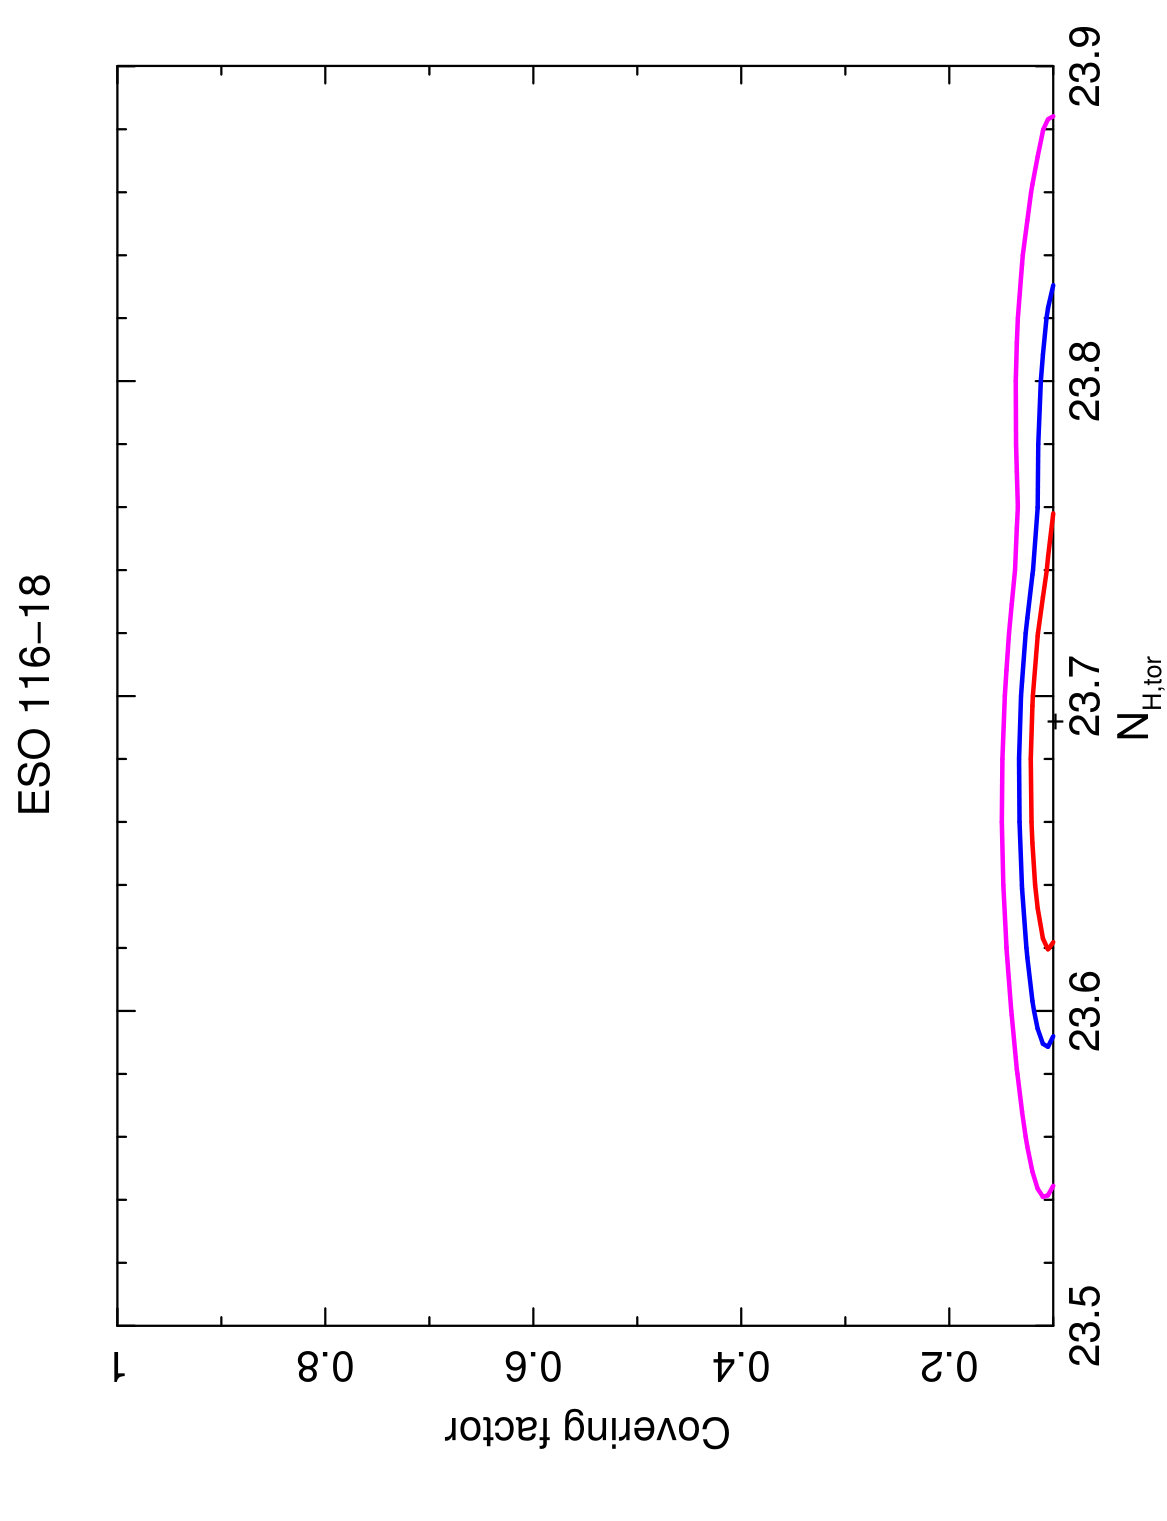 Figure 10
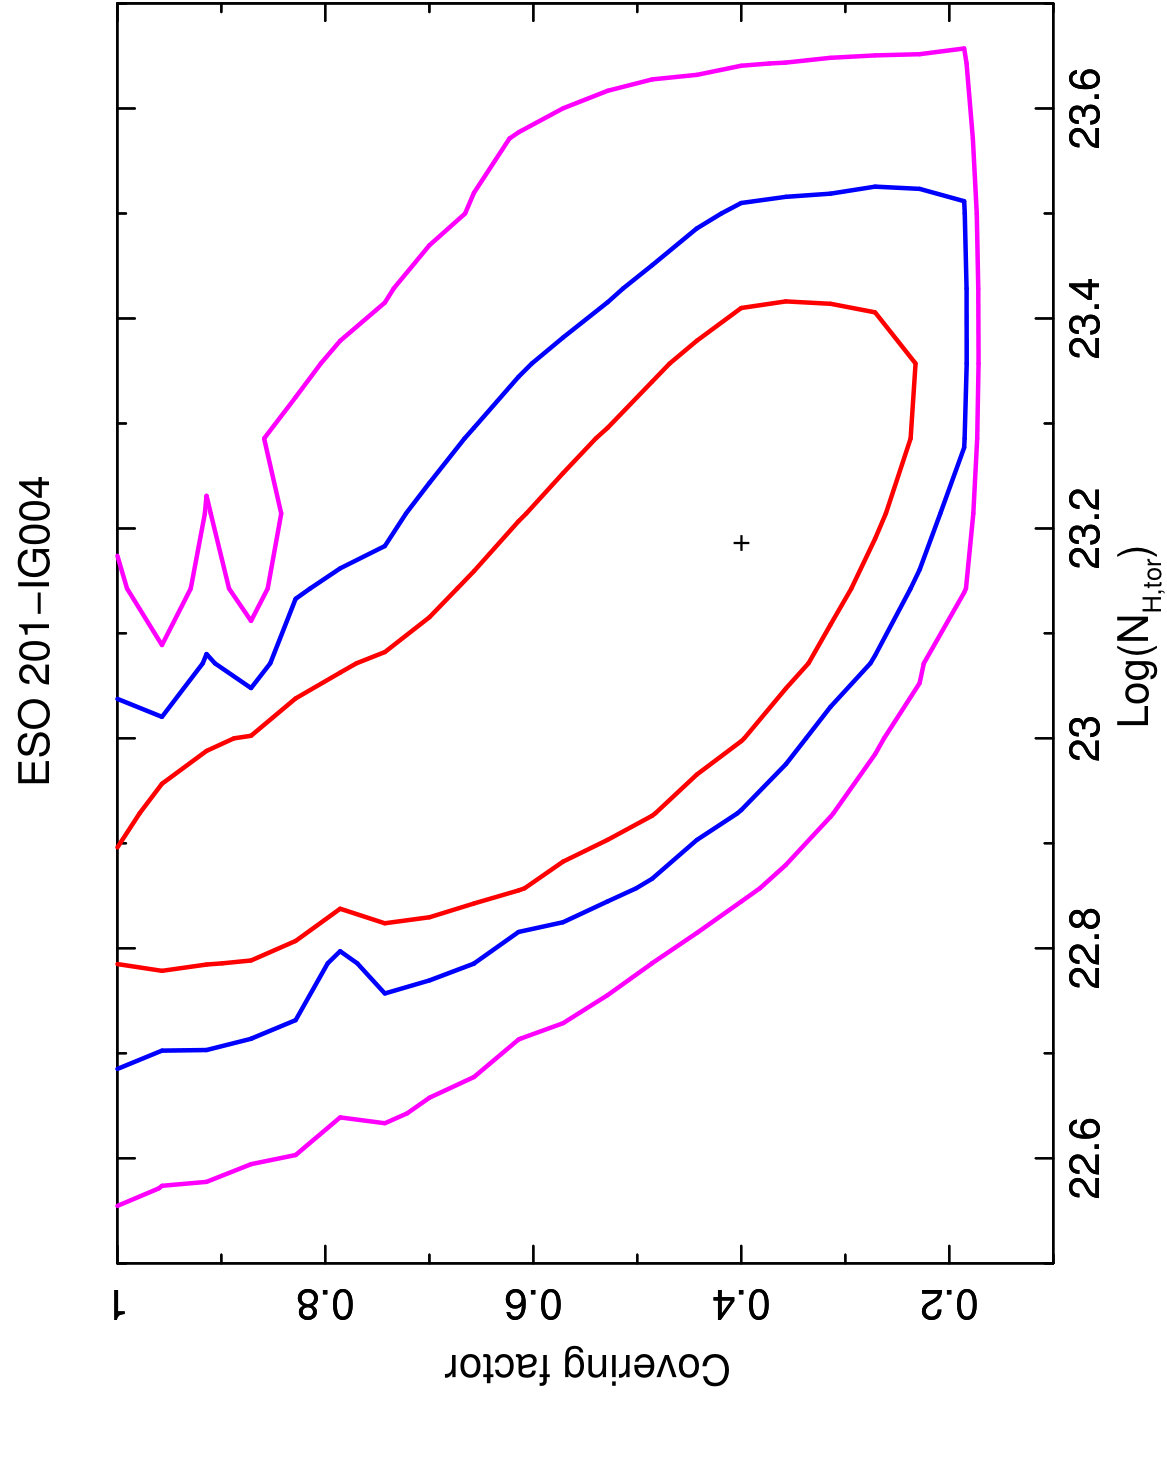 Figure 11
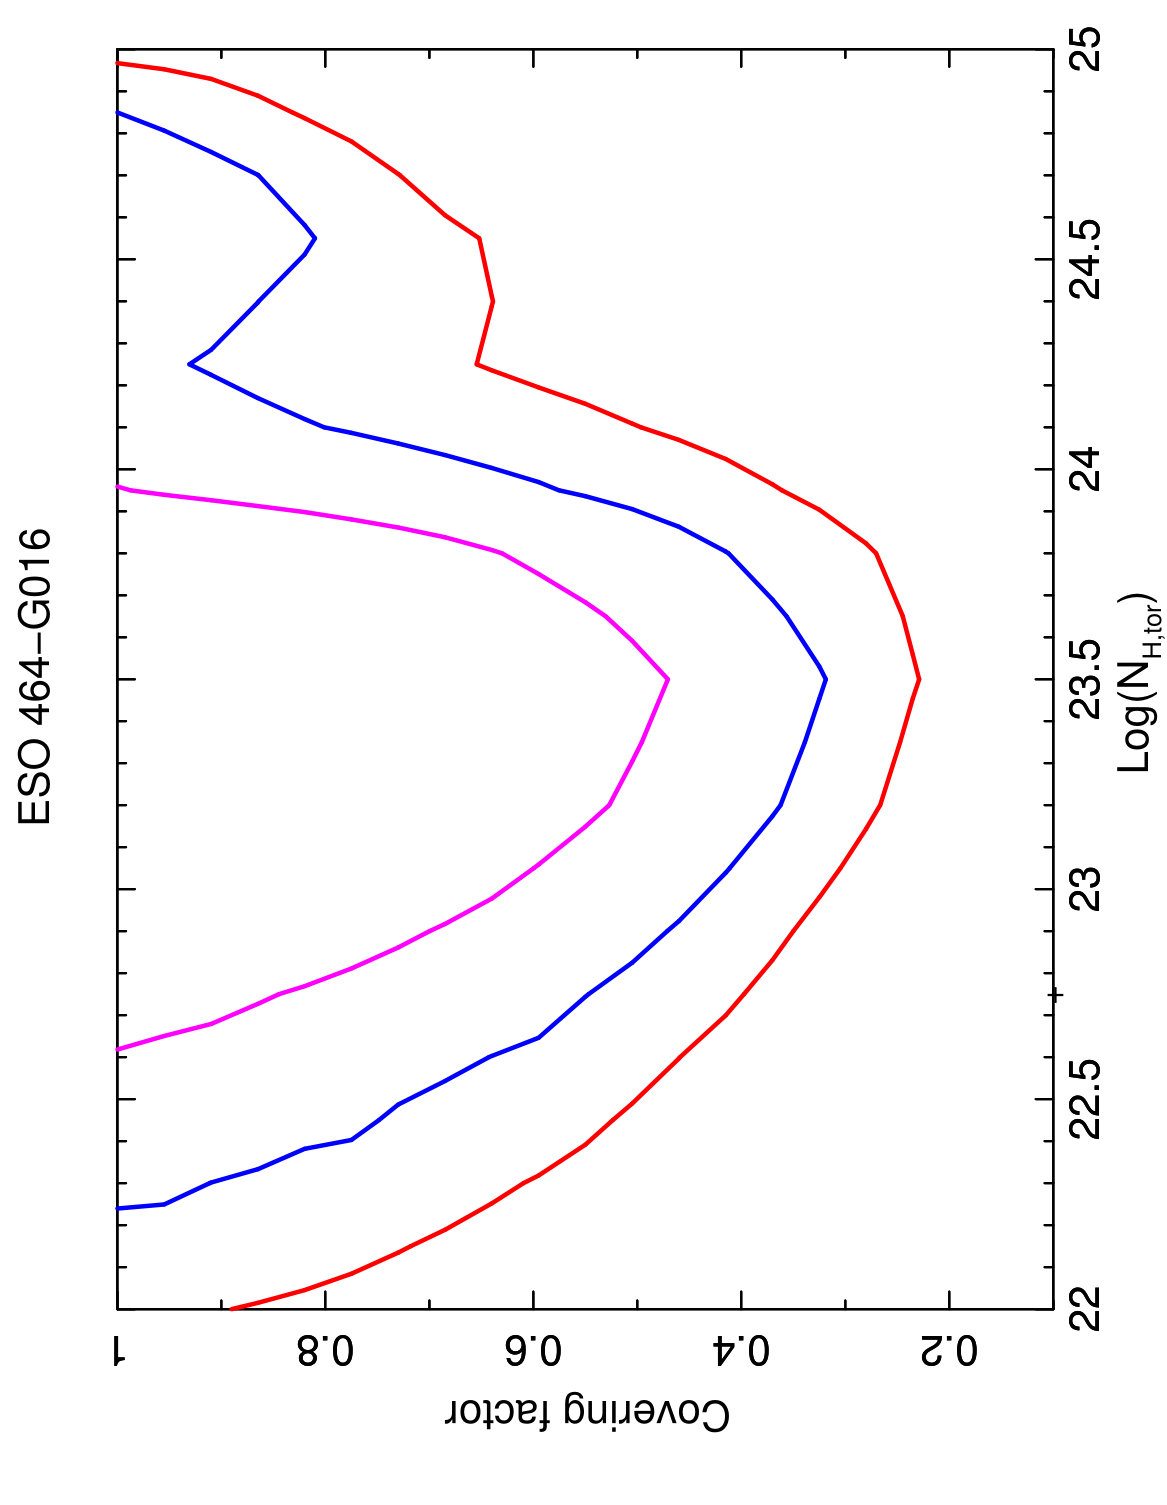 Figure 12
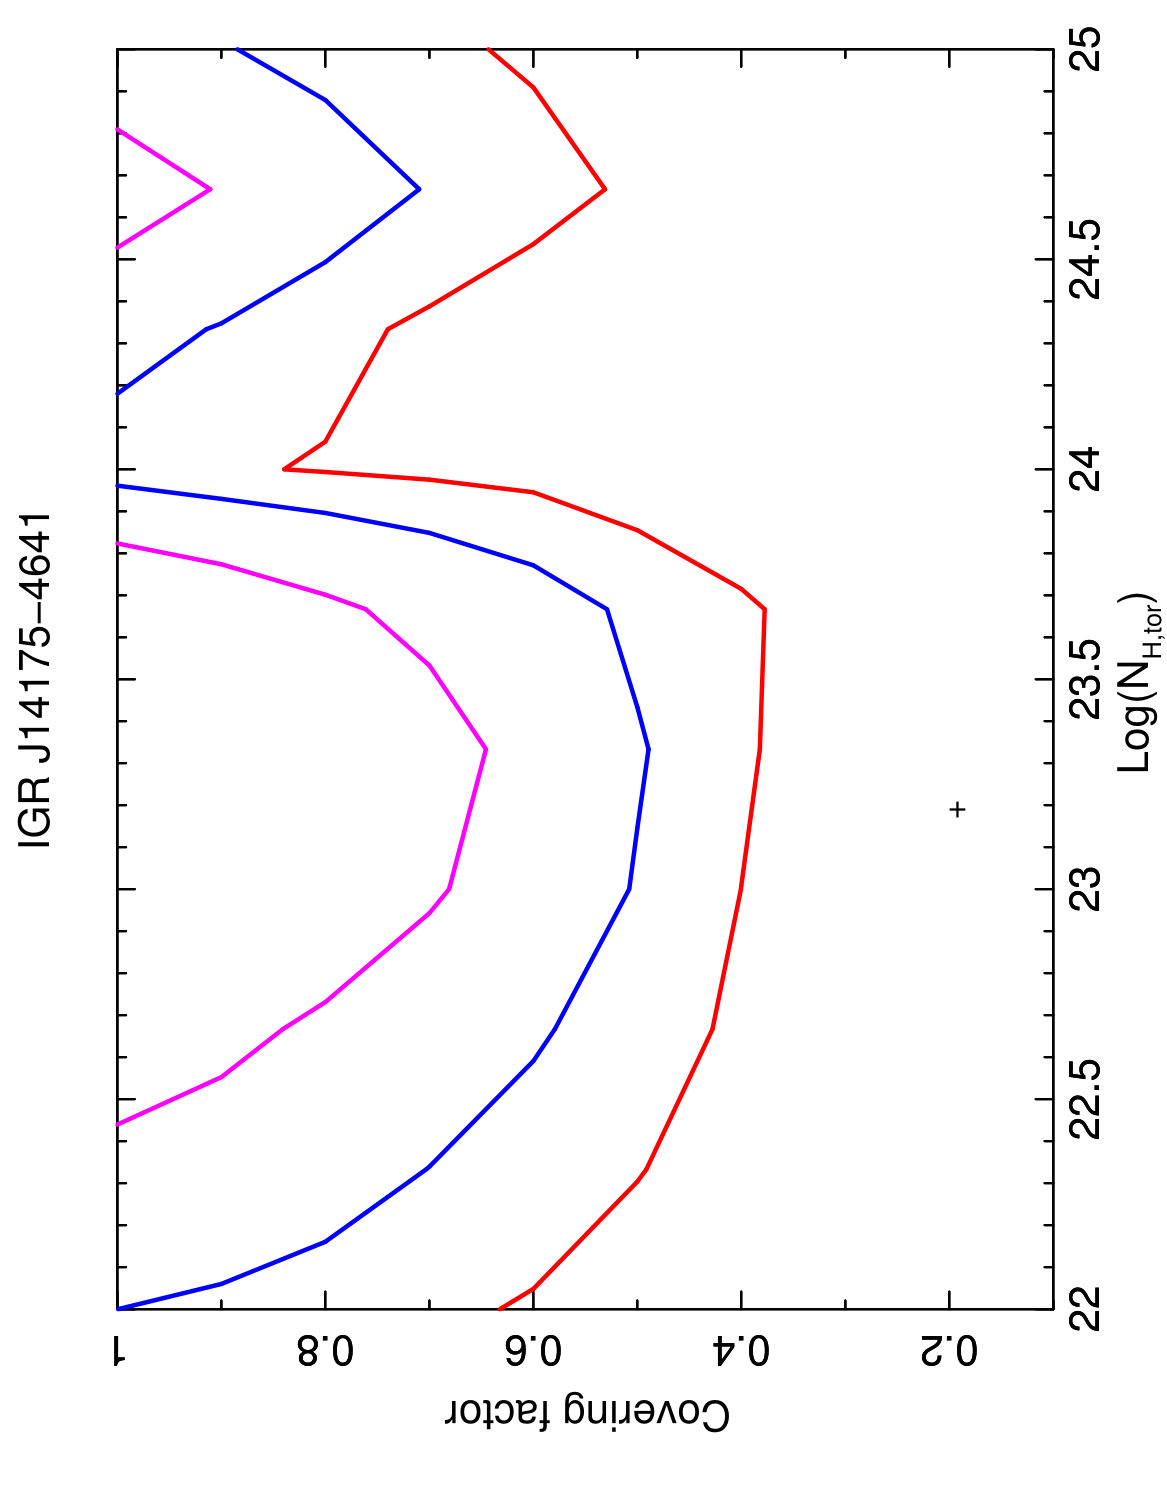 Figure 13
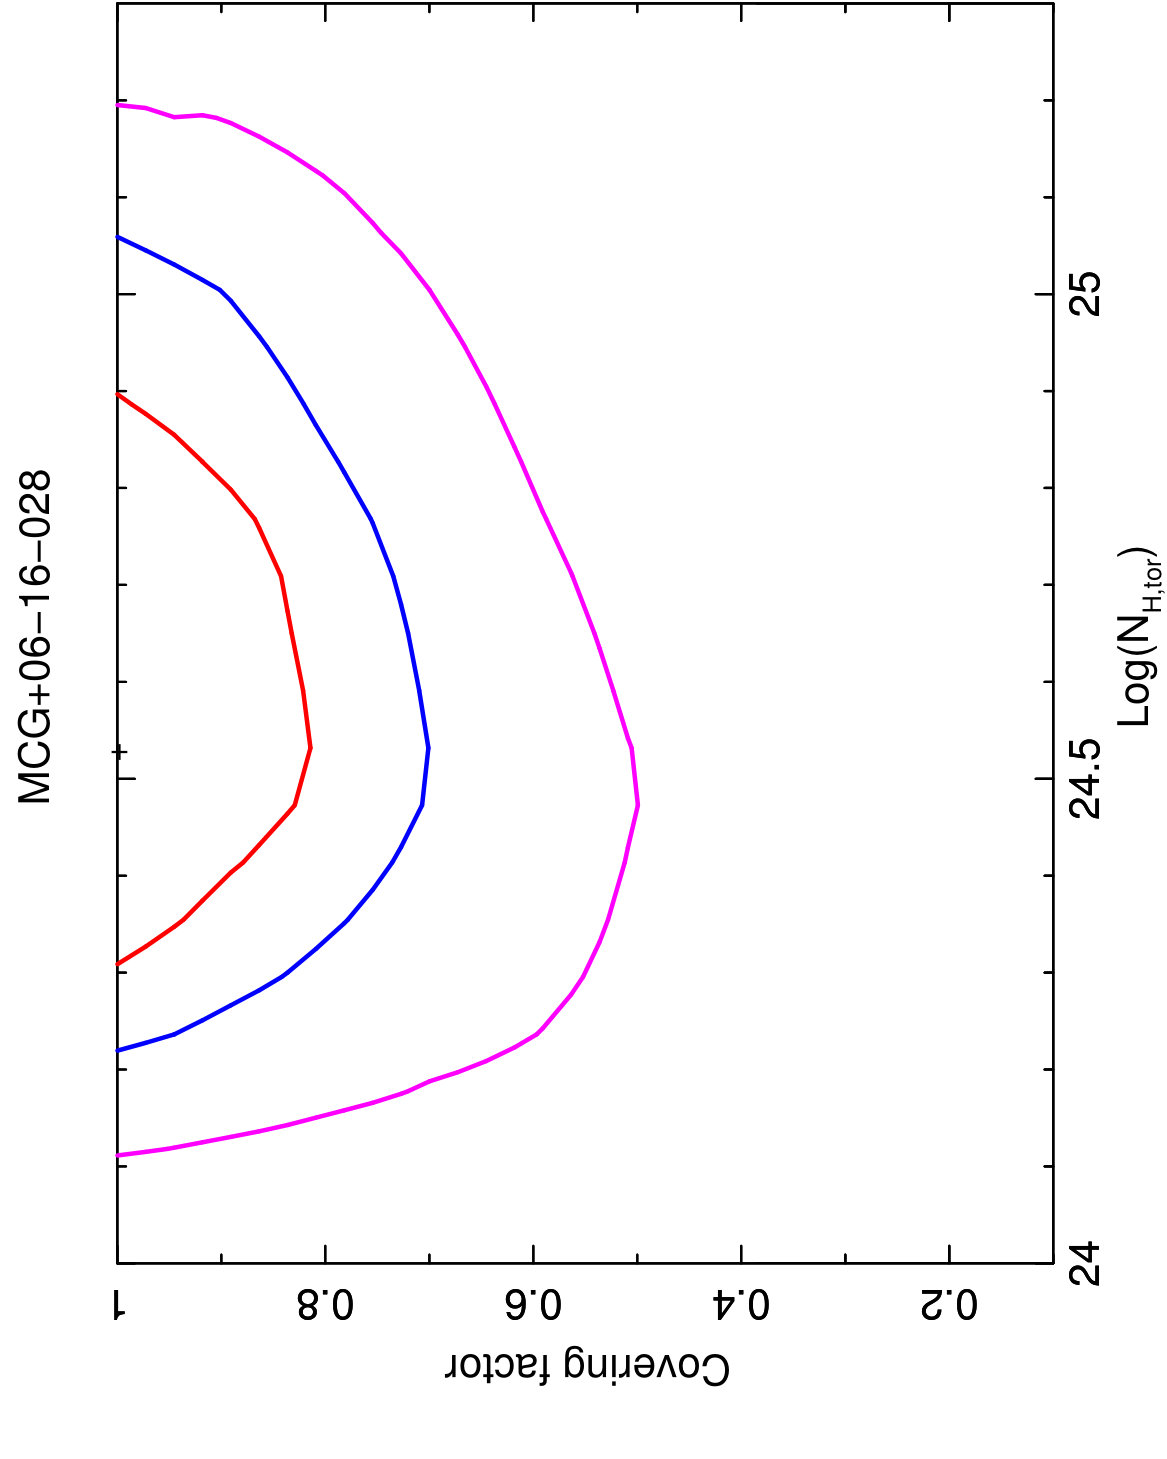 Figure 14
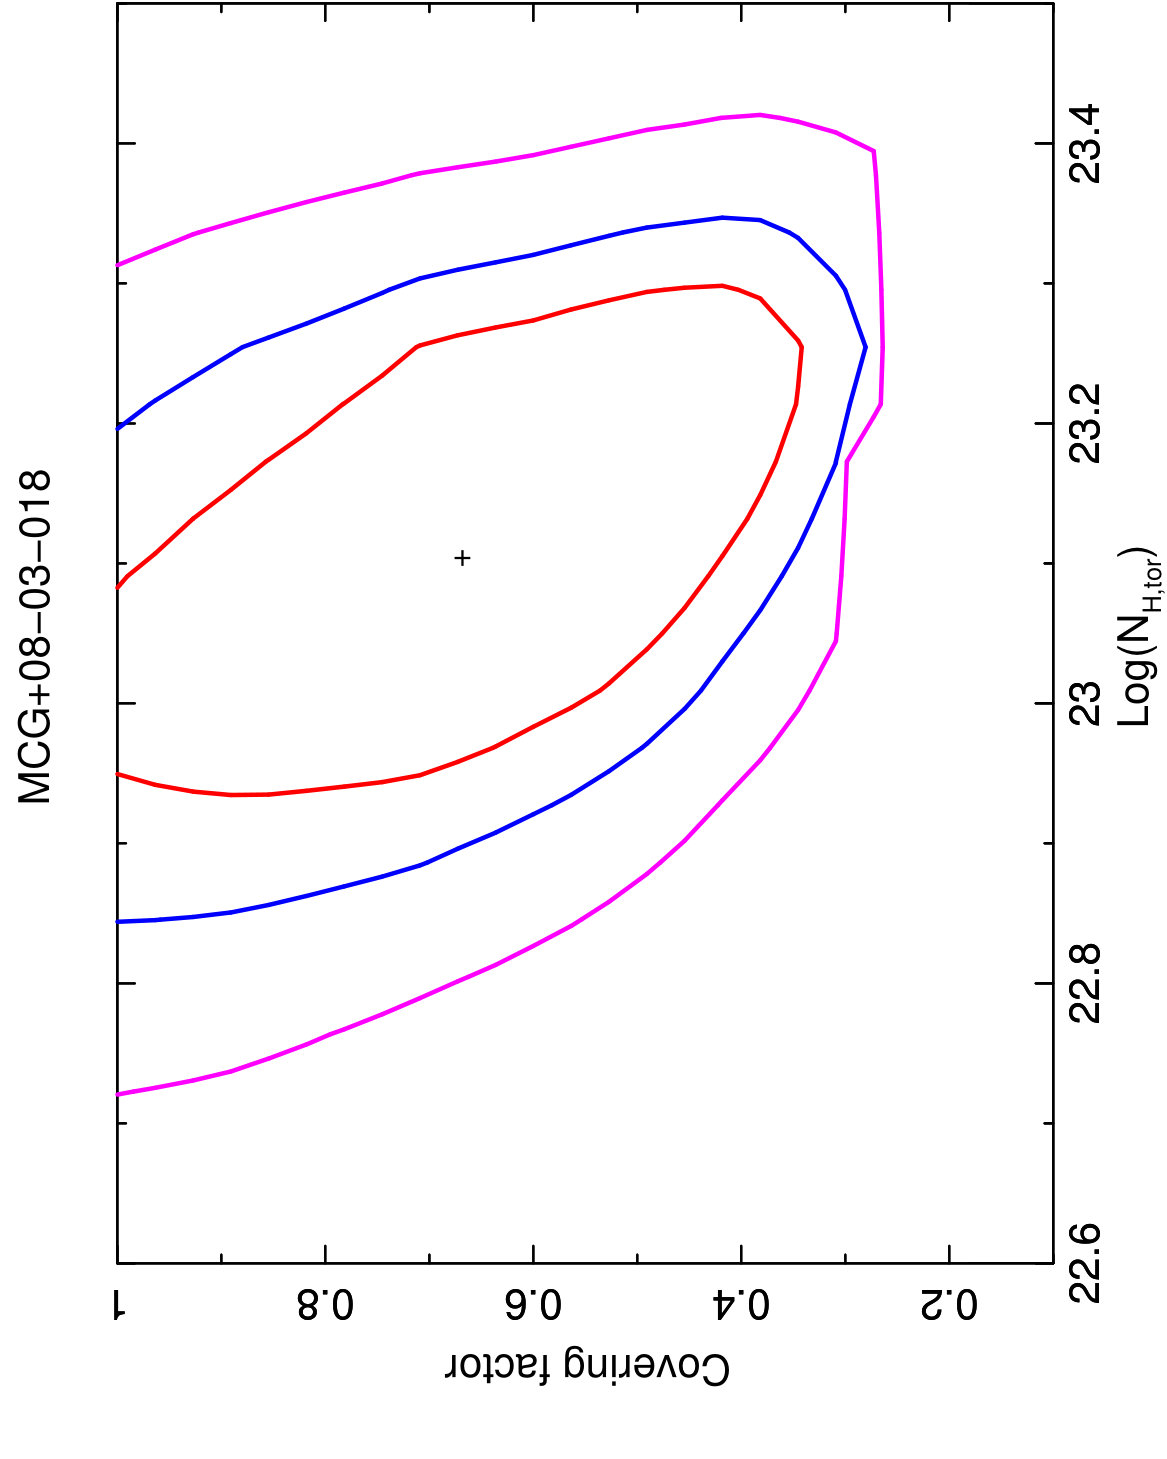 Figure 15
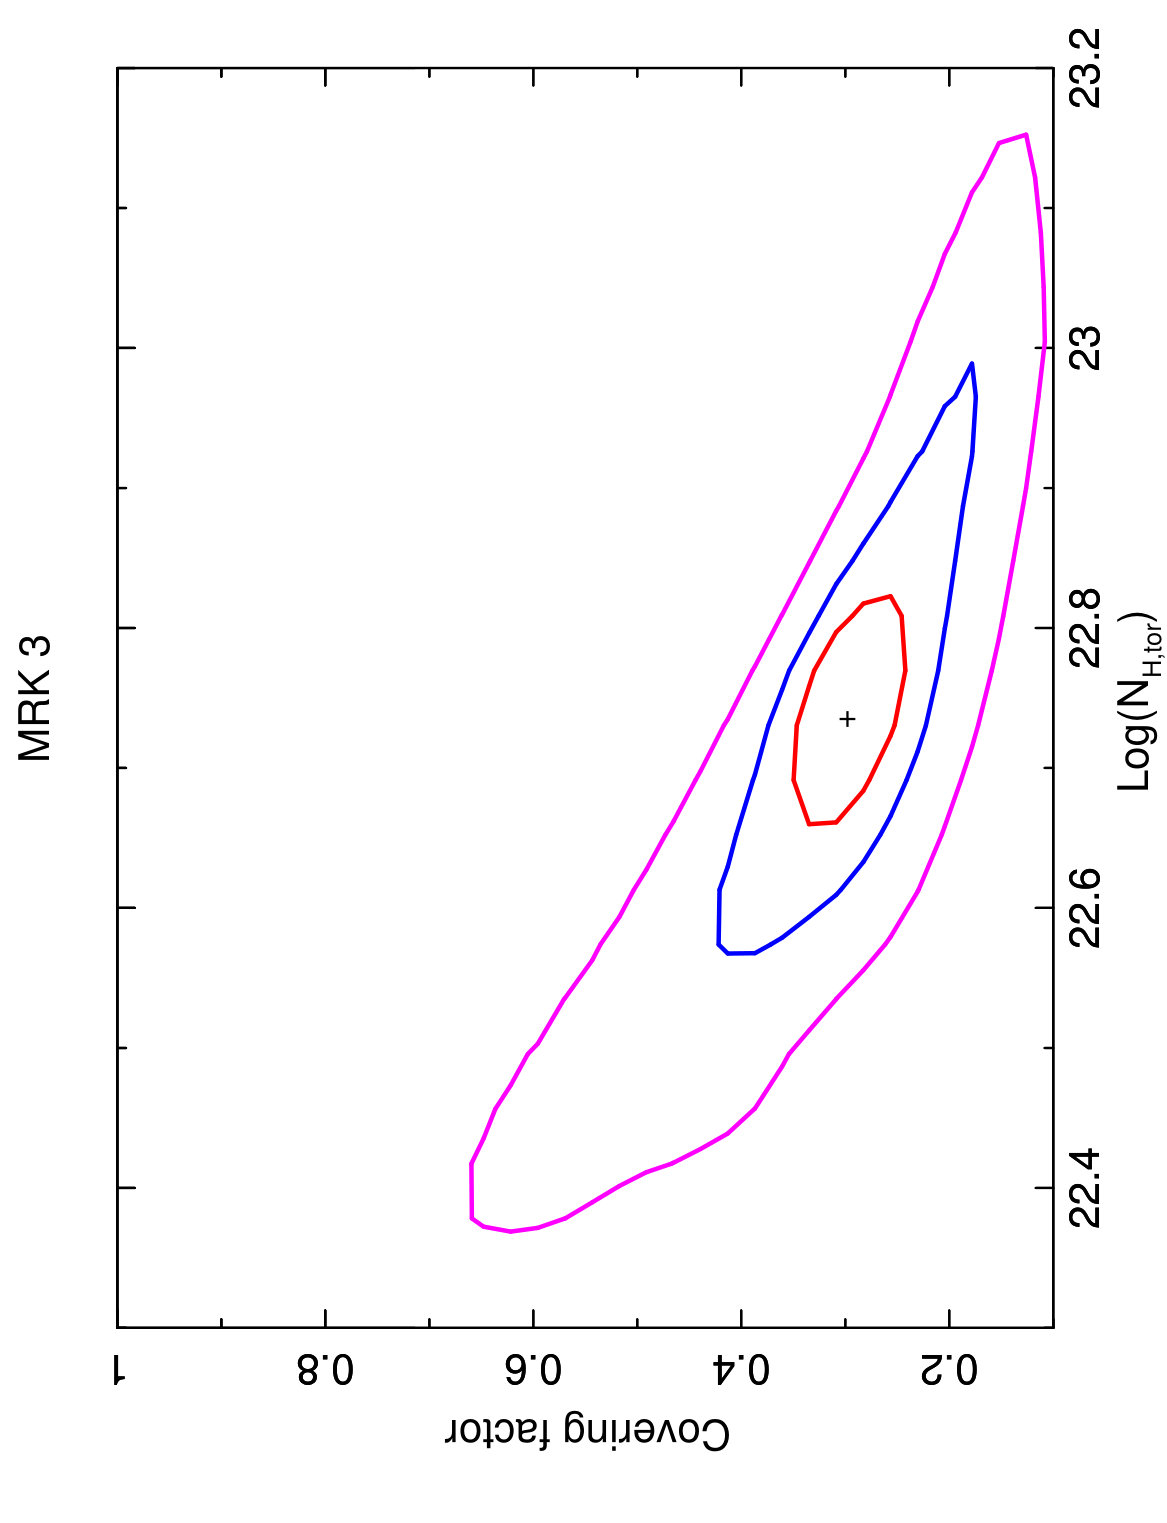 Figure 16
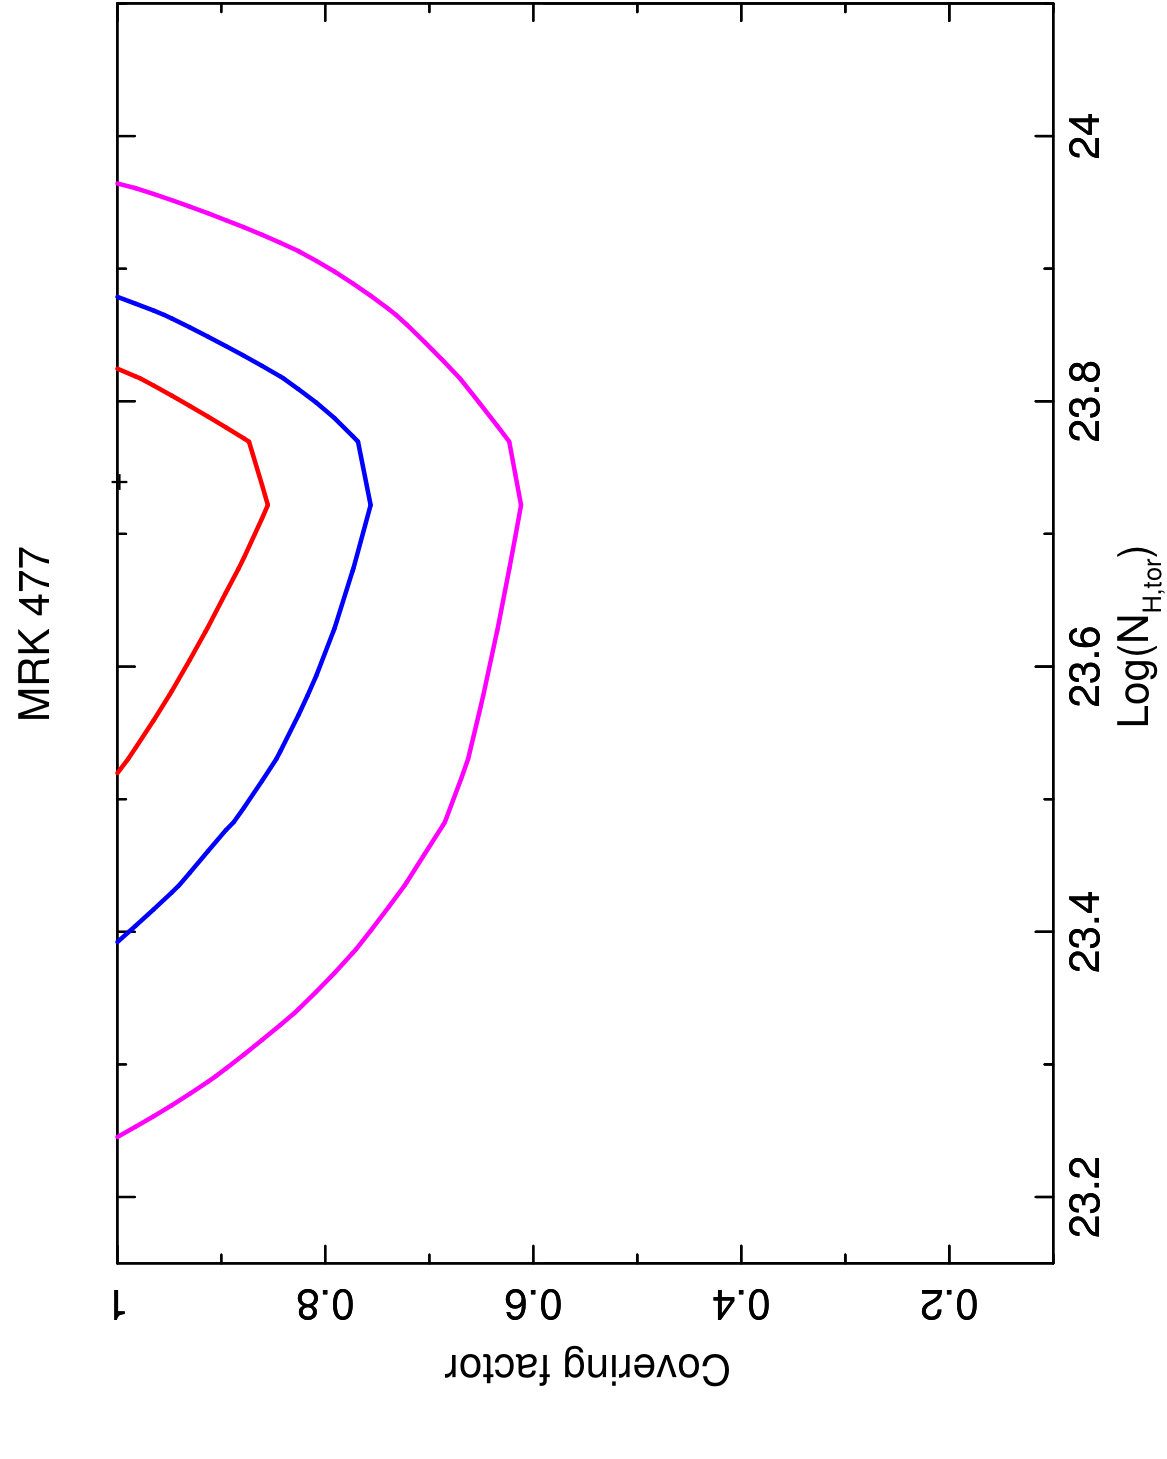 Figure 17
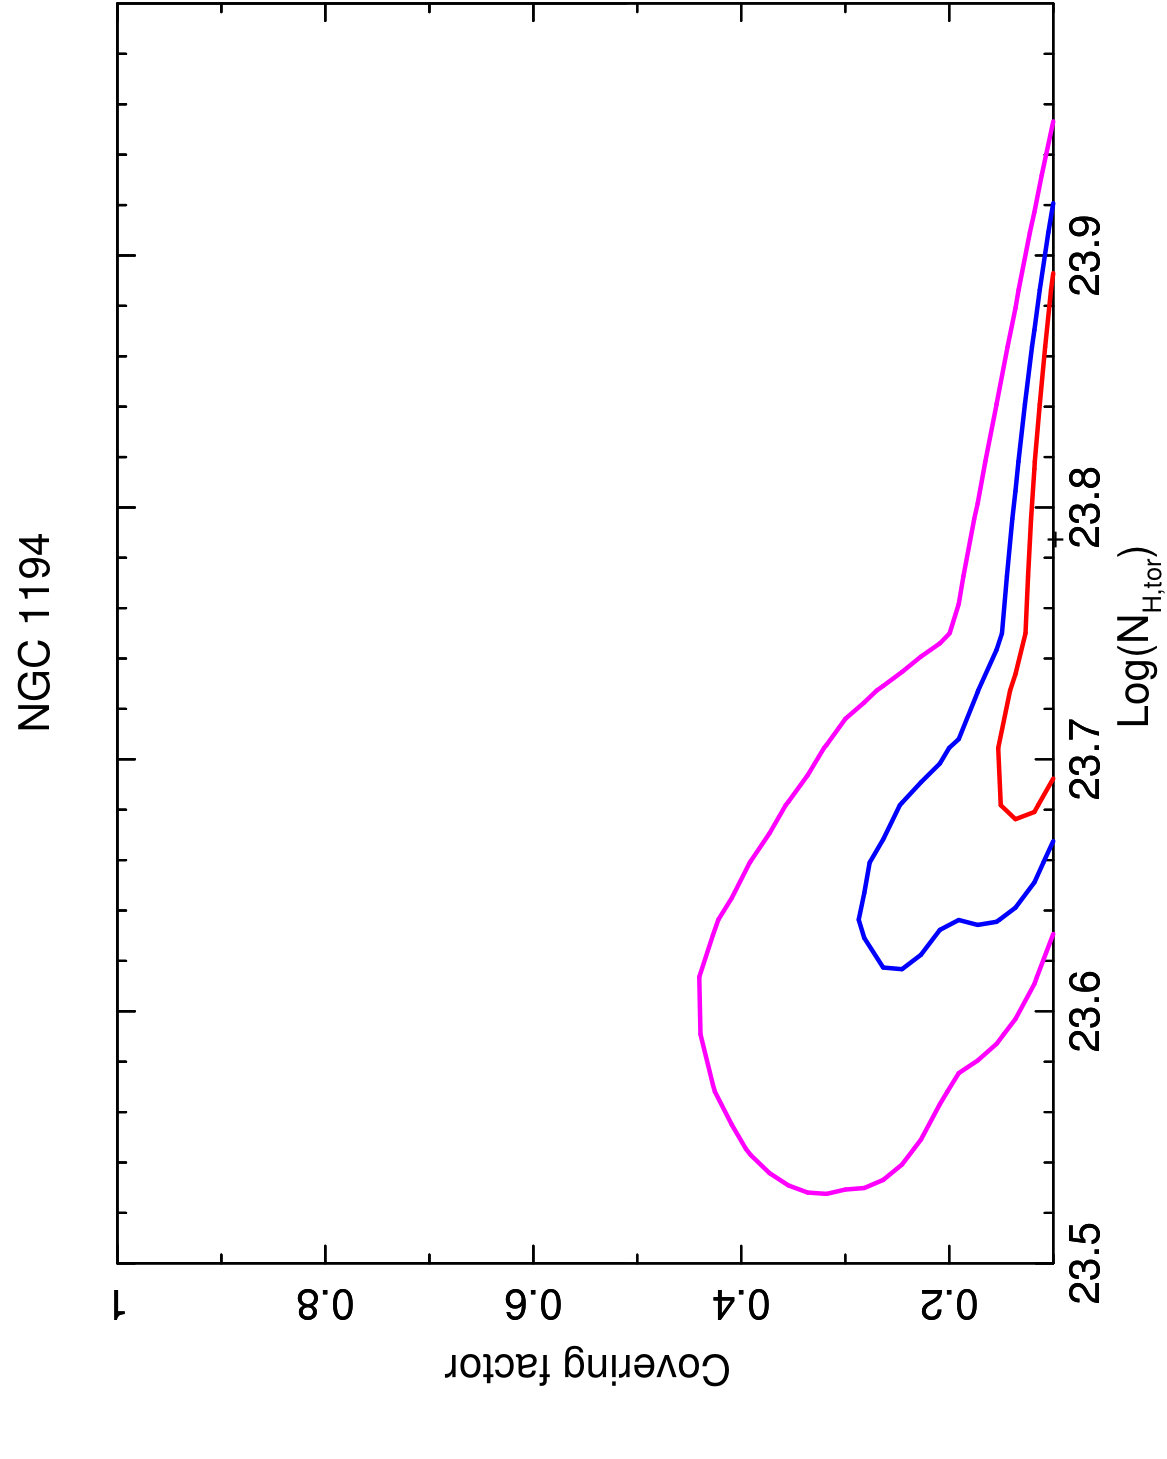 Figure 18
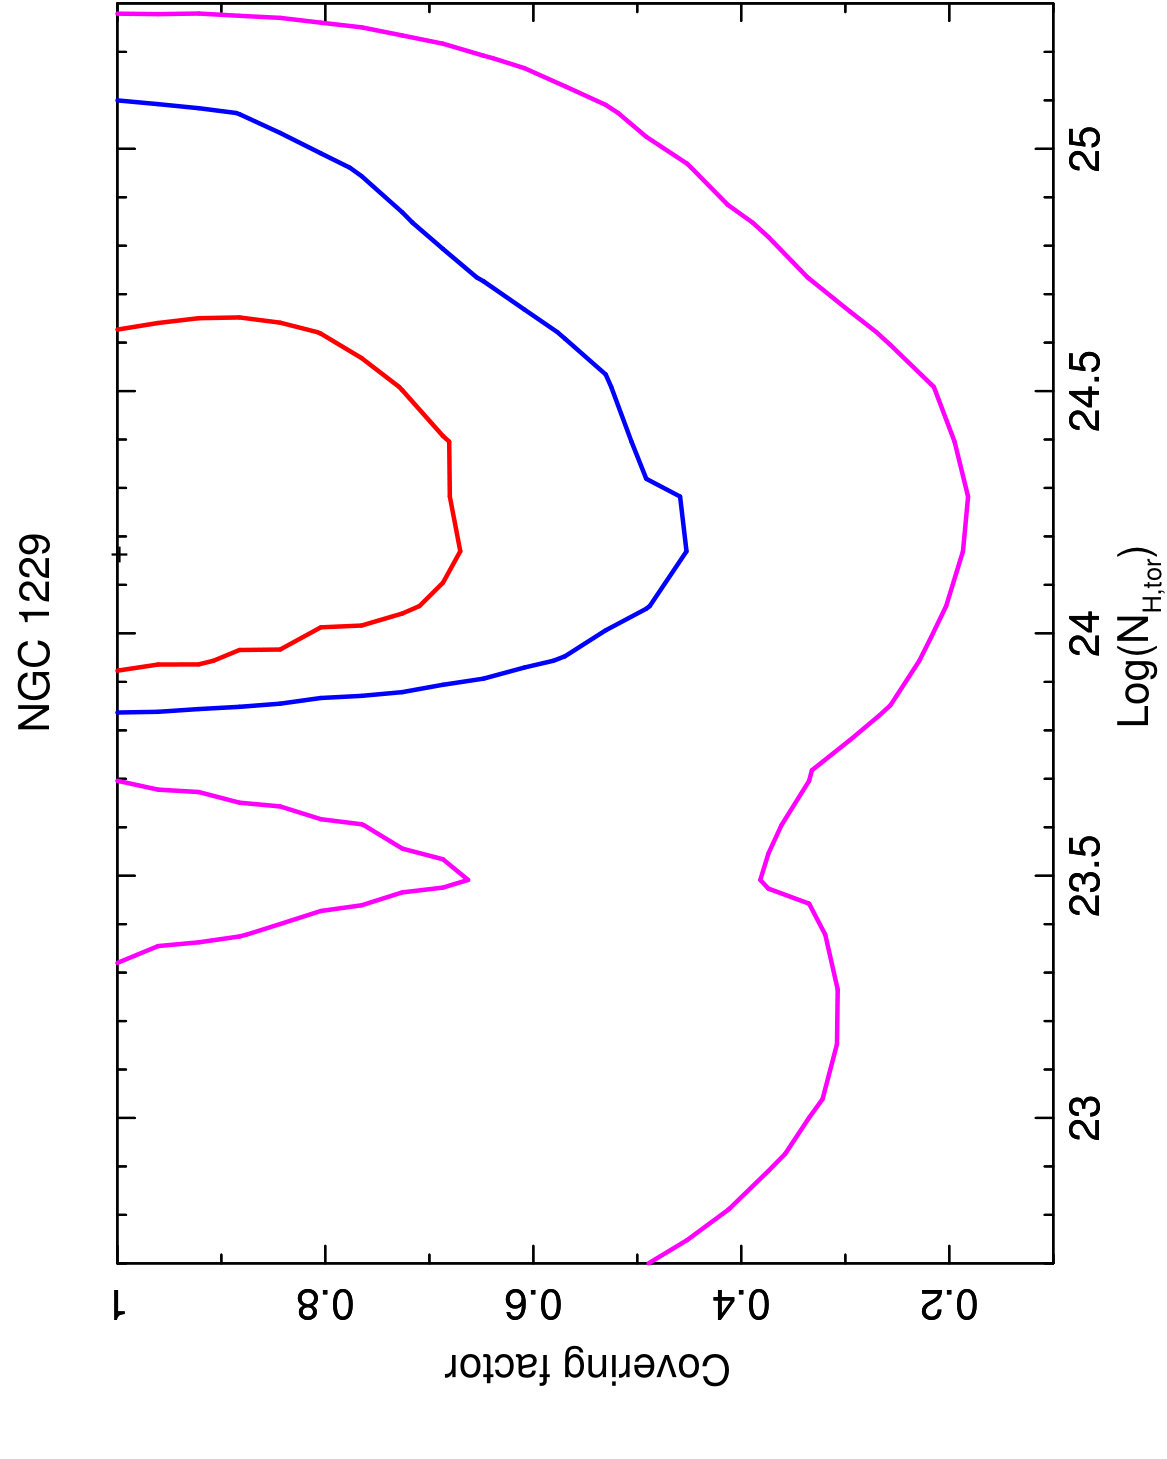 Figure 19
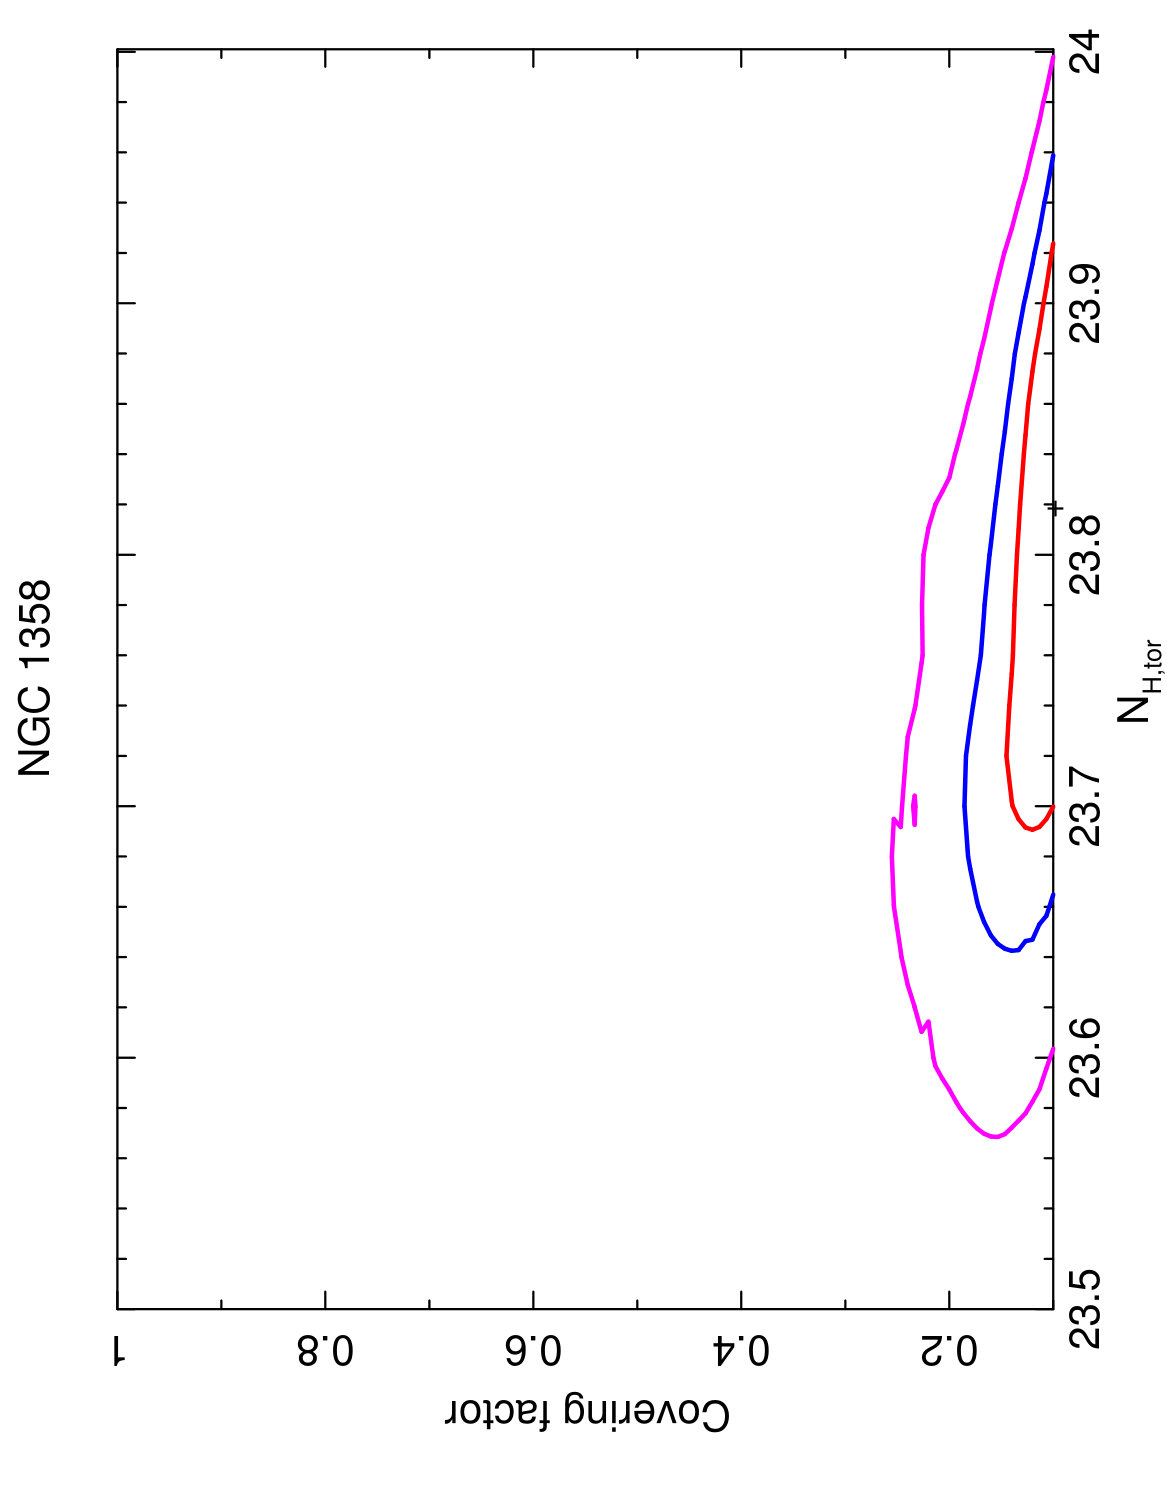 Figure 20
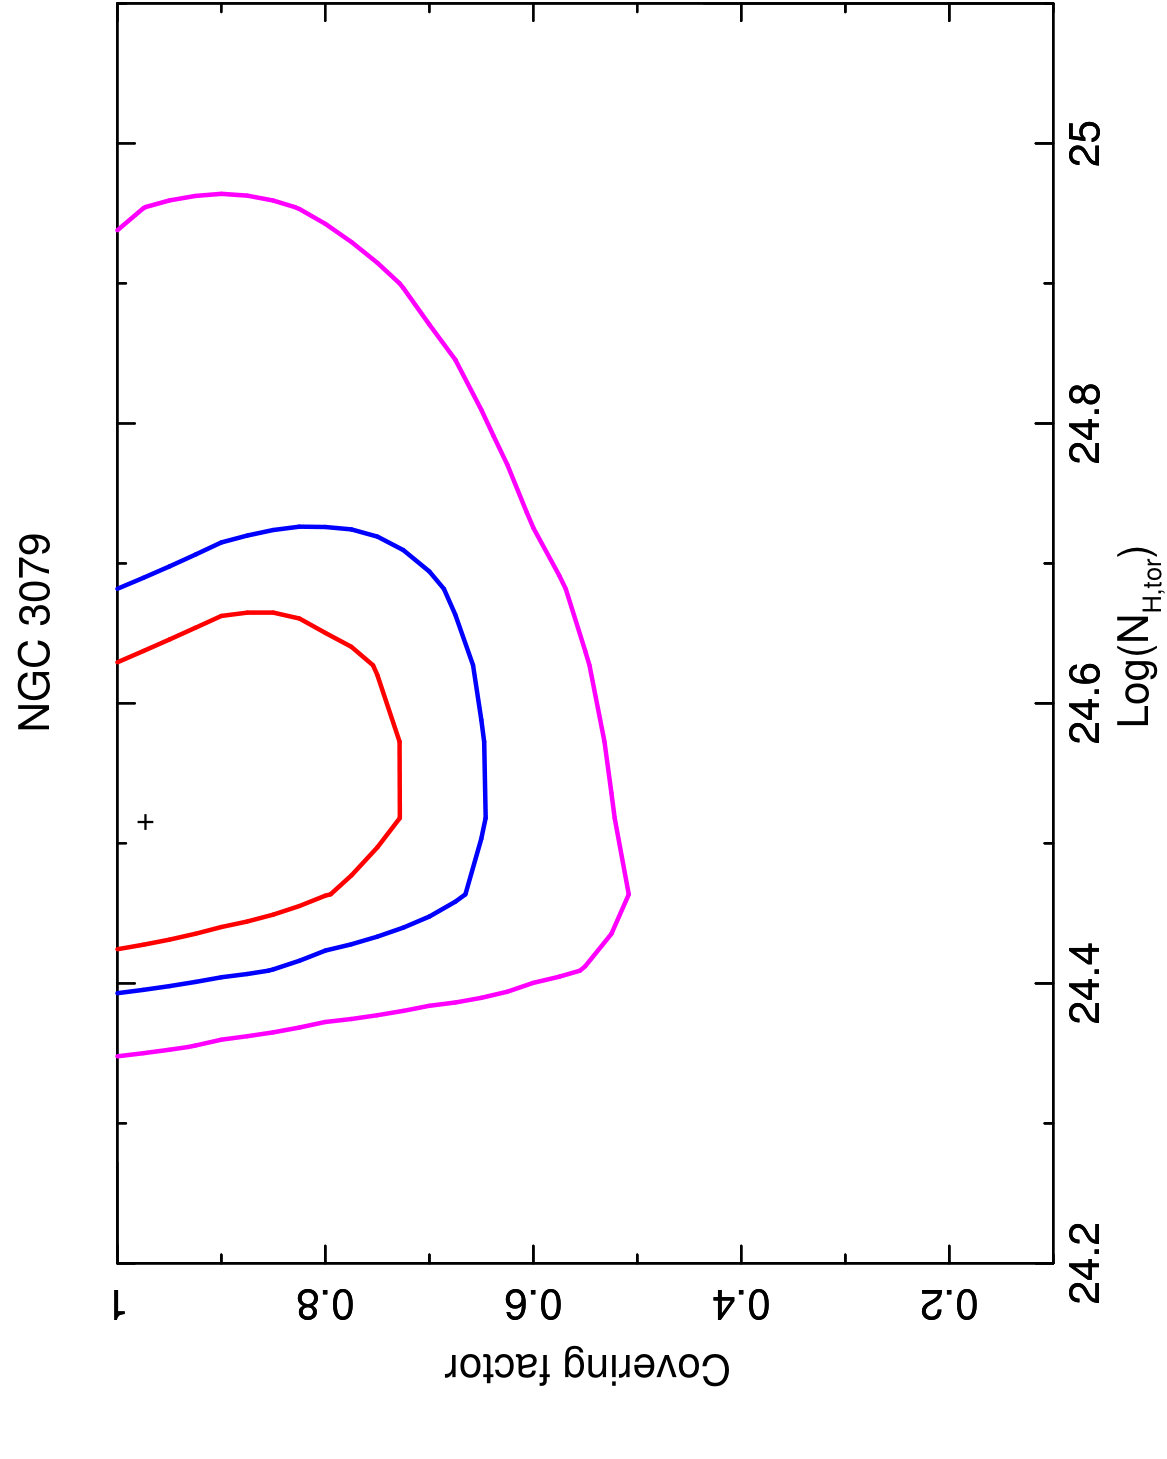 Figure 21
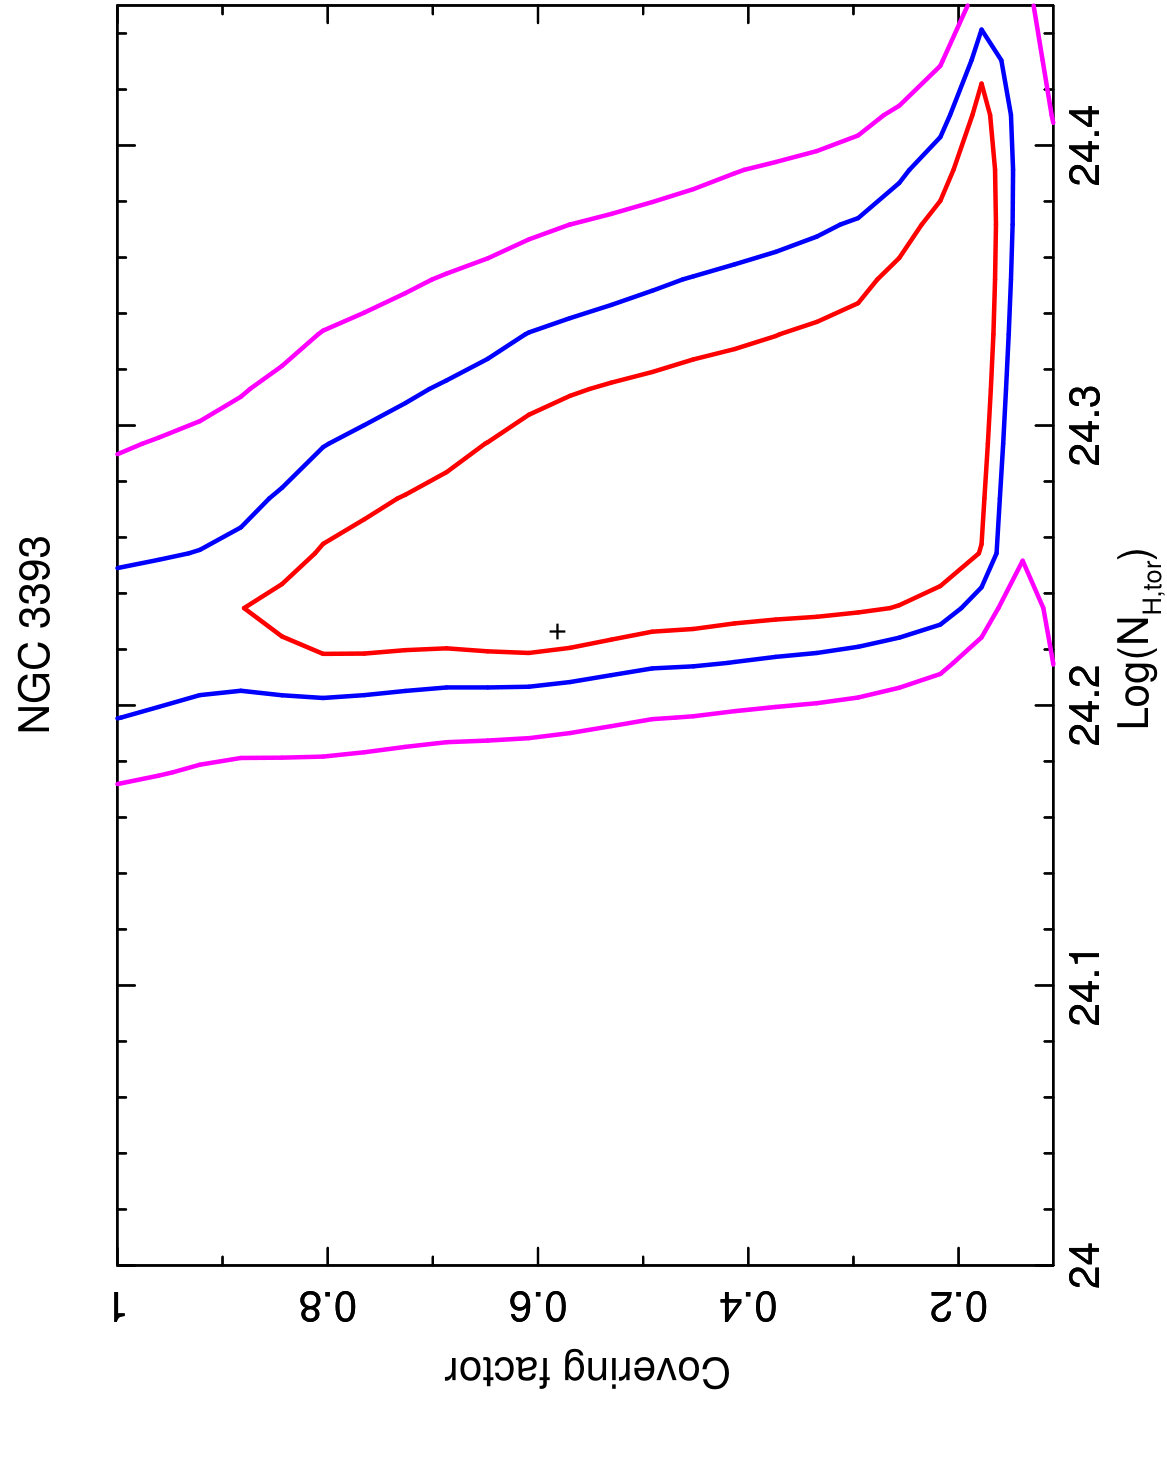 Figure 22
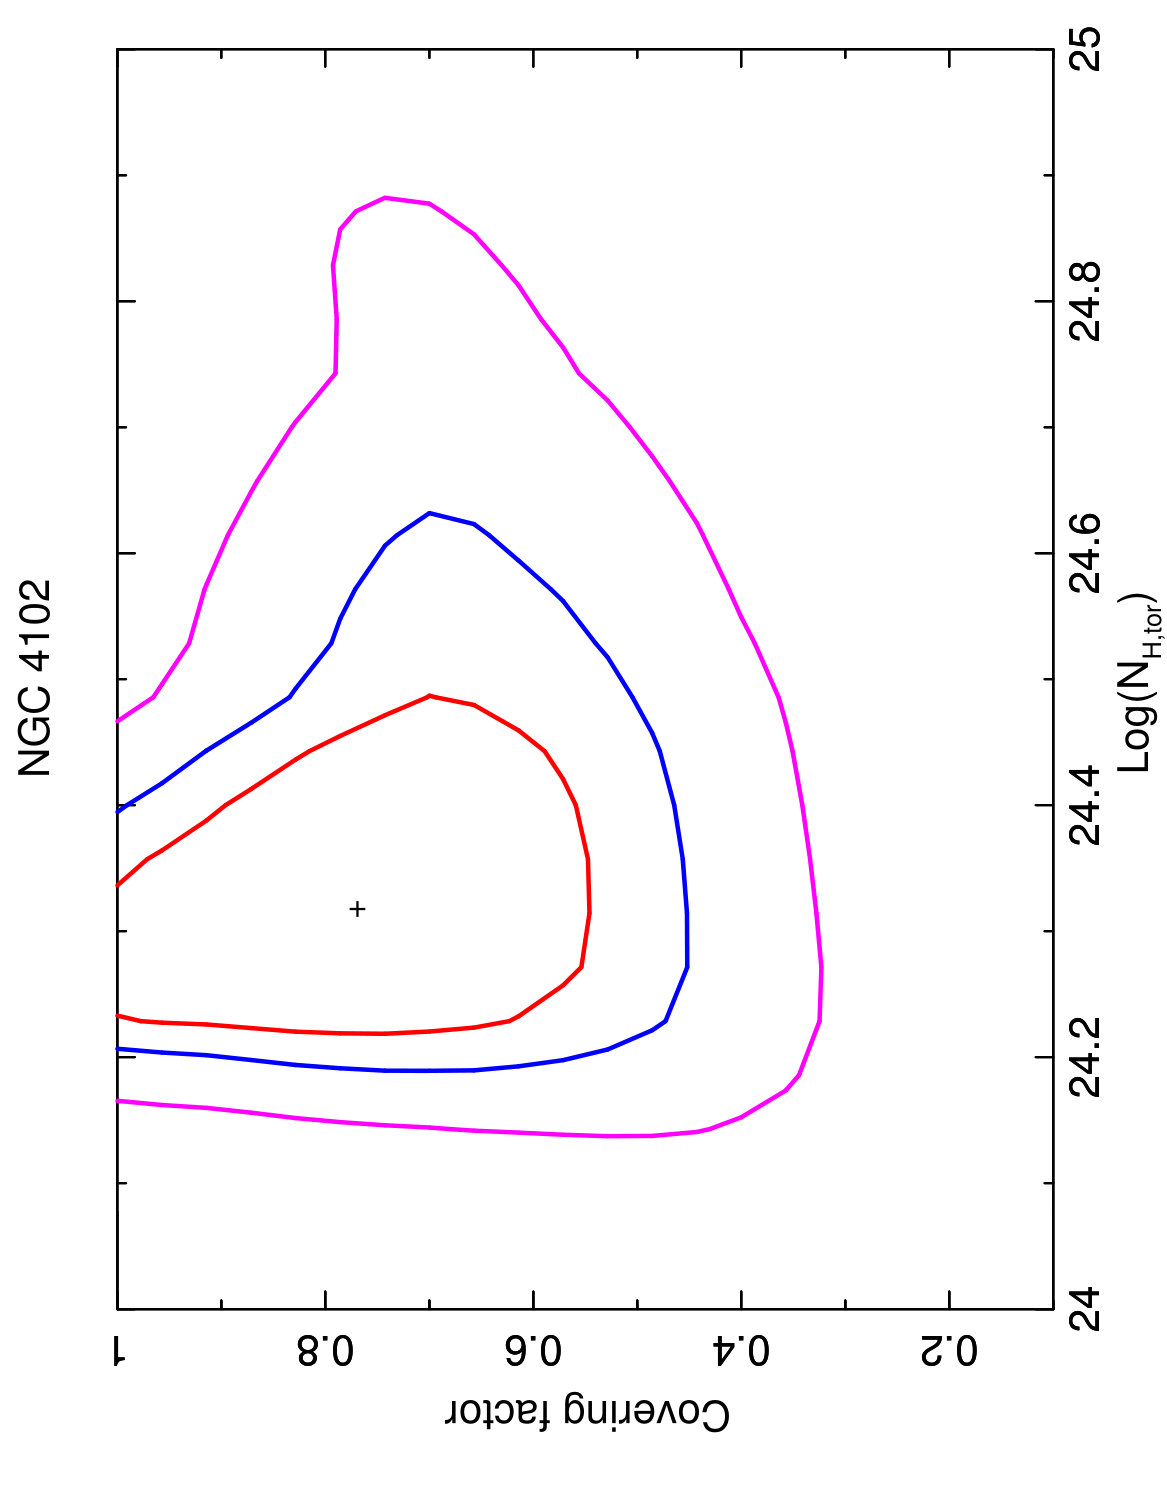 Figure 23
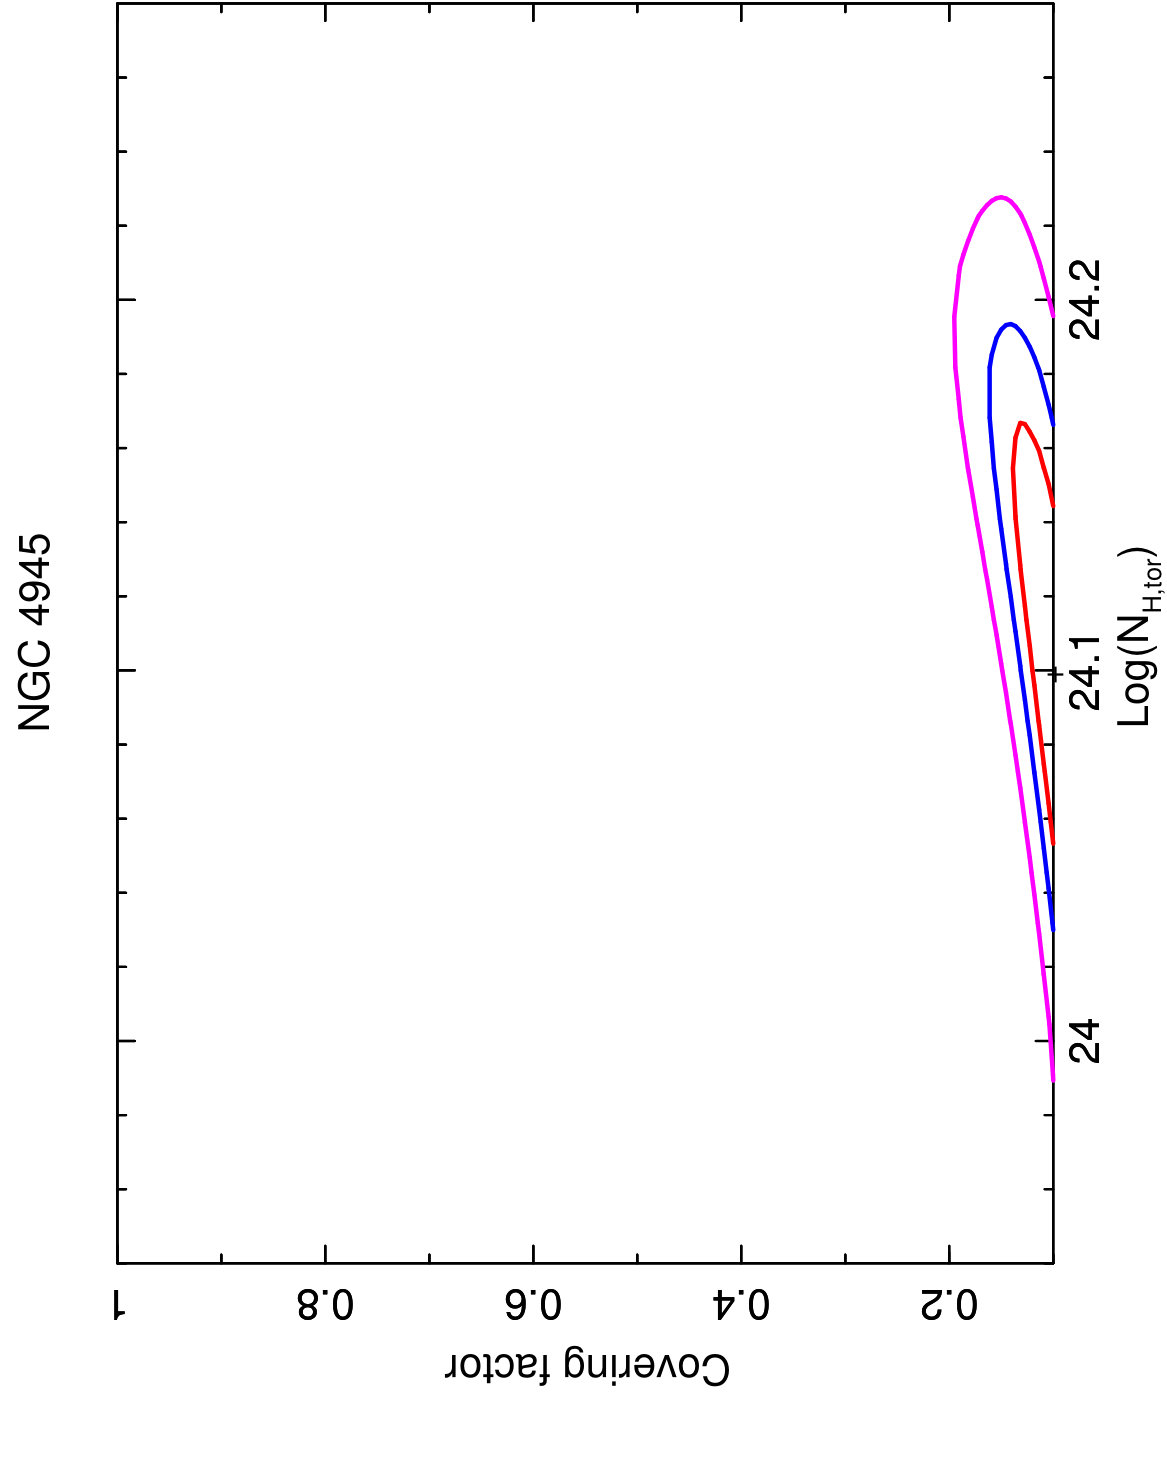 Figure 24
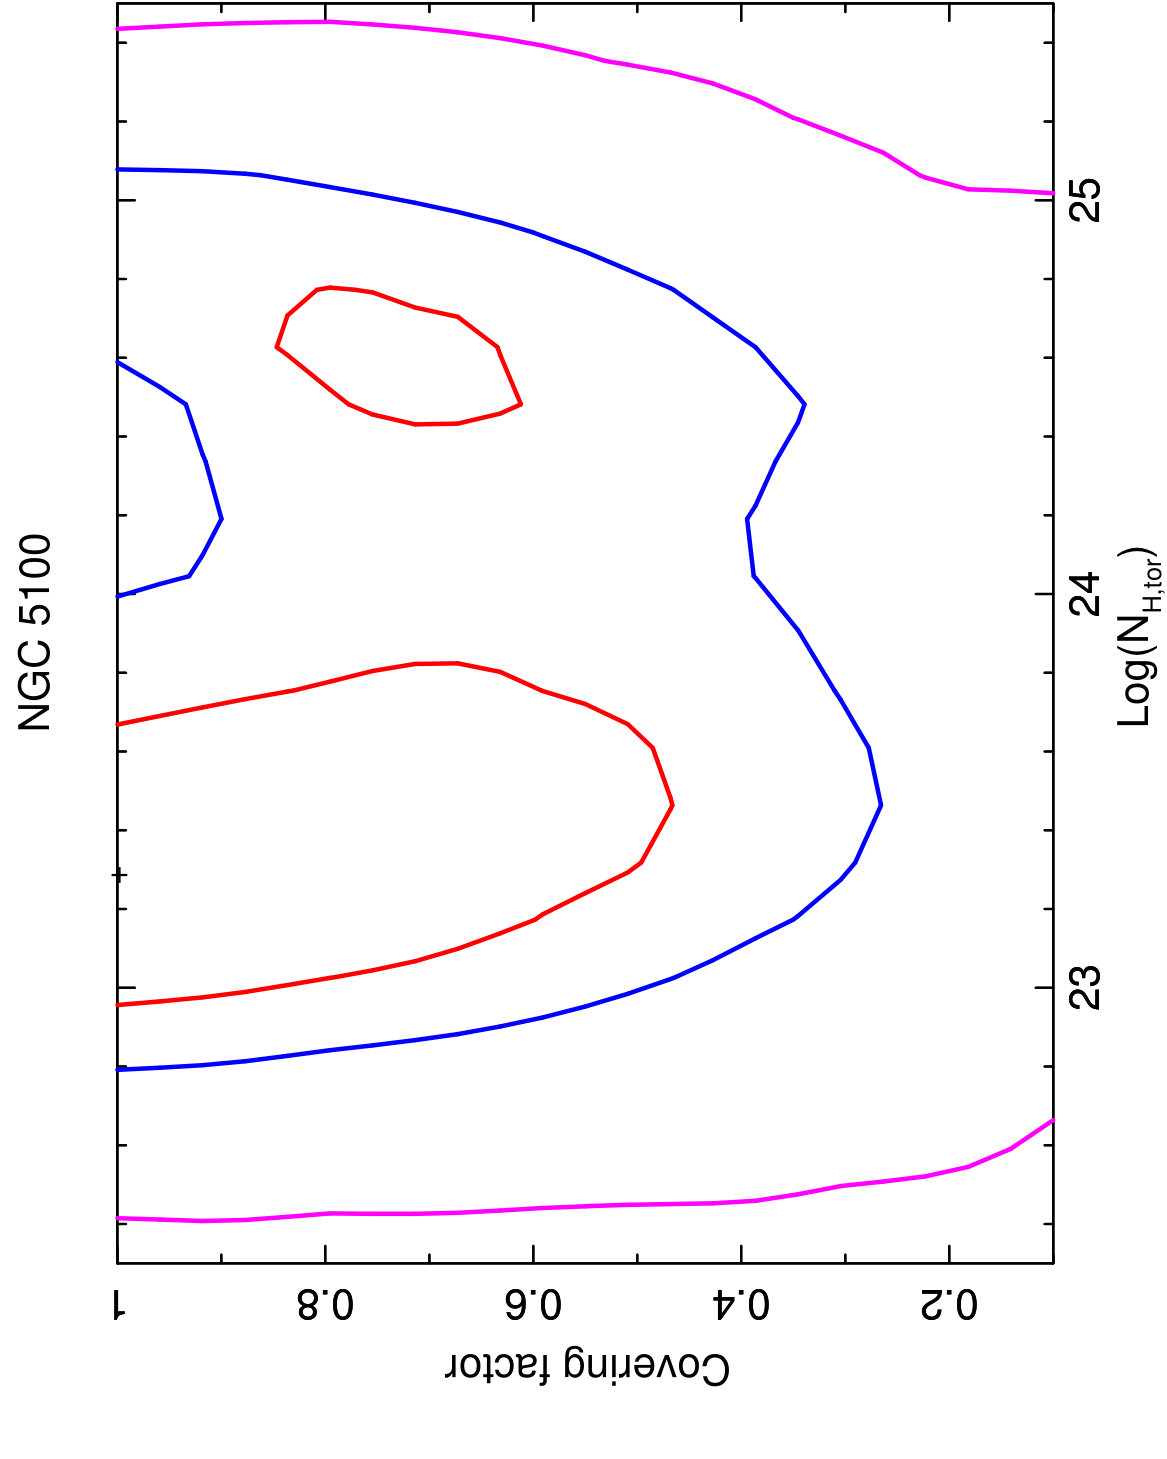 Figure 25
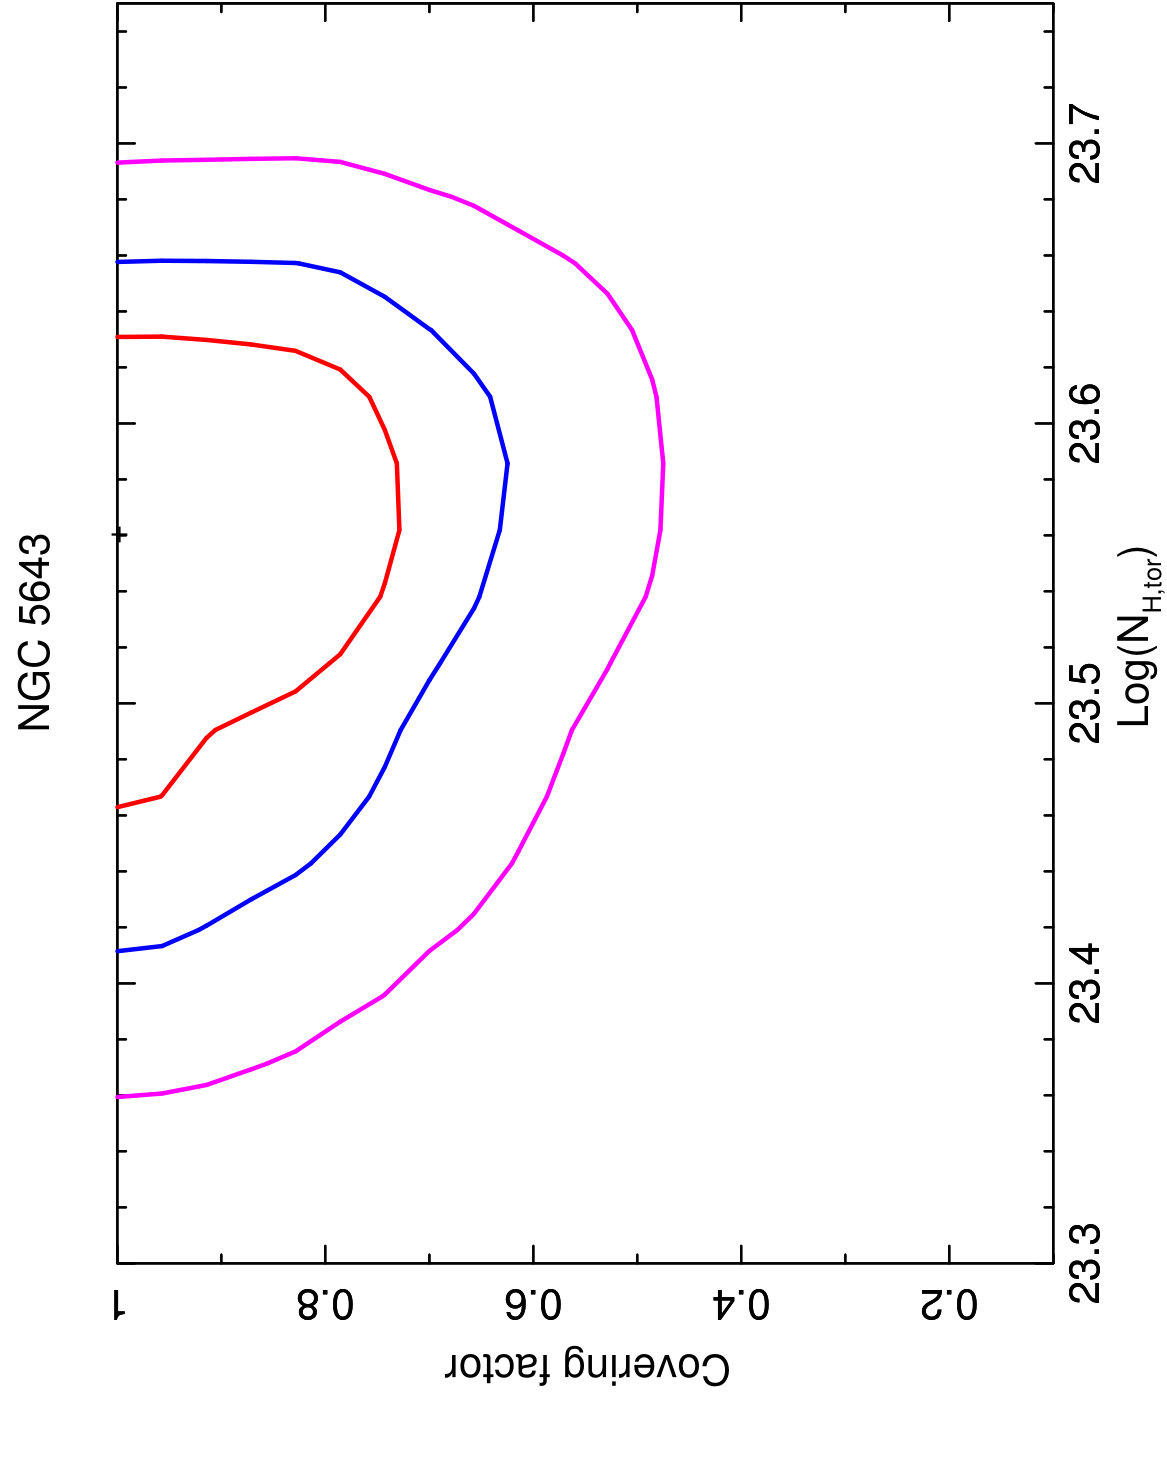 Figure 26
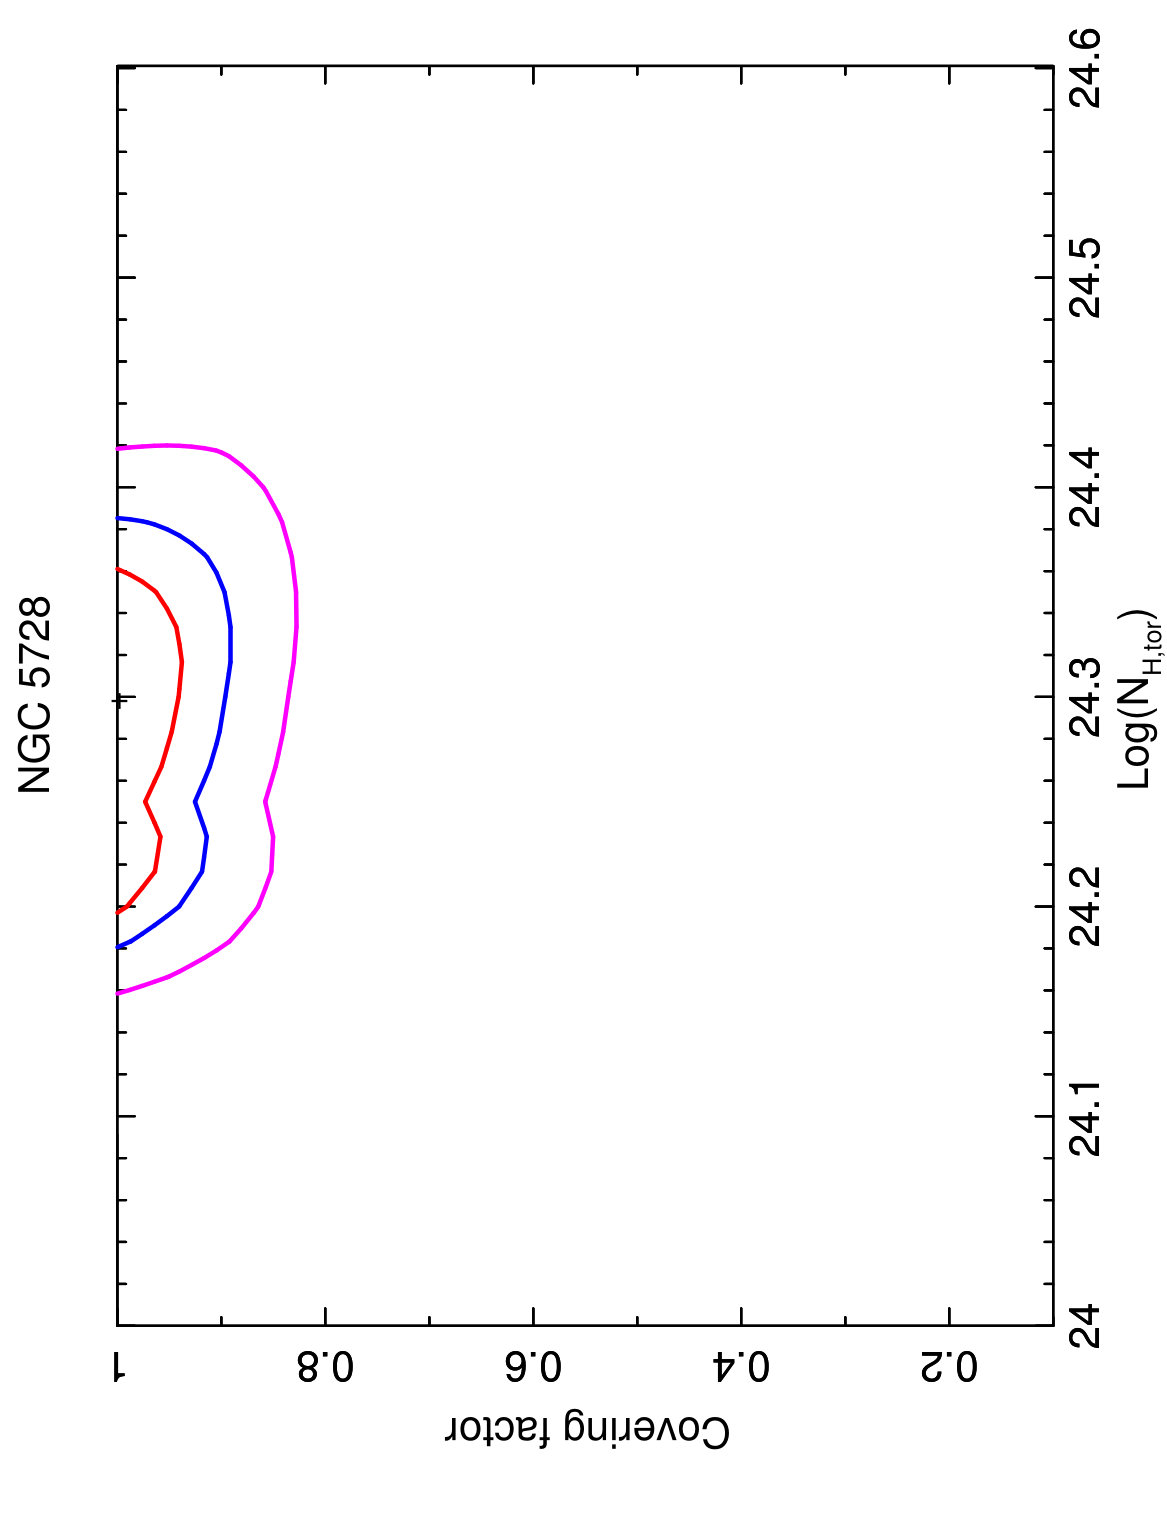 Figure 27
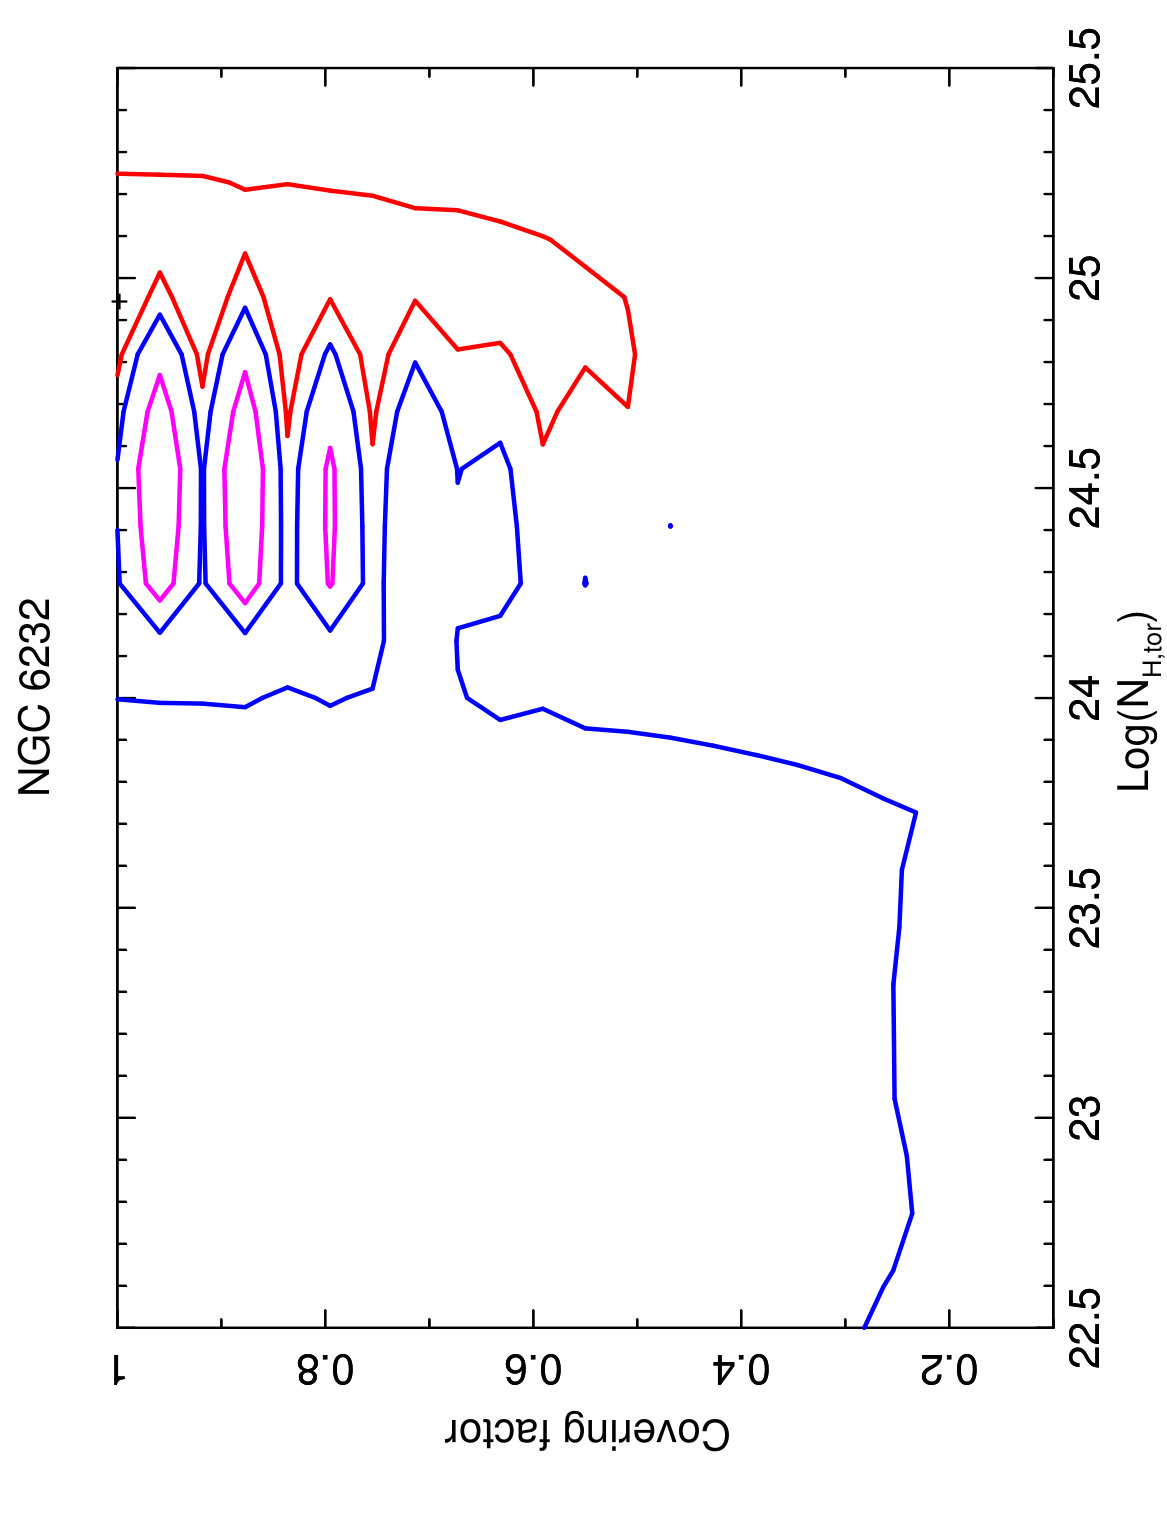 Figure 28
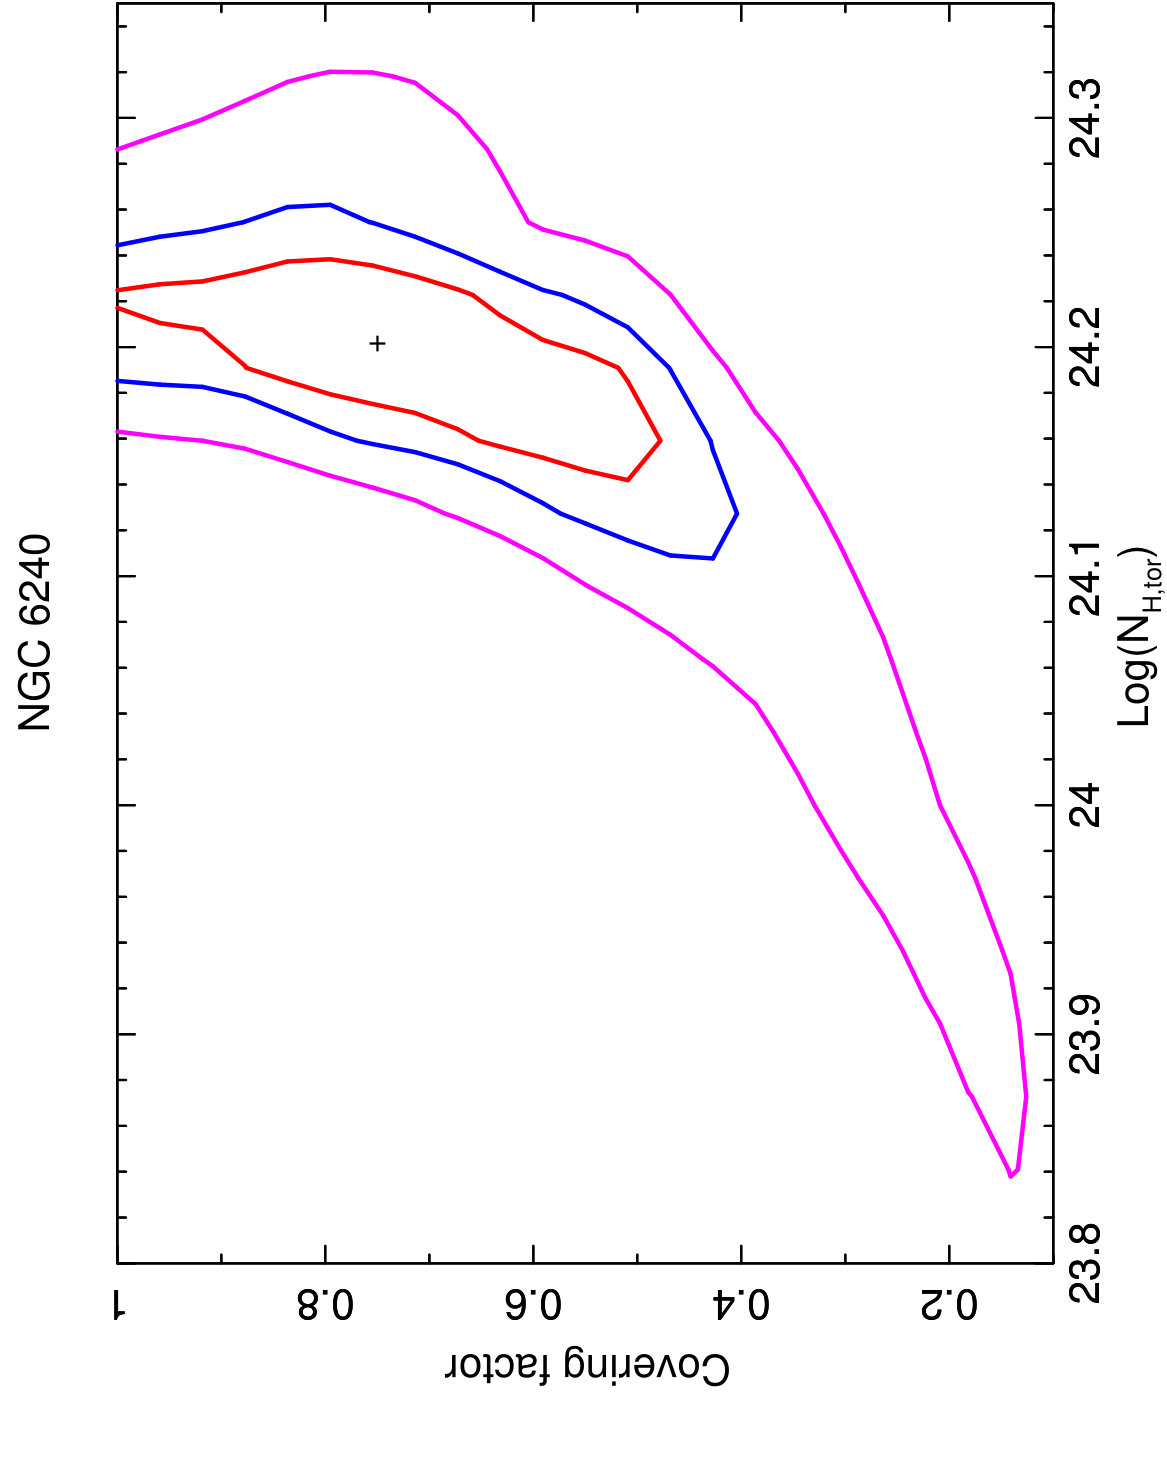 Figure 29
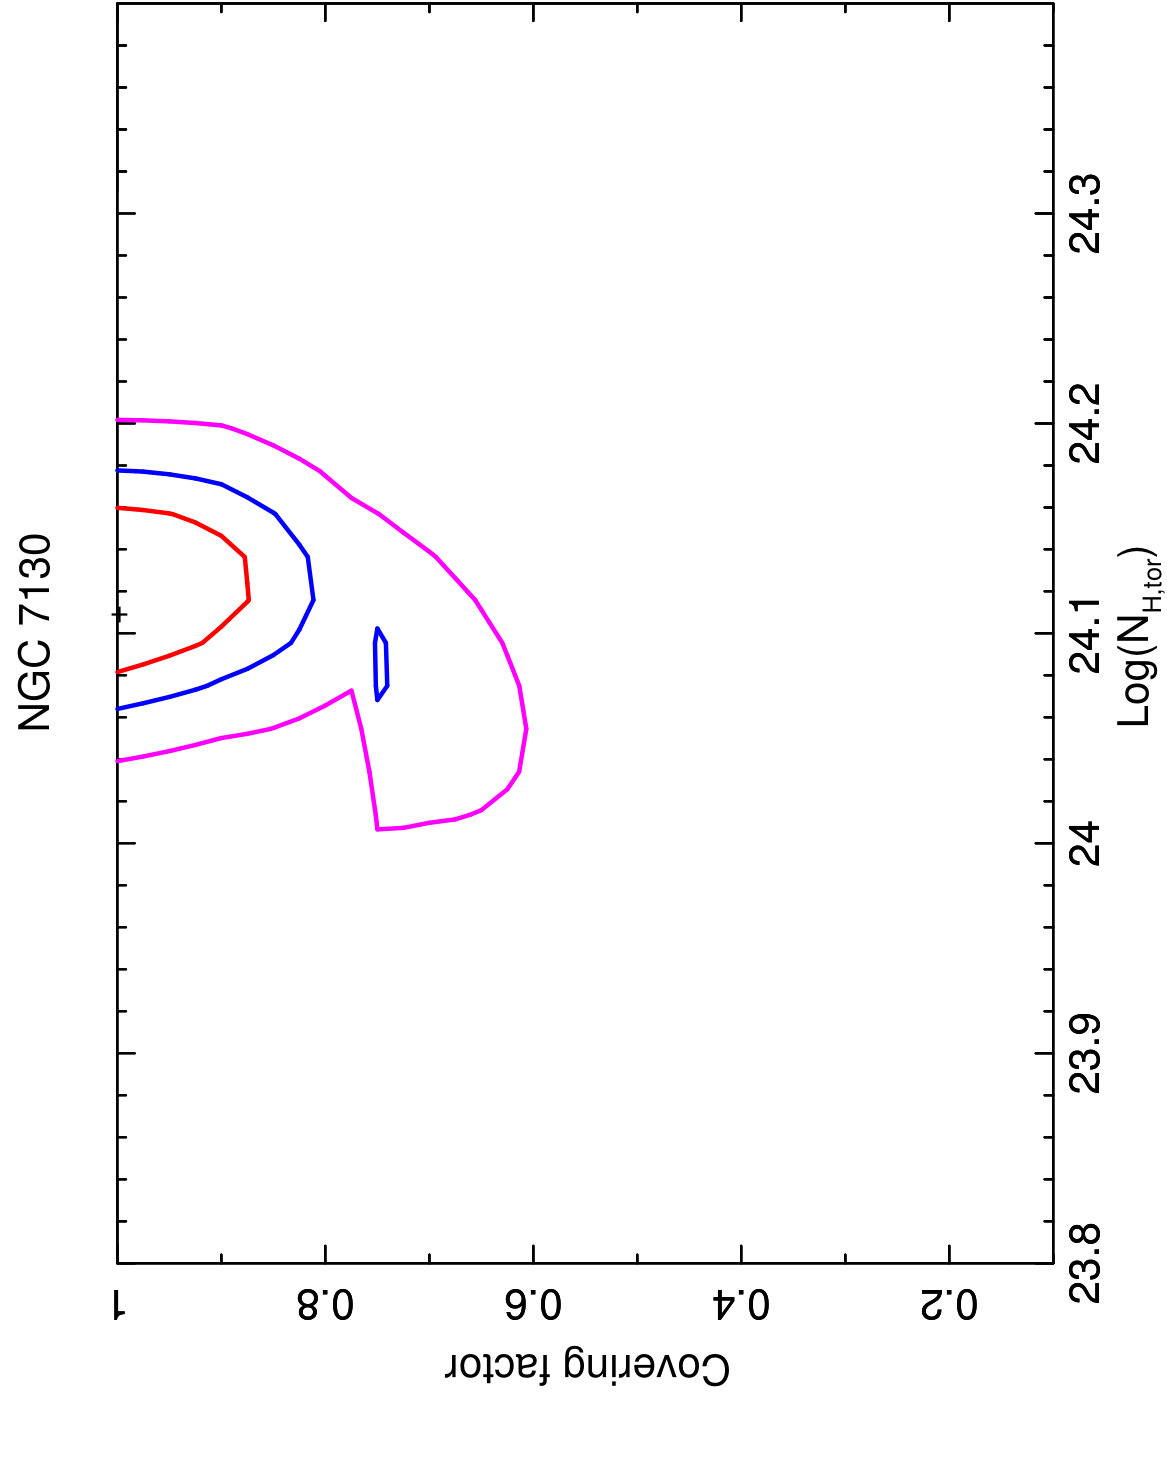 Figure 30
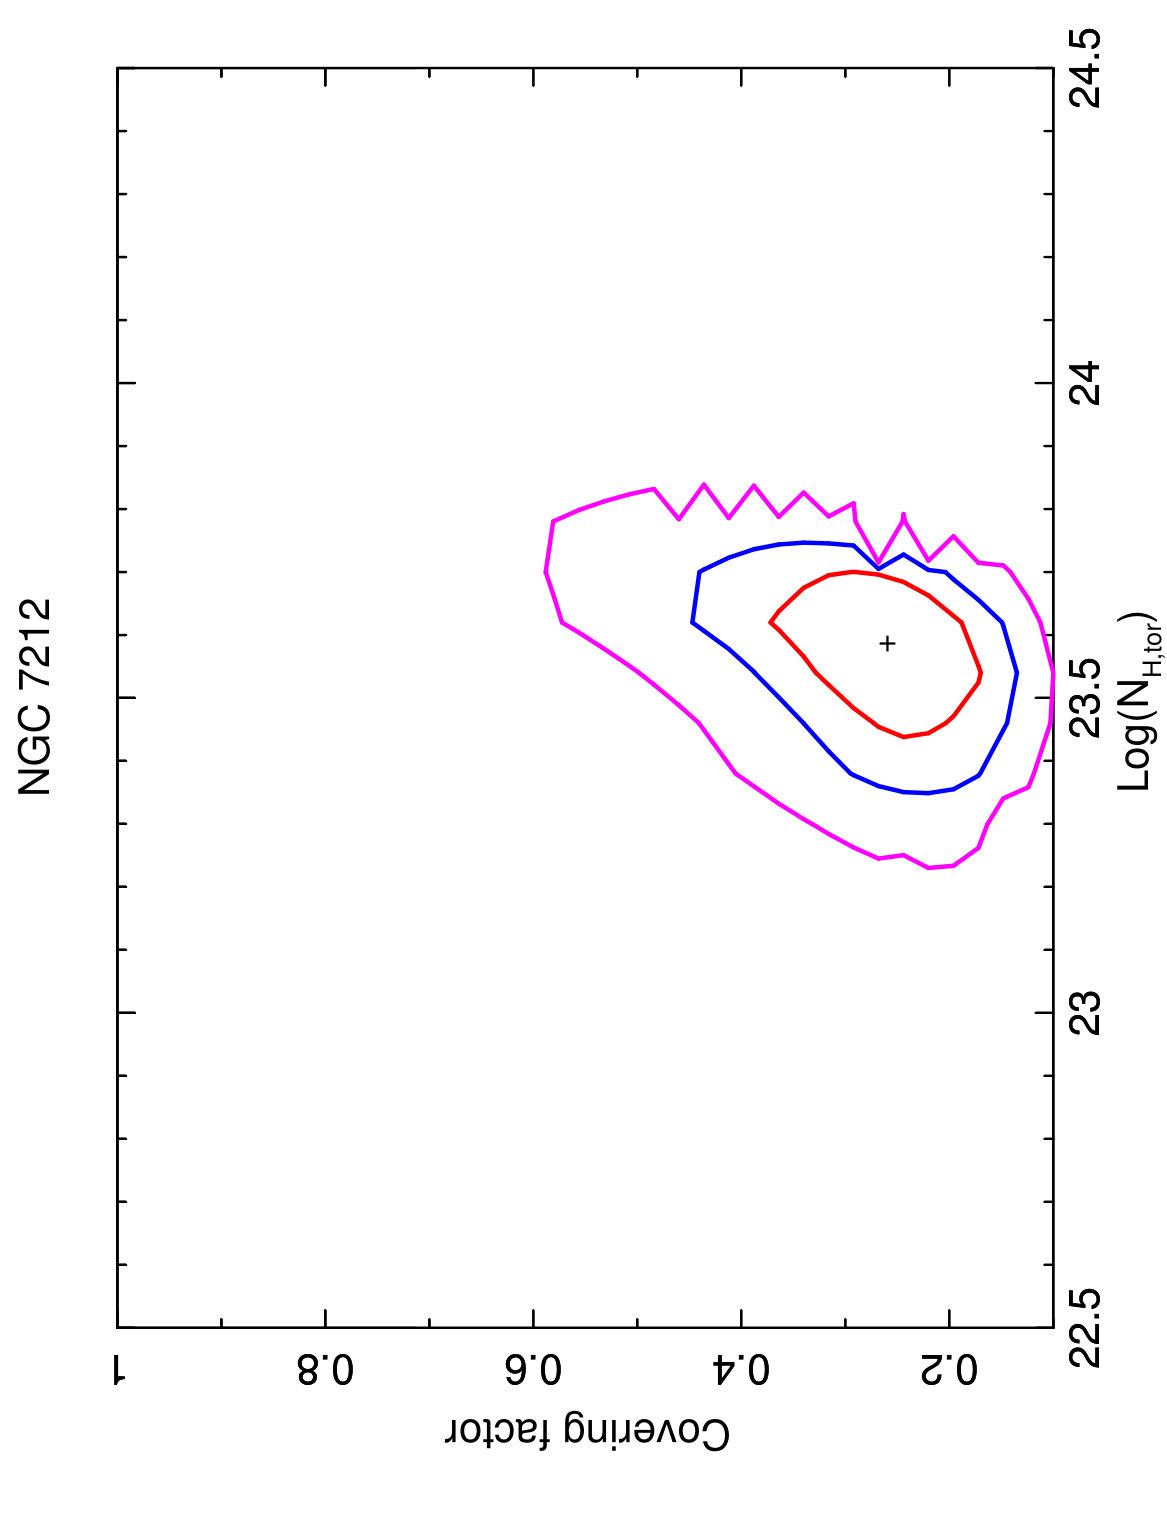 Figure 31
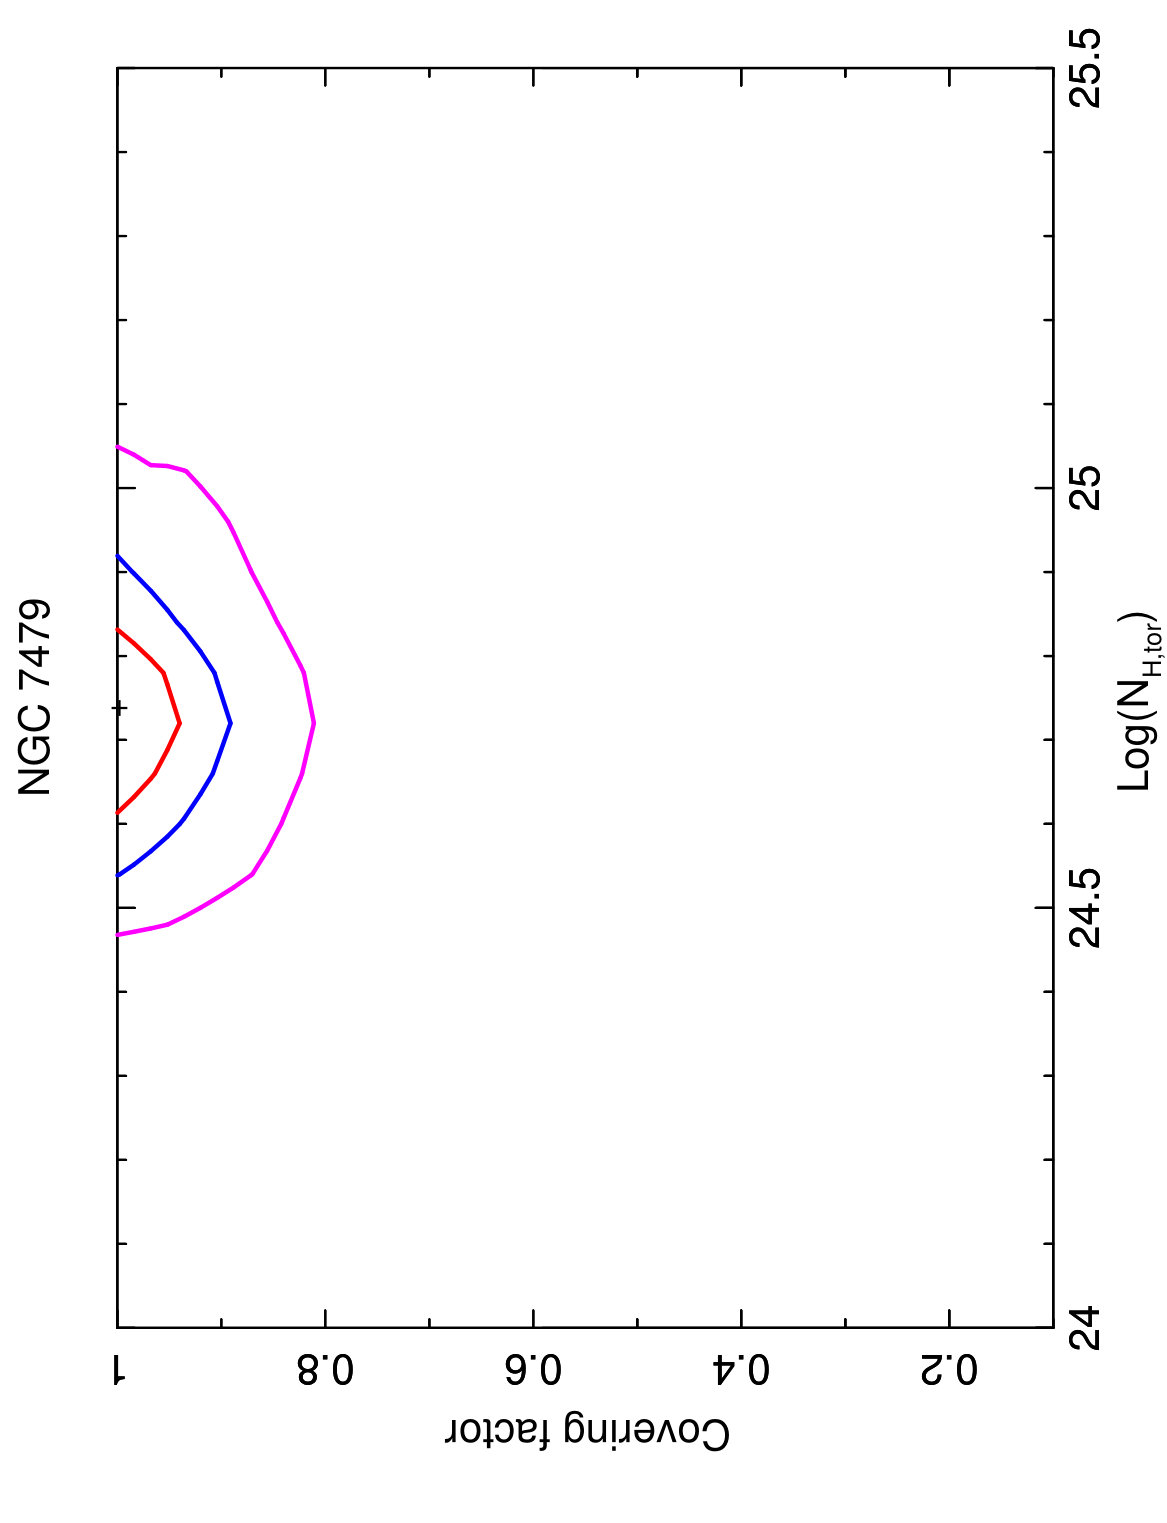 Figure 32
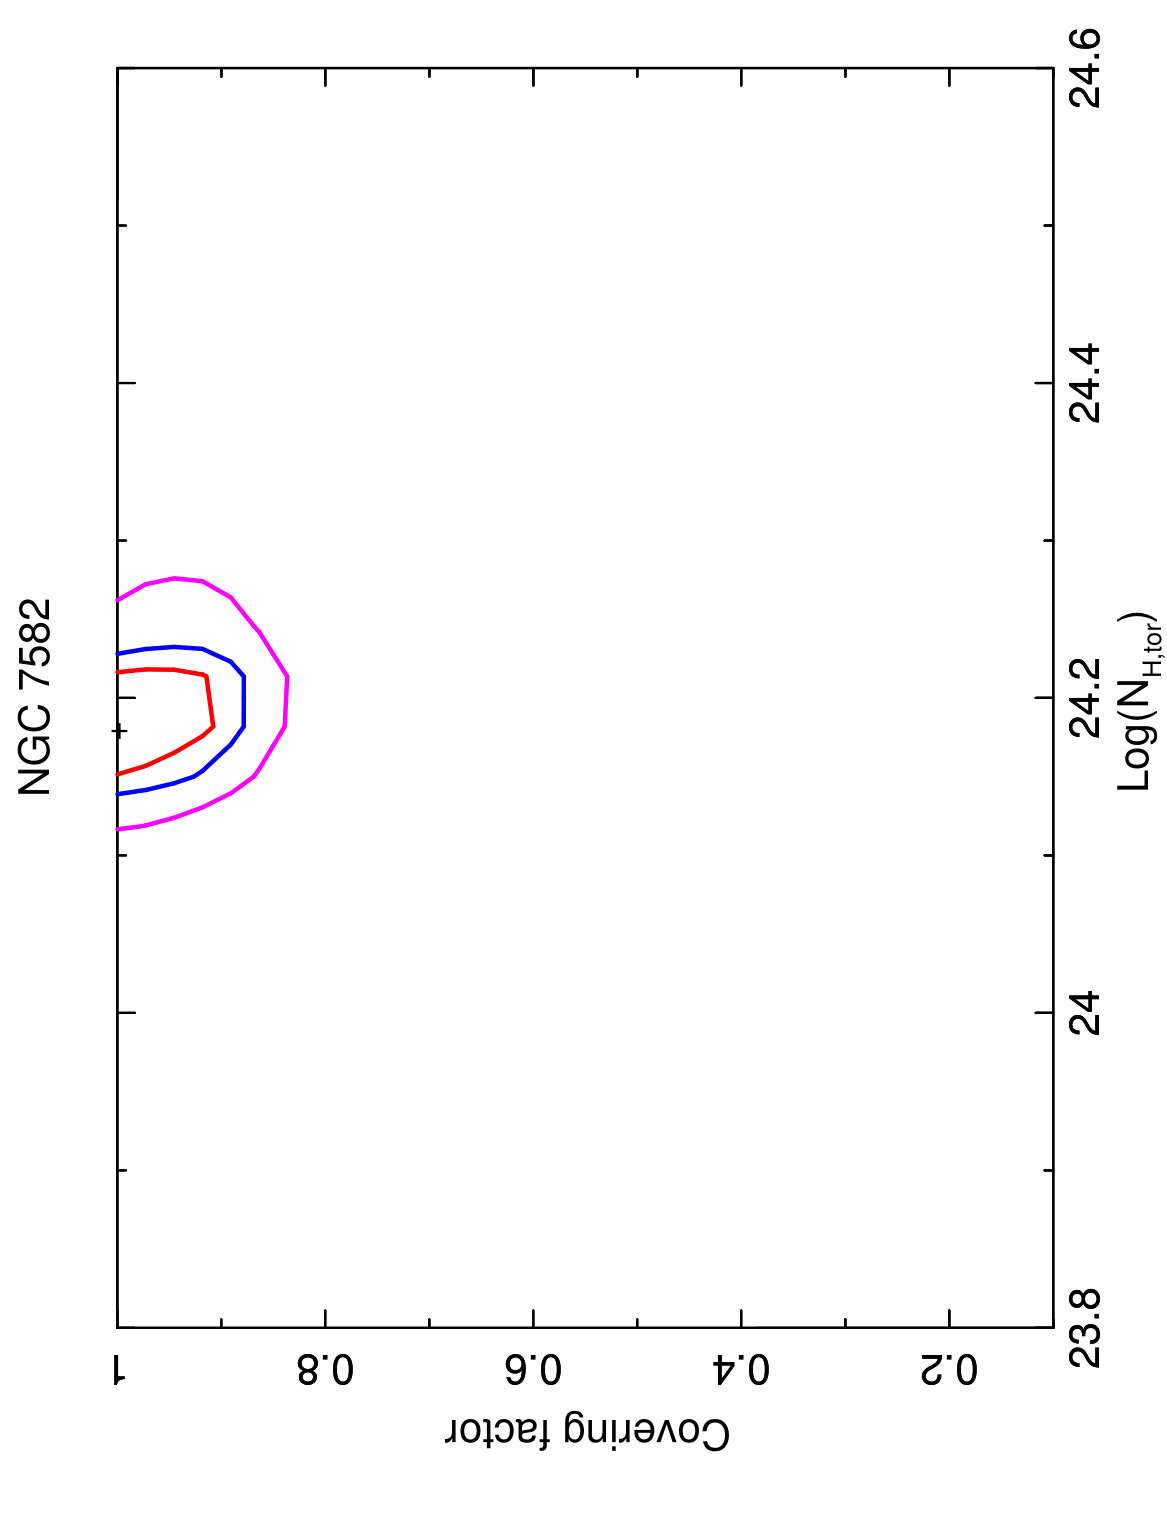 Figure 33
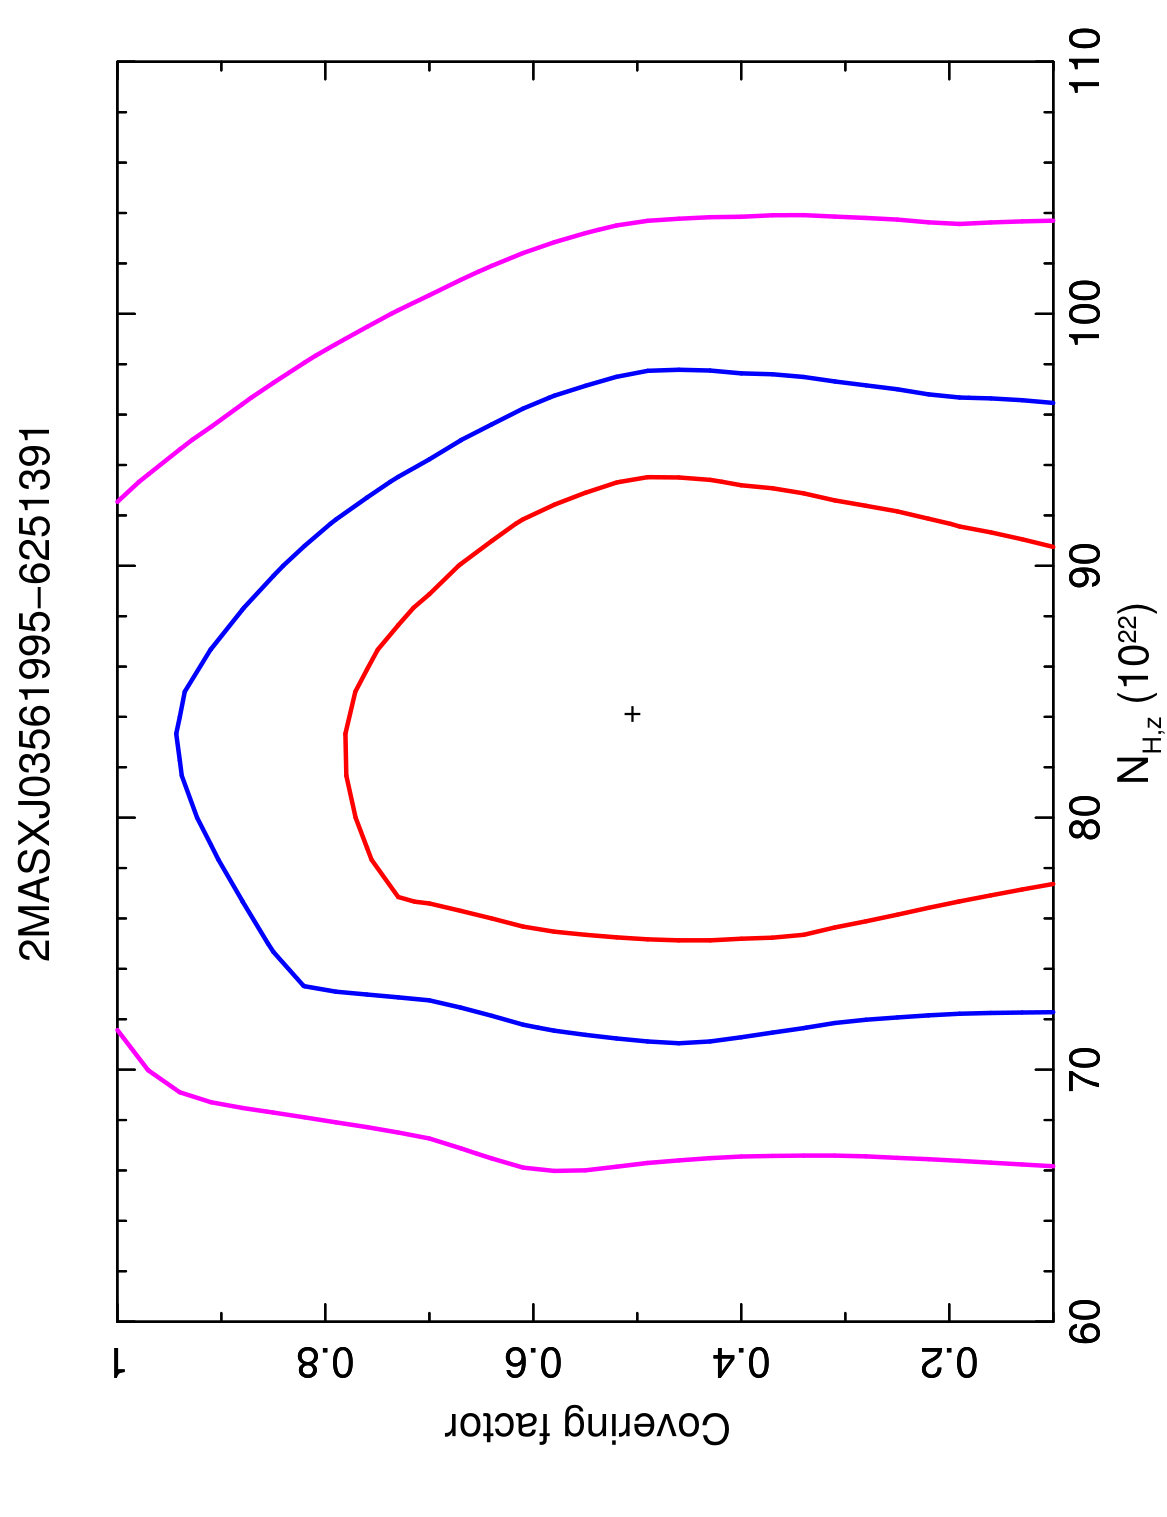 Figure 34
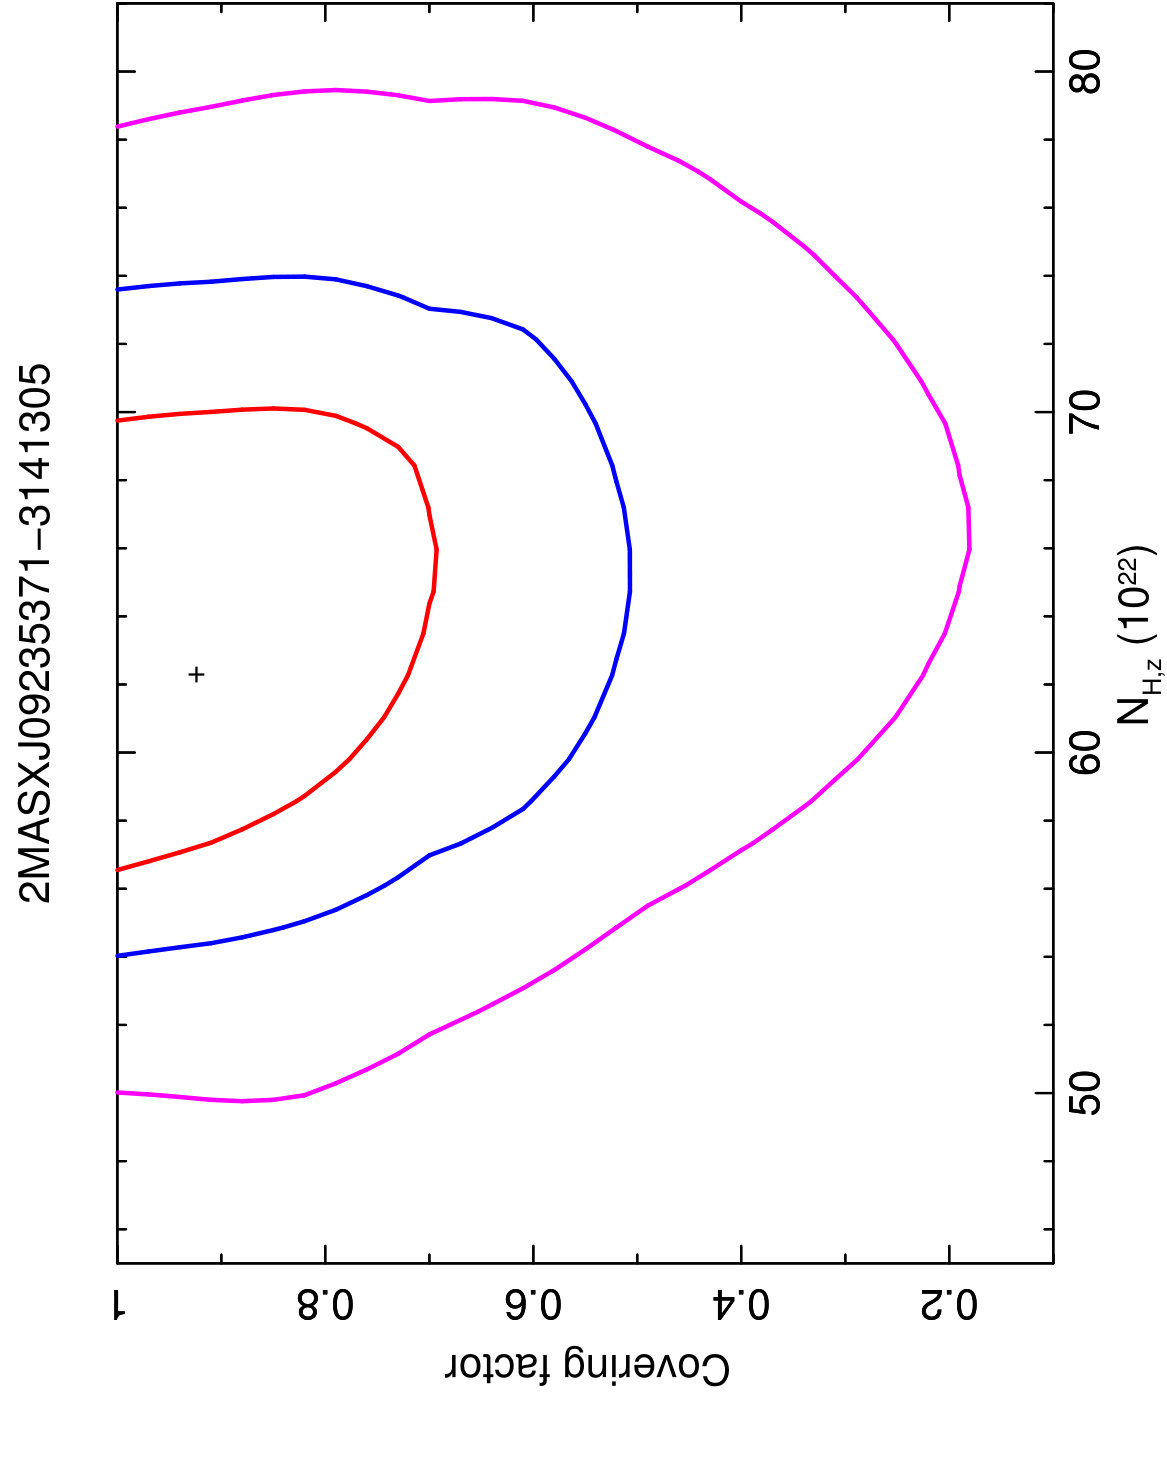 Figure 35
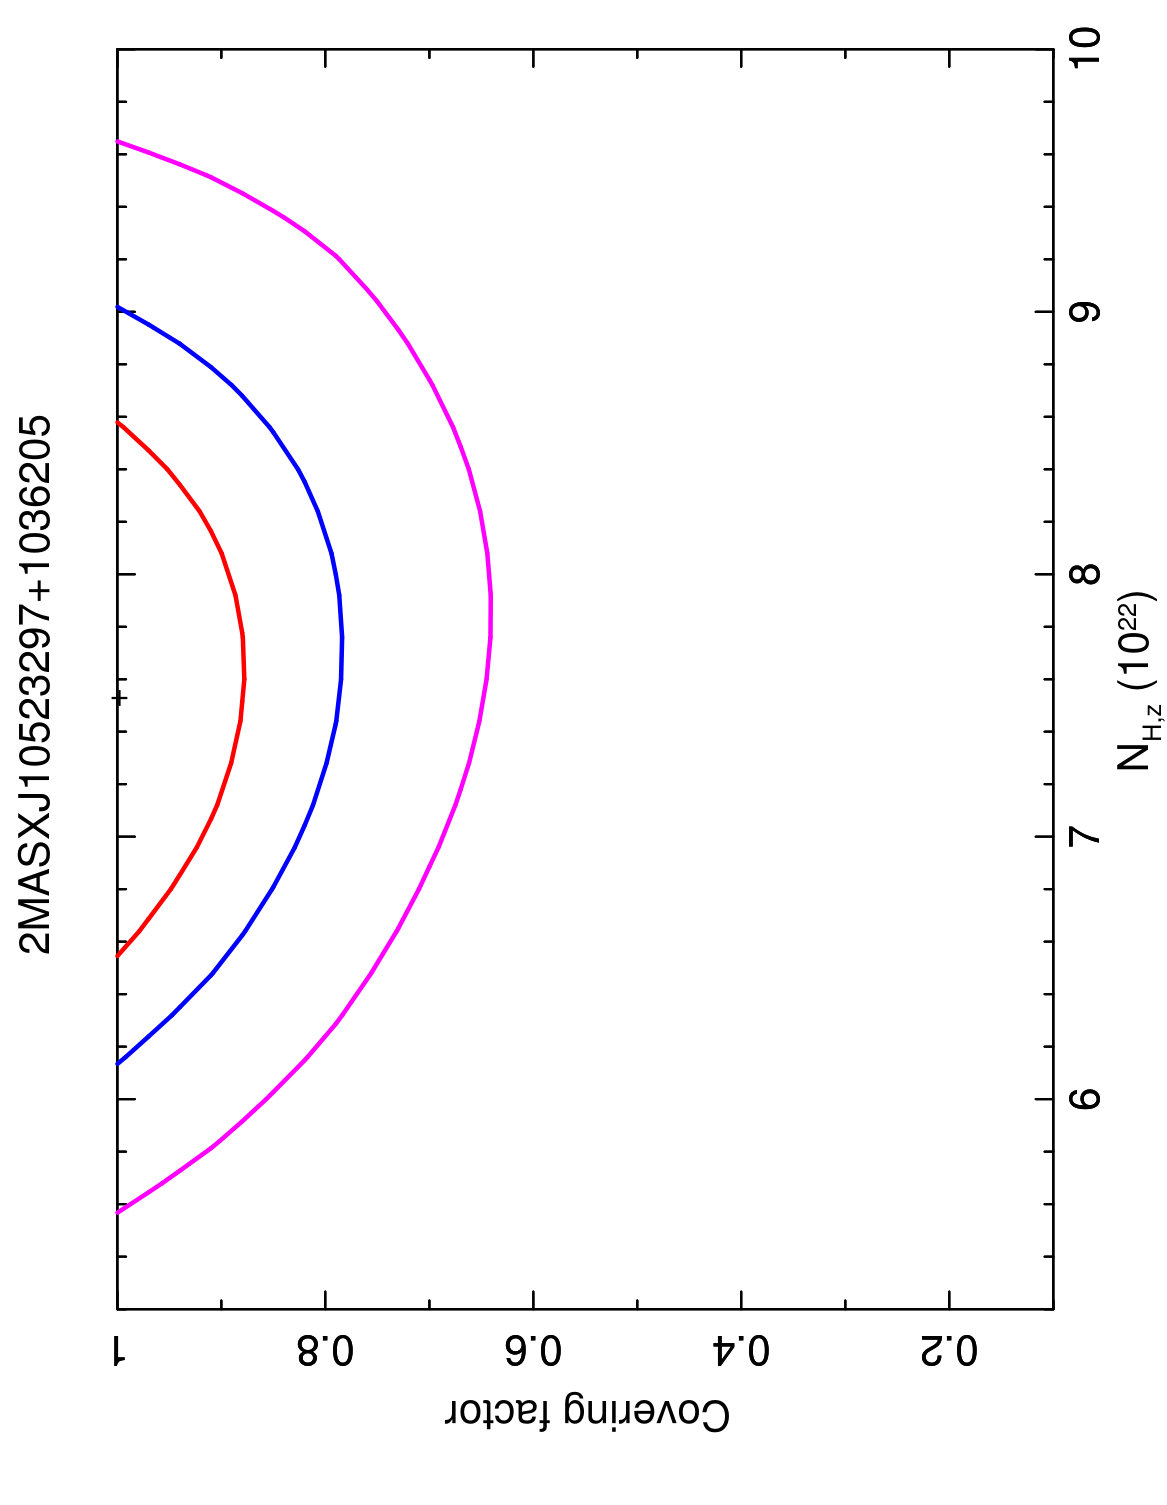 Figure 36
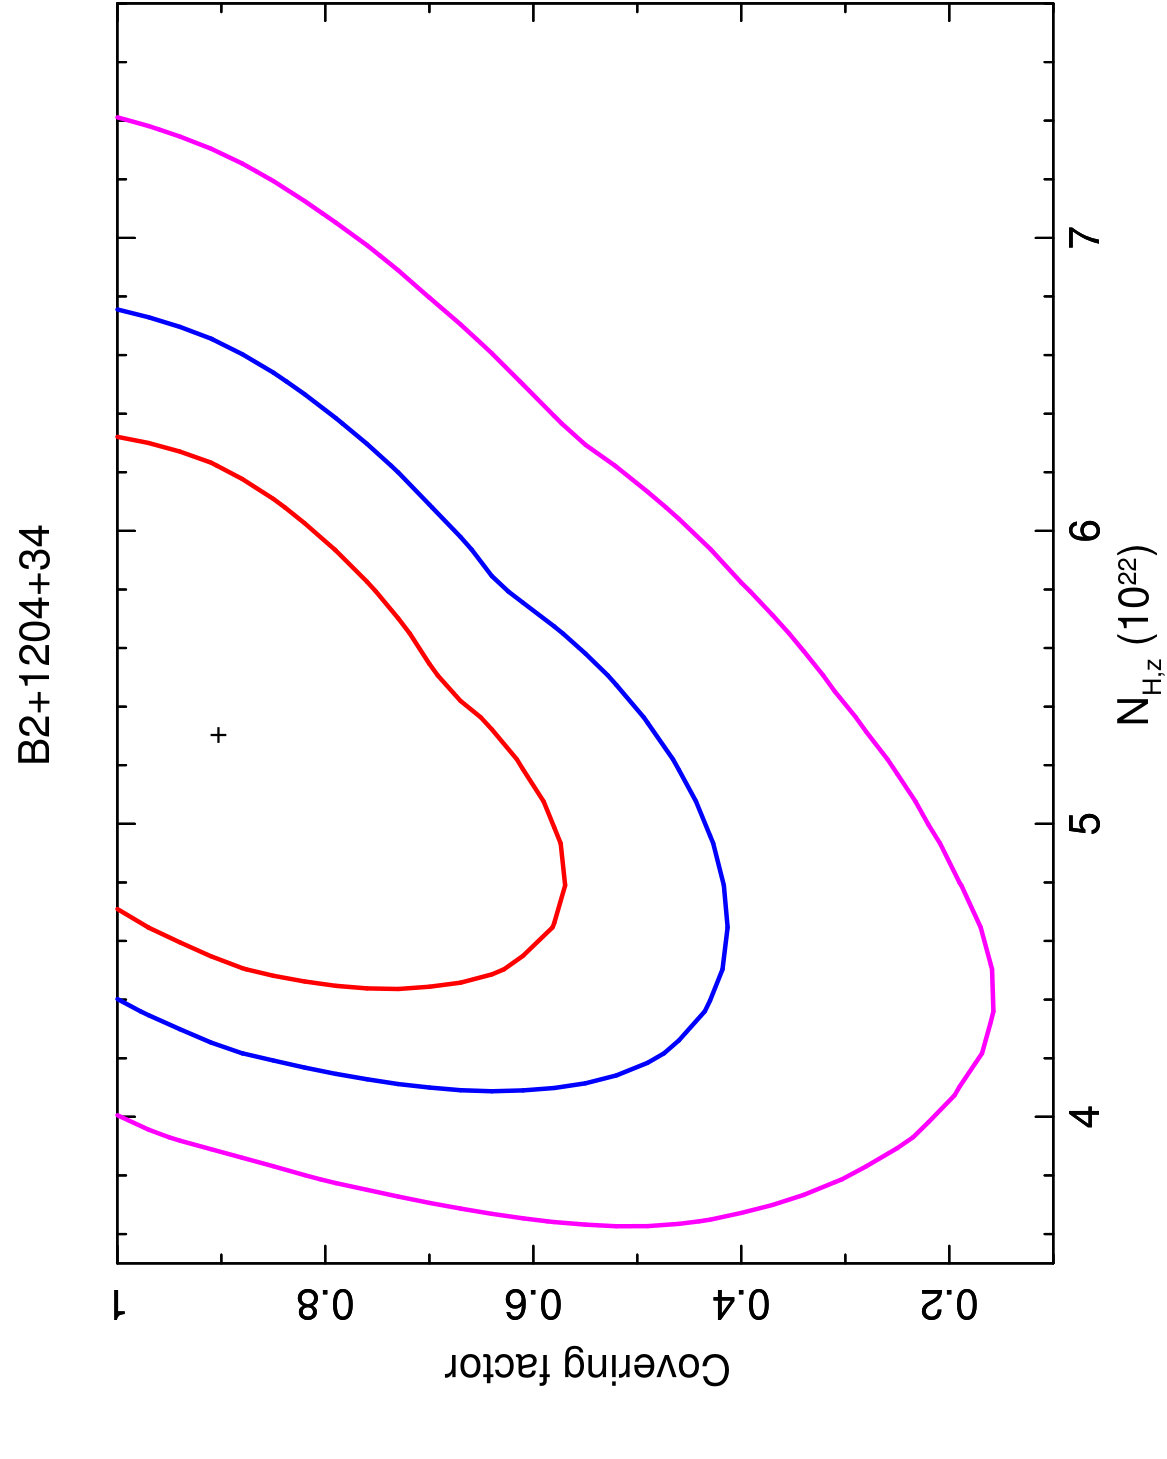 Figure 37
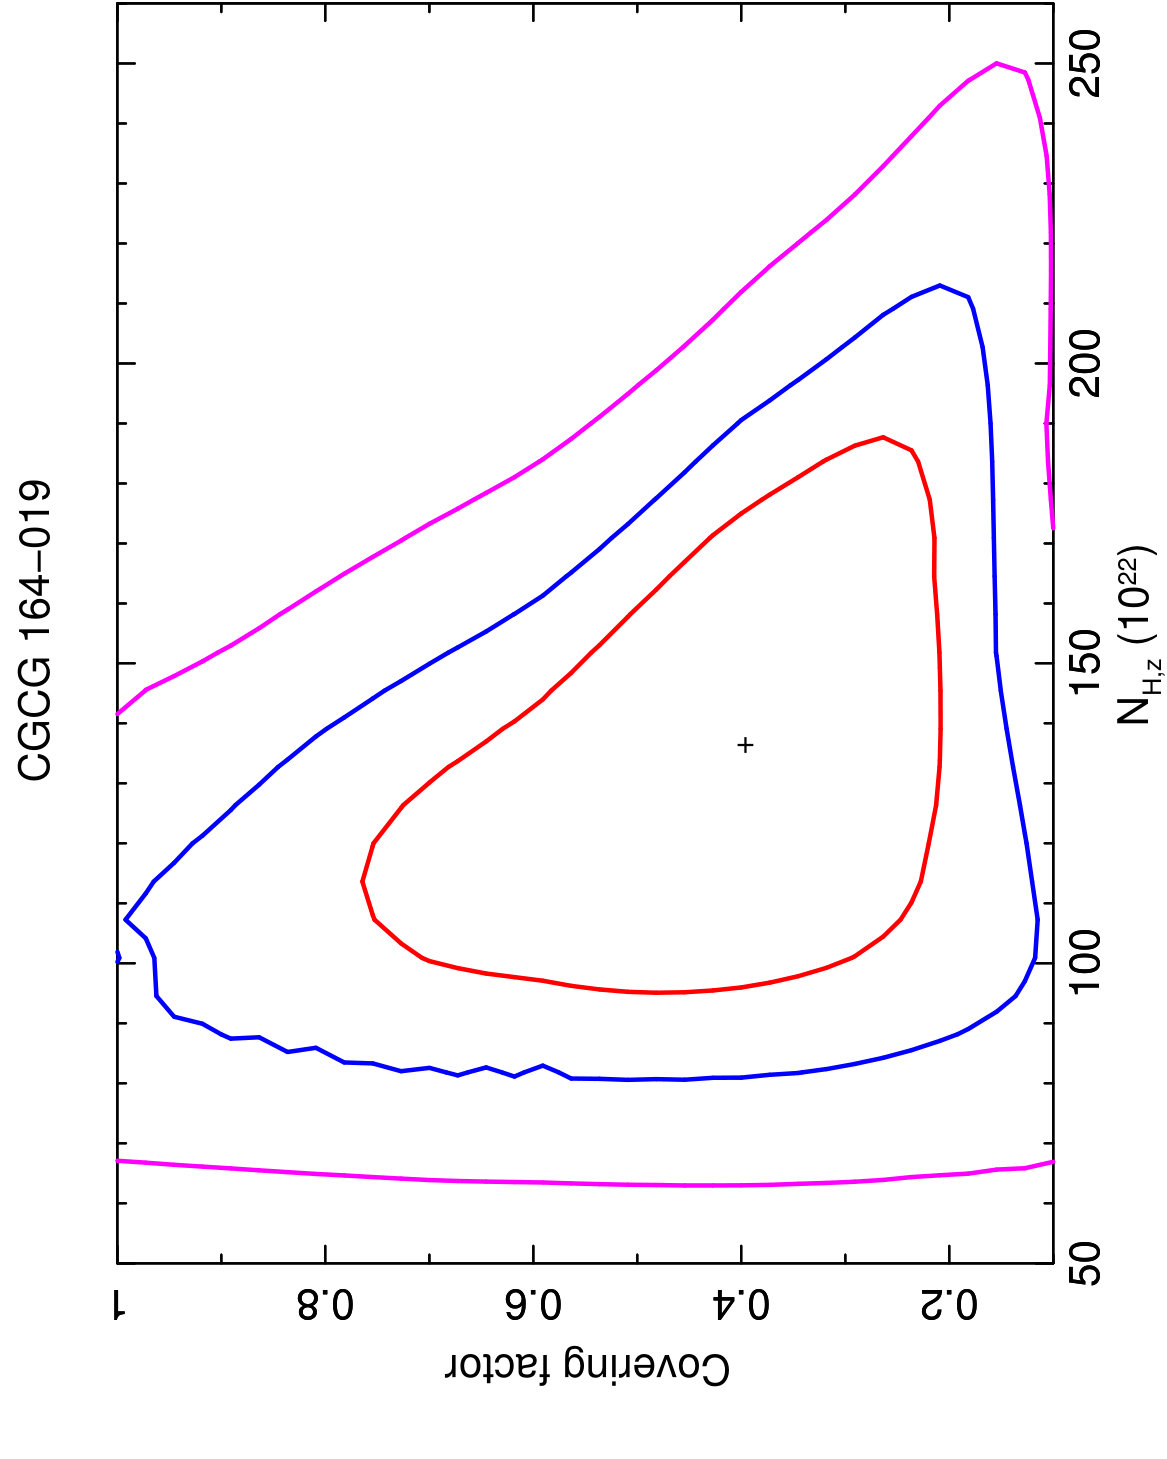 Figure 38
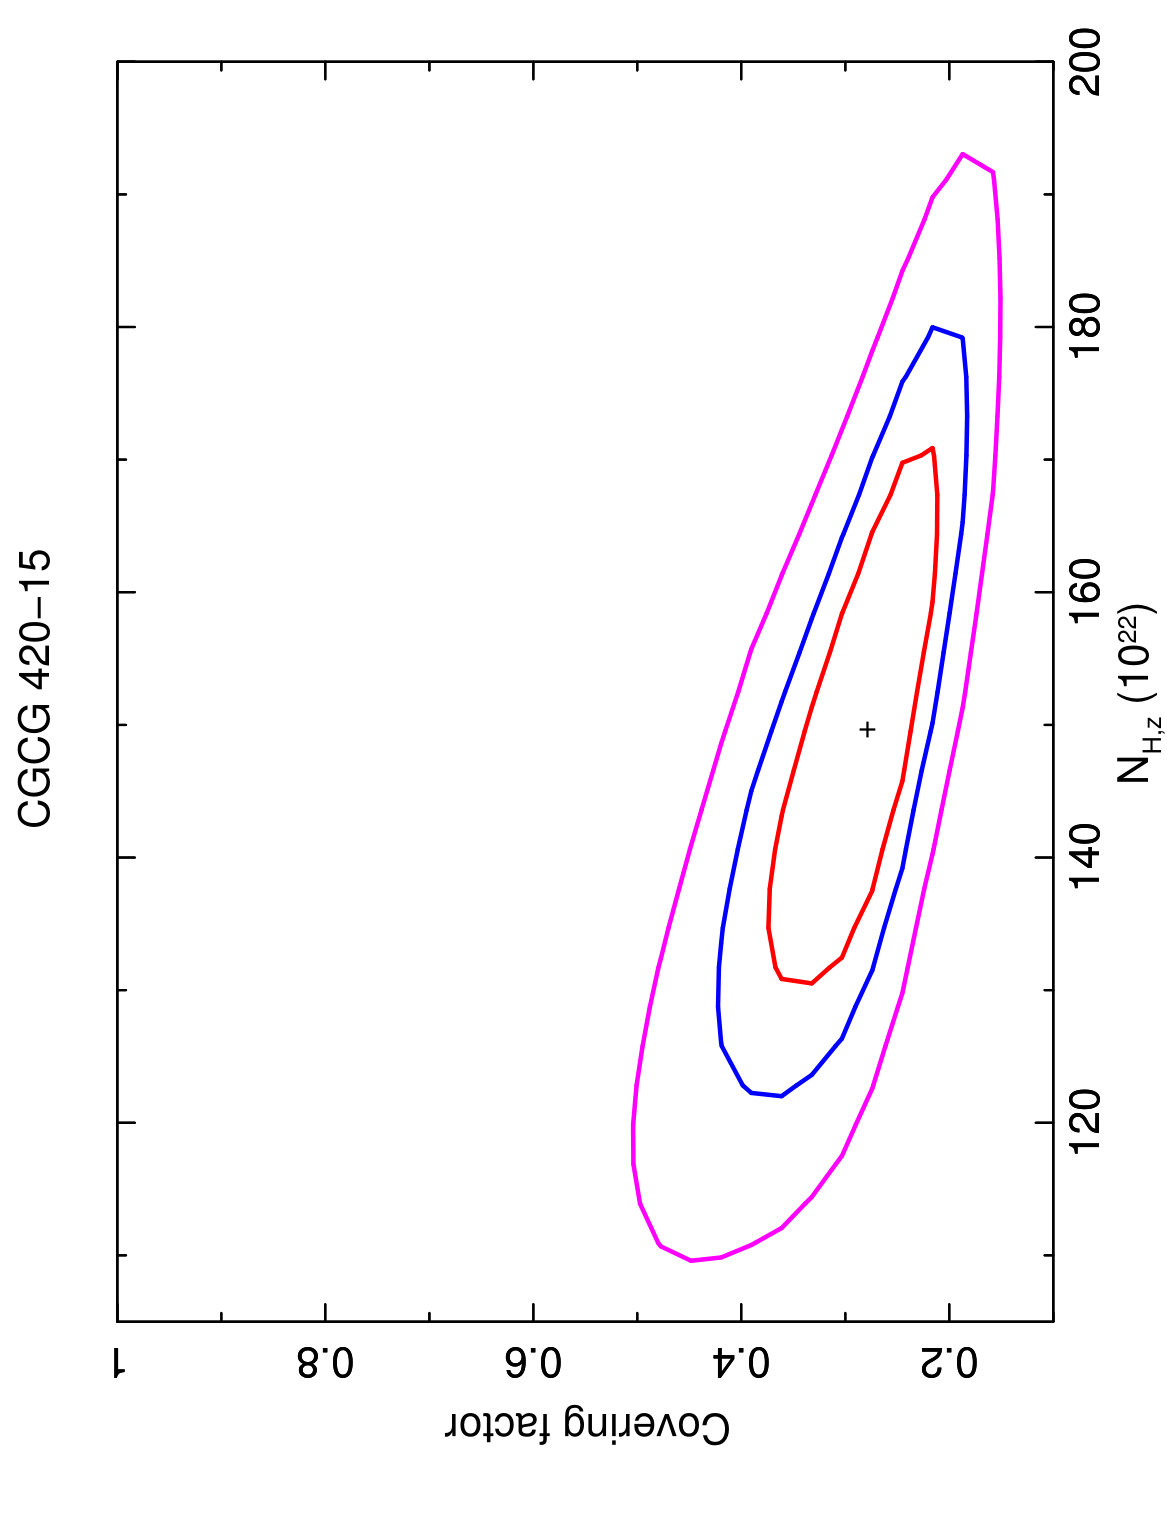 Figure 39
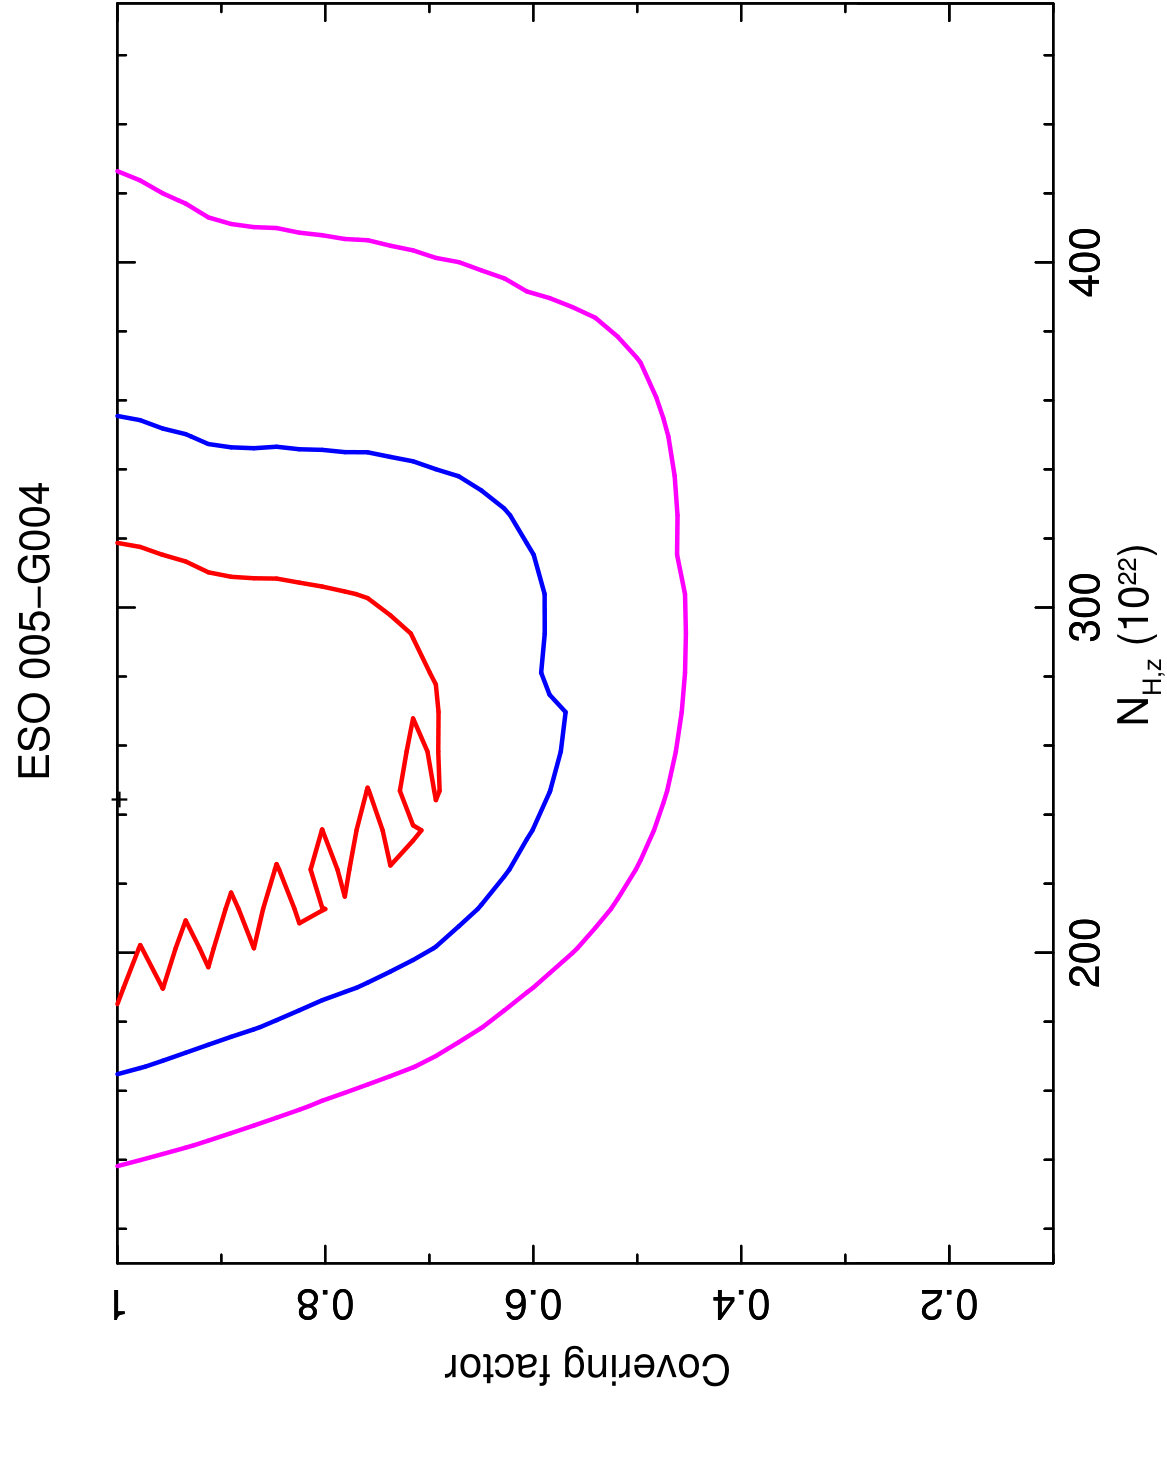 Figure 40
| 4PBC name | Source name | R.A. | Decl | Type | Telescope | ObsID | Date | Exposure | Rate | Ref. | |
|---|---|---|---|---|---|---|---|---|---|---|---|
| deg | deg | ks | cts s-1 | ||||||||
| (1) | (2) | (3) | (4) | (5) | (6) | (7) | (8) | (9) | (10) | (11) | (12) |
| J0324.8–6043 | ESO 116-G018 | 51.2210 | –60.7384 | 2 | 0.0185 | XMM-Newton | 0795680201 | 2017-11-01 | 164.8 | 0.015 | (a) |
| … | … | … | … | … | … | NuSTAR | 60301027002 | 2017-11-01 | 90.1 | 0.013 | – |
| J0333.7–0504 | NGC 1358 | 53.4153 | –5.0894 | 2 | 0.0134 | XMM-Newton | 0795680101 | 2017-08-01 | 100.6 | 0.014 | (a) |
| … | … | … | … | … | … | NuSTAR | 60301026002 | 2017-08-01 | 99.8 | 0.023 | – |
| J0615.5+7102 | Mrk 3 | 93.90129 | 71.037476 | 2 | 0.0254 | XMM-Newton | 0741050501 | 2015-04-06 | 19.9 | 0.089 | (b) |
| … | … | … | … | … | … | NuSTAR | 60002048004 | 2014-09-14 | 66.9 | 0.049 | (c)* |
| J1152.7-0511 | MCG–01–30–041 | 178.15887 | –5.206967 | 1.8 | 0.0188 | Swift-XRT | 80062 | 2017-06-14 | 7.1 | 0.065 | (d) |
| … | … | … | … | … | … | NuSTAR | 60061216002 | 2017-06-14 | 53.7 | 0.086 | – |
| J2304.7+1219 | NGC 7479 | 346.236042 | 12.322889 | 2 | 0.0079 | XMM-Newton | 0025541001 | 2001-06-19 | 29.9 | 0.041 | (e) |
| … | … | … | … | … | … | NuSTAR | 60201037002 | 2016-05-12 | 36.9 | 0.015 | – |
| Source | norm1 | AS | f2-10 | L2-10 | f15-55 | L15-55 | /d.o.f. | ||||
|---|---|---|---|---|---|---|---|---|---|---|---|
| % | |||||||||||
| ESO 116-G018 | 190.0 | 1.55 | 1.05 | 18.52. | 0.84 | 0.5 | –12.52 | 43.30 | –11.34 | 43.19 | 187.0/210 |
| NGC 1358 | 236.0 | 1.82 | 1.17 | 141.32 | 0.25 | 0.1 | –12.41 | 43.39 | –10.95 | 43.39 | 220.0/239 |
| Mrk 3 | 78.9 | 1.78 | 2.06 | 240.64 | 0.30 | 1.3 | –11.18 | 44.04 | –9.91 | 44.23 | 1183.4/1098 |
| MCG-01-30-041 | 1.0 | 1.85 | 1.03 | 18.59 | – | – | –11.26 | 42.64 | –11.17 | 42.71 | 222.2/225 |
| NGC 7479 | 363.6 | 1.83 | 1.34 | 110.08 | 1.00f | 0.5 | –12.75 | 42.64 | –10.96 | 43.00 | 200.6/171 |
| MYTorus | borus02 | |||||
| Source | /DOF | /DOF | ||||
| 1022 cm-2 | 1022 cm-2 | |||||
| NGC 424 | 130.6 | 1.51 | 429.8/335 | 223.7 | 1.57 | 398.6/334 |
| MCG+08-03-018 | 47.9 | 1.84 | 176.9/151 | 46.9 | 1.90 | 169.5/150 |
| NGC 1068N | 1000.0 | 1.88 | 602.5/552 | 1000.0f | 2.03 | 664.7/551 |
| NGC 1194 | 81.1 | 1.50 | 307.5/244 | 156.1 | 1.57 | 272.9/243 |
| NGC 1229 | 42.3 | 1.40f | 98.5/97 | 38.1 | 1.47 | 95.4/96 |
| ESO 116-G018 | 190.0 | 1.55 | 187.0/210 | 193.0 | 1.45 | 190.0/209 |
| NGC 1358 | 236.0 | 1.82 | 220.0/239 | 248.0 | 1.67 | 230.0/238 |
| ESO 201-IG004 | 71.3 | 1.51 | 108.7/84 | 56.8 | 1.60 | 104.7/83 |
| 2MASXJ03561995-6251391 | 83.9 | 1.98 | 134.5/138 | 85.1 | 1.98 | 132.3/137 |
| CGCG 420-15 | 71.5 | 1.66 | 268.6/219 | 86.4 | 1.47 | 260.0/218 |
| MRK 3 | 78.9 | 1.78 | 1183.4/1098 | 74.7 | 1.65 | 1142.4/1097 |
| ESO 005-G004 | 106.9 | 1.63 | 86.0/72 | 306.1 | 1.54 | 87.2/71 |
| MCG+06-16-028 | 104.7 | 1.56 | 82.3/87 | 85.0 | 1.73 | 76.3/86 |
| 2MASXJ09235371-3141305 | 67.3 | 1.76 | 193.7/145 | 62.8 | 1.82 | 182.2/144 |
| NGC 3079 | 246.7 | 1.94 | 206.9/182 | 197.0 | 1.86 | 204.1/181 |
| NGC 3393 | 189.7 | 1.78 | 66.7/92 | 321.6 | 1.77 | 54.8/91 |
| 2MASXJ10523297+1036205 | 7.7 | 1.55 | 545.8/515 | 7.3 | 1.51 | 534.9/514 |
| RBS 1037 | 1.0 | 1.75 | 315.6/313 | 0.2 | 1.81 | 319.7/312 |
| MCG-01-30-041 | 1.0 | 1.85 | 222.2/225 | 1.5 | 1.83 | 220.1/224 |
| NGC 4102 | 77.8 | 1.67 | 217.5/191 | 69.1 | 1.73 | 204.1/190 |
| B2 1204+34 | 4.5 | 1.68 | 222.5/248 | 4.8 | 1.73 | 217.3/247 |
| NGC 4945 | 377.0 | 1.97 | 1508.8/1486 | 338.3 | 1.80 | 1543.5/1485 |
| NGC 5100 | 22.6 | 1.68 | 191.4/197 | 21.1 | 1.62 | 191.8 /196 |
| IGR J14175-4641 | 80.1 | 1.79 | 84.3/80 | 85.4 | 1.70 | 83.6/79 |
| NGC 5643 | 159.4 | 1.93 | 154.0/137 | 246.4 | 1.47 | 153.9/136 |
| MRK 477 | 22.4 | 1.65 | 245.9/227 | 21.6 | 1.60 | 260.2/226 |
| NGC 5728 | 142.3 | 1.88 | 362.4/329 | 123.0 | 1.77 | 363.6/328 |
| CGCG 164-019 | 119.5 | 1.78 | 59.9/58 | 147.7 | 1.80 | 59.6/57 |
| NGC 6232 | 59.3 | 1.44 | 35.9/34 | 62.6 | 1.40f | 36.1/33 |
| NGC 6240 | 135.5 | 1.80 | 533.8/496 | 122.2 | 1.74 | 520.1/495 |
| ESO 464-G016 | 84.8 | 1.88 | 67.9/76 | 83.9 | 1.71 | 67.0/75 |
| NGC 7130 | 221.8 | 1.50 | 61.3/83 | 399.0 | 1.45 | 67.9/82 |
| NGC 7212 | 126.9 | 1.92 | 129.0/121 | 155.5 | 1.77 | 123.4/120 |
| NGC 7479 | 363.6 | 1.83 | 200.6/171* | 542.5 | 1.79 | 206.8/170* |
| NGC 7582 | 525.6 | 2.00 | 340.7/320 | 174.2 | 1.90 | 353.6 /319 |
| Source | () | (L2-10keV) | /DOF | |||
|---|---|---|---|---|---|---|
| 1022 cm-2 | ||||||
| NGC 424 | 265.1 | 1.81 | 23.3, 24.3 | 0.40 | 42.74 | 398.6/335 |
| MCG+08-03-018B | 107.3 | 2.17 | 23.1 | 0.67 | 43.27 | 150.9/148 |
| NGC 1068N | 1000f | 2.15 | 23.1, 24.7 | 0.91 | 42.38 | 574.0/551 |
| NGC 1194B | 246.6 | 1.86 | 23.8 | 0.10 | 43.61 | 262.6/243 |
| NGC 1229 | 35.2 | 1.57 | 24.2 | 1.00 | 42.83 | 91.8/95 |
| ESO 116-G018 | 313.0 | 1.59 | 23.5 | 0.12 | 43.30 | 189.0/209 |
| NGC 1358 | 255.0 | 1.60 | 23.8 | 0.14 | 43.40 | 231.0/238 |
| ESO 201-IG004B | 133.8 | 1.69 | 23.2 | 0.40 | 43.53 | 96.2/83 |
| 2MASXJ03561995-6251391 | 84.3 | 1.99 | 24.5 | 0.51 | 44.55 | 132.2/137 |
| CGCG 420-15B | 150.0 | 1.92 | 23.4 | 0.28 | 41.83 | 225.9/218 |
| MRK 3 | 79.5 | 1.68 | 22.7 | 0.30 | 44.04 | 1120.1/1097 |
| ESO 005-G004 | 248.1 | 1.47 | 23.7 | 1.00 | 41.87 | 86.1/71 |
| MCG+06-16-028 | 82.2 | 1.83 | 24.5 | 1.00 | 42.84 | 69.4/86 |
| 2MASXJ09235371-3141305 | 63.2 | 2.01 | 24.3 | 1.00 | 43.57 | 178.5/144 |
| NGC 3079B | 150.5 | 1.93 | 24.5 | 0.98 | 41.83 | 194.6/181 |
| NGC 3393 | 257.8 | 1.72 | 24.2 | 0.60 | 42.75 | 55.3/91 |
| 2MASXJ10523297+1036205 | 7.5 | 1.51 | 22.7 | 1.00 | 43.90 | 521.1/513 |
| RBS 1037 | 0.1 | 1.85 | 23.6 | – | 42.71 | 317.2/312 |
| MCG-01-30-041 | 1.7 | 1.85 | 24.8 | 0.62 | 43.90 | 219.9/224 |
| NGC 4102 | 62.3 | 1.75 | 24.3 | 0.77 | 41.29 | 201.3/190 |
| B2 1204+34 | 5.3 | 1.86 | 24.4 | 0.90 | 43.65 | 214.5/247 |
| NGC 4945N | 397.2 | 1.95 | 24.1 | 0.10 | 42.33 | 1404.1/1398 |
| NGC 5100 | 20.4 | 1.57 | 23.3 | 1.00 | 42.99 | 189.7/196 |
| IGR J14175-4641 | 85.9 | 1.70 | 23.2 | 0.19 | 43.96 | 83.6/79 |
| NGC 5643 | 269.4 | 1.55 | 23.6 | 1.00 | 41.42 | 150.0/137 |
| MRK 477 | 16.8 | 1.60 | 23.7 | 1.00 | 43.09 | 223.0/223 |
| NGC 5728B | 96.8 | 1.81 | 24.3 | 1.00 | 42.74 | 327.1/328 |
| CGCG 164-019 | 137.1 | 1.79 | 23.1 | 0.40 | 42.43 | 59.3/57 |
| NGC 6232 | 62.6 | 1.40f | 25.1 | 1.00 | 41.89 | 32.8/33 |
| NGC 6240 | 110.4 | 1.75 | 24.2 | 0.75 | 43.58 | 518.7/495 |
| ESO 464-G016 | 85.5 | 1.67 | 22.8 | 0.15 | 43.17 | 67.2/74 |
| NGC 7130 | 343.1 | 1.40f | 24.1 | 1.00 | 42.30 | 66.0/82 |
| NGC 7212 | 194.4 | 1.99 | 23.6 | 0.26 | 43.63 | 120.6/120 |
| NGC 7479 | 132.4 | 1.64 | 24.8 | 1.00 | 42.02 | 167.2/170 |
| NGC 7582 | 1000.0f | 1.96 | 24.2 | 1.00 | 42.53 | 316.6/317 |
Peer Reviews
No public reviews on file for this paper yet. If you reviewed it on a platform where reviews are public (OpenReview, ICLR, NeurIPS, ICML), you can paste yours below so the community can read it here.
Videos
No videos yet. Explain this paper in a talk, walkthrough, or lecture? Add one.
Compton-thick AGN in the NuSTAR era III: A systematic study of the torus covering factor
S. Marchesi11affiliation: Department of Physics and Astronomy, Clemson University, Clemson, SC 29634, USA , M. Ajello11affiliation: Department of Physics and Astronomy, Clemson University, Clemson, SC 29634, USA , X. Zhao11affiliation: Department of Physics and Astronomy, Clemson University, Clemson, SC 29634, USA , L. Marcotulli11affiliation: Department of Physics and Astronomy, Clemson University, Clemson, SC 29634, USA , M. Baloković22affiliation: Harvard-Smithsonian Center for Astrophysics, 60 Garden Street, Cambridge, MA 02140, USA , M. Brightman33affiliation: Cahill Center for Astrophysics, California Institute of Technology, 1216 East California Boulevard, Pasadena, CA 91125, USA , A. Comastri44affiliation: Osservatorio di Astrofisica e Scienza dello Spazio di Bologna, Via Piero Gobetti, 93/3, 40129, Bologna, Italy , G. Cusumano55affiliation: INAF - Istituto di Astrofisica Spaziale e Fisica Cosmica, Via U. La Malfa 153, I-90146 Palermo, Italy , G. Lanzuisi44affiliation: Osservatorio di Astrofisica e Scienza dello Spazio di Bologna, Via Piero Gobetti, 93/3, 40129, Bologna, Italy 66affiliation: Dipartimento di Fisica e Astronomia, Alma Mater Studiorum, Università di Bologna, Via Piero Gobetti, 93/2, 40129, Bologna, Italy , V. La Parola55affiliation: INAF - Istituto di Astrofisica Spaziale e Fisica Cosmica, Via U. La Malfa 153, I-90146 Palermo, Italy , A. Segreto55affiliation: INAF - Istituto di Astrofisica Spaziale e Fisica Cosmica, Via U. La Malfa 153, I-90146 Palermo, Italy , C. Vignali66affiliation: Dipartimento di Fisica e Astronomia, Alma Mater Studiorum, Università di Bologna, Via Piero Gobetti, 93/2, 40129, Bologna, Italy 44affiliation: Osservatorio di Astrofisica e Scienza dello Spazio di Bologna, Via Piero Gobetti, 93/3, 40129, Bologna, Italy
Abstract
We present the analysis of a sample of 35 candidate Compton thick (CT-) active galactic nuclei (AGNs) selected in the nearby Universe (average redshift 0.03) with the Swift-BAT 100-month survey. All sources have available NuSTAR data, thus allowing us to constrain with unprecedented quality important spectral parameters such as the obscuring torus line-of-sight column density (), the average torus column density () and the torus covering factor (). We compare the best-fit results obtained with the widely used MYTorus (Murphy & Yaqoob, 2009) model with those of the recently published borus02 model (Baloković et al., 2018) used in the same geometrical configuration of MYTorus (i.e., with =0.5). We find a remarkable agreement between the two, although with increasing dispersion in moving towards higher column densities. We then use borus02 to measure . High– sources have, on average, smaller offset between and than low– ones. Therefore, low values can be linked to a “patchy torus” scenario, where the AGN is seen through an over-dense region in the torus, while high– objects are more likely to be obscured by a more uniform gas distribution. Finally, we find potential evidence of an inverse trend between and the AGN 2–10 keV luminosity, i.e., sources with higher values have on average lower luminosities.
Subject headings:
galaxies: active — galaxies: nuclei — X-rays: galaxies
1. Introduction
Obscuration in active galactic nuclei (AGNs) has been largely studied over the electromagnetic spectrum, from the optical (e.g., Lawrence, 1991; Simpson, 2005), to the infrared (see, e.g., Jaffe et al., 2004; Nenkova et al., 2008), to the X-rays (e.g., Risaliti et al., 1999; Gilli et al., 2007; Marchesi et al., 2016b). Based on the results of these works, it is commonly accepted that the obscuration is caused by a so-called “dusty torus”, i.e., a distribution of molecular gas and dust located at 1–10 pc from the accreting supermassive black hole (SMBH). While the existence of this obscuring material is universally accepted, its geometrical distribution and chemical composition are still matter of debate, although several works reported that the observational evidence points towards a “patchy torus” scenario, where the obscuring material is distributed in clumps formed by optically thick clouds (e.g., Jaffe et al., 2004; Elitzur & Shlosman, 2006; Risaliti et al., 2007; Hönig & Beckert, 2007; Nenkova et al., 2008; Risaliti et al., 2011; Burtscher et al., 2013).
With the launch of the Nuclear Spectroscopic Telescope Array (hereafter NuSTAR, Harrison et al., 2013), the study and characterization of the physics of the obscuring material surrounding accreting SMBHs experienced a significant step forward. NuSTAR is the first telescope with focusing optics at 10 keV, and its sensitivity is almost two orders of magnitude deeper than any of the other previous facilities in the same energy range. Since in the X-rays the observed emission of heavily obscured AGNs peaks at 30–50 keV (Ajello et al., 2008), where the so-called “Compton hump” is observed, while below 5 keV all the AGN emission is absorbed (Koss et al., 2016), NuSTAR, covering the 3–78 keV energy range, represents the ideal instrument to investigate these otherwise elusive sources. The first years of NuSTAR were dedicated to the analysis of single, well-known CT-AGNs, or to the characterization of small samples of sources (e.g., Baloković et al., 2014; Puccetti et al., 2014; Annuar et al., 2015; Bauer et al., 2015; Brightman et al., 2015; Koss et al., 2015; Rivers et al., 2015; Masini et al., 2016; Puccetti et al., 2016). By the end of 2017, the sample of heavily obscured AGNs observed by NuSTAR was finally large enough to work on a systematic analysis of a statistically significant population of sources.
Consequently, we recently started a project to characterize all the CT-AGNs detected in a volume limited (d_{L}$$<500 Mpc, Marchesi et al. 2019 in prep.) sample of bright (observed flux f_{\rm 15-150\,keV}$$\geq510*-12* erg s*-1* cm*-2*) AGNs selected in the nearby Universe (=0.03) using Swift-BAT. As a first step, we analyzed the combined 2–100 keV spectra of 30 sources having an archival NuSTAR observation and reported to be CT-AGN in previous works, on the basis of their X-ray spectra. Our main goal was to verify how adding the NuSTAR data to the spectral fit improves the general knowledge on the properties of heavily obscured AGNs (Marchesi et al., 2018, hereafter M18). The 2–10 keV data used in this work were obtained from XMM-Newton, Chandra and Swift-XRT. The main result of our analysis is the discovery of a systematic offset in the spectral parameters values measured without and with the NuSTAR data. We observed a trend to artificially overestimate the line-of-sight column density () and the steepness of the spectrum when NuSTAR data are not included in the fit: this effect is only in small part variability–dependent, since only in three out of 30 sources the fit significantly improved allowing for to vary between the 2–10 keV and the NuSTAR data. Furthermore, we found that the offset is stronger in sources with low statistics (d.o.f.30) in the 0.3–10 keV+BAT spectrum, i.e., mostly objects with either a Swift-XRT or a short (10 ks) Chandra spectrum. In this low-statistics subsample, the intrinsic absorption was overestimated on average by 40% in the fits without NuSTAR data. As a consequence, less than half (47%) of the candidate CT-AGNs already reported in the literature are confirmed as bona-fide CT-AGNs in our analysis, and 13 out of 30 sources are found to be Compton thin at the 3 confidence level. We point out that our analysis was limited to sources previously reported to be CT-AGNs, therefore it is possible that the opposite trend also exists, i.e., there are sources for which the line-of-sight column density is underestimated fitting only the 2–10 keV+Swift-BAT data, and that would be found to be CT-AGNs when adding NuSTAR to the fit.
While the results reported in M18 confirmed the fundamental role of NuSTAR in characterizing heavily obscured AGNs, their effectiveness in constraining the typical geometrical distribution of the obscuring material around the accreting SMBH was limited by the model used in our analysis, MYTorus (Murphy & Yaqoob, 2009; Yaqoob, 2012; Yaqoob et al., 2015). In fact, while MYTorus has been proven effective in the X-ray spectral fitting of heavily obscured sources, it also assumes a fixed geometry for its torus model, with a torus half-opening angle =60°, i.e., a torus covering factor =cos()=0.5. Immediately after the publication of M18, however, Baloković et al. (2018) published a new torus model, borus02. This model is an updated version of the extensively used BNTorus model (Brightman & Nandra, 2011), and has as a free parameter. Notably, is a free parameter also in BNTorus, but Liu & Li (2015) reported that BNTorus has some issues in the geometry-dependent computation of the torus reprocessed component, and should therefore not be used to derive the torus covering factor. Consequently, we decided to reanalyze our sample, this time using borus02, to measure the torus covering factor and study its trend with different AGN parameters, using a statistically significant sample. As of today, the measurement of the torus covering factor from an X-ray perspective has been limited to single sources, mostly observed with Suzaku or NuSTAR (see, e.g., Awaki et al., 2009; Eguchi et al., 2011; Tazaki et al., 2011; Yaqoob, 2012; Kawamuro et al., 2013; Farrah et al., 2016), or small samples of objects (e.g., Brightman et al., 2015; Masini et al., 2016).
This work is organized as follows: in Section 2 we present the sample used in this work and we describe the data reduction and spectral extraction process for both NuSTAR and the 0.3–10 keV observations. In Section 3 we describe the models used to perform the spectral fitting. In Section 4 we report the results of the MYTorus spectral fitting of five sources whose data became public recently, which we did not analyze in M18. In Section 5 we test the recently published borus02 model, comparing its results with those from the MYTorus one, while in Section 6 we use borus02 to measure the torus covering factor () of the sources in our sample, and we study the trend with and X-ray luminosity. Finally, we report our conclusions in Section 7. All reported errors are at the 90% confidence level, if not otherwise stated.
2. Sample selection and data reduction
The sources analyzed in this work have been selected from the Palermo BAT 100-month catalog111http://bat.ifc.inaf.it/100m_bat_catalog/100m_bat_catalog_v0.0.htm, which reaches a flux limit 3.3 10*-12* erg s*-1* cm*-2* in the 15-150 keV band. The public data have been first downloaded from the HEASARC public archive and then processed with the BAT_IMAGER code (Segreto et al., 2010). BAT_IMAGER is used to detect sources in observations made using coded mask instruments. The spectra used in our work are background subtracted and exposure-averaged; the spectral redistribution matrix is the official BAT one222[http://heasarc.gsfc.nasa.gov/docs/heasarc/caldb/data/swift/
bat/index.html](http://heasarc.gsfc.nasa.gov/docs/heasarc/caldb/data/swift/%5C%5C%0Abat/index.html). The details of the source counterpart association process are reported in Cusumano et al. (2010): we also point out that all the sources in our sample, with the exception of NGC 1358 and ESO 116-G018, have been already reported in previous Swift-BAT catalogs (see, e.g., Vasudevan et al., 2013; Ricci et al., 2015, 2017a; Oh et al., 2018). The 100-month catalog (Marchesi et al. 2019 in prep.) contains 1699 sources, less than 10% of which (167) are not associated to a counterpart.
30 out of the 35 sources analyzed in this work where first studied in M18. These sources were selected among the 100-month BAT AGNs which were reported to be CT-AGN in previous works and had available NuSTAR archival observation: a detailed summary of all the papers where these objects were first reported to be CT-AGNs is reported in Table 1 of M18. 14 out of 30 sources had 0.5–10 keV coverage from XMM-Newton, 2 from Chandra, and 14 from Swift-XRT. Notably, for the majority of these sources the line-of-sight column density measurement was originally obtained using only 0.5–10 keV data, in some cases with the further addition of BAT information in the 15–150 keV band, but without using NuSTAR.
In this paper, we reanalyize all the 30 sources we studied in M18, and we add to the sample five other candidate CT-AGNs from the 100-month BAT catalog with available NuSTAR data that were not studied in the previous work. We report in Table 1 a summary of these five new sources.
2.1. Data reduction for the five sources not reported in Marchesi et al. (2018)
The five sources not analyzed in M18 are ESO 116-G018 (=0.0185), NGC 1358 (=0.0134), Mrk 3 (=0.0254), MCG–01–30–041 (=0.0188) and NGC 7479 (=0.0079).
NGC 1358 and ESO 116-G018 were first analyzed in Marchesi et al. (2017) using Chandra data. Both sources were found to have N_{\rm H,z}$$\sim1024 cm*-2*. Therefore, we proposed for a joint NuSTAR–XMM-Newton observation of both these objects, to properly characterize them. Our proposal was accepted (NuSTAR GO Cycle 3, proposal ID: 3258; PI S. Marchesi) and we were granted NuSTAR (50 ks for both sources) and XMM-Newton (50 ks for ESO 116-G018 and 45 ks for NGC 1358) time. The results of the spectral analysis have been published in Zhao et al. (2018b, a). For these two sources, as well as for Mrk 3 and NGC 7479, we reduced the XMM-Newton data using the SAS v16.0.0333http://xmm.esa.int/sas packages and adopting standard procedures. The source spectra were extracted from a 15*′′* circular region, corresponding to 70% of the encircled energy fraction at 5 keV for all the three XMM-Newton 0.5–10 keV cameras (MOS1, MOS2 and pn), while the background spectra were obtained from a circle having radius 45*′′* located near the source and not contaminated by nearby objects. Each spectrum has been binned with at least 20 counts per bin.
MCG–01–30–041 has only been observed twice with Swift-XRT in the 0.5–10 keV band: since one of these observations was taken simultaneously with the NuSTAR one, we used this in our analysis, to reduce potential variability issues. We obtained the Swift-XRT spectrum using the Swift products generator available online (http://www.swift.ac.uk/user_objects/; see also Evans et al., 2009). Due to the spectrum low statistics, we binned it with only 3 counts per bin and we therefore analyzed it using the cstat, rather than the , statistic (see Section 4).
Finally, for all five objects the data retrieved for both NuSTAR Focal Plane Modules (FPMA and FPMB; Harrison et al., 2013) were processed using the NuSTAR Data Analysis Software (NUSTARDAS) v1.5.1. The event data files were calibrated running the nupipeline task using the response file from the Calibration Database (CALDB) v. 20180419. With the nuproducts script we generated both the source and background spectra, and the ancillary and response matrix files. For both focal planes, we used a circular source extraction region with a 30*′′* radius, corresponding to 50% of the encircled energy fraction over the whole NuSTAR energy range, and centered on the target source; for the background we used the same extraction region positioned far from any source contamination in the same frame. The NuSTAR spectra have then been grouped with at least 20 counts per bin, and cover the energy range from 3 to 50–70 keV, depending on the quality of the data.
3. Spectral fitting procedure
The spectral fitting procedure was performed using the XSPEC software (Arnaud, 1996); the Galactic absorption values is the one measured by Kalberla et al. (2005). We used Anders & Grevesse (1989) cosmic abundances, fixed to the solar value, and the Verner et al. (1996) photoelectric absorption cross-section. Following the same approach described in M18, we fit our data in the 2–150 keV regime, since in heavily obscured AGNs the 0.5–2 keV band emission is dominated by non-AGN processes, such as as star-formation and/or diffuse gas emission (see, e.g., Koss et al., 2015).
Heavily obscured AGNs have complex spectra, where the contribution of the Compton scattering and of the fluorescent Iron line becomes significant with respect to less obscured AGN spectra. Consequently, these sources should be treated in a self-consistent way, that allows one to properly measure , using models developed specifically to this purpose. In M18, we fitted the 30 sources in our sample with a Monte Carlo radiative transfer code: MYTorus (Murphy & Yaqoob, 2009; Yaqoob, 2012; Yaqoob et al., 2015). In this work we use both MYTorus and borus02 (Baloković et al., 2018), another Monte Carlo radiative transfer code. More in detail, we first fit the spectra of the five sources not reported in M18 using MYTorus. We then fit with borus02 both the 30 sources in M18 and the five new sources, using two distinct model configurations: the first one with borus02 in the same geometrical configuration than MYTorus, the second one allowing the torus covering factor to vary.
3.1. MYTorus
The MYTorus model is divided in three distinct components.
A multiplicative component containing photoelectric absorption and Compton scattering attenuation, with associated equivalent neutral hydrogen column density (). This component is applied to the main power law continuum. 2. 2.
A scattered continuum, also known as “reprocessed component”. This component models those photons that are observed after one or more interactions with the material surrounding the SMBH. The normalization of the reprocessed component with respect to the main continuum hereby denoted as AS. 3. 3.
The neutral Fe fluorescent emission lines, more in detail the Fe K line at 6.4 keV and the K at 7.06 keV. We denote the normalization of these lines with respect to the main continuum as AL.
In MYTorus, the obscuring material surrounding the SMBH is assumed to have a toroidal, azimuthally symmetric shape. The torus covering factor, , is not a free parameter and is fixed to =cos()=0.5, where =60 is the torus half-opening angle. The angle between the torus axis and the observer is free to vary, within the range =[0–90]. In our analysis, both in M18 and here, we use MYTorus in the so-called “decoupled mode” (Yaqoob et al., 2015): for the main continuum, we fix =90, while for the reprocessed component we test two different scenarios, one with =90, the other with =0, checking which one leads to the smaller reduced , =/(degrees of freedom). Sources best-fitted with =90 correspond to a scenario where the dense obscuring torus is observed “edge-on” and the obscuring material lies between the AGN and the observer. Sources best-fitted with =0, instead, are assumed to describe a patchy torus scenario, in which the reprocessed emission from the inner edge of the torus can reach the observer.
3.2. borus02
borus02 (Baloković et al., 2018) is an updated and improved version of the widely used BNTorus model (Brightman & Nandra, 2011). This radiative transfer code models the reprocessed emission component of an AGN X-ray spectrum, i.e., following the MYTorus nomenclature we introduced in the previous section, the “reprocessed component” and the neutral Fe emission lines.
In borus02, the obscuring material has a quasi–toroidal geometry, with conical polar cutouts. Both the average torus column density () and the torus covering factor are free parameters in the model: the torus covering factor value can vary in the range =[0.1–1.0], corresponding to a torus opening angle range =[0–84]°. In principle, the angle between the torus axis and the observer is also a free parameter of this model, but in our analysis we fix it to =87°, i.e., the upper boundary of the parameter in the model, corresponding to an almost “edge-on” configuration. In this work, we decide to fix to reduce potential degeneracies between this parameter, and , particularly in sources with low statistics (i.e., with less than 150–200 degrees of freedom). We are also working on a companion paper (Zhao et al. 2019 in prep.) where we use a sample of nearby AGNs, both obscured and unobscured, to analyze how leaving free to vary affects the other spectral parameters.
Finally, since the borus02 models itself does not take into account line-of-sight absorption, we follow Baloković et al. (2018) approach and derive in XSPEC using the components zphabs cabs to properly model Compton scattering losses out of the line of sight. In the overall fitting model, the value is a free parameter, independent from , and assumed to be identical in zphabs and cabs.
3.3. Additional components to the best-fit model
Besides using MYTorus and borus02 in the configurations described in the previous sections, we included the following components to our best-fit model:
A second power law, with photon index =, where is the photon index of the primary power law. This second power law is introduced to take into account the fraction of accreting SMBH emission which is scattered, rather than absorbed, by the gas surrounding the SMBH. We assume this component to be unabsorbed. 2. 2.
A constant, , allowing for a re-normalization of the NuSTAR spectrum with respect to the 2–10 keV+Swift-BAT one. Such a component models both cross-calibration offsets between the 2-10 keV and the NuSTAR data and potential flux variability between the different observations.
4. MYTorus fitting results for the five sources not reported in Marchesi et al. (2018)
As a first step of our analysis, we fitted with MYTorus the five sources which we did not report in M18: we jointly fitted the 2–10 keV (from either XMM-Newton, Chandra or Swift-XRT), NuSTAR and Swift-BAT data, and the MYTorus configuration is the one described in Section 3.1. All sources but NGC 7479 are fitted using the statistic: due to its low 2–10 keV count statistics, we measure the goodness of the fit in NGC 7479 with the W statistic (cstat in XSPEC), which is commonly used when a source does not have enough counts to be fitted with the method. However, the Swift-BAT spectra are already background-subtracted and can therefore not be fitted with cstat: for this reason, we used the multi-statistic approach allowed by XSPEC and fitted the Swift-BAT data with the statistic. The best-fit statistic we report for NGC 7479 in Table 2 is thus the sum of cstat and .
In Table 2 we also report the best-fit parameters for our new five sources: , , the 2–10 keV to NuSTAR cross-normalization constant, ; the main power law component normalization, norm1; the reprocessed and and iron lines relative normalizations, AS and AL; the fraction of scattered emission, . The observed flux and the intrinsic luminosity in the 2–10 keV and in the 15–55 keV band are also reported. For all five sources, we find that the best-fit model is the one with =90.
Three out of five sources (ESO 116-G018, NGC 1358 and NGC 7479) are confirmed to be CT-AGN at a 3 level. A fourth source, Mrk 3, is found to have best-fit line-of-sight column density =(7.80.1)1023 cm*-2*, slightly below the CT threshold. However, this is not an unexpected result, since this source is known to be highly variable, a result confirmed also in our analysis, since we find =2.07. A Compton-thin solution for this source was already reported in Yaqoob et al. (2015); furthermore, a recent monitoring campaign with NuSTAR performed by Guainazzi et al. (2016) showed that the line-of-sight column density of Mrk 3 varied in the range =[0.75–0.94] 1024 cm*-2* in a timespan of seven months. Notably, there is an excellent agreement between our measurement and the one obtained by Guainazzi et al. (2016) using the same NuSTAR observation, i.e., =(7.70.1)1023 cm*-2*.
Finally, we find that MCG-01-30-041, which was reported to be a CT-AGN (=1.45 1024 cm*-2*) by Vasudevan et al. (2013), is in fact an unobscured AGN (N_{\rm H,z}$$<1022 cm*-2*) based on our combined Swift-XRT,Swift-BAT and NuSTAR fit. Notably, we find that even fitting the Swift-XRT and Swift-BAT data only does not produce a CT solution, the best-fit line-of-sight column density being in this case =1.8 1023 cm*-2*, with a corresponding power law photon index =2.13. The reason of the discrepancy between our result and the one reported by Vasudevan et al. (2013) is likely linked to the very low quality of the combined Swift-XRTand Swift-BAT spectrum used in their work: the Swift-XRT spectrum used in their analysis has in fact only 30 counts in the 2–10 keV band (our combined Swift-XRT and NuSTAR spectrum has 3850 counts in the same band), and their fit has only 6 degrees of freedom (ours has 297).
We report in Figure 1 the 2–100 keV spectra of the five sources, as well as the corresponding best-fit models.
5. Comparison between MYTorus and borus02
In order to validate the reliability of the borus02 model and use it to measure the torus covering factor, in this section we compare the results obtained using MYTorus with those obtained using borus02 with the same geometrical configuration of MYTorus, i.e., fixing the torus covering factor to =0.5 (=60) and the angle between the observer and the torus axis to =87, i.e., the maximum value allowed by borus02444While in M18 we used =90, we checked that the difference in the best-fit values of and using =90 and =87 is 1%. We also fix the strength of the reprocessed component, AS, to the best-fit value we obtained using MYTorus (see Table 2 and Table 3 in M18). The overall torus column density, (), is left free to vary.
In Table 3 we report the best-fit, line-of-sight column density and photon index values for the 35 sources in our sample, using either MYTorus or borus02, while in Figure 2 we show the trends of these parameters obtained using borus02 as a function of those obtained using MYTorus.
As can be seen in Figure 2, left panel, there is a general excellent agreement between the value obtained using borus02 and the one obtained using MYTorus: the best-fit slope of the relation ()= ()+b is =0.970.05, and the Spearman rank order correlation coefficient of the distribution is =0.90, and the p-value for such a value to be derived by an uncorrelated population is =1.210*-12*. However, the high overall correlation observed in the whole sample hides the existence of two clear separate trends: sources having N_{\rm H,z}$$\leq1024 cm*-2* based on both the MYTorus and the borus02 best-fit have excellent correlation, the Spearman rank order correlation coefficient being =0.92 (p-value =1.110*-6*). On the opposite, we find a weaker correlation for sources being CT– according to at least one of the two models: in this second scenario, the sample has =0.49 and p-value =0.04. We also find that one source (NGC 1194), is found to be CT using borus02 and has instead N_{\rm H,z,MyT}$$<1024 cm*-2*, while another object (MCG+06-16-028) is a CT-AGN with MYTorus but has N_{\rm H,z,Borus}$$<1024 cm*-2*, although for this source the two measurements are consistent at the 90% confidence level.
The larger dispersion observed in the Compton thick regime is not unexpected, since above the CT threshold the measurement becomes more complex, because of the slightly different geometries of the models. Nonetheless, it is worth noticing that for 11 out of the 16 sources being confirmed CT-AGNs based on both MYTorus and borus02 have values in agreement at the 90% confidence level.
In Figure 2, right panel, we plot the best-fit photon index obtained using borus02, as a function of the same parameter obtained using MYTorus. Sources classified as CT-AGNs by either MYTorus or borus02 are plotted in red, while sources with 1024 cm*-2* in both models are plotted in black. As can be seen, the dispersion of the distribution is quite large, the Spearman rank order correlation coefficient being =0.64 and the p-value for such a value to be derived by an uncorrelated population is =6.810*-5*. However, the overall agreement between the two models is remarkable, the average photon index measured with MYTorus being =1.74, with associated standard deviation =0.16, while the average photon index measured using borus02 is =1.69, with associated standard deviation =0.15. Furthermore, 29 out of 35 sources (i.e., 83% of the objects in our sample) have consistent with within the 90% confidence uncertainty. We point out that measuring with such an high accuracy in CT-AGNs is a remarkable result, since in such obscured objects the intrinsic power-law continuum is not directly observable in any part of the spectrum below 5–10 keV.
In conclusion, our analysis shows that, when using borus02 in a geometrical configuration consistent with the MYTorus one, the best-fit results from the two models are in good agreement. Such an evidence supports the main goal of this work, i.e., using borus02 to measure the obscuring material covering factor for the 35 objects in our sample.
6. Constraining the torus covering factor
As a preliminary caveat, we point out that the whole analysis reported in this Section is based on single-epoch NuSTAR observation: this represents a partial limitation to our approach, since it has been shown (see, e.g., Baloković et al., 2018), that the analysis of multi-epoch NuSTAR observations allows one to place stronger constraints on the covering factor, simultaneously reducing potential degeneracies between parameters. Nonetheless, this work represents, as of today, the most complete analysis of single-epoch NuSTAR spectra of nearby, heavily obscured AGNs.
In using borus02 with as a free parameter, we followed the approach adopted by Baloković et al. (2018) when fitting single-epoch NuSTAR observations. Therefore, for each object we performed a set of 36 fits, in each of which we kept fixed: in each iteration, we increased the log() value by 0.1, starting from log()=22 and stopping at log()=25.5, i.e., the lower and upper boundaries of the parameter in borus02. We then assumed as best-fit the one corresponding to the minimum fit. Furthermore, we also report in Appendices B and C the confidence contours of against the line-of-sight column density and log(), respectively. As can be seen, we find no evidence of degeneracy between and either of the two column densities, and in the vast majority of the cases we are able to reliably constrain all three parameters.
To avoid complications in the spectral fitting caused by potential degeneracies between the torus covering factor, , the torus average column density, , and the angle between the observer and the torus axis, , we also decided to fix this last parameter to its upper boundary, =87°, i.e., we assume that the torus is observed almost edge-on. Notably, this same approach was adopted in Brightman et al. (2015), and allows one to explore all the possible covering factor solutions.
We report the best-fit spectra obtained using borus02 having as a free parameter in Appendix A, and the corresponding best-fit parameters in Table 4: as can be seen, RBS 1037 is the only source in our sample for which is completely unconstrained. This is not an unexpected result, since RBS 1037 is one of the two unobscured AGNs in our sample. Notably, we find a similar result for the other unobscured AGN in our sample, MCG-01-30-041, for which we obtain a best-fit value, but with large uncertainties (=0.62). We also find that NGC 424 and NGC 1068 are best-fitted with two reprocessed components, having same covering factor but different : notably, for both sources it has already been proposed in the literature either a reprocession-dominated scenario (for NGC 424, see Baloković et al., 2014) or a multi-reprocessed component scenario (for NGC 1068, see Bauer et al., 2015).
We also point out that NGC 6240 is a well known dual AGN (see, e.g. Puccetti et al., 2016): in our analysis we use XMM-Newton and NuSTAR data for this source, and we therefore do not resolve the two nuclei, thus implying that our measurement of for NGC 6240 should be treated as an average of for the two nuclei. Notably, our best-fit parameters are in excellent agreement with those obtained by Puccetti et al. (2016) fitting the combined Chandra, NuSTAR and XMM-Newton spectrum. Furthermore, to test the reliability of our assumption, we simulate two different XMM-Newton+NuSTAR spectra of NGC 6240, using the best-fit parameters of the two cores, as observed with Chandra and reported in Puccetti et al. (2016). In one simulation, we fix the covering factor of the Southern core (three times more luminous than the the Northern one) to =1, and that of the Northern core to =0.11; in the second, we do the opposite (i.e., =0.11 and =1). In both simulations, we fix the average torus column density to log()=24.2, i.e., the best-fit value we obtain in our analysis, We then fit the simulated spectra with a single- model: we find that in both cases the spectra are best-fitted by a model having f_{c}$$\sim0.5–0.60.1. This test suggests that the measurement we obtain for NGC 6240 can be treated as the average of the covering factors of the two nuclei: since for NGC 6240 we measure a covering factor =0.75, it is therefore likely that both AGNs have large covering factors.
To further investigate the relation between and both and , we divide the 33 obscured AGNs in our sample in three different classes, based on their covering factor best-fit value and 90% confidence uncertainties:
High– sources (red circles in Figure 3): objects having 90% confidence lower boundary 0.55. 12 sources belong to this group. 2. 2.
Low– sources (blue squares): objects having 90% confidence upper boundary 0.45. 8 sources belong to this group. 3. 3.
Undefined– sources (black stars): objects which do not belong to any of the two previous classes, mostly because of their large uncertainties on . 13 sources belong to this group.
In Figure 3, left panel, we show the covering factor as a function of the line-of-sight column density: no clear trend can be immediately identified, especially around and above the Compton thick regime, where we observe both low– and high- sources. Particularly, it is worth noting that all low- objects have ()23.9. However, as shown in Figure 3, central panel, all eight low– sources have best-fit ()24.1, i.e., the average column density of the torus is not Compton thick in all sources but NGC 4945, where is just above the CT-threshold. 8 out of 11 high– sources (NGC 1068 is not included in this computation, since it has two different best-fit ) have instead ()24, i.e., their obscuring torus is on average Compton thick.
We parameterize the difference between the torus average column density and the line-of sight column density with
[TABLE]
We find that in the low– sample the offset between the two column densities is large, being almost one order of magnitude (\langle$$\Delta N_{\rm H,low-f_{c}}$$\rangle=0.82, with standard deviation =0.25). In all eight sources, the average column density is smaller than the line-of-sight column density. Consequently, the low covering factor values measured in these objects can be linked to a “patchy torus” scenario, where the accreting SMBH is observed through an over-dense (with respect to the overall gas distribution) obscuring region.
On the basis of this result, the eight low– objects can be promising candidates for long-term monitoring campaigns, with the aim of detecting significant flux and variability. In fact, in a patchy torus the line-of-sight obscuration is caused by an over-dense, Compton-thick cloud located in a less-dense, Compton-thin environment. In such a scenario, a monitoring campaign can allow one to observe a significant flux and/or line-of-sight column density variation (see, e.g., the case of NGC 1365 in Risaliti et al., 2005). Notably, one of these eight sources, NGC 4945, is already known to show strong 10 keV variability (see Section 6.2 for a more detailed discussion).
While all the low– sources have best-fit ()24.1, eight out of 11 high– sources (i.e., 73% of the high– subsample) have best-fit ()24. Interestingly, two out of the three objects with high and ()24 are among the least obscured sources in our sample, namely 2MASXJ10523297+1036205 and MRK 477, thus suggesting a tighter correlation between and than the one observed in the low– subsample. In fact, the average offset between the two column densities is \langle$$\Delta N_{\rm H,high-f_{c}}$$\rangle=0.53, with standard deviation =0.20.
In conclusion, we find potential evidence of correlation between the torus covering factor and the difference between the average torus column density and the line-of-sight column density, supporting a scenario where sources with low are more likely to have a patchy torus, while sources with high are more likely to be obscured by a more uniform distribution of gas.
6.1. Effects on and with respect to the MYTorus configuration
In 27 out of 35 sources (77.1% of the whole sample) we find that leaving free to vary does not affect significantly the measurement of the line-of-sight column density, i.e., the measurement of with borus02 in the free– configuration is consistent, within the 90% confidence uncertainties, with the one obtained using MYTorus.
Six out of the eight sources for which instead we find a significant disagreement between the two measurements show a significant improvement in the fit statistics (\Delta$$\chi^{2}=[8.5–35.3]): we flag these sources with B in Table 4, and we assume that for these objects the measurements obtained with borus02 should be treated as the best-fit solutions. This is particularly interesting for three of these six objects, namely MCG+08-03-018, ESO 201-IG004 and CGCG 420–15, which were found to have ()24 using MYTorus and are instead re-classified as CT-AGNs using borus02, although only CGCG 420-15 has ()24 at a 3 confidence level. Based on these new measurements, we find that 19 out of 35 candidate CT-AGNs (i.e., 54% of the sources in our sample) are confirmed CT-AGNs, while other three sources (IGR J14175-4641, NGC 5728 and ESO 464-G016) have ()24 but their 90% confidence upper uncertainty lie above the CT threshold. In none of the eight sources with a significant discrepancy in the measurement the difference in line-of-sight column density can be explained exclusively by a discrepancy in the measurement.
Finally, there is a general excellent consistency in the photon indices measurements, independently from the geometrical configuration assumed in borus02: in fact, 32 out of 35 sources (91.4% of the whole sample) have in agreement within the 90% confidence uncertainty. In one of the remaining three sources, NGC 4945, the disagreement is actually fairly small, being \Delta$$\Gamma/=0.06, where is the smallest of the two photon index measurements. The remaining two objects (NGC 1194 and CGCG 420–15) also have different , and in both cases the fit is significantly improved (\Delta$$\chi^{2}=10.3 and \Delta$$\chi^{2}=34.1, respectively) in the fit where is left free to vary.
6.2. Comparison with previous results
NGC 4945 is one of the sources in our sample for which several measurements of the covering factor are reported in literature. Particularly, several works (Madejski et al., 2000; Done et al., 2003; Yaqoob, 2012; Puccetti et al., 2014) explained the significant variability observed in NGC 4945 above 10 keV, as well as the source weak reprocessed component, as two indicators of a low– scenario for this object. However, Brightman et al. (2015), using the BNTorus model (Brightman & Nandra, 2011) and its modified version with =1, sphere, found a high covering factor for NGC 4945, even consistent with =1. However, as pointed out by Liu & Li (2015), the BNTorus presents some issues in properly treating the AGN reprocessed component, therefore potentially leading to unreliable measurements. The existence of this issue was then confirmed in Baloković et al. (2018), and properly taken into account when developing borus02.
In our analysis with borus02 we find that the best-fit covering factor is pegged at the lower limit of the model, =0.10, in excellement agreement with the previous results reported in the literature. In Figure 4, left panel, we show how both and the best-fit vary as a function of the torus average covering factor: for ()24.1 a low– solution is preferred, the model best-fit regularly decreasing since reaching a minimum at \log$$N_{\rm H,tor}=24.1, where the best-fit statistic is =/d.o.f.=1404.1/1399=1.00. At \log$$N_{\rm H,tor}$$\geq24.2 we instead enter in the high– solution regime, which has a significantly worse best-fit statistics: in this regime, we find a local minimum at \log$$N_{\rm H,tor}=24.5, where =0.78. However, while this potential high- solution has a reasonable reduced , =/d.o.f.=1433.6/1399=1.03, the difference in between the two solutions, \Delta$$\chi^{2}=29.5, suggests that a low– solution is favored by our data.
Since NGC 4945 is known to be variable in intrinsic luminosity, and therefore the covering factor measurement is partially dependent on the observation used for the analysis, in our analysis we fitted the NuSTAR data alone, following the approach adopted by Brightman et al. (2015). Nonetheless, even multi-epoch studies with borus02 (Baloković et al. 2019 in prep.) find a low– solution (=0.30.1). In conclusion, our analysis favors a low- solution for NGC 4945, in agreement with several other works. This result also confirms that the issue in BNTorus reported by Liu & Li (2015), i.e., the tendency to overestimate the strength of the reprocessed component in an edge–on configuration, has been properly taken into account in borus02.
Another source, NGC 3079, was also part of the sample studied by Brightman et al. (2015). One of their BNTorus best-fit solutions implies a small covering factor, =0.18, but they also reported a potential second solution with f_{c}$$>0.90, and fitting the data with the sphere model, i.e., assuming =1, also led to a slightly improved best-fit statistics, from =1.33 to =1.31. In our work, we find that the best-fit covering factor, corresponding to a torus average column density ()=24.5, is =0.90, in good agreement with the second of the solutions reported in Brightman et al. (2015); the reduced of this solution is =194.2/181=1.07. However, as we show in Figure 4, right panel, assuming a slightly lower average torus column density, ()=24.3, leads to a small covering factor solution, =0.15; the reduced of this second solution is =201.8/181=1.11, with a difference \Delta$$\chi^{2}=7.6. Consequently, we find that a high covering factor solution for NGC 3079 is favored by our data, but a small covering factor cannot be ruled out at a 3 level.
Finally, the covering factor of NGC 7582 was recently measured by Baloković et al. (2018), using borus02 and fitting the NuSTAR data alone. As expected, since they used the same model we used in our analysis, their results are in excellent agreement with ours: they find a best-fit covering factor =0.9 and a torus average column density ()=24.5, while our best-fit result, obtained combining NuSTAR and Swift-XRT data, is =0.91 for ()=24.2. We point out that even assuming ()=24.5, as reported in Baloković et al. (2018), leads to a high covering factor, =0.9, although with a significantly worse best-fit .
Notably, the torus covering factor can be measured also using dusty torus models based on the mid-infrared (mIR; 7.5–13.5 m) spectral energy distribution (SED) fitting. Most of these models assume a clumpy distribution of the obscuring material (see, e.g., Rowan-Robinson, 1995; Nenkova et al., 2002, 2008; Hönig & Kishimoto, 2010; García-González et al., 2017), thus differing from both MYTorus and borus02, where the obscuring material is assumed to be uniformly distributed.
Alonso-Herrero et al. (2011) used the CLUMPY model Nenkova et al. (2008) to fit the infrared SED and measure the torus properties of a sample of 13 nearby Seyfert galaxies, among which there are also two objects we study in this work, NGC 1068 and NGC 7582. We find that for both sources there is a remarkable agreement between the value measured from the X-ray spectral fitting and the one inferred from the IR SED-fitting: more in detail, NGC 1068 has =0.400.01 and =0.30, while NGC 7582 has =0.91 and =0.83.
6.3. Covering factor trend with 2-10 keV luminosity
In Figure 5, left panel, we plot the torus covering factor as a function of the de-absorbed 2–10 keV luminosity for the 31 objects in our sample with ()23. As in Figure 3, the sources are divided in high– objects (red circles), low– objects (blue squares) and undefined– objects (black stars). Since no clear trend between the two quantities is immediately visible in our sample, we measure the difference in average L2-10keV between the high– and the low– sample. The eleven high– sources with ()23 have average 2–10 keV luminosity =42.84, with standard deviation =0.57. The eight low– sources with ()23, instead, have =43.58, with =0.72. When we perform a KS-test, we find that the hypothesis that the two samples are drawn from the same population can be rejected at the 2.5 level (p-value=0.018), a (marginal) evidence of the existence of different luminosity trends in high– and low– sources.
While the overall distribution has large dispersion and only a marginal visible trend, when we compute the weighted average of in five different bins we find significant evidence of anti-correlation in our sample: as can be seen in Figure 5, right panel, at (L2-10keV)43 the average covering factor (green diamonds) value is f_{c}$$\sim0.6–0.8, while at (L2-10keV)43 the average covering factor value drops to f_{c}$$\sim0.2. At (L2-10keV)42.5, these results are in reasonable agreement with the trend reported in Brightman et al. (2015) using a sample of 8 CT-AGNs fitted with BNTorus, and plotted as a black dotted line. At lower luminosities, instead, we find an average covering factor \langle f_{c}\rangle$$\sim0.7, in significant disagreement with the expected f_{c}$$\sim1 reported by Brightman et al. (2015). We remind that our results are obtained with a sample 3.5 times larger than the Brightman et al. (2015) one, and that we made use of the borus02 model, rather than the BNTorus one.
In Figure 5, right panel, we also show the fraction of obscured AGN, =Nobs/Ntot, as a function of L2-10keV, computed by Burlon et al. (2011, black solid line) and Vasudevan et al. (2013, magenta dashed line). The Burlon et al. (2011) obscured fraction has been computed dividing the 15–55 keV luminosity function (XLF) of the obscured AGN by the overall XLF, while the Vasudevan et al. (2013) one is derived directly counting the number of obscured AGN with respect to the whole population, in each bin of luminosity. As can be seen, the two curves show a fair agreement over the whole luminosity range, peaking at log(L42.5–43 and declining significantly both at lower and at higher luminosities. A trend similar to the one observed in these two works has also been recently observed by Ricci et al. (2017b), using a complete sample of 731 AGNs from the 70–month Swift-BAT catalog. The existence of a luminosity-dependent covering factor in CT-AGNs was also mentioned in Boorman et al. (2018), as a potential cause for the observed anti-correlation between the Fe K equivalent width and the AGN bolometric luminosity.
Both curves have been computed from a sample of bright BAT-selected AGNs in the local Universe, and can therefore be compared with our results, since our sample has been selected in the same way. Furthermore, the of a source is also an indicator of the probability to observe that source as obscured (the higher the covering factor, the higher the probability), therefore and may in principle be directly compared. As for the anti-correlation between and , we find some tentative agreement between our weighted average data and the measured fractions of obscured AGNs, particularly with the Vasudevan et al. (2013) one.
Finally, in Figure 5, right panel, we also plot the intrinsic fraction of CT-AGNs derived in two different works: the magenta circle is the measurement in the redshift range 0.04<$$z$$<1 made by Lanzuisi et al. (2018), which computed the intrinsic CT fraction using the Chandra COSMOS-Legacy(Civano et al., 2016; Marchesi et al., 2016a) AGN sample; the orange square is instead the one derived by Ricci et al. (2015) using the 70-month BAT catalog and assuming a torus opening angle =60°. As can be seen, both measurements are in good agreement with both our result and the obscured AGN fractions measured by Burlon et al. (2011) and Vasudevan et al. (2013).
7. Conclusions
In this work, we analyzed the combined 2–100 keV spectra of 35 AGNs selected in the 100-month BAT catalog. These objects have been selected among those candidate CT sources in the 100-month BAT catalog having an archival NuSTAR observation. In this work, we used only single-epoch NuSTAR observations. 30 out of 35 sources were already analyzed in Marchesi et al. (2018) using MYTorus. We report the main results of our analysis.
Among the five sources not studied in M18, three (ESO 116-G018, NGC 1358 and NGC 7479) are confirmed to be CT-AGNs at a 3 level. A fourth object, Mrk 3, is found to have best-fit line-of-sight column density =(7.80.1)1023 cm*-2*, slightly below the CT threshold: this source is known to be highly variable, having line-of-sight column density varying in the range =[0.75–0.94] 1024 cm*-2* in a timespan of seven months. Finally, we find that MCG-01-30-041, a candidate CT-AGN reported by Vasudevan et al. (2013), is in fact an unobscured AGN (N_{\rm H,z}$$<1022 cm*-2*). This discrepancy is likely caused by the low quality of the Swift-XRT and Swift-BAT data fitted by Vasudevan et al. (2013). 2. 2.
For all the 35 sources in our sample, we compared the best-fit line-of-sight column density obtained using MYTorus with those obtained using the new borus02 with the same geometrical configuration of MYTorus, i.e., fixing the torus covering factor to =0.5. We find that there is a general excellent agreement between the value obtained using borus02 and the one obtained using MYTorus (see Figure 2, left panel). While this trend is driven by the non-CT population, the weaker, albeit existent correlation observed in CT sources is not unexpected, given the increasing complexity in properly constrain the AGN spectral parameters in the CT-regime since above the CT threshold the . Nonetheless, 11 out of 16 sources confirmed CT-AGNs have values in agreement at the 90% confidence level. 3. 3.
We find an overall remarkable agreement between the photon indeces obtained using MYTorus and those measured with borus02 in the same geometrical configuration of MYTorus (see Figure 2, right panel). 29 out of 35 sources have consistent with within the 90% confidence uncertainty. 4. 4.
After validating borus02 showing its excellent agreement with MYTorus, we used it to measure the torus covering factor and average column density for the 35 objects in our sample. We find 12 high– sources, i.e., objects having 90% confidence lower boundary 0.55; 8 low– sources, i.e., objects having 90% confidence lower boundary 0.45; and 15 undefined– sources, i.e., objects do not belonging to either of the two groups. 5. 5.
We find a tentative evidence of different trends between and the difference between the average torus column density and the line-of-sight column density: the offset is larger in low– objects , where the average column density is always smaller than the line-of-sight column density, than in high– objects. These results are consistent with a scenario where low– AGNs are more likely to have a patchy torus, while high– AGNs are more likely to be obscured by a more uniform distribution of gas. 6. 6.
In 6 out of 35 sources, leaving to vary leads to a significant variation in the line-of-sight column density measurement, and a corresponding significant improvement in the best-fit value. Interestingly, three of these objects (MCG+08-03-018, ESO 201-IG004 and CGCG 420–15), which were found to have ()24 using MYTorus, are now re-classified as CT-AGN on the basis of the borus02 modelling. Overall, 19 out of 35 candidate CT-AGNs (54% of the sources in our sample) are confirmed CT-AGNs. 7. 7.
We find that our data favors a low– solution for NGC 4945 (f_{c}$$<0.22), in agreement with previous results based on the strength of the reprocessed component and the observed strong variability at energies 10 keV. 8. 8.
We find potential evidence of an inverse trend between the torus covering factor and the AGN 2–10 keV luminosity (Figure 5, right panel), i.e., sources with higher values have on average lower luminosities, although the dispersion in sources in the same range of luminosity is large. Our results partially disagree, in the low-luminosity regime, with the findings of Brightman et al. (2015), since we observe a flattening in the anti-correlation at Log(L2-10keV)42.5, while they observed a more regular trend, implying that the vast majority of CT-AGN should have f_{c}$$\sim1 at Log(L2-10keV)42. However, their analysis was performed using a sample of only 8 sources, while we have 31 objects with ()23. The trend we observe needs however to be validated using a larger sample of sources, all observed with NuSTAR to properly constrain both and L2-10keV.
Acknowledgements
We thank an anonymous referee for the useful comments, which helped in improving the paper.
S.M., M.A., and X.Z. acknowledge funding under NASA contract 80NSSC17K0635. Mi.Ba. acknowledges support from the Black Hole Initiative at Harvard University, which is funded by a grant from the John Templeton Foundation. This work made use of data supplied by the UK Swift Science Data Centre at the University of Leicester, as well as of the TOPCAT software (Taylor, 2005) for the analysis of data tables.
Appendix A A. borus02 best-fit spectra
We report in Figures 6–11 the unfolded spectra and data-to-model ratios of all the 35 sources in our sample. The best-fit models are those obtained using borus02 with the covering factor left free to vary: the best-fit parameters of these spectra are reported in Table 4.
Appendix B B. Confidence contours of the torus covering factor versus the line-of-sight column density
We report in Figures 12–17 the confidence contours of the covering factor, , versus the line-of-sight column density, , for 32 sources out of the 35 in our sample. We do not report the contours of NGC 1068 and NGC 7582, where we fix the line-of-sight column density to =1025 cm*-2*, and of RBS 1037, which is an unobscured AGN where is unconstrained.
Appendix C C. Confidence contours of the torus covering factor versus the torus average column density
We report in Figure 18–23 the confidence contours of the covering factor, , versus the logarithm of the torus average density, Log(), for 31 sources out of the 35 in our sample. We do not report the contours of NGC 424 and NGC 1068, which are best-fitted by a multi-reprocessed component and therefore have more than one best-fit Log() (see Table 4), and those of MCG-01-30-041 and RBS 1037, the two unobscured AGNs in our sample, because and/or Log() are unconstrained.
The reference list from the paper itself. Each links out to its DOI / PubMed record.
- 1Ajello et al. (2008) Ajello, M., Greiner, J., Sato, G., et al. 2008, Ap J, 689, 666
- 2Alonso-Herrero et al. (2011) Alonso-Herrero, A., Ramos Almeida, C., Mason, R., et al. 2011, Ap J, 736, 82
- 3Anders & Grevesse (1989) Anders, E. & Grevesse, N. 1989, Geochim. Cosmochim. Acta, 53, 197
- 4Annuar et al. (2015) Annuar, A., Gandhi, P., Alexander, D. M., et al. 2015, Ap J, 815, 36
- 5Arnaud (1996) Arnaud, K. A. 1996, in Astronomical Society of the Pacific Conference Series, Vol. 101, Astronomical Data Analysis Software and Systems V, ed. G. H. Jacoby & J. Barnes, 17
- 6Awaki et al. (2009) Awaki, H., Terashima, Y., Higaki, Y., & Fukazawa, Y. 2009, PASJ, 61, S 317
- 7Baloković et al. (2018) Baloković, M., Brightman, M., Harrison, F. A., et al. 2018, Ap J, 854, 42
- 8Baloković et al. (2014) Baloković, M., Comastri, A., Harrison, F. A., et al. 2014, Ap J, 794, 111