Joint X-ray, EUV and UV Observations of a Small Microflare
Iain G. Hannah, Lucia Kleint, S\"am Krucker, Brian W. Grefenstette,, Lindsay Glesener, Hugh S. Hudson, Stephen M. White, David M. Smith

TL;DR
This study presents the first simultaneous X-ray, UV, and EUV observations of a small solar microflare, revealing its thermal properties and chromospheric impact, and demonstrating the multi-wavelength complexity of microflare phenomena.
Contribution
It provides the first joint multi-wavelength observation of a small microflare, combining X-ray, UV, and EUV data to analyze its thermal and chromospheric characteristics.
Findings
Microflare peaks observed in X-ray, UV, and EUV wavelengths.
Thermal spectrum fitted with 5.8 MK temperature and 10^26 erg energy.
No non-thermal emission detected, possibly due to limited exposure.
Abstract
We present the first joint observation of a small microflare in X-rays with the Nuclear Spectroscopic Telescope ARray (NuSTAR), UV with the Interface Region Imaging Spectrograph (IRIS) and EUV with the Solar Dynamics Observatory/Atmospheric Imaging Assembly (SDO/AIA). These combined observations allows us to study the microflare's hot coronal and cooler chromospheric/transition region emission. This small microflare peaks from SOL2016-07-26T23:35 to 23:36UT, in both NuSTAR, SDO/AIA and IRIS. Spatially this corresponds to a small loop visible in the SDO/AIA Fe XVIII emission, which matches a similar structure lower in the solar atmosphere seen by IRIS in SJI1330{\AA} and 1400\AA. The NuSTAR emission in both 2.5-4 keV and 4-6 keV, is located in a small source at this loop location. The IRIS slit was over the microflaring loop, and fits show little change in Mg II but do show intensity…
Click any figure to enlarge with its caption.
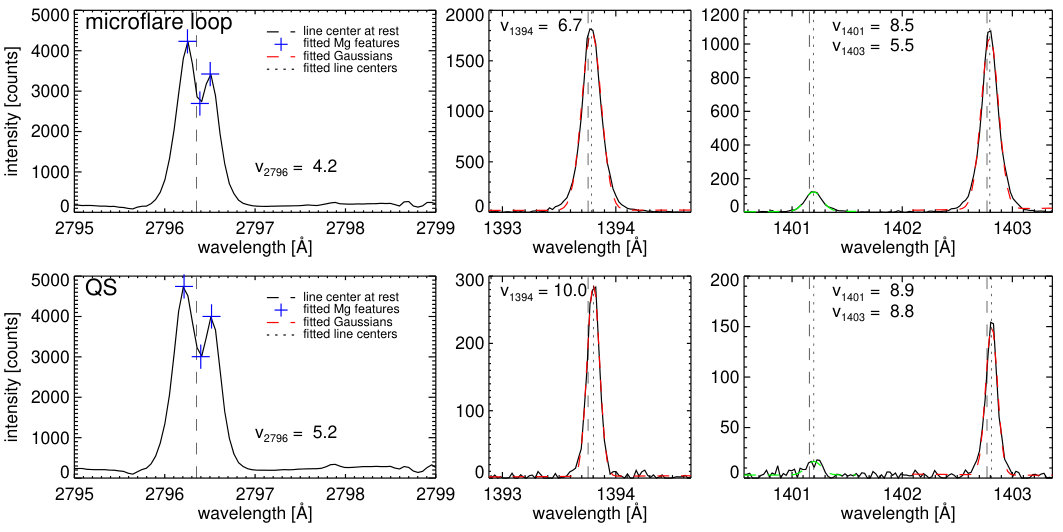 Figure 1
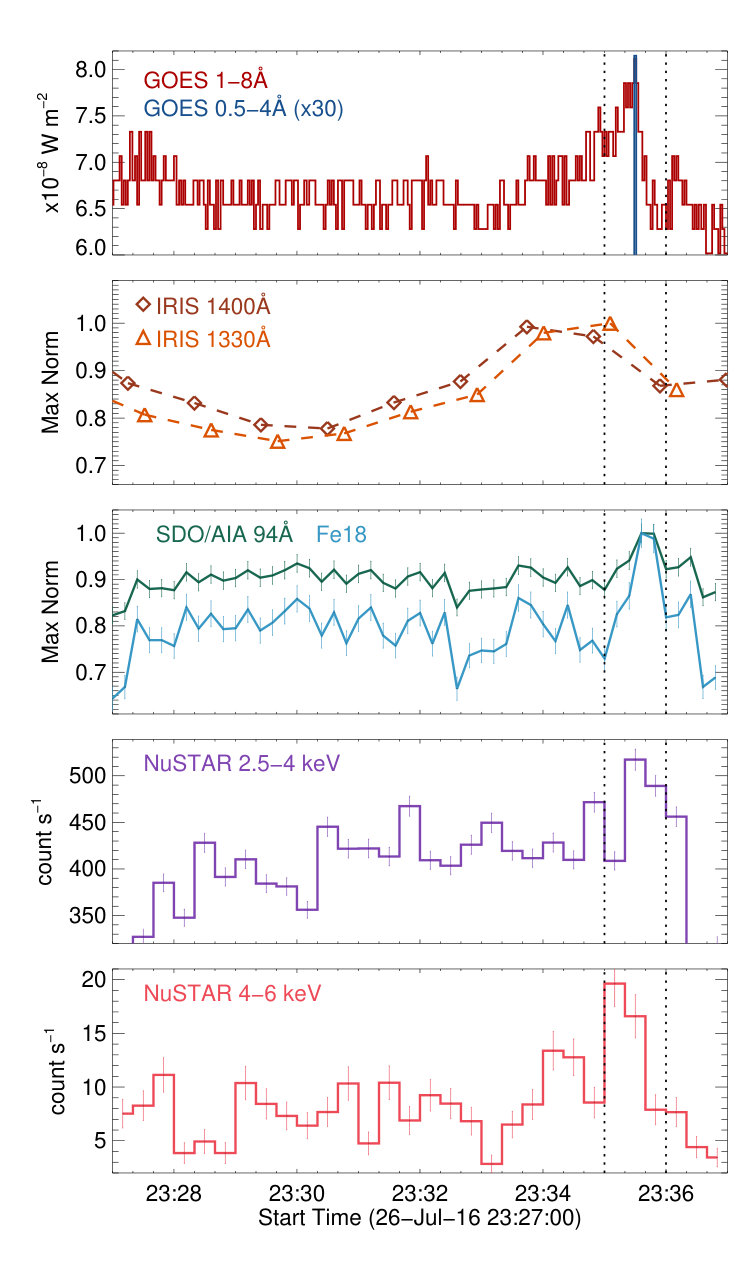 Figure 2
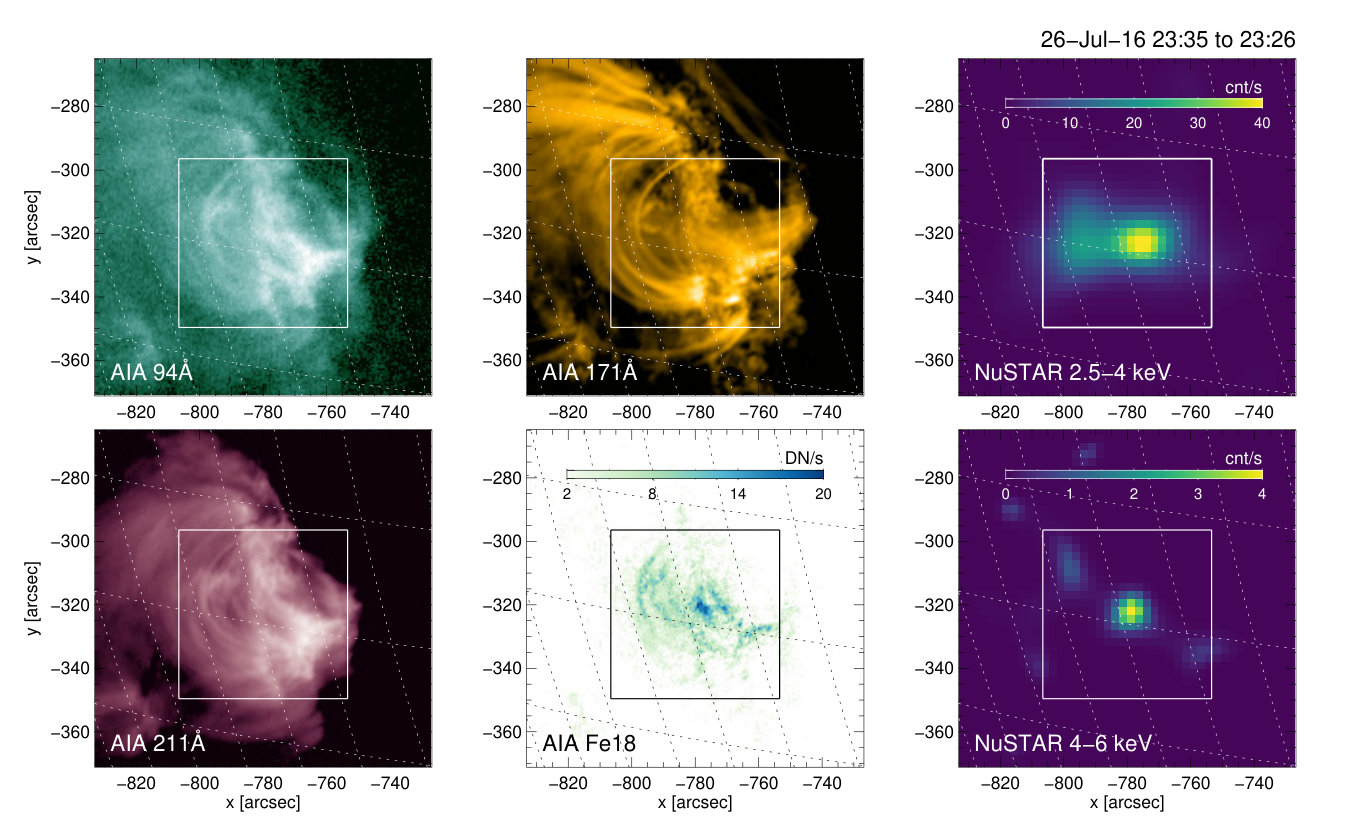 Figure 3
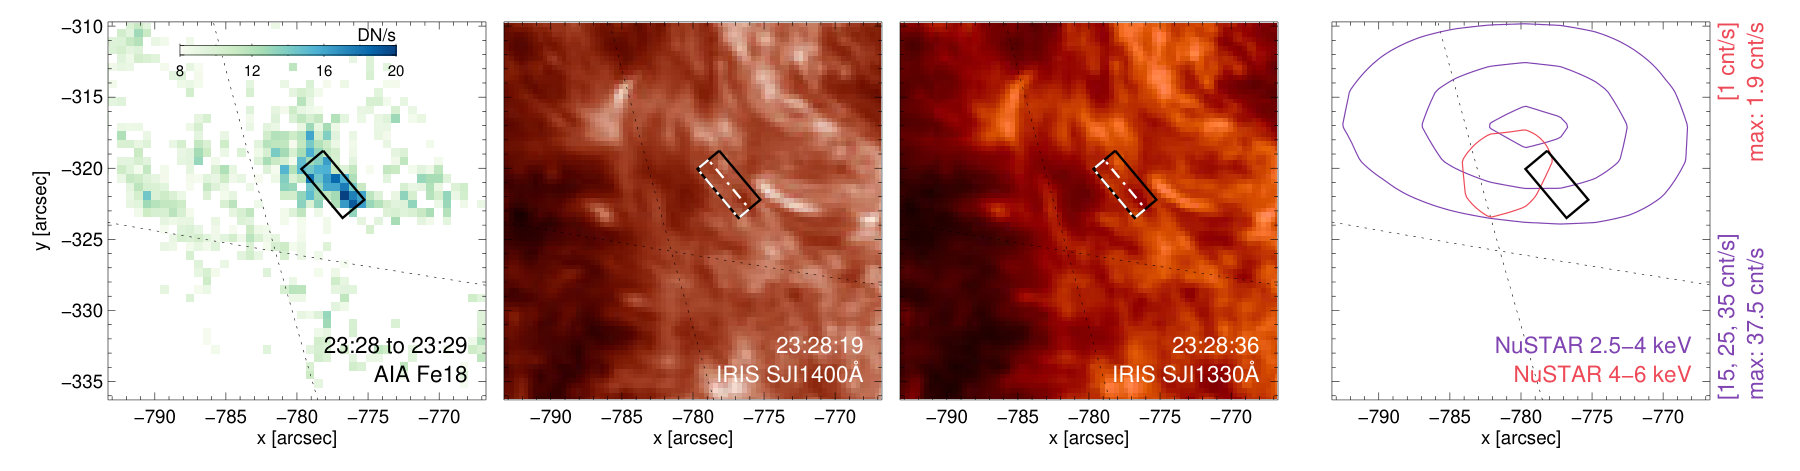 Figure 4
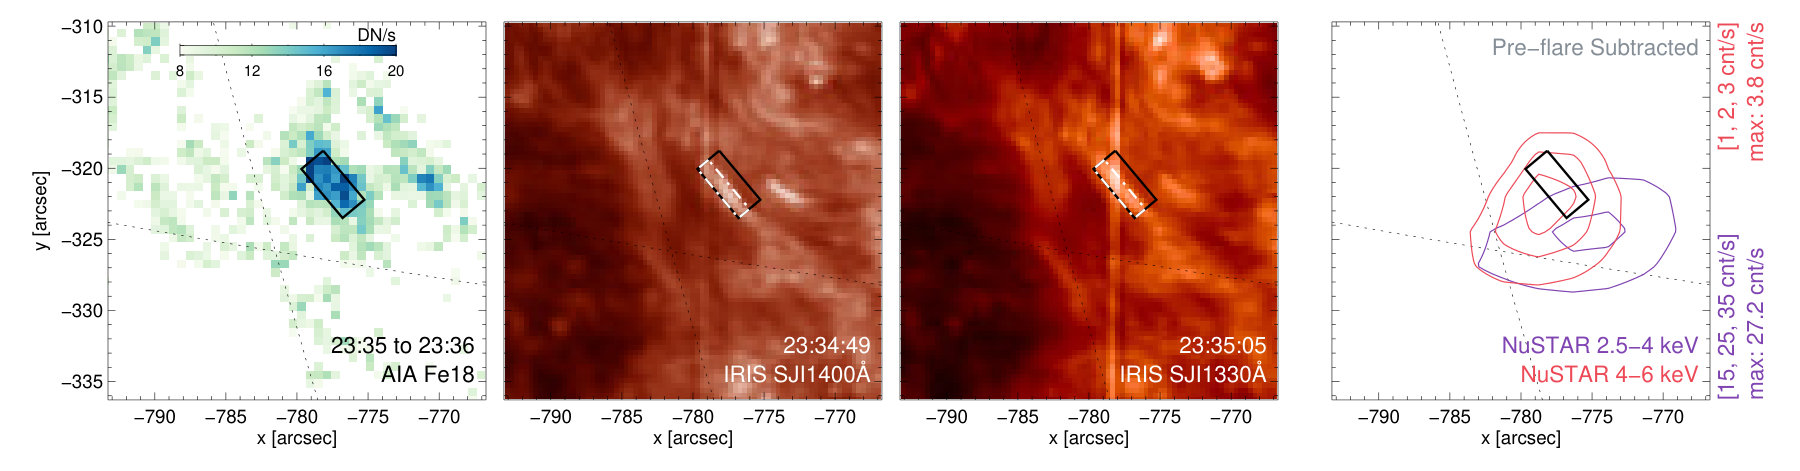 Figure 5
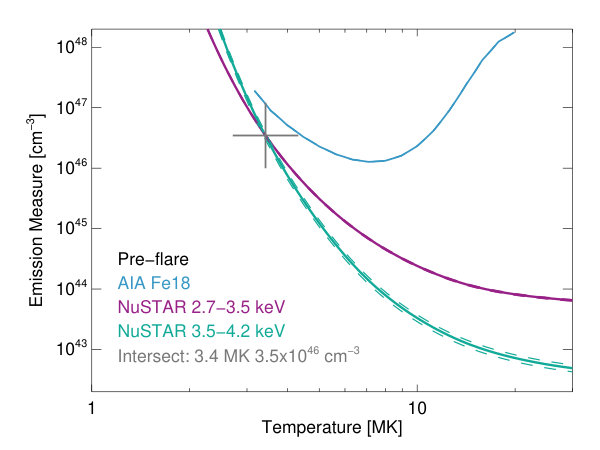 Figure 6
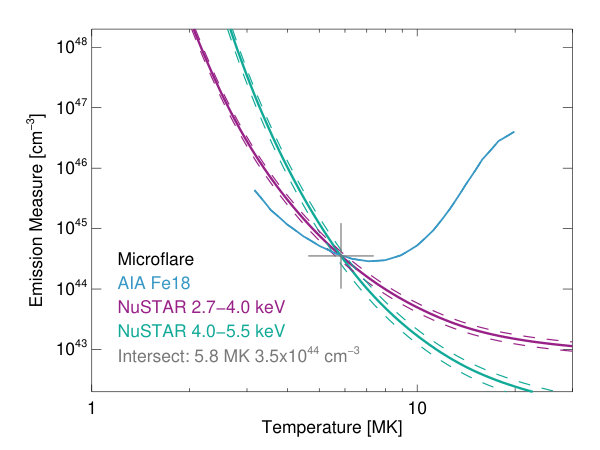 Figure 7
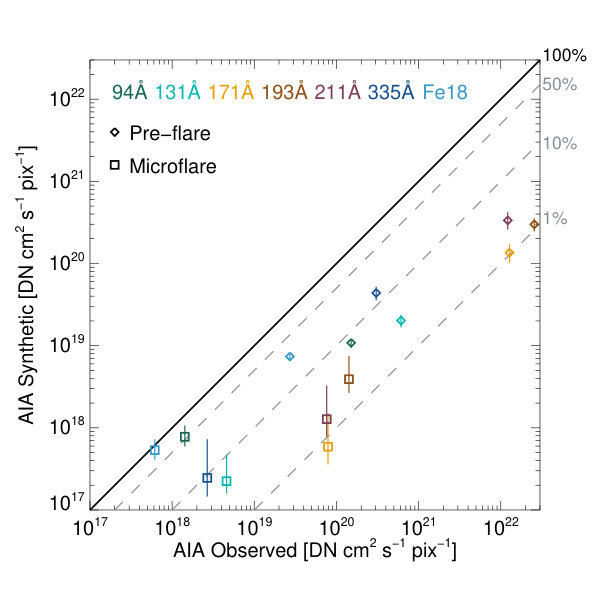 Figure 8
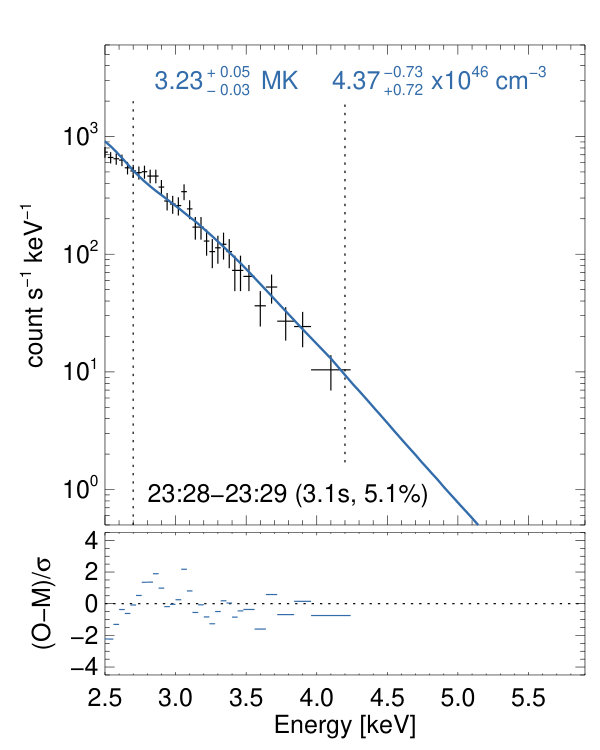 Figure 9
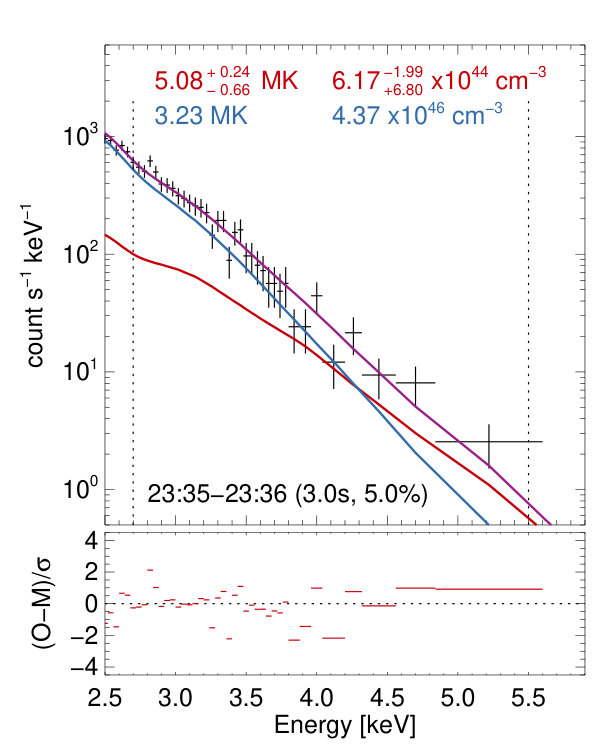 Figure 10
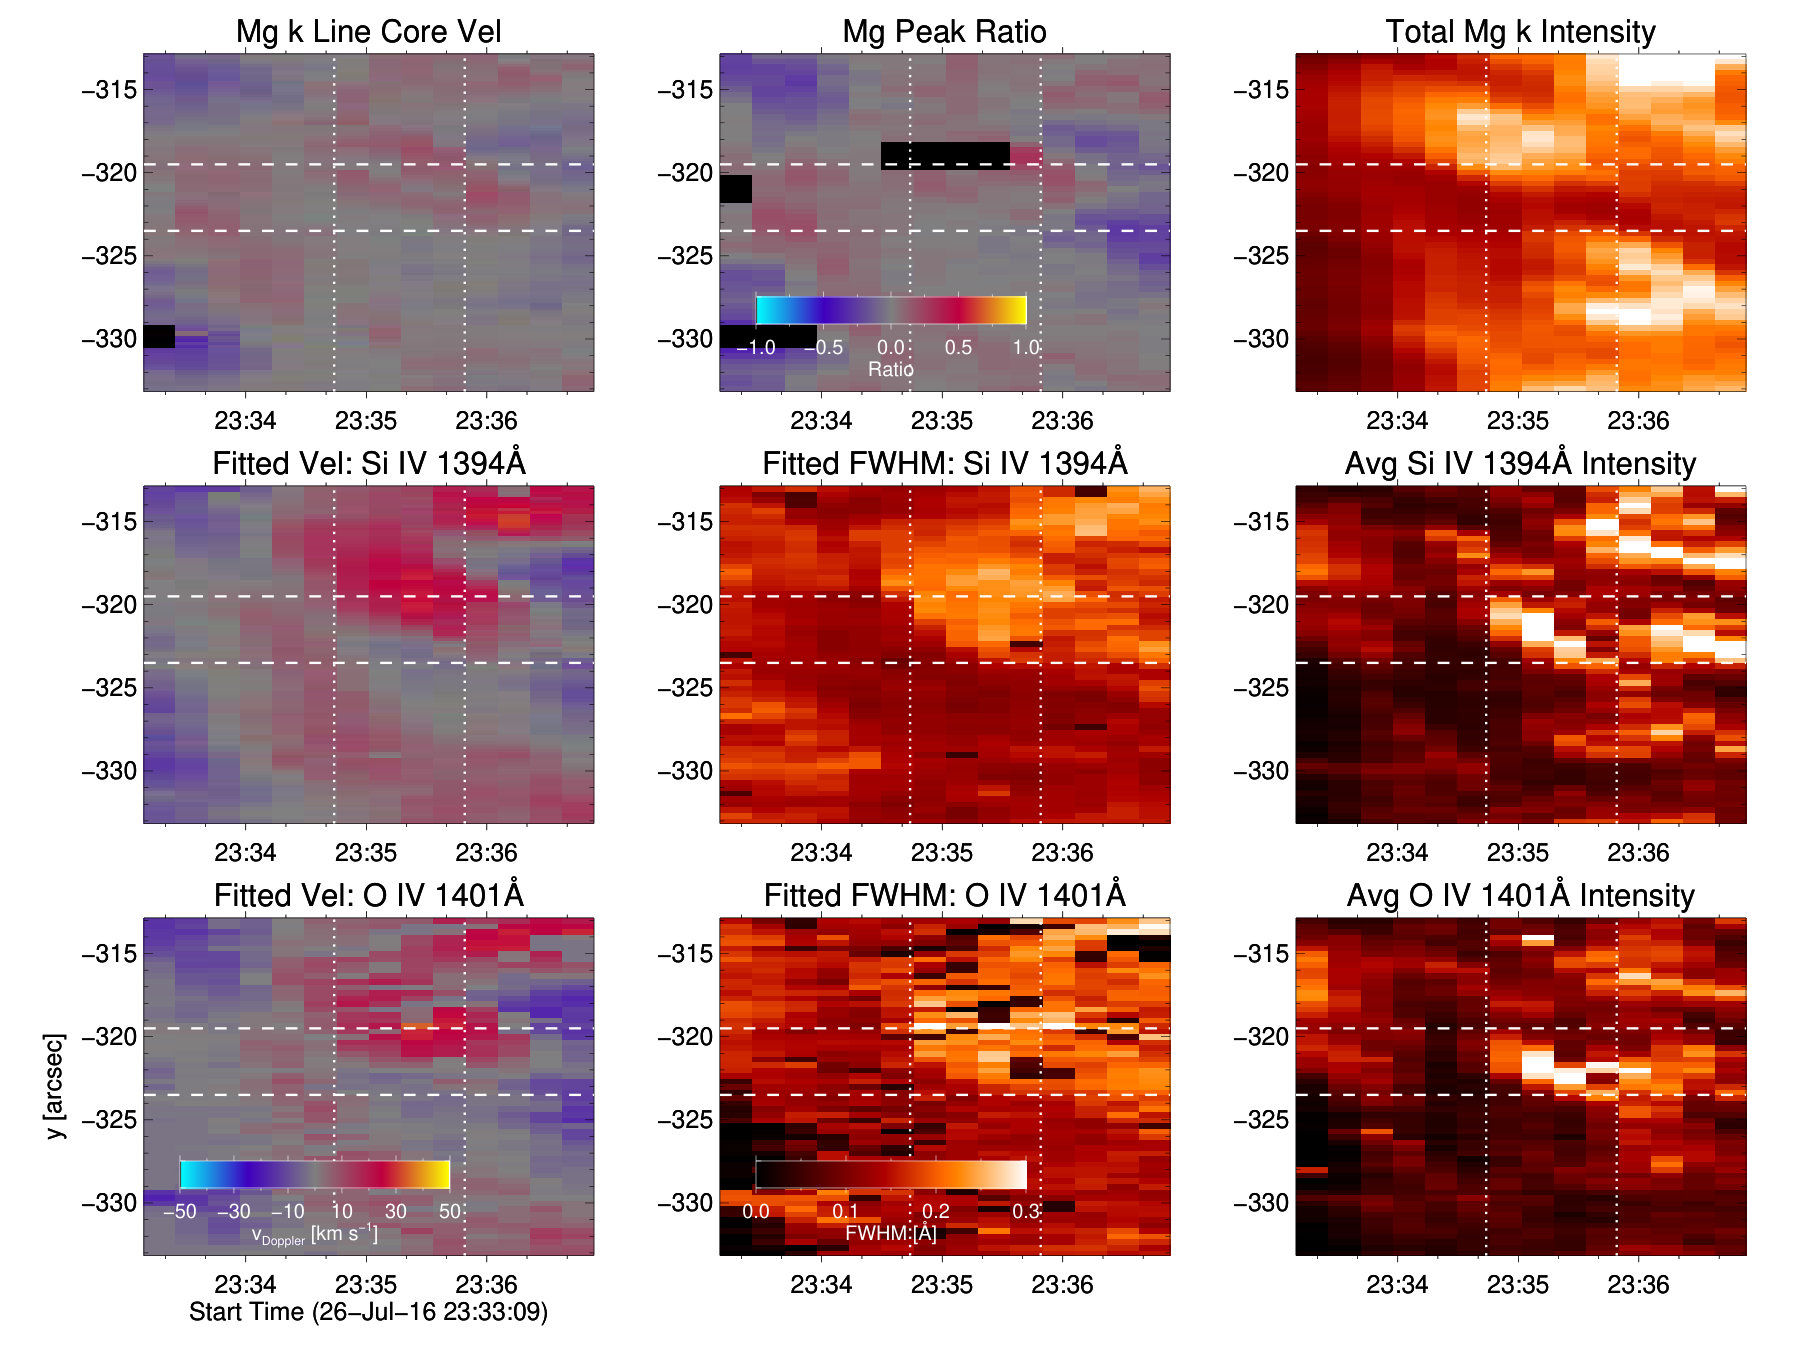 Figure 11
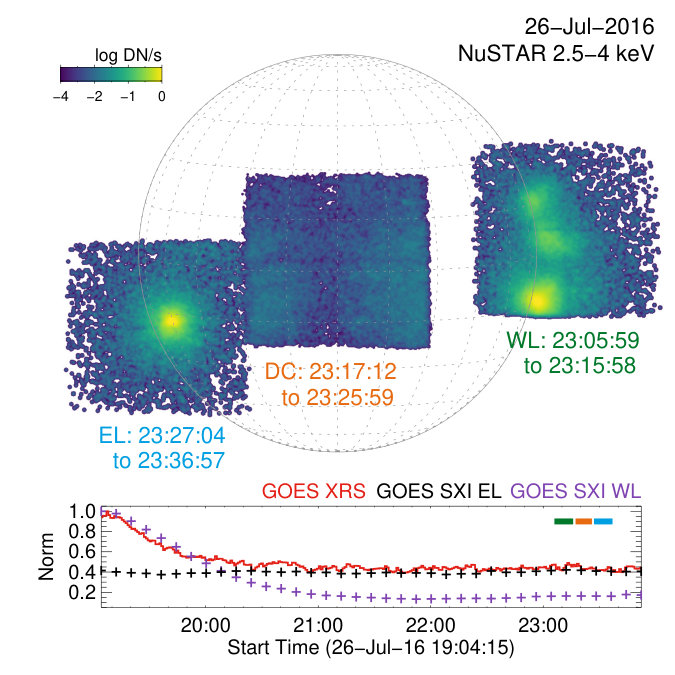 Figure 12
Peer Reviews
No public reviews on file for this paper yet. If you reviewed it on a platform where reviews are public (OpenReview, ICLR, NeurIPS, ICML), you can paste yours below so the community can read it here.
Videos
No videos yet. Explain this paper in a talk, walkthrough, or lecture? Add one.
Joint X-ray, EUV and UV Observations of a Small Microflare
SUPA School of Physics & Astronomy, University of Glasgow, Glasgow G12 8QQ, UK
Lucia Kleint
University of Applied Sciences and Arts Northwestern Switzerland, 5210 Windisch, Switzerland
Leibniz-Institut für Sonnenphysik (KIS), Schöneckstrasse 6, 79104 Freiburg, Germany
Säm Krucker
University of Applied Sciences and Arts Northwestern Switzerland, 5210 Windisch, Switzerland
Space Sciences Laboratory University of California, Berkeley, CA 94720, USA
Brian W. Grefenstette
Cahill Center for Astrophysics, 1216 E. California Blvd, California Institute of Technology, Pasadena, CA 91125, USA
Lindsay Glesener
School of Physics & Astronomy, University of Minnesota - Twin Cities, Minneapolis, MN, 55455, USA
Hugh S. Hudson
SUPA School of Physics & Astronomy, University of Glasgow, Glasgow G12 8QQ, UK
Space Sciences Laboratory University of California, Berkeley, CA 94720, USA
Stephen M. White
Air Force Research Laboratory, Space Vehicles Directorate, Kirtland AFB, NM 87123, USA
David M. Smith
Santa Cruz Institute of Particle Physics and Department of Physics, University of California, Santa Cruz, CA 95064, USA I. G. Hannah [email protected]
Abstract
We present the first joint observation of a small microflare in X-rays with the Nuclear Spectroscopic Telescope ARray (NuSTAR), UV with the Interface Region Imaging Spectrograph (IRIS) and EUV with the Solar Dynamics Observatory/Atmospheric Imaging Assembly (SDO/AIA). These combined observations allow us to study the hot coronal and cooler chromospheric/transition region emission from the microflare. This small microflare peaks from 2016 Jul 26 23:35 to 23:36UT, in both NuSTAR, SDO/AIA and IRIS. Spatially this corresponds to a small loop visible in the SDO/AIA Fe XVIII emission, which matches a similar structure lower in the solar atmosphere seen by IRIS in SJI1330Å and 1400Å. The NuSTAR emission in both 2.5-4 keV and 4-6 keV, is located in a source at this loop location. The IRIS slit was over the microflaring loop, and fits show little change in Mg II but do show intensity increases, slight width enhancements and redshifts in Si IV and O IV, indicating that this microflare had most significance in and above the upper chromosphere. The NuSTAR microflare spectrum is well fitted by a thermal component of 5.1MK and cm*-3*, which corresponds to a thermal energy of erg, making it considerably smaller than previously studied active region microflares. No non-thermal emission was detected but this could be due to the limited effective exposure time of the observation. This observation shows that even ordinary features seen in UV can remarkably have a higher energy component that is clear in X-rays.
Sun: X-rays, gamma rays — Sun: UV radiation — Sun: activity — Sun: corona
††facilities: NuSTAR, IRIS, SDO/AIA, GOES
1 Introduction
Microflares are small releases of stored magnetic energy in the solar atmosphere that heat material and accelerate particles. Energetically, they are down to a million times smaller than the largest events, yet still demonstrate similar properties (Hannah et al., 2011). The smaller microflares range down to GOES A-Class events, with 1-8Å flux Wm*-2*, and are considerably more frequent than the largest flares. The frequency distribution of flares is a negative power-law with index (Hudson, 1991). However, it is still not clear down to what energy scales this rate persists, a crucial fact to determine the overall contribution of micro-, or even smaller, nanoflares, to heating the solar corona.
X-ray observations of microflares provide clear diagnostics of the energetics of the heated material and accelerated electrons. Above a few keV this is predominantly bremsstrahlung continuum emission and RHESSI (Lin et al., 2002) showed that microflares down to the GOES A1 level exhibit non-thermal footpoints, at the ends of coronal loops containing material MK (Krucker et al., 2002; Hannah et al., 2008b). A large statistical study of RHESSI microflares (Christe et al., 2008; Hannah et al., 2008a) showed that these RHESSI events were exclusively in active regions, lasted for a few minutes, were not necessarily spatially small, had emission MK, and over the initial impulsive period had median thermal energy erg and non-thermal erg.
Going beyond RHESSI, the Nuclear Spectroscopic Telescope ARray NuSTAR (Harrison et al., 2013) is an astrophysics telescope with two direct focusing optics modules, and a higher effective area than RHESSI. It has targeted the Sun several times since the first pointing in late 2014 (Grefenstette et al., 2016), and has observed active region microflares as well as quiet Sun brightenings. These microflares are about an order of magnitude weaker than RHESSI could observe, down to an estimated GOES level of A0.1, and showed heating up to about 10MK, with thermal energies of erg (Wright et al., 2017; Glesener et al., 2017). These events were also well observed at longer wavelengths, in softer X-rays with Hinode/XRT and the Solar Dynamics Observatory/Atmospheric Imaging Assembly (SDO/AIA ). X-ray brightenings were also observed with NuSTAR outside of active regions in the quiet Sun, with temperatures of about 3-4MK, estimated GOES emission of A0.01 and thermal energy of about erg (Kuhar et al., 2018).
These microflares and brightenings did not show any non-thermal emission, but this is likely due to an observational constraint of using NuSTAR to observe the Sun. NuSTAR has a detector throughput of only 400 counts s*-1* telescope*-1*, which even low levels of solar activity can swamp (Grefenstette et al., 2016). This results in a detector livetime fraction considerably less than unity, and a greatly reduced effective exposure time. Given the steep nature of a typical solar X-ray spectrum, these short effective exposure times limit the spectral dynamic range, producing few, or no, counts at higher energies, the range in which non-thermal emission is expected (Hannah et al., 2016). The effective exposures of these NuSTAR observations were short because there were also other bright sources on the solar disk. Unfortunately even regions outside the NuSTAR field of view of 12’ 12’ can be detected and exacerbate the throughput issue (Grefenstette et al., 2016). Therefore the best observing conditions with NuSTAR are during periods of low overall solar activity, with the brightest feature within the NuSTAR field of view. Even with higher livetime NuSTAR observations there is still a limit to the sensitivity arising from the inherent short duration of these small flares.
Non-thermal emission is expected from small microflares as particle acceleration often features during magnetic reconnection, the energy release mechanism that is thought to be behind flares of all sizes. Even the smallest RHESSI microflares could show considerable non-thermal emission from accelerated electrons (Hannah et al., 2008b). Electrons accelerated in small impulsive events are thought to be behind coronal radio emissions such as Type I noise storms (Mercier & Trottet, 1997; Shibasaki et al., 2011), however it is considerably more difficult to obtain the electron energetics from the coherent radio emission, compared to X-rays, due to the non-linear nature of the emission mechanism processes. The presence of accelerated electrons in small events has also been inferred from UV observations with IRIS (De Pontieu et al., 2014). Rapid brightenings (over 10s of seconds) were observed at the footpoints of hot coronal loops (Testa et al., 2014). The observed blue-shifts (upflows) of the Si IV 1403Å line in these “moss” brightenings (Berger et al., 1999) are consistent with RADYN numerical simulations of chromosphere/transition region heating by a beam of accelerated electrons (a power-law of non-thermal energy erg, with spectral index above a cutoff of keV). Thermal conduction and Alfven waves could not reproduce the line shift, nor the intense brightening (Testa et al., 2014). This combination of RADYN simulations and UV observations were further shown to provide constraints to the properties of the non-thermal electrons (Polito et al., 2018). They found that the blue-shifts were dependent on both the non-thermal energy and the low energy cutoff otherwise red-shifts were produced; keV for erg, and keV for erg. This work showed that Mg II could also be used to help constrain the electron beam properties.
In this paper, we present observations of a small microflare that occurred on 2016 Jul 26 at 23:35 (SOL2016-07-26T23:35) in X-rays with NuSTAR , UV with IRIS and EUV with SDO/AIA , allowing us to study the heating of both the chromosphere/transition region and corona. In §2, we give an overview of the event, before going into detail about the spatial and temporal behaviour of the microflare in §3. Then in §4 we derive properties of the emission from both the IRIS and NuSTAR spectra. The thermal properties found from the NuSTAR spectra are compared to the emission observed by SDO/AIA and GOES/XRS
2 Observation Overview
The region that produced the microflare was observed by NuSTAR on 2016-Jul-26 between 23:27 and 23:37UT, towards the south-eastern limb. The region was never given an NOAA ID, but was identified as SPoCA 19717 (Verbeeck et al., 2014). This particular NuSTAR solar pointing111For an overview of NuSTAR solar pointings see http://ianan.github.io/nsovr had spent 3 hours focused on active regions on the opposite western limb as they rotated off the visible disk, occulting the brighter emission from the lower solar atmosphere. NuSTAR briefly pointed at disk centre, during which it observed a small quiet Sun event reported in Kuhar et al. (2018), before targeting the eastern region for 10 minutes. It then returned to the west limb for another hour. The resulting NuSTAR images are shown in Figure 1, as well a time profile of the full-disk soft X-ray emission seen by GOES/XRS 1-8Å and from just the occulted west limb (WL) and east limb (EL) using GOES/SXI “Be12a” wavelength. By the time NuSTAR is observing the eastern region it is the brightest X-ray source on the disk, with the other regions being well-occulted. Therefore, what is seen in the GOES/XRS full-disk emission should be dominated by the target region. Both the 1-8Å and 0.5-4Å channels of GOES/XRS show a small microflare between 23:35 to 23:36UT; see the top panel of Figure 2. This event peaks at GOES A8-level, but is only about an A1 excess above the pre-flare emission. The full time profile and spatial behaviour of the microflare in X-ray, EUV, and UV are shown in Figures 2, 3 and 4 will be discussed in the next section, §3. Hinode/EIS was also targeting this region, but at the time of the NuSTAR observations the slit was further to the east of the microflare, missing the hot material NuSTAR was detecting.
3 Spatial & Temporal Analysis
The SDO/AIA images of the region were processed to level 1.6 data, using the standard software to prep, as well as deconvolving the point spread function. Most of the EUV channels showed only weak emission from the region of interest, which barely changed over the 10 minutes. The 94Å channel did show a small loop and this brightened at the same time as the X-ray emission. We removed the cooler component of the 94Å channel via the approach of Del Zanna (2013), leaving just the emission above 3 MK from Fe XVIII . Overview images of the whole region in SDO/AIA 94Å, 171Å and 211Å, as well as Fe XVIII are shown in Figure 3 for the microflare time, 23:35 to 23:36UT. The region has extensive cooler emission, but the hotter emission, as indicated by Fe XVIII, is more compact with the small “loop” that brightens during the microflare time. A zoomed-in view of this emission, shown in the left-hand panels of Figure 4, gives both the pre-flare (23:28 to 23:29UT) and microflare (23:35 to 23:36UT) times, where the loop and the brightening becomes clearer. In both Figures 3 and 4, the SDO/AIA images shown here have been summed over 1 minute to improve the signal-to-noise ratio. The full 12s cadence images were used to determine the time profile of the EUV emission from just the brightening loop region. The resulting lightcurves (shown in the second top panel of Figure 2) clearly show a peak of emission, and just slightly after the X-ray microflare seen with GOES/XRS. Figure 4 does show that there is some increase in Fe XVIII outside of the loop considered however this emission is not as bright as the loop nor does it have the same time profile as the X-ray microflare. The 304Å channel had some features that brightened over the observation time but were not spatially or temporally correlated with the 94Å nor Fe XVIII emission.
IRIS co-observed the region from 2016-Jul-26 21:53:26 to 2016-Jul-27 02:47:17UT with 17 large, sparse, 64-step rasters (OBSID 3600110059) with steps of 1″, exposure times of 15s, and a factor 2 for spatial and spectral summing. All SJI filters (1330Å, 1400Å, 2796Å, 2832Å) were used, giving a cadence of 65 s for each SJI filter. For this paper, we analyze the 6th raster, taken from 23:19:57 to 23:36:59UT. We verified the remaining orbital variation to be below 0.2 km s*-1* in near UV during this raster, which is below our desired accuracy, and therefore we use the original raster with the newest calibrations (L12-2017-04-23) for the analysis without additional corrections. We align the SJI1400Å data to the SDO/AIA 1600Å data, which includes a 0.6∘ roll and a 2″ shift. There are multiple little bright loops in the IRIS SJI1400Å and SJI1330Å images, including one at exactly the same location, and of the same length and orientation of the microflaring loop seen in SDO/AIA Fe XVIII. This is shown in the middle panels of Figure 4. The lightcurves from this small UV loop (shown in Figure 2) indicate that it brightens but does so slightly before the time of the X-ray and EUV microflare. Crucially the IRIS slit moves across the loop during the time of the microflare, from 23:35 to 23:36UT, and this spectral analysis is detailed in §4.
The NuSTAR emission from the region is taken only from the FPMA telescope, as the FPMB telescope has the detector gap directly through the microflare. The NuSTAR data were filtered222For software to work with the NuSTAR solar data see https://github.com/ianan/nustar_sac to remove bad pixels, and non-grade 0 events to minimise detector pileup (Grefenstette et al., 2016). These observations were all made with pointing determined by a single Camera Head Unit (CHU3), so we can apply just one correction to the data. The NuSTAR pointing was aligned to the whole region seen in SDO/AIA Fe XVIII, not just the microflaring loop. The resulting lightcurves for the NuSTAR emission in 2.5-4 keV and 4-6 keV were found over this larger region (shown in Figure 3) and both energy ranges brighten during the microflare time. The emission peaks slightly earlier in the higher energy channel, consistent with flare heating followed by cooling. The NuSTAR images for both energy channels, and the pre-flare and microflare times, are shown as maps in Figure 3 and zoomed in contours in Figure 4. These images have been processed to deconvolve the point spread function however it will be only partially removed, so the NuSTAR images and contours are likely still larger than the true source size.
The NuSTAR images during the microflare (see Figure 3) show a bright source with centroid close to the Fe XVIII loop in both 2.5-4 keV and 4-6 keV. The 2.5-4 keV image does show a more extended structure which approximately matches the larger structure of fainter loops seen in Fe XVIII, to the east of the microflaring loop. To isolate the microflare source in the NuSTAR images from the “background” active region emission we subtracted the pre-flare images from the microflare images, shown in Figure 4. The pre-flare NuSTAR contours (top right panel Figure 4) show an extended 2.5-4 keV source, with centroid slightly to the north of the microflaring loop, and a weak compact 4-6 keV source near the loop. The NuSTAR microflare contours with the pre-flare subtracted (bottom right panel Figure 4) show a brighter compact source in 4-6 keV overlapping the microflaring loop location. This is unsurprisingly similar to the non-subtracted image (shown in Figure 3) as the pre-flare source in this energy range is very weak. The microflare is dominating the emission in the 4-6 keV energy range - something we further confirm via the NuSTAR spectral fitting in §4. There is a more substantial change in the pre-flare subtracted 2.5-4 keV image; the source of the excess emission due to the microflare is more compact with centroid very close to the loop position. This strengthens the argument that the X-ray microflare is coming from a source smaller than seen by NuSTAR and is highly likely to be the loop structure seen in EUV and UV. Although the NuSTAR 2.5-4 keV and 4-6 keV centroids do not perfectly align with each other, or the loop, this is not a significant difference as it is within the spatial resolution of NuSTAR - the full width at half-maximum of the optics’ point spread function is 18”.
4 Spectral Analysis
4.1 IRIS spectra
At the time of the NuSTAR observation the IRIS slit was over the microflaring loop and moved across it during the 1 minute it brightened in X-rays and EUV, but faded in UV. To obtain the features of the spectral lines we use the iris_get_mg_features_lev2.pro routine for Mg, which derives the position and intensities of the blue, red and central peaks. We mainly focus on Mg at 2796.35Å, because the line shows identical behaviour. For the FUV lines, we perform Gaussian fitting to the Si IV 1393.76Å, Si IV 1402.77Å, and O IV 1401.16Å lines, and obtain the Doppler shifts, Doppler widths, and line intensities. Examples of such fits are shown in Figure 5 for a pixel in the microflare (top row) and a quiet Sun pixel (bottom row). In these example fits the microflare is nearly an order of magnitude brighter in Si IV and O IV than the quiet Sun pixel shown, but the Mg II intensity is similar. The velocities for this pixel of the microflare show that they are not significant compared to the chosen quiet Sun pixel. The other O IV lines (1399.78Å, 1404.78Å) are below the noise limit in most pixels and therefore cannot be used as a density diagnostic. The coronal Fe XXI line, which usually only appears in flares, is below the detection limit in this microflare.
Maps of the fit results are shown in Figure 6. The box formed by the white lines indicates the location and time interval of the microflare. The Mg II line core Doppler velocity around the microflare shows a weak redshift of less than 10 km s*-1*, which occurs everywhere in the field of view. The Mg peak ratio is defined in Eq. 2 of Leenaarts et al. (2013) and it correlates with the average velocity in the upper chromosphere. Black areas indicate fitting issues, i.e. locations where the Mg line profiles do not show their typical shape, but rather a single peak. The peak ratio around the microflare is zero indicating that it does not influence the apparent upper chromospheric dynamics. Similarly, it is invisible in the Mg intensity. Si IV 1394Å and 1403Å are very similar, therefore only Si IV 1394Å is shown in the plots, as it has a higher absolute intensity. Note that the ratio of the total intensity in these two Si IV lines for the microflare loop are approximately 2, the expected value for optically thin emission (Kerr et al., 2018). In Si IV the microflare is clearly visible in the intensity maps. The Doppler width of Si IV is slightly enhanced (0.2Å), but such enhancements also occur in other parts of the FOV and can therefore not be attributed solely to the microflare. The velocities of Si IV are generally higher than those of Mg II, as can be expected, because Si IV forms at higher temperatures. At the location of the microflare downflows of the order of 20 km s*-1* are prevalent, which are commonly found in the quiet Sun. The microflare is also visible in the O IV intensity maps. The O IV 1401Å line is often weak, which explains the lack of fits (black locations) in its FWHM plot. Similarly to Si IV, the O IV FWHM and velocities are enhanced, but it is unclear if this is related to the microflare because similar enhancements are seen throughout the quiet Sun. The fact that the small loop is visible in the O IV and Si IV lines suggests material that is heated to log and log (or 0.06 and 0.16MK) respectively. Because the loop is invisible in the Mg II line, it means that there is little material at log in the loop. It seems that plasma below the upper chromosphere is not significantly affected by this microflare.
4.2 NuSTAR spectrum
The fitted NuSTAR spectrum for the pre-flare and microflare times are shown in Figure 7. Here we show the spectrum from NuSTAR FPMA over the region shown in Figure 3 during 23:28 to 23:29UT and 23:35 to 23:36UT. The data was rebinned before fitting so that there were at least 10 counts in each bin. Bad pixels and non-zero grade events were filtered out of the eventlist used to make the spectrum. The spectra were fitted in XSPEC using the APEC thermal model, with coronal abundances manually set using the values from Feldman et al. (1992), not using the default solar ones (which are photospheric and not coronal). The minimum fit energy used was 2.7 keV, as below this energy there is a discrepancy in the instrumental response arising from uncertainty in the detection threshold (Grefenstette et al., 2018). The best fit parameters were found using the Cash statistic (Cash, 1979). The pre-flare spectrum (left panels Figure 7) is well fitted with a single thermal component of temperature 3.23MK and emission measure cm*-3*. These fit parameters are coupled and not symmetric, so the minimum temperature within the error range corresponds to the largest emission measure: i.e. uncertainty of 3.20MK corresponds to cm*-3* and 3.28MK corresponds to cm*-3*. We use this pre-flare spectral fit to take account of the emission from the rest of the region (background) during the microflare time. To fit the microflare excess above the pre-flare emission we added a second thermal component and found a good fit to the data with an additional component of 5.08MK and cm*-3* (right panels Figure 7). The uncertainty ranges for these parameters are 4.41MK and cm*-3* and 5.32MK and cm*-3*. Taking the uncertainty in the pre-flare fit into account does not significantly change the fit obtained for the excess during the microflare. There are no solar counts above 5.5keV in this event, from hotter or non-thermal emission, but this observation did have a short effective exposure (about 3.0s from an ontime of 60s and livetime about 5.0%) and the microflare was only well observed in one of the two telescopes, limiting the spectral dynamic range.
Using the observed SDO/AIA Fe XVIII loop, of about 8 pixels long by 4 pixels wide, we get a volume estimate of cm3, assuming a filling factor of unity. This is smaller than the NuSTAR observed source size, shown in Figure 4. However, as we discussed in §3, the NuSTAR images are likely larger than the true emitting region due to the 18” full width at half-maximum of the optics’ point spread function, with the deconvolution approach only partially reducing this blurring effect. We therefore assume that the NuSTAR source size matches the smaller SDO/AIA Fe XVIII loop as it is more representative of the true source size, an approach that has been used several times before (c.f. Wright et al., 2017; Glesener et al., 2017; Kuhar et al., 2018). This volume combined with the NuSTAR emission measure gives a density of cm*-3*, with an uncertainty range of cm*-3* to cm*-3*.
From this we can calculate the instantaneous thermal energy (Hannah et al., 2008a) of the microflare over the minute it is seen above the pre-flare emission, finding erg, with an uncertainty range of erg to erg. This means that this event is about an order of magnitude smaller in energy than active region microflares previously seen with NuSTAR (Wright et al., 2017; Glesener et al., 2017). NuSTAR observations of quiet Sun flares (Kuhar et al., 2018) showed a similar thermal energy to the microflare presented in this paper. The density and thermal energy of the whole region during the pre-flare time can also be estimated by assuming the volume of the region is related to the observed SDO/AIA Fe XVIII area as , giving a density of cm*-3* and thermal energy of erg. So the microflaring loop contains only about 0.14% the thermal energy of the whole region and is not contributing substantially to the overall heating of the region.
4.3 Comparison of NuSTAR and SDO/AIA
By calculating the NuSTAR count rate and the thermal response in two different NuSTAR energy ranges, we can produce the EM loci curves (the rate divided by the response). These determine the maximum possible emission measure for each isothermal temperature and can help verify the thermal parameters found from the NuSTAR spectral fitting. They can also be used to show whether the emission observed by NuSTAR and SDO/AIA are coming from the same thermal source. The resulting EM loci curves are shown in Figure 8 for the pre-flare and microflare times. Different energy ranges are used for each time interval, determined from approximately the mid-point of the fit range of the spectra (Figure 7). For the pre-flare time 2.7 to 3.5 keV and 3.5 to 4.2 keV is used and these two EM loci curves intersect at a slightly higher temperature and lower emission measure than was found from spectral fitting. This consistency between the EM loci and spectral fitted values is despite the APEC thermal model being using for the fitting, and CHIANTI atomic database for the EM loci curves. There is a mismatch between the SDO/AIA and NuSTAR curves but that is likely due to the NuSTAR observed emission being at the edge of Fe XVIII temperature response range. Also the calculation of the Fe XVIII emission is an empirical approach and does not perform well when the emission is weak, such as we have in this region. For the microflare time, we want to determine the thermal parameters of the excess over the pre-flare time, so subtract the earlier emission. The resulting EM loci curves for both the NuSTAR and SDO/AIA Fe XVIII channel all intersect at the same temperature and emission measure, showing that both instruments are observing the same loop material at around 5-6MK. Again the temperature from the EM loci approach is higher than the spectral fitting, and the emission measure is lower, but still consistent.
For a clearer comparison of the observed NuSTAR and SDO/AIA emission, we take the temperature and emission found from fitting the NuSTAR spectrum and fold this through the temperature response for each SDO/AIA channel. We then compare the observed SDO/AIA emission in each channel to the one derived from the NuSTAR spectral fit, which we call the “AIA synthetic” emission. The resulting plot for the emission during the pre-flare and microflare times are shown in Figure 9. As expected, the hotter emission observed by NuSTAR is only contributing a tiny fraction to the observed emission in most of the SDO/AIA channels. The only channels in which the majority of the observed emission is coming from the temperatures NuSTAR observed are, as expected, 94Å and Fe XVIII during the microflare time. This helps confirm why the microflaring loop is only clearly visible in those SDO/AIA channels, as there appears to be no significant change in the amount of material at cooler temperatures.
4.4 Comparison of NuSTAR and GOES/XRS
Using the thermal parameters found from fitting the NuSTAR spectra we can estimate the GOES/XRS flux that should have been produced. For the emission from the whole region during the pre-flare time we estimate the GOES/XRS flux using the standard routine goes_flux49.pro as Wm*-2*. The observed GOES/XRS flux from the full-disk over this time was actually Wm*-2*, about a factor of 25 higher. Similarly, using the NuSTAR temperature and emission found for the microflare excess we obtain a GOES/XRS flux of Wm*-2*, equivalent to 0.02A-class. The observed flux was Wm*-2*, about 50 times higher. It could be that there was emission coming from elsewhere on the disk, however close examination of both GOES/SXI (as shown in Figure 1) and SDO/AIA Fe XVIII full disk images show that the NuSTAR region was the main and brightest one on the disk and certainly cannot explain such large discrepancies. The higher flux observed by GOES/XRS might be due to the presence of emission from lower energies than NuSTAR can detect. However such material would have to be at temperatures just below the ones found with NuSTAR otherwise there would be a clear excess in more SDO/AIA channels, not just those sensitive to the hottest material (i.e. 94Å and Fe XVIII).
Although there is a substantial difference between the calculated and observed fluxes it should be noted that GOES/XRS is poorly calibrated at these low flux levels, as it is designed to monitor large flares. This is highlighted in the recent comparison of GOES/XRS emission with the softer X-ray spectrometer MinXSS-1 (Mason et al., 2016). The MinXSS-1 spectrum gives a more robust irradiance measure compared to the broader channel used by GOES/XRS and showed deviations below fluxes of Wm*-2*, which became even more substantial once below Wm*-2* (Woods et al., 2017). MinXSS-1 was operational when these NuSTAR observations were made, providing spectra integrated over the full-disk. Unfortunately no event was discernible above the pre-flare level, which may have been due to it operating in a “non-fine pointing” mode during this time range (see Moore et al., in prep). What MinXSS-1 did observe was consistent with a slightly lower temperature and higher emission measure than the pre-flare one found with NuSTAR , which could help explain the NuSTAR to GOES/XRS discrepancy during this pre-flare time.
5 Discussions & Conclusions
In this paper, we presented the smallest microflare seen yet with NuSTAR , about an order of magnitude weaker than those previously observed with NuSTAR (Wright et al., 2017; Glesener et al., 2017) and well beyond the microflares observed with RHESSI (Hannah et al., 2008a). This event is similar in thermal energy to quiet Sun flares seen with NuSTAR (Kuhar et al., 2018), however the microflare presented in this paper demonstrates higher temperature emission and is from an active region. In this microflare we saw emission at about 5MK, which gave an instantaneous thermal energy of around erg. It is remarkable that even in this small X-ray microflare we were still able to see corresponding emission in UV, allowing us to study both the coronal and upper chromospheric/transition region response. The small loop seen with IRIS in UV and SDO/AIA in EUV by itself was unexciting, but this changes with the unexpected addition of emission seen at higher energies with NuSTAR . In this microflare no higher temperature (closer to 10MK) or non-thermal emission was observed but that could be due to limited effective area from only one of the two telescopes observing the flare and as well as the short exposure time. Only about 3s was achieved over an on-time of 60s, due to emission elsewhere on the solar disk. Further NuSTAR observations with higher livetimes will be better able to address the presence of non-thermal emission and/or higher temperatures in events such as this. Observations of small flares have the inherent problem that these are short duration events, so long exposures are not possible and require instruments with higher sensitivity from larger detector effective area.
It is surprising that this microflare is only seen at the hotter coronal temperatures and lower chromospheric/transition region ones, but there is no increase in emission from material in the few MK range. The SDO/AIA channels sensitive to these temperatures show consistent emission during the pre- and microflare times, but no clear excess. It could have been that there was more background material in this temperature range so the small increase due to the microflare was hidden, rendering it effectively invisible. Or it may have been that hotter material seen by NuSTAR and SDO/AIA Fe XVIII cooled too rapidly to be seen, or that the ionisation timescale was longer than the cooling timescale. This event did not present the moss brightenings reported in previous IRIS small flare work (Testa et al., 2014), so it could be that this event is even weaker, with faster rastering required to catch velocities clearly associated with the microflare, or possibly a different type of event.
Although the microflare is seen as a brightening in GOES/XRS, it is difficult to trust the observed flux given that this is at the limit of the instrument’s sensitivity and prone to substantial uncertainties in the calibration (in terms of the spectral distribution of these small events relative to the instruments response function). But again it should be noted that GOES/XRS was not designed to be useful for these small fluxes. Future observations with NuSTAR that overlap with other softer X-ray spectrometers, such as MinXSS-2 (Moore et al., 2018) or MaGIXS (Kobayashi et al., 2018), might help to resolve the true multi-thermal emission of these small microflares over this energy range.
The NuSTAR observations of this small microflare have shown that even fairly ordinary features seen in UV and EUV can have a higher energy X-ray component. This shows that there is substantial potential for studying weaker solar activity at higher energy X-rays, either occasionally with NuSTAR or with an optimised solar spacecraft such as the proposed FOXSI (Christe et al., 2017).
This paper made use of data from the NuSTAR mission, a project led by the California Institute of Technology, managed by the Jet Propulsion Laboratory, funded by the National Aeronautics and Space Administration. We thank the NuSTAR Operations, Software and Calibration teams for support with the execution and analysis of these observations. This research made use of the NuSTAR Data Analysis Software (NUSTARDAS) jointly developed by the ASI Science Data Center (ASDC, Italy), and the California Institute of Technology (USA). IRIS is a NASA small explorer mission developed and operated by LMSAL with mission operations executed at NASA Ames Research center and major contributions to downlink communications funded by ESA and the Norwegian Space Centre. IGH is supported by a Royal Society University Fellowship. The authors thank the International Space Science Institute (ISSI) for support for P. Testa’s team “New Diagnostics of Particle Acceleration in Solar Coronal Nanoflares from Chromospheric Observations and Modeling”, where this work benefited from productive discussions.
The reference list from the paper itself. Each links out to its DOI / PubMed record.
- 1Berger et al. (1999) Berger, T. E., de Pontieu, B., Fletcher, L., et al. 1999, Sol. Phys., 190, 409, doi: 10.1023/A:1005286503963 · doi ↗
- 2Cash (1979) Cash, W. 1979, Ap J, 228, 939, doi: 10.1086/156922 · doi ↗
- 3Christe et al. (2008) Christe, S., Hannah, I. G., Krucker, S., Mc Tiernan, J., & Lin, R. P. 2008, Ap J, 677, 1385, doi: 10.1086/529011 · doi ↗
- 4Christe et al. (2017) Christe, S., Krucker, S., Glesener, L., et al. 2017, ar Xiv e-prints. https://arxiv.org/abs/1701.00792
- 5De Pontieu et al. (2014) De Pontieu, B., Title, A. M., Lemen, J. R., et al. 2014, Sol. Phys., 289, 2733, doi: 10.1007/s 11207-014-0485-y · doi ↗
- 6Del Zanna (2013) Del Zanna, G. 2013, A&A, 558, A 73, doi: 10.1051/0004-6361/201321653 · doi ↗
- 7Feldman et al. (1992) Feldman, U., Mandelbaum, P., Seely, J. F., Doschek, G. A., & Gursky, H. 1992, Ap JS, 81, 387, doi: 10.1086/191698 · doi ↗
- 8Glesener et al. (2017) Glesener, L., Krucker, S., Hannah, I. G., et al. 2017, Ap J, 845, 122, doi: 10.3847/1538-4357/aa 80e 9 · doi ↗