The critical state of granular media: Convergence, stationarity, and disorder
Matthew R. Kuhn

TL;DR
This study uses discrete-element simulations to analyze micro-scale characteristics of granular media, revealing their convergence, stationarity, and evolving disorder during loading toward the critical state, with implications for understanding granular material behavior.
Contribution
It introduces a detailed micro-scale analysis of granular media's approach to the critical state using entropy measures, highlighting convergence and disorder evolution.
Findings
Micro-scale characteristics converge at the critical state.
Disorder increases during loading and briefly restores upon unloading.
Micro-scale entropy correlates with macro-scale critical state behavior.
Abstract
Discrete-element simulations are used to monitor several micro-scale characteristics within a granular material, demonstrating their convergence during loading toward the critical state, their stationarity at the critical state, and the evolution of their disorder toward the critical state. Convergence, stationarity and disorder are studied in the context of the Shannon entropy and two forms of Kullback-Leibler relative entropy. Probability distributions of 20 aspects of micro-scale configuration, force and movement are computed for three topological objects: particles, voids and contacts. The probability distributions of these aspects are determined at numerous stages during quasi-static biaxial compression and unloading. Not only do stress and density converge to the critical state, but convergence and stationarity are manifested in all of the micro-scale aspects. The statistical…
Click any figure to enlarge with its caption.
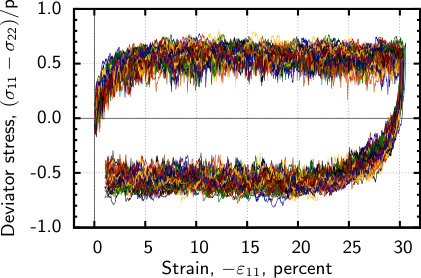 Figure 2
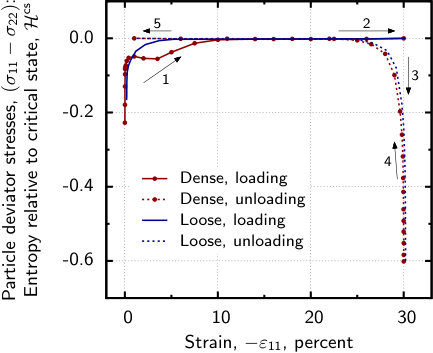 Figure 3
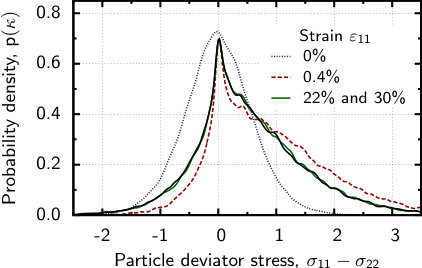 Figure 4
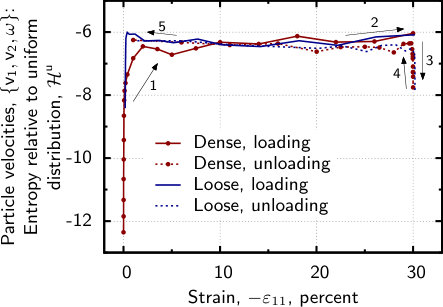 Figure 5
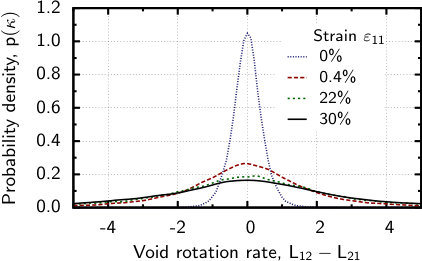 Figure 6
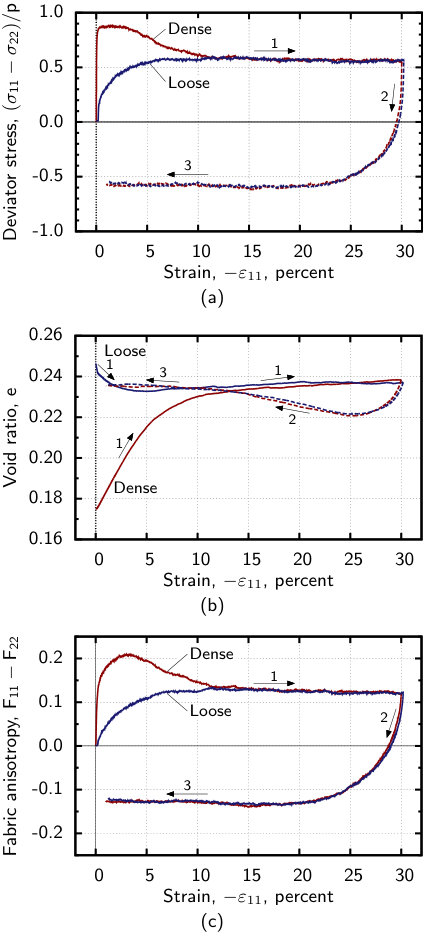 Figure 1
| Local characteristics of a granular assembly | ||||
| I) Configuration | II) Force1 | III) Movement2 | ||
| Object | Particles | Coordination no.3 | Pressure8 | Horizontal velocity |
| Deviator stress | Vertical velocity | |||
| Shear stress | Rotational velocity | |||
| Voids | Valence4 | — | Dilation rate9 | |
| Contact journal5 | Compression rate | |||
| Density6 | Transverse shear rate | |||
| Rotation rate | ||||
| Contacts | Orientation7 | Normal force | Slip rate10 | |
| Tangential force | Rolling rate | |||
| Rigid rotation rate | ||||
| 1 forces are normalised by dividing by mean stress . 2 movements are normalised by dividing by strain increment . 3 number of contacts of a particle. 4 number of links (contacts) around a polygonal void. 5 list of integer pairs for reconstructing an entire particle graph (see Kuhn, 2014, §2). 6 void ratio of a polygonal void, ignoring any rattler particles by treating them as void space. 7 angular orientation of a contact normal vector. 8 particle stresses computed from the contact forces (see Bagi, 1996), expressed as the pressure , deviator stress , and shear stress . 9 local deformation rate within a polygonal void, computed from the particle movements around the void’s perimeter (Kuhn, 1999, §2.1). The rate is a local velocity gradient , expressed in four combinations: dilation , deviatoric compression , transverse shear , and rotation . 10 relative movements of a particle pair, computed from the particles’ six component rates (two translation rates and a rotation rate for each particle). These six values are expressed in four combinations: three tangential combinations (slip, rolling, and rigid rotation, as described in Kuhn & Bagi, 2004) and the relative normal movement of the two particles. | ||||
Peer Reviews
No public reviews on file for this paper yet. If you reviewed it on a platform where reviews are public (OpenReview, ICLR, NeurIPS, ICML), you can paste yours below so the community can read it here.
Videos
No videos yet. Explain this paper in a talk, walkthrough, or lecture? Add one.
\runningheads
Disorder and the critical stateM. R. Kuhn
The critical state of granular media:
Convergence, stationarity, and disorder
Matthew R. Kuhn
Abstract
Discrete element simulations are used to monitor several micro-scale characteristics within a granular material, demonstrating their convergence during loading toward the critical state, their stationarity at the critical state, and the evolution of their disorder toward the critical state. Convergence, stationarity, and disorder are studied in the context of the Shannon entropy and two forms of Kullback-Leibler relative entropy. Probability distributions of twenty aspects of micro-scale configuration, force, and movement are computed for three topological objects: particles, voids, and contacts. The probability distributions of these aspects are determined at numerous stages during quasi-static biaxial compression and unloading. Not only do stress and density converge to the critical state, but convergence and stationarity are manifested in all of the micro-scale aspects. The statistical disorder (entropy) of micro-scale movements and strains generally increases during loading until the critical state is reached. When the loading direction is reversed, order is briefly restored, but continued loading induces greater disorder in movements and strains until the critical state is reached again.
keywords:
constitutive relations; fabric/structure of soils; particle-scale behaviour; statistical analysis
Introduction
The critical state is a foundational concept in geomechanics, encompassing two characteristics of soils and other granular materials (Schofield & Wroth, 1968). After sustained slow shearing from an initial packing, a granular material reaches a critical (steady) state in which the ratio of shear stress to mean stress remains nearly stationary during further shearing. Not only does the stress reach a steady condition, but other bulk measures of internal fabric and structure remain stationary as well (Thornton, 2000; Peña et al., 2009). Although the values of these characteristics will depend upon the material’s composition and upon the form of loading, for a given material and loading, a specific steady state condition is eventually attained. This critical state condition is most enduring at low confining stress, since particle breakage at high stress can continue to alter the internal fabric, even as the shearing stress remains constant (Luzzani & Coop, 2002; Muir Wood & Maeda, 2007). Notably, the bulk steady condition occurs even while individual particles are undergoing seemingly erratic and highly varied motions and interactions, notwithstanding a slow, quasi-static loading (Kuhn, 2016a).
The second characteristic is the convergent quality of the critical state: the eventual bulk attributes for a given material are insensitive to the initial particle arrangement and to prior stress conditions. For example, materials that are initially either loose or dense or have different initial particle arrangements will approach the same density after sufficient shearing (Casagrande, 1936; Zhao & Guo, 2013). These characteristics — persistent convergence toward stationary bulk attributes — resemble those of thermal systems that reliably approach a stable, equilibrium condition with sufficient passing of time, even as the underlying molecular motions remain dynamic and diverse.
In a pair of recent papers, the author proposed a third characteristic of the critical state: at the critical state, the micro-scale landscape of particle arrangements and particle interactions exhibits the greatest diversity and disorder that is consistent with information known a priori — information that constrains the available landscape (Kuhn, 2014, 2016b). The two papers, based upon a conjecture of maximum disorder, demonstrated that observed micro-scale features at the critical state are similar to those that derive from the conjecture. These features include distributions of the contact forces, orientations, and movements and the topologic arrangements of particles.
Both works deduced this disordered nature by first considering the full extent (phase space) of potential micro-states (particle arrangements, movements, forces, etc.) and then applying available information in the form of reasonable bulk constraints on the space of micro-states. Among the many different micro-states that can satisfy the constraints, the author sought the specific collection of micro-states (called a “macro-state”) that exhibited the greatest diversity of micro-states. This approach is equivalent to finding the macro-state that encompasses the greatest number of micro-states that satisfy the given constraints. Jaynes (1957) contended that this macro-state of maximum entropy satisfies the available information but is otherwise unbiased. As a simple illustration, consider micro-states of particle arrangement, with each micro-state expressed as an ordered list of integers, between 1 and 10, representing, say, the number of contacts of each particle in an assembly. Now impose an average of 7.0 for the integers in a list — the average coordination number. Although it is certainly possible that every particle will have seven contacts, thus satisfying the bulk average, this condition is highly unlikely and has a low entropy, since this macro-state is only realised by a single list of 7’s (a singular micro-state) that corresponds to a nearly crystalized condition. Far more lists can be created by permuting equal occurrences of the numbers 6 and 8, and the macro-state encompassing such micro-state lists would indicate a higher entropy and a higher likelihood. In an analogous manner, the author applied principles of statistical mechanics (in particular, the Jaynes formalism of maximising the Shannon entropy) to derive characterisations of the critical state. Starting with the assumption of maximum disorder, the two papers obtained maximally disordered distributions of various micro-quantities which compared favourably with distributions measured in discrete element method (DEM) simulations at the critical state.
The current work examines connections among the three characteristics of the critical state: its stationary character, the convergence tendency, and the tendency toward maximum disorder. Unlike the author’s previous works, which began with an assumption of maximum disorder at the critical state, the current work directly measures disorder and tracks its evolution in DEM simulations. The simulations start from the initial conditions of densely-packed and loosely-packed assemblies, continue through deviatoric loading in one direction, and finish with sustained loading in the reversed direction. With these simulations, the disorder in particle movements is shown to generally increase during loading until the critical state is reached. Once attained, all micro-scale measures of fabric, force, and movement remain in a steady condition.
Information and disorder
The intent is to quantify the diversity exhibited by the micro-states of a granular material. For a thermal system, a micro-state might be presented as a snapshot of the positions and momenta of the identifiable constituents (molecules) at a particular instant. In the current work, snapshots are taken of DEM simulations at particular strains, providing the local densities, coordination numbers, forces, movements, etc. A Boltzmann micro-state can be expounded as an ordered -list of such characteristics that characterise a system’s constituents, , and the full set of all possible lists is the phase space of the system. Appropriate phase spaces are later identified for depicting the slow shear-driven movements of particles and contacts. The macro-state to which a micro-state belongs is represented by the bulk relative frequencies (empirical probabilities) of items within the micro-state’s list. These frequencies can be extracted for a particular micro-state, but other micro-states within the phase space can also share the same frequencies, most simply as a reshuffling of the order of the items within the list. The mapping of micro-states and macro-states, therefore, is surjective: each micro-state corresponds to a unique macro-state, but many micro-states can comprise the same macro-state. In principle, constructing a specific micro-state from a more general macro-state requires additional information beyond the gross probabilities, and the amount of information that must supplement the macro-state, the Shannon “missing information,” is a measure of a macro-state’s diversity or disorder. The two terms are used interchangeably, and entropy will designate a quantified measure of disorder.
Methods of quantifying the missing information must accommodate, in part, characteristics that are discrete and countable (quantum states for molecules, or coordination numbers for a granular material); but a general method must also accommodate information that is continuous (momenta for classical molecules, or forces, rates, etc. within a granular material). With discrete data, each item can, itself, be an -list of discrete values , , belonging to the -space of integers . For example, the author showed that the topological arrangement of a two-dimensional assembly of disks could be represented as a list (journal) of integer pairs, each taken from (Kuhn, 2014). With continuous data, the items can be lists of data points , , taken from the continuous -space . We will use both types of data — discrete and continuous — to describe the evolution of disorder during the loading of granular media.
The disorder of a macro-state is measured by first expressing the underlying data in terms of probabilities of the component categories that appear within micro-state lists. The Shannon entropy is based upon these likelihoods — probabilities for discrete systems and probability density for continuous systems — of the component characteristics of a macro-state:
[TABLE]
where phase space is the set of all possible components, , such that and . The intrinsic measure quantifies the diversity of micro-states that comprise a macro-state. Oddly, does not depend upon the values of the underlying data but only on their probabilities. Note the lack of a Boltzmann-like constant in entropy , conventionally applied to the Shannon entropy as a scaling factor to enforce coincidence with the thermodynamic entropy (Ben-Naim, 2008). Two variants of the Shannon measure, described below, will be used to estimate the relative disorder within particular micro-states collected from DEM snapshots.
Estimating probabilities is straightforward for a micro-state of a system having a finite number of discrete possibilities : by simply counting the occurrences of each condition and dividing by the length of the data list, . For the example presented above, entropy for lists exclusively constructed from 7’s is ; for lists of 6’s and 8’s in equal number, . In general, the more uniform and diverse the distribution, the larger is its entropy; more biased, uneven, or concentrated distributions (i.e., those having a more certain outcome) have lower entropies. Indeed, the basis of Jaynes’ maximum entropy (MaxEnt) principle is that the most reasonable probability distribution is the one that is consistent with all available information, but only this information: the remaining,“missing” information is maximised. For example, when no information is available for the 10 possible constituents of the previous list, not even an average value, each constituent should be assumed equally probable, for which . When the average is known to be 7.0, but no other information is available, entropy is maximised with a distribution of exponential form that is biased toward larger numbers and with the lower entropy of 2.16 (see Ben-Naim, 2008 for other examples).
The entropy measure in Eq. (1) is problematic, however, when used to characterise the disorder exhibited in DEM data. The Shannon entropy of a continuous system, as in Eq. (12), suffers from a lack of scale invariance, such that a scaling of variables and the corresponding region (perhaps with a change in dimensional units) will alter the entropy (note the logarithm of density with its troublesome dimensional units, see Ben-Naim, 2008). A second shortcoming is that describes the missing information associated with posterior probabilities but does not consider possible access to prior information, even imperfect information, in the form of preferential probabilities.
These problems are avoided with an alternative measure of disorder — the relative entropy or negative Kullback-Leibler distance (Meléndez & Español, 2014). In this manner, one can account for possible access to a priori information in the form of the prior probabilities or , which are extracted from past evidence (such as information gathered at the critical state). Two sets of prior probabilities are considered.
With the first relative entropy, it is assumed that no prior information is available about the particle arrangements, forces, or movements, so that one can test whether the disorder of these quantities increases as a granular material is loaded. For this case, the missing information (or disorder) of the measured posterior probability is taken relative to the most naive, uninformed prior: is simply the uniform distribution, or , spread evenly across phase space . In this manner, one measures the disorder of a given system relative to the most possibly disordered system, in which probabilities are uniformly distributed,
[TABLE]
where and are proper distributions, each with a net expectation of 1. The negative Kullback-Leibler distance is always non-positive. If a system’s density equals the uniform density , then the relative entropy has its largest value of zero, corresponding to the most disordered system. Continuing the previous example, if coordination numbers are between 1 and 10, then , and the entropy for lists exclusively constructed from 7’s is ; for lists of 6’s and 8’s in equal number, ; and for a uniform distribution, . Again, larger (less negative) values express greater diversity and disorder.
With the second relative entropy, one exploits information gained at the critical state, using knowledge of its distributions of particle arrangement, force, and movement as prior information, against which a granular specimen is compared as it is being loaded toward the critical state. This relative entropy simply measures the (negative) distance between a distribution and the reference, critical state distribution , testing convergence toward (and stationarity of) the critical state:
[TABLE]
This second relative entropy is a measure of disorder only if one accepts the critical state as the most disordered system, a question that is answered by applying the first relative entropy to DEM data. The scalar is similar to the “state parameter” of Been & Jefferies (1985), which also characterises the distance of a current condition from the critical state: but rather than a difference in bulk void ratios, is the difference between entire probability distributions of the underlying micro-scale data. Although the critical state distributions could be estimated using methods of the author’s previous papers, these distributions will be directly extracted from DEM simulations.
DEM simulations
Numerical simulations were used for tracking convergence toward the critical state and the evolution of disorder during deviatoric loading. The simulations were conducted on simple, two-dimensional assemblies of 676 bi-disperse disks that were contained within periodic boundaries. Previous work by the author showed that assemblies with at least a few hundreds of particles reach nearly the same deviatoric stress at the critical state Kuhn & Bagi (2009). Using two disk varieties, with ratios of 1.5:1 in size and 1:2.25 in number, prevented the crystallisation of particle arrangements that are otherwise observed with mono-disperse assemblies. To accumulate large data sets, the author created 50 randomly generated assemblies (initial micro-states) of dense assemblies and 50 random loose assemblies, and then slowly loaded each of the 100 assemblies under identical biaxial compression conditions. The creation of these initial assemblies is confirmation that many different configurations, both dense and loose, are consistent with a given assembly size and preparation method, as in the -system of Blumenfeld & Edwards (2009). The particles were isotropically compacted from a sparse two-dimensional granular gas in which the disks were assigned random velocities and an artificial friction coefficient ( for the dense assemblies, and for the loose assemblies), with compaction proceeding until the assemblies “seized”, at which the void ratios were 0.175 and 0.246 for the dense and loose assemblies. A friction coefficient was then assigned for the subsequent loading sequence.
In the first phase of biaxial loading, the horizontal width of each assembly was reduced (compressed) at a constant rate while the height was allowed to expand so that the mean stress within the assembly remained constant. Loading proceeded slowly to a horizontal strain of 30%, bringing the assemblies fully into the critical state of constant stress, volume, and fabric (Fig.1).
The biaxial loading was then reversed by increasing the width (i.e. extension) at a constant rate while reducing the height and maintaining the original mean stress. Reversed loading was ceased when the strain returned to 1%. This reversal phase also brought the assemblies to the critical state, but with the principal directions of stress, strain, and fabric rotated by 90*∘*. Snapshots were taken of all micro-data at specific strains to capture the evolving conditions: 22 snapshots during the initial phase and 21 snapshots during the reversal phase. By running simulations on 50 assemblies, the author collected data lists on about particles, voids, and contacts for each snapshot of the dense or loose assemblies.
With each snapshot, entropies and were computed for various micro-scale characteristics, described in a later section, by using the Voronoi method of Learned-Miller (2004), kernel density estimates of Duong (2007), and direct binning.
Bulk convergence, stationarity, and ergodicity
Figure 1 shows changes in the deviator stress and void ratio during the compressive loading phase and the reversed loading phase, as averaged across 50 specimens. For both dense and loose assemblies, the bulk measures of deviator stress, void ratio, average fabric anisotropy, and average coordination number reached a steady, critical state at the strain 20% during forward loading (arrow 1, Fig. 1), and these bulk quantities also reached the corresponding steady conditions during reversed loading, after the strain was reduced from 30% to 10% (arrows 2 and 3). The dense and loose assemblies attained nearly identical deviator stresses, void ratios, and fabric anisotropies at the critical state, evidence of the state’s convergent character. Note that the dense and loose assemblies behaved almost identically during the reversed loading, with their averaged stress-strain behaviours being almost indistinguishable.
Figure 2 shows stress and strain of all 50 loose specimens, disclosing the erratic character of stress evolution (the dense specimens exhibited similar fluctuations). The fluctuations are also apparent in averaged data of Fig. 1a as slight, raspy variations from the average trend. The 50 specimens were sufficient in number, however, such that the mean deviator stress has a 95% confidence interval of .
An analysis of all 50 specimens shows that after the critical state is reached, these erratic variations in stress exhibited both stationarity and ergodicity. Although both terms are usually applied to time series data, in the current context, a monotonically increasing (or decreasing) strain serves the role of time, and the spatial domain is represented by the stresses realised in different specimens at the same strain. Stationarity, meaning constant statistical measures of stress across a range of strains, was tested by computing the mean and variance of stress for the specimens during two strain intervals: 20–25% and 25–30%. Stationarity was clearly demonstrated at the critical state, as the means and variances of deviator stress were nearly same for the two intervals (means of 0.561 and 0.556, and variances of 0.0050 and 0.0053).
If a process exhibits the ergodicity property, multiple instances of the process taken at a given time yield the same statistical characteristics as that of a single instance tracked across a sufficiently extended time range. In the current setting, an “instance” is a single simulation and “time” is strain. Ergodicity means that similar fluctuations would be observed by tracking a single simulation across a range of strains as would be observed by noting the results of many simulations at a single strain. Ergodicity was tested by computing the mean and variance of all 50 specimens at strain 25% and comparing these values to those of individual specimens taken across a strain range of 20–30%. The statistical measures were almost the same for the two cases, with nearly identical spatial and temporal means, and spatial and temporal variances of 0.0051 and 0.0043. The statistical characteristics at strain 25% are nearly the same as those at other strains in the range 20–30%, which had strength variances of 0.0035–0.0070. These results indicate that the critical state can be characterised either by measuring multiple specimens at a given strain or by measuring a single specimen across a range of strains. In the current study, multiple specimens were averaged among multiple strain snapshots at the critical state.
The primary focus of the remainder of this paper is statistical analyses of micro-scale (rather than macro-scale, bulk) data, and as described below, several tens of thousands of micro-scale samples were used for this purpose. It is no surprise that the critical state exhibits bulk stationarity, as the state is largely defined by this characteristic. As will be seen, however, stationarity and convergence are more deep-rooted, as they pervade all micro-scale aspects as well as being expressed in bulk, macro-scale characteristics.
Micro-scale stationarity, convergence, and disorder
The evolving micro-scale quantities are broadly grouped as follows:
- I.
local configuration (i.e. packing) quantities, such as coordination number, density, and contact orientation, 2. II.
local force quantities, such as particle stresses and contact forces, and 3. III.
local movement quantities, such as particle translations and rotations, contact movements, and local strains.
as presented in the columns of Table 1. The first two aspects are associated with the status or configuration of a granular assembly, which are related to the configuration distributions of Edwards & Oakeshott (1989) or the configurational entropy of Valanis et al. (1993). The third set of attributes are transitional rate quantities that are driven by the bulk deformation and will depend upon the loading direction. The distinction between state (being) and transition (becoming) is explored further below.
The micro-scale of a two-dimensional granular material can be described with any of three topological objects: its non-rattler grains, which can be represented as the nodes of a particle graph; the contacts between particles, represented as links between nodes; and the voids, represented as polygonal loops formed by the nodes and links (Satake, 1992). These objects must be distinguished, because configuration, force, and movement are expressed in different ways among the objects, and the three objects’ associated micro-state lists will contain different quantities and have different lengths . The three objects are presented in the rows of Table 1.
Altogether, the table identifies twenty local micro-scale characteristics that were characterised in the form of their probability distributions at various strain snapshots. Three of the quantities are discrete (coordination number, valence, and the contact journal); the other quantities are continuous.
Convergence and stationarity
Measure in Eq. (3) characterises the difference (negative distance) between the probability distributions of micro-scale quantities during loading and their eventual distributions at the critical state. This measure was applied to each of the twenty micro-scale characteristics in Table 1. For the initial loading phase, distributions were compared with the reference distribution at strain 30%; during the reversed loading, the final critical state distributions at strain 1% were used.
As an example of the twenty characteristics, Fig. 3 shows the evolution of for the particular distribution of the local deviator stresses within particles, the difference for each particle within the =29,000 particle samples.
The bulk stress was initially isotropic, such that any small deviator stresses (both positive and negative) within individual particles balanced to yield a bulk deviator stress of zero. This initial distribution of deviator stress was quite different than that at the critical state, as is shown in Fig. 4: upon the start of loading, the distribution becomes broader and more diverse, exhibiting greater disorder.
At the strain 0%, the (negative) distance was (Fig. 3). After loading to strain 0.4%, the negative distance was , indicating that the distribution of the particle deviator stresses had become closer to that of the critical state. During further loading (arrows 1 and 2, Fig. 3), the distribution of stress progressively approached the distribution of the critical state. At strains greater than 20%, the distributions became stationary and were nearly identical to the critical state distribution: that is, attained a steady value of zero. The distributions at both 22% and 30% are plotted in Fig. 4, and any small differences can only be discerned by enlarging the plot.
When the loading was reversed at strain 30%, the distribution of deviator stress was very different from its eventual critical state distribution (arrow 3 in Fig. 3), since the previous loading had imparted a positive bias to the particle deviator stresses, a direction counter to the opposite bias that was progressively induced during further reversed loading. The reversed loading quickly brought the distributions to those of the eventual (reversed) critical state (arrows 4 and 5 in Fig. 3), with an equal to zero.
As with the local deviator stresses, the other nineteen characteristics in Table 1 were also considered, and the joint probability distributions of multiple characteristics in each row of the table were also analysed. The relative entropies of all micro-scale characteristics exhibited similar trends: their distributions converged to the corresponding distribution of the critical state, such that equalled zero at a (forward) strain of about 20% or after a reversal of strain from 30% to about 10%. The distributions remained stationary during further loading. That is, convergence and stationarity at the critical state are manifested in all twenty micro-scale aspects.
Disorder
The evolution of micro-scale disorder was investigated by computing the relative entropy of Eq. (2) for the twenty characteristics in Table 1. The author’s original hypothesis was that the disorder of each characteristic would increase during loading toward the critical state. Instead, although did increase with all local movement characteristics (column III of Table 1), it did not necessarily increase with the configuration or force characteristics in columns I and II. Upon further thought, one recognises that the critical state is not a fixed condition or status; instead it is a transitional, active quality, which has meaning only in the context of a driving deformation. Consider, for example, the condition of an assembly being deformed in (forward) biaxial compression at strain 30% (see Fig. 1). One could separately build a static arrangement of disks having the same configuration and force characteristics as that of the deforming assembly, but one can ask whether this static assembly is “at the critical state”? Although the question may seem as semantic nuance, any loading direction other than a continued forward biaxial loading will divert the assembly from its current critical state of deformation. That is, the critical state is an active condition in which deformation and movement are essential ingredients. As will be seen, disorder in the micro-scale movements does increase while an assembly is approaching the critical state. On the other hand, notable examples of reduced disorder occur among the configuration and force quantities in Table 1 (columns I and II). For example, the anisotropy that develops in the contact orientations during loading (e.g., Thornton, 2000) is a form of increasing order, since a uniform, isotropic distribution of orientations exhibits the least order. Another form of order develops during plastic deformation: when contact forces reach their frictional limit, they are constricted by the friction law, which reduces disorder in the tangential components of the contact forces (the friction law can be viewed as a form of constrictive information).
An example of the tendency toward increasing disorder in the micro-scale movements is shown in Fig. 5.
This plot is of the relative entropy of the combined, joint probability distribution of all three components of particle movements: horizontal, vertical, and rotational velocities. Entropy is taken relative to the most disordered (uniform) distribution , and a value of zero represents the greatest disorder. In Fig. 5, the movements of particles within the dense and loose assemblies are seen to increase from their initially ordered condition (large negative ) at zero strain (arrow 1, Fig. 5) to a larger value at the critical state (arrow 2). When the loading is reversed (arrow 3), the entropy of particle movements is immediately reduced, corresponding to more ordered (less diverse) movements. Further reversed loading causes greater disorder (arrow 4) until the assembly reaches the reverse critical state (arrow 5). The same trends were measured with all ten movement quantities in column III of Table 1: the local, micro-scale movements and strains of the particles, voids, and contacts generally increased as deformation progressed toward the critical state.
The increasing disorder is also seen in the probability distributions of Fig. 6.
This figure shows distributions of the rotations (vorticity) of the voids in the dense assemblies during the loading phase. A fairly peaked distribution at strain 0% broadens and becomes more diverse during loading, attaining a nearly stationary entropy at the critical state snapshots of 22% and 30%.
In some cases, the assemblies temporarily reached a larger entropy prior to the critical state (for example, during loading at the small strains of 1%–3% in Fig. 5). Note that measures the comparison of a given probability distribution with the most naive, disordered system having uniform distribution . Comparisons to the uniform distribution provide a gross measure of disorder, but fails to account for certain constraints that apply at all stages of loading, from the start of loading through the critical state. These constraints include the consistency of particle motions with the applied bulk deformation, consistency of contact forces with applied stresses, and energy conservation principles. Such imposed conditions induce biases in the distributions of micro-scale quantities that are not considered when comparisons are made with a uniform distribution. Previous work has shown that, when considered, these constraints can account for many of the micro-scale trends that are observed at the critical state (Kuhn, 2016b).
Conclusion
In 1872, Boltzmann published his H-theorem, a rigorous derivation of an entropy that was based upon micro-scale analysis of particle collisions (Boltzmann, 2003). Significantly, this probabilistic approach to ideal diffuse gases demonstrated that any temporary disturbance from an equilibrium distribution is eventually corrected, as the particle assembly naturally returns to the most probable (i.e. equilibrium) state. An H-theorem has been proposed for force distributions within static dense granular assemblies (Metzger, 2008), but no rigorous proof has yet been presented of a maximum-entropy principle for dense granular flow. Although not rigorous confirmation, the current work and the author’s previous works give support to the concept of maximum entropy at the critical state. Simulations of the biaxial loading of simple, two-dimensional disc assemblies show that micro-scale distributions of arrangement, force, and movement converge to stationary distributions. Furthermore, disorder in the movements, as characterised by the entropy relative to a uniform distribution, tends to increase during loading until the critical state is reached. That is, starting from initial packings, the particle motions are relatively ordered, but as loading approaches the peak stress and beyond, the distributions of motions become more diverse (i.e., disordered). Upon a reversal of loading — a temporary disturbance from the stationary, stable critical state — the distributions of micro-scale arrangement, force, and movement abruptly deviate from their stable condition, but after sustained reversed loading, the distributions regain the diverse critical state condition.
When one focuses on individual particles or contacts during deformation of a soil or other granular material, the motions appear bewildering and complex, with seemingly erratic fits, stalls, and reversals in all directions (Kuhn, 2016a). Yet from this local ferment, bulk behavior at the critical state maintains a steady monotony of stress and density. An unsolved and perplexing problem in granular mechanics is the prediction of constitutive behavior with models that are based upon the complex local interactions of particles. In the current work, we can glimpse a possible resolution of the problem, by focusing upon the probability distributions of micro-scale quantities, which naturally express their disordered character. If one accepts the critical state distribution as the eventual stationary and stable state and uses, as a generalised “state parameter”, the difference between a current distribution and that of the critical state, one may be able to predict the progress of both micro- and macro-quantities during a strain sequence. Viewing the critical state as a convergent, stationary, and maximally disorder condition may enable fresh progress in understanding and predicting soil behavior.
Notation
[TABLE]
The reference list from the paper itself. Each links out to its DOI / PubMed record.
- 1Bagi (1996) Bagi, K. (1996). Stress and strain in granular assemblies. Mech. of Mater. 22 , No. 3, 165–177.
- 2Been & Jefferies (1985) Been, K. & Jefferies, M. G. (1985). A state parameter for sands. Géotechnique 35 , No. Volume 35, Issue 2, 99–112.
- 3Ben-Naim (2008) Ben-Naim, A. (2008). A farewell to entropy: statistical thermodynamics based on information . World Scientific.
- 4Blumenfeld & Edwards (2009) Blumenfeld, R. & Edwards, S. F. (2009). On granular stress statistics: Compactivity, angoricity, and some open issues. The Journal of Physical Chemistry B 113 , No. 12, 3981–3987.
- 5Boltzmann (2003) Boltzmann, L. (2003). Further studies on the thermal equilibrium of gas molecules. In The kinetic theory of gases : an anthology of classic papers with historical commentary (Hall, N. S., ed.), London: Imperial College Press, pp. 262–349, (English translation by Brush, S. G.).
- 6Casagrande (1936) Casagrande, A. (1936). Characteristics of cohesionless soils affecting the stability of slopes and earth fills. J. Boston Soc. Civil Eng. 23 , No. 1, 13–32.
- 7Duong (2007) Duong, T. (2007). ks: Kernel density estimation and kernel discriminant analysis for multivariate data in R. Journal of Statistical Software 21 , No. 7, 1–16.
- 8Edwards & Oakeshott (1989) Edwards, S. F. & Oakeshott, R. (1989). Theory of powders. Physica A 157 , No. 3, 1080 – 1090.