The Liquidus Temperature for Methanol-Water Mixtures at High Pressure and Low Temperature, with Application to Titan
A. J. Dougherty, Z. T. Bartholet, R. J. Chumsky, K. C. Delano, X., Huang, D. K. Morris

TL;DR
This study measures the liquidus temperature of methanol-water mixtures at high pressures to understand their antifreeze properties, revealing methanol's significant role in maintaining Titan's subsurface ocean.
Contribution
It provides new experimental data on methanol-water freezing behavior at high pressures relevant to Titan's environment, highlighting methanol's effectiveness as an antifreeze.
Findings
Methanol lowers the freezing point of water at high pressures.
Metastable states are observed in the Ice-III regime.
Methanol is more effective as an antifreeze than previously thought.
Abstract
Methanol is a potentially important impurity in subsurface oceans on Titan and Enceladus. We report measurements of the freezing of methanol-water samples at pressures up to 350~MPa using a volumetric cell with sapphire windows. For low concentrations of methanol, the liquidus temperature is typically a few degrees below the corresponding ice freezing point, while at high concentrations it follows the pure methanol trend. In the Ice-III regime, we observe several long-lived metastable states. The results suggest that methanol is a more effective antifreeze than previously estimated, and might have played an important role in the development of Titan's subsurface ocean.
Click any figure to enlarge with its caption.
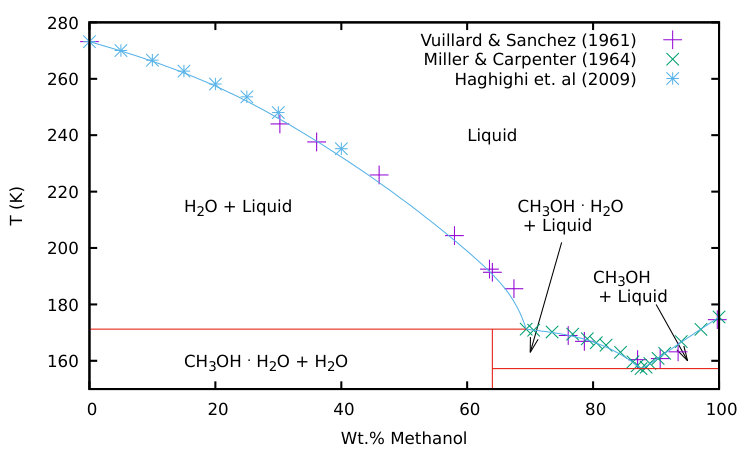 Figure 1
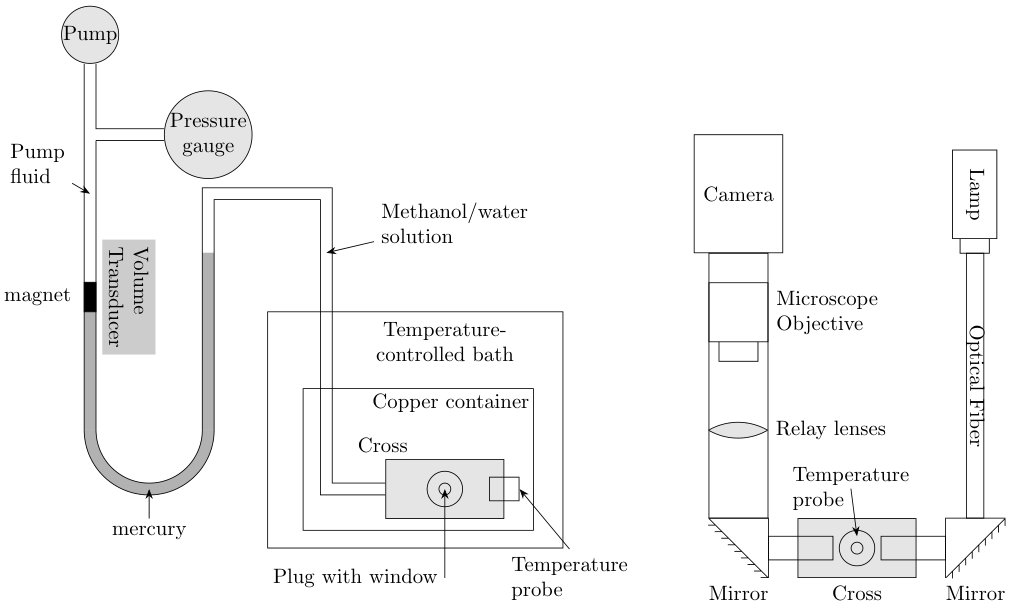 Figure 2
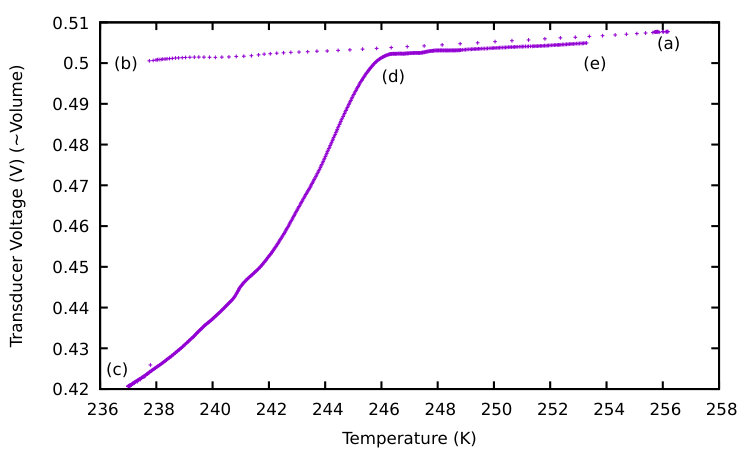 Figure 3
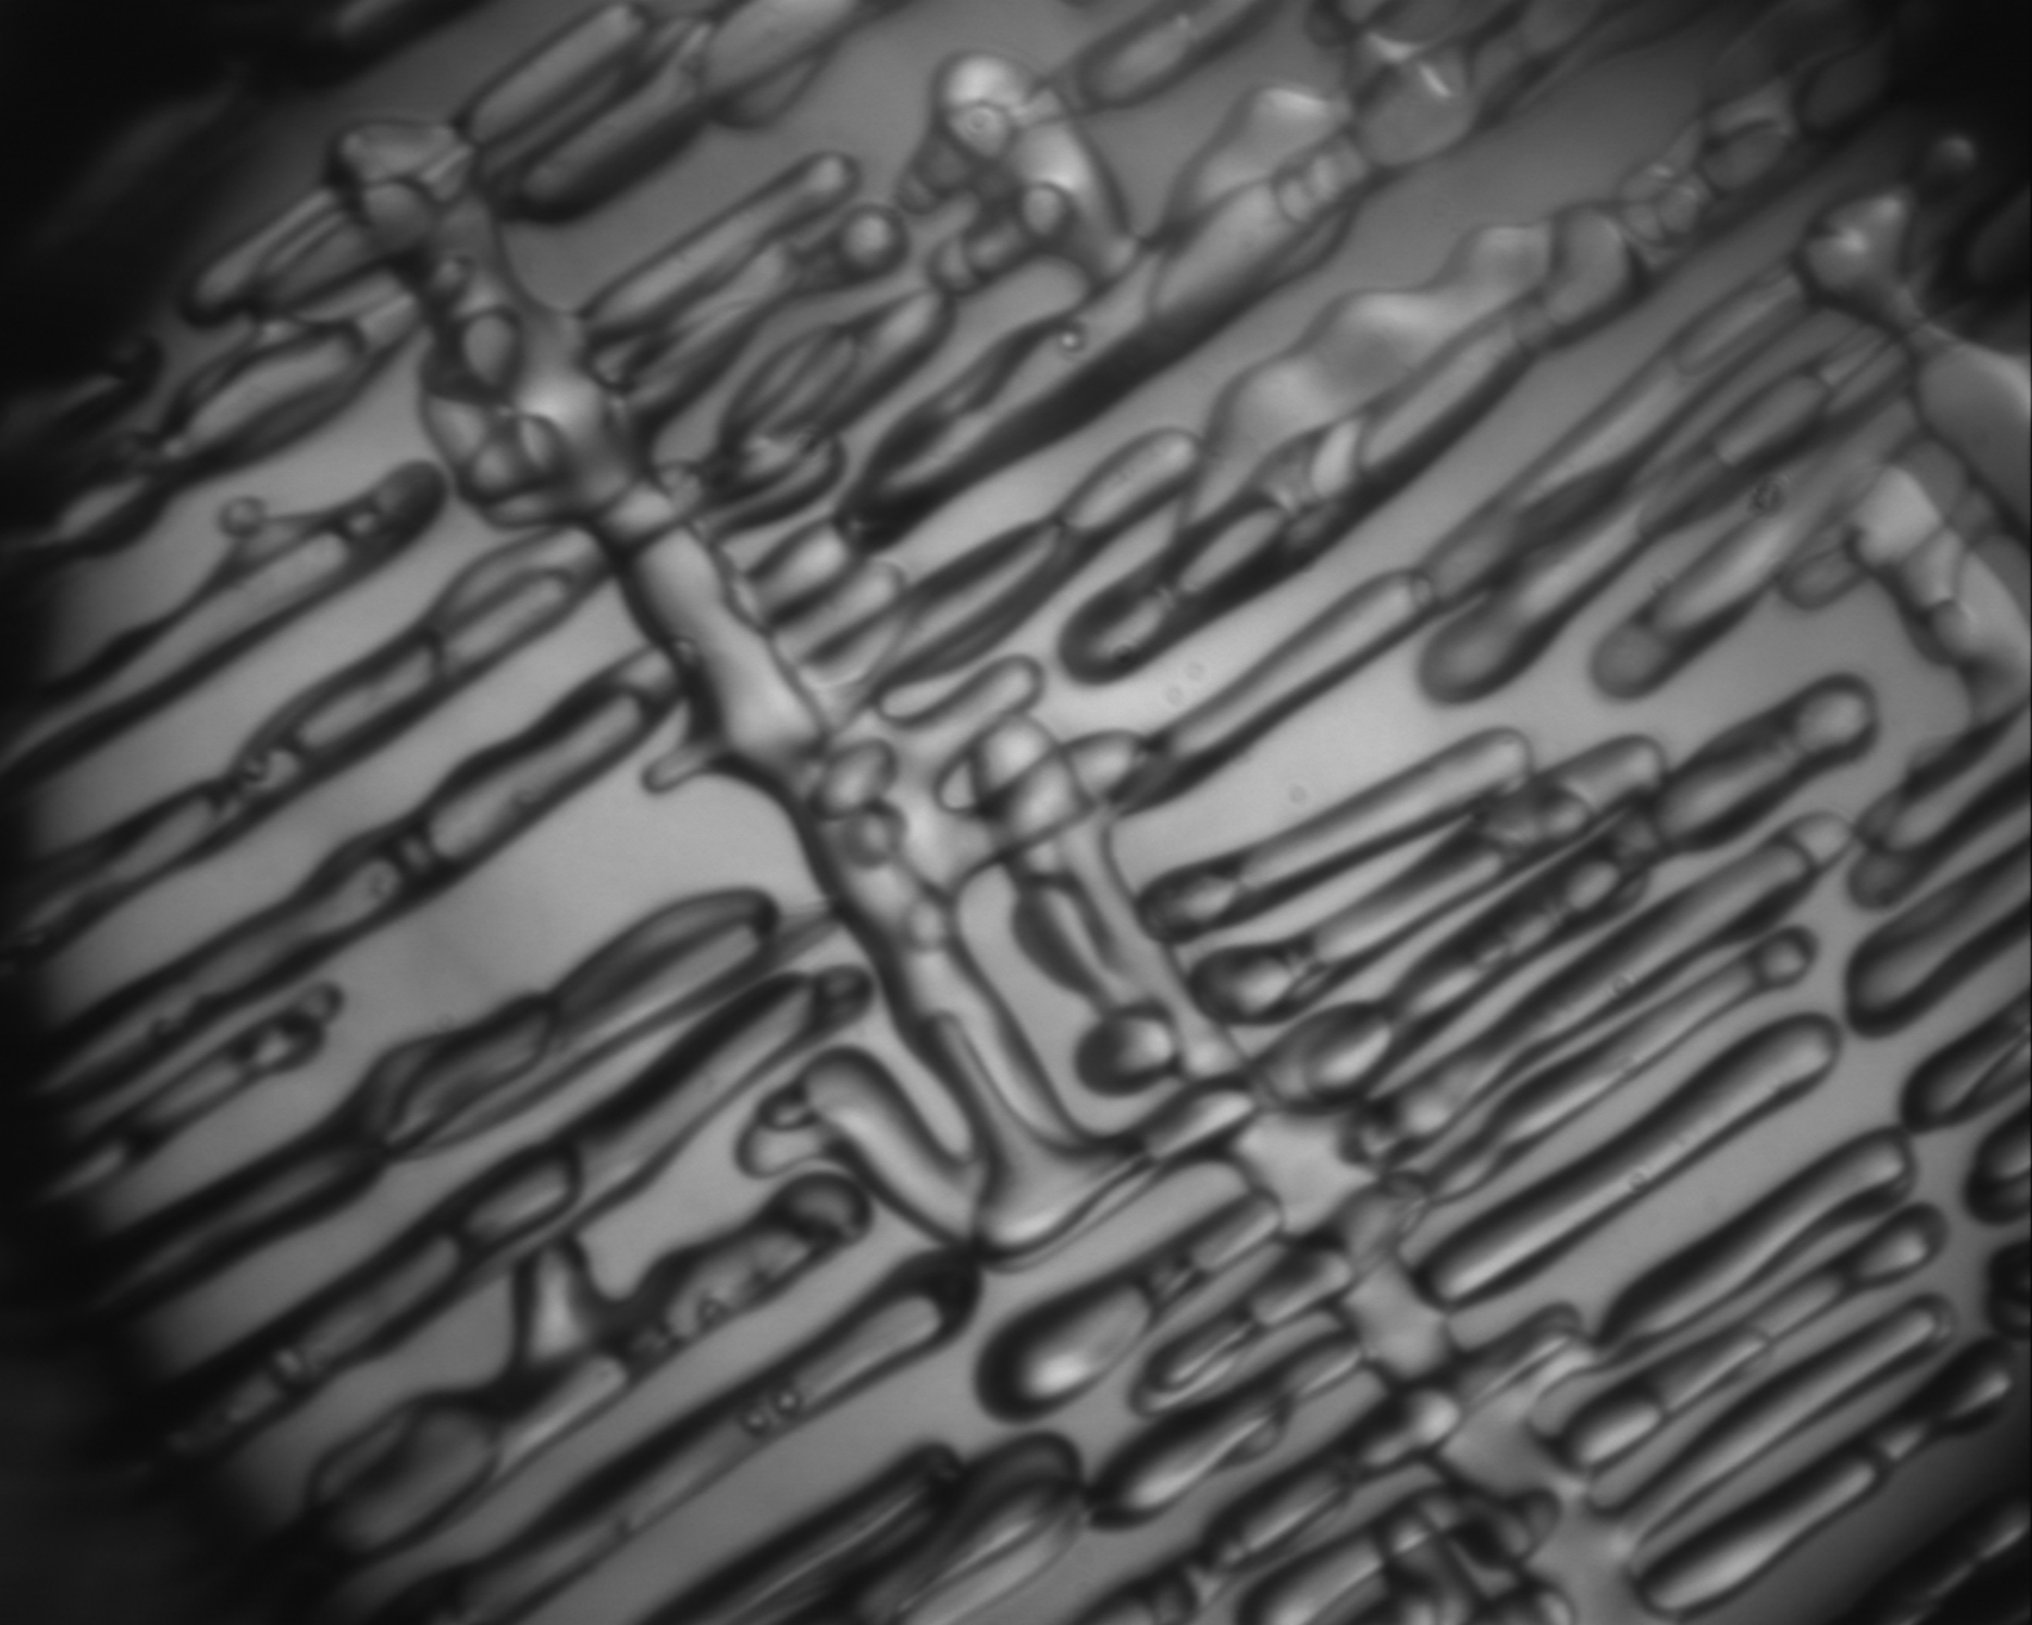 Figure 4
 Figure 4
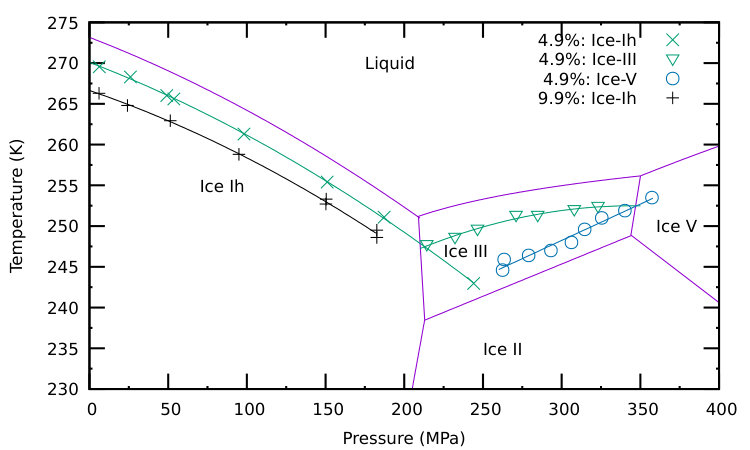 Figure 5
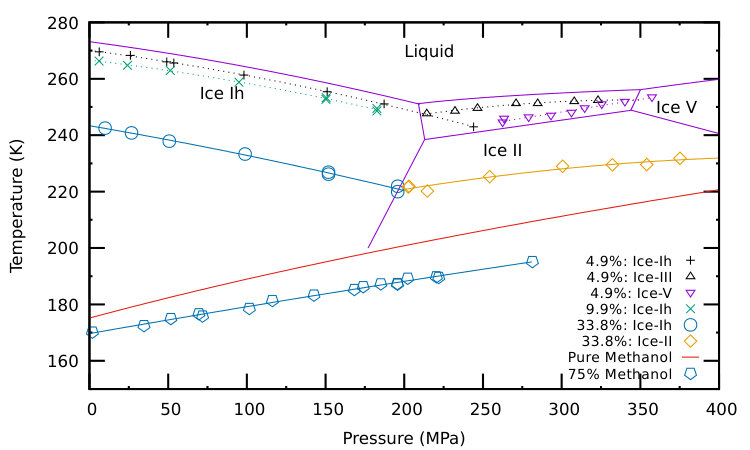 Figure 6
| Conc. | Regime | T Range (K) | (MPa) | (K) | (K/MPa) | (K/MPa2) |
|---|---|---|---|---|---|---|
| 4.9% | Ice Ih | 248–270 | 0 | |||
| 4.9% | Ice III | 248–252 | 209 | |||
| 4.9% | Ice V | 245–254 | 350 | – | ||
| 9.9% | Ice Ih | 249–266.5 | 0 |
| Concentration | Regime | (MPa) | (K) | (K/MPa) | (K/MPa2) |
|---|---|---|---|---|---|
| 33.8% | Ice Ih | 0 | |||
| 33.8% | Ice II | 209 | |||
| 75% | 0 |
Peer Reviews
No public reviews on file for this paper yet. If you reviewed it on a platform where reviews are public (OpenReview, ICLR, NeurIPS, ICML), you can paste yours below so the community can read it here.
Videos
No videos yet. Explain this paper in a talk, walkthrough, or lecture? Add one.
The Liquidus Temperature for Methanol-Water Mixtures at High Pressure
and Low Temperature, with Application to Titan
Abstract
Methanol is a potentially important impurity in subsurface oceans on Titan and Enceladus. We report measurements of the freezing of methanol-water samples at pressures up to 350 MPa using a volumetric cell with sapphire windows. For low concentrations of methanol, the liquidus temperature is typically a few degrees below the corresponding ice freezing point, while at high concentrations it follows the pure methanol trend. In the Ice-III regime, we observe several long-lived metastable states. The results suggest that methanol is a more effective antifreeze than previously estimated, and might have played an important role in the development of Titan’s subsurface ocean.
\journalname
JGR-Planets
Department of Physics, Lafayette College, Easton, Pennsylvania 18042 USA
\correspondingauthor
Andrew [email protected]
{keypoints}
Titan’s icy shell and subsurface ocean may be affected by any impurities such as methanol
We measure the freezing point of methanol/water solutions as a function of pressure
Previous estimates may have underestimated the effectiveness of methanol as an antifreeze
1 Introduction
A number of icy satellites likely contain subsurface oceans (Nimmo and Pappalardo, 2016). On Titan, evidence for a subsurface ocean comes from several sources, including gravity measurements (Iess et al., 2012) and electrical measurements of a Schumann resonance (Beghin et al., 2012), as well as computations based on obliquity (Baland et al., 2011) and surface topography (Hemingway et al., 2013; Nimmo and Bills, 2010).
Detailed models of the interior of Titan rely on the properties of aqueous solutions at the low temperatures and high pressures found within such an ocean, and such properties would be affected by the presence of impurities. Important impurities likely include ammonia, but methanol may also be present (Kargel, 1992; Hogenboom et al., 1997) and is included in models such as Neveu et al. (2017), Dunaeva et al. (2016), Lefevre et al. (2014), Fortes (2012), Tobie et al. (2012), Davies et al. (2010), and Deschamps et al. (2010). More broadly, methanol is also an important volatile found in the outer solar system nebula (Sekine et al., 2014), on the surfaces of some trans-Neptunian objects (Merlin et al., 2012), and in some star-forming regions (Dartois et al., 1999; Shimonishi et al., 2016).
As a potent antifreeze compound, small concentrations of methanol could play an important role in the formation and development of the subsurface ocean (Deschamps et al., 2010). In addition, the rheology of methanol-containing slurries could have significant implications for the structure of possible cryovolcanic flows (Zhong et al., 2009; Davies et al., 2010; Lopes et al., 2007). Although there is not conclusive evidence for widespread cryovolcanic activity on Titan (Moore and Pappalardo, 2011; Lopes et al., 2013), there are regions for which it may be a reasonable explanation of topographic features (Lopes et al., 2013; Solomonidou et al., 2014), and it is one possible source of replenishment for Titan’s atmospheric methane (Davies et al., 2016).
On Enceladus, the observations of water-rich plumes (Dougherty et al., 2006; Porco et al., 2006; Waite et al., 2009; Hansen et al., 2011; Hsu et al., 2015) reveal either the presence of a liquid reservoir or highly active melting. The composition of the plumes suggests a liquid reservoir (Hsu et al., 2015; Postberg et al., 2011), and the measured libration is consistent with a global subsurface ocean, rather than a localized reservoir (Thomas et al., 2016).
As with Titan, any subsurface ocean would likely contain impurities, such as ammonia and methanol (Kargel, 1992), that act as powerful antifreeze compounds. Small amounts of methanol may have been detected on the surface of Enceladus (Hodyss et al., 2009), as well as in the plume (Waite et al., 2009). In addition to being a powerful antifreeze, methanol could also play a role in the formation of methane hydrates (McLaurin et al., 2014).
More generally, thermodynamic models of the interiors of icy moons can benefit from an improved understanding of how the addition of small amounts of methanol will change the temperature and pressure-dependent properties of ice (Deschamps et al., 2010; Hsieh and Deschamps, 2015). In the model of Deschamps et al. (2010), for example, the authors estimated the pressure-dependent behavior of a methanol-water solution by interpolating between the pure water and pure methanol behavior.
In this work, we present results for the liquidus temperature for methanol concentrations between 5 wt.% and 75 wt.%, for pressures from 5 MPa to 350 MPa. We find that interpolation underestimates the effect of small concentrations of methanol on the freezing point.
2 Materials and Methods
2.1 Materials
The phase diagram for methanol/water solutions at atmospheric pressure is shown in Fig. 1. The eutectic concentration is approximately 88 wt.%.
Sample solutions were made from HPLC-grade methanol (EMD Chemicals, 99.8%) and HPLC-grade filtered water (Fisher Scientific). Solutions of approximately 4.9, 9.9, 33.8, and 75 wt.% methanol were studied. (All concentrations are methanol mass divided by total solution mass.) Since methanol is highly hygroscopic, the concentration would change somewhat during the extensive filling and leak-testing process. The beaker of solution was exposed to the atmosphere for periods of hours, and residual water from flushing and cleaning the connecting tubing could not be completely eliminated. In addition, when leak-testing with partially frozen Ice Ih samples, any leaked fluid would be enriched in methanol. The net effect could be a significant change, on the order of 4%. Accordingly, in each case, once the system was filled and sealed, and leak testing was completed, the concentration of the sample was estimated by extrapolating the low-pressure liquidus temperature to 1 atmosphere, and comparing it with the data in Fig. 1. Those estimated concentrations are the values reported here.
The range of concentrations was chosen to explore both the low-concentration regime where the initial solid formed is ice Ih, and the high-concentration regime where the initial solid formed is methanol monohydrate. The former is relevant for the proposed primordial bulk composition of Titan’s ocean (Deschamps et al., 2010), while the latter would be relevant for the freezing of a trapped subsurface body of liquid, where the concentration would tend towards the eutectic.
The range of pressures was limited by the maximum pressure able to be maintained with the apparatus, generally about 350 MPa. For models of Titan that include an outer Ice Ih shell roughly 100 km thick and a subsurface ocean atop an inner high-pressure Ice V or Ice VI layer, such as Fortes (2012) and Dunaeva et al. (2014), this would correspond to the pressure in the ocean at a depth of roughly 120 km below the Ice Ih shell.
2.2 Methods
The apparatus and technique are similar to those described in previous papers for magnesium sulfate and ammonia-water mixtures (Hogenboom et al., 1995, 1997), enhanced to allow optical access to the sample. The system is shown in Fig. 2.
Approximately 1 mL of sample is loaded into a pressure cell that is placed in a copper container and immersed in an insulated, temperature-controlled ethanol/water bath. The pressure cell is made from a 316 stainless steel block with four ports, known as a cross (High Pressure Equipment Company #60-HF6). Two opposing ports contain replaceable plugs that have sapphire windows sealed in them with epoxy. The third port contains a plug in which a silicon diode thermometer is installed. The fourth port connects the cell to the pressure system. Pressure is applied through a pump with ethylene glycol as the pump fluid. Pressure is measured with two Heise gauges: an analog pressure gauge valid for all pressures studied, and a more sensitive digital pressure gauge for pressures below 200 MPa.
The sample in the pressure cell is separated from the ethylene glycol pump fluid by a vertical U-tube filled with mercury. A steel capillary tube of constant cross section forms one arm of the U-tube. A small Alnico magnet is placed in the capillary on the interface between the pump fluid and the mercury, and the height of that magnet is measured by a transducer. Changes in the transducer voltage are approximately proportional to changes in sample volume. As long as the sample is mostly liquid, this system allows simultaneous measurements of temperature, pressure, and volume of the sample.
The imaging system consists of a lamp that shines light through an infrared filter and optical fiber that directs the beam horizontally through the sample cell. The infrared filter is used to minimize heating of the sample by the light source. After passing through the cell, the beam is reflected by a mirror upward through a matched pair of lenses to a long working distance optical microscope objective coupled to a Pulnix digital camera. The camera obtains images of a vertical cross-section of the sample, with pixels and an overall resolution of about 1.7 m/pixel. The gap between the sapphire windows is approximately 1 mm. Although the camera’s field of view does not cover the entire system, we typically observed dissolving or growing crystals corresponding to changes in temperature, pressure, and volume, indicating that the crystal images reflect the phase transitions within the sample.
For runs above a temperature of 210 K, the temperature is controlled by a immersion cooler in the ethanol/water bath. The cooling and warming rates are controlled by computer. In these viscous solutions, it is important to allow sufficient time for the system to approach thermodynamic equilibrium. Typically, the temperature was increased at a rate of 0.005 K/minute, or even more slowly, to ensure that the system was near thermodynamic equilibrium. For colder temperatures (such as were needed for the 75 wt.% runs), liquid nitrogen was used to cool the system, and the system warmed up as the nitrogen evaporated. The warming rates in those cases were typically closer to 0.1 K/minute.
3 Data
The results for a run with a 4.9 wt.% solution at a nominal pressure of 263 MPa are shown in Fig. 3. The horizontal axis shows temperature, while the vertical axis gives the transducer voltage, which varies approximately linearly with volume. The run started with a homogeneous liquid (point a) at a temperature of 256 K. Upon cooling, the liquid contracted gradually until about 237.8 K (point b), where the supercooled sample rapidly froze and many ice crystals were visible in the window. This crystallization was accompanied by a sharp decrease in volume and pressure, indicating that the solid formed was denser than the surrounding liquid. Upon further cooling, the pressure reached about 252 MPa at a temperature of 237 K (point c). The sample was then gradually warmed at a rate of 0.005 K/min. As the sample warmed, the volume gradually increased and ice crystals could be observed falling downward in the image. At 245.9 K (point d), the melting was complete, and the now-liquid sample gradually expanded with temperature as it continued to warm (point e). A typical run would last about three days.
The liquidus temperature was then estimated by finding the intersection of straight lines fitted to the end of the melting curve (just before point d) and the pure liquid warming curve (after point d). For sufficiently slow warming, the transition was fairly sharp and the uncertainties in the liquidus temperature were typically less than K. For transition temperatures below about 210 K, where liquid nitrogen was used for cooling and the warming rates were closer to 0.1 K/min, the transitions were more rounded and the uncertainties were closer to K. Uncertainties in pressure were typically less than MPa for runs below 200 MPa, and about MPa for runs above 200 MPa, due to the different pressure gauges used.
An image of crystals formed at 212.8 MPa, presumably Ice-III, is shown in Fig. 4. The volume decreased when these crystals formed, indicating that the solid is denser than the surrounding liquid. Upon warming, the volume increased and the crystals fell downward, again indicating a denser solid phase.
4 Results
4.1 Low methanol concentrations
The resulting liquidus temperatures for two low-concentration samples (4.9 wt.% and 9.9 wt.%) are shown in Fig. 5, along with the boundaries for various phases of ice. (For the 9.9% sample, a leak in the pressure system prevented the acquisition of data at pressures above about 200 MPa.)
In the region between 200 MPa and 350 MPa, we observed three different states, all for the same 4.9 wt.% sample. In one run at 244 MPa, the volume increased upon freezing, and the ice crystals were less dense than the surrounding fluid. The liquidus point for that sample was approximately 243 K, clearly consistent with a metastable continuation of the Ice-Ih regime curve. We also observed two different states where the volume decreased upon freezing, and the ice crystals were more dense than the surrounding fluid. These states fall on two distinct curves in Fig. 5. The states labeled Ice-III had a lower density than the ones labeled Ice-V, but we were not able to measure absolute densities of solids with this apparatus. The lower-temperature data may follow an extension of the Ice V regime curve, consistent with the formation of metastable Ice V, as suggested by Evans (1967), and are included in the Ice V regime fits.
The two states also differed in the experimental protocol necessary for their formation. For pressures below about 240 MPa, the system would spontaneously freeze upon supercooling into either Ice-Ih or Ice-III (as in Fig. 4). For pressures above 240 MPa, the system would spontaneously freeze as Ice-V (as in Fig. 3). In order to prepare Ice-III samples at higher pressures, we would first cool at a pressure of approximately 230 MPa until ice crystals formed, and then raise the pressure up to the desired target.
4.2 Fits
To fit the data, we considered a number of different candidate functional forms. In particular, we tried functions of the form used by Wagner et al. (2011) for modeling the pure ice melting curves,
[TABLE]
where the numerical values of the parameters for pure ice are given in Wagner et al. (2011).
However, our data do not cover a wide enough range of temperatures to constrain the parameters, particularly in the Ice III regime, especially since the the values for and are not independently known.
We also considered the Simon-Glatzel equation (Simon and Glatzel, 1929), as well as the modified form proposed by Kechin (1995):
[TABLE]
where . This is similar to including a single term from Eq. 1, but with an additional exponential decay term . However, that term did not significantly improve the quality of the fit, and the values for were consistent with zero. We also considered other forms sometimes used for the melting of pure substances, such as that recommended by Yi-Jing et al. (1982), but they either did not fit as well over the full range of the data, or required more parameters that were typically poorly constrained.
The best descriptions of the data were ultimately obtained with simple polynomial fits of the form
[TABLE]
The term was arbitrarily fixed at a convenient pressure so that the uncertainties more accurately reflected the fit over the pressure range of interest. The coefficients for the curves in Fig. 5 are given in Table 1.
4.3 Higher methanol concentrations
The results for two additional samples, at 33.8 and 75 wt.%, are included in Fig. 6. For the 75 wt.% sample, the solid formed is presumably CH3OHH2O, as shown in the phase diagram (Fig. 1). The coefficients for the fits are given in Table 2.
5 Discussion
Methanol is a potentially important antifreeze. Specifically, we find that the freezing point depression due to the addition of methanol is about 3.1 K for a concentration of 4.9 wt.%, 5.8 K for 9.9 wt.%, and grows to about 31 K for a concentration of 33.8 wt.%. For the low concentrations of planetary relevance ( wt.%), we find the freezing point depression (in Kelvin) due to the addition of methanol is roughly independent of pressure, at least for the two concentrations measured (4.9 wt.% and 9.9 wt.%) in the Ice-Ih regime, and is reasonably represented over that range as a function of percent methanol concentration by
[TABLE]
In contrast, a linear interpolation between the Ice-Ih and pure methanol curves, as was used in Deschamps et al. (2010), gives a freezing point depression that decreases with increasing pressure, and hence tends to underestimate the effect of adding methanol. Specifically, for a 4.9 wt.% concentration of methanol and a pressure of 200 MPa, the measured liquidus temperature based on Table 1 yields a freezing point depression of approximately 3.1 K, while a linear interpolation yields a smaller effect of only 1.6 K. Or, equivalently, that same 1.6 K freezing point depression at 200 MPa could be achieved with only a 2.7 wt.% concentration.
6 Conclusions
In their modeling of Titan’s primordial ocean, Deschamps et al. (2010) found that the inclusion of methanol reduced the solidification temperature, and hence reduced convection and heat transfer in the outer Ice Ih shell. Ultimately, this could lead to an end to crystallization and the maintenance of a subsurface ocean. The main contribution from the present experiments is to observe that methanol is an even more effective antifreeze than expected, so that a subsurface ocean might be maintained with an even lower methanol concentration than considered there.
More generally, models of the interiors of Titan, Enceladus, and other bodies with subsurface oceans can benefit from more information about the thermodynamic behaviors of aqueous solutions at the relevant temperatures and pressures. For Titan and Enceladus, methanol is one reasonable impurity to include in such models. For other outer solar system bodies and even exoplanets, incorporation of methanol may similarly lead to a subsurface ocean being maintained where a pure water ocean might completely freeze. Since many of the of thermodynamic and rheological properties of an ocean and icy shell are strongly temperature-dependent, it may be worthwhile to include this freezing point depression in future modeling.
Acknowledgements.
Financial support was provided by Lafayette College. Data used in the figures is available at https://data.mendeley.com/datasets/fwpf6t3bxn/1. The authors thank D.L. Hogenboom for assistance in building the pressure system.
The reference list from the paper itself. Each links out to its DOI / PubMed record.
- 1Baland et al. (2011) Baland, R. M., T. V. Hoolst, M. Yseboodt, and O. Karatekin (2011), Titan’s obliquity as evidence of a subsurface ocean?, Astron. & Astrophys. , 530 , 1–6, 10.1051/0004-6361/201116578 . · doi ↗
- 2Beghin et al. (2012) Beghin, C., O. Randriamboarison, M. Hamelin, E. Karkoschka, C. Sotin, R. C. Whitten, J.-J. Berthelier, R. Grard, and F. Simoes (2012), Analytic theory of Titan’s Schumann resonance: Constraints on ionospheric conductivity and buried water ocean, Icarus , 218 (2), 1028–1042, 10.1016/j.icarus.2012.02.005 . · doi ↗
- 3Dartois et al. (1999) Dartois, E., W. Schutte, T. R. Geballe, K. Demyk, P. Ehrenfreund, and L. d’Hendecourt (1999), Methanol: The second most abundant ice species towards the high-mass protostars RAFGL 7009 S and W 33A, Astron. Astrophys. , 342 (2), L 32–L 35.
- 4Davies et al. (2010) Davies, A. G., C. Sotin, D. L. Matson, J. Castillo-Rogez, T. V. Johnson, M. Choukroun, and K. H. Baines (2010), Atmospheric control of the cooling rate of impact melts and cryolavas on Titan’s surface, Icarus , 208 (2), 887–895, 10.1016/j.icarus.2010.02.025 . · doi ↗
- 5Davies et al. (2016) Davies, A. G., C. Sotin, M. Choukroun, D. L. Matson, and T. V. Johnson (2016), Cryolava flow destabilization of crustal methane clathrate hydrate on Titan, Icarus , 274 , 23–32, 10.1016/j.icarus.2016.02.046 . · doi ↗
- 6Deschamps et al. (2010) Deschamps, F., O. Mousis, C. Sanchez-Valle, and J. I. Lunine (2010), The role of methanol in the crystallization of Titan’s primordial ocean, Astrophys. J. , 724 (2), 887–894, 10.1088/0004-637X/724/2/887 . · doi ↗
- 7Dougherty et al. (2006) Dougherty, M., K. Khurana, F. Neubauer, C. Russell, J. Saur, J. Leisner, and M. Burton (2006), Identification of a dynamic atmosphere at Enceladus with the Cassini magnetometer, Science , 311 (5766), 1406–1409, 10.1126/science.1120985 . · doi ↗
- 8Dunaeva et al. (2010) Dunaeva, A. N., D. V. Antsyshkin, and O. L. Kuskov (2010), Phase diagram of H 2O: Thermodynamic functions of the phase transitions of high-pressure ices, Sol Syst. Res. , 44 (3), 202–222, 10.1134/S 0038094610030044 . · doi ↗