Predicting the Extreme Ultraviolet Radiation Environment of Exoplanets Around Low-Mass Stars: the TRAPPIST-1 System
Sarah Peacock, Travis Barman, Evgenya L. Shkolnik, Peter H., Hauschildt, E. Baron

TL;DR
This study models the extreme ultraviolet radiation environment of TRAPPIST-1 using semi-empirical stellar atmosphere models, providing insights into the high-energy radiation impacting its exoplanets' atmospheres, which are crucial for habitability assessments.
Contribution
The paper develops and calibrates new semi-empirical non-LTE models of TRAPPIST-1's EUV spectrum constrained by observational data, advancing understanding of stellar radiation environments around ultra-cool dwarfs.
Findings
EUV fluxes range from 1.32 to 17.4 x 10^{-14} erg s^{-1} cm^{-2}.
EUV emission is highly sensitive to transition region temperature structure.
Higher activity models predict EUV fluxes ten times greater than lower activity models.
Abstract
The high energy radiation environment around M dwarf stars strongly impacts the characteristics of close-in exoplanet atmospheres, but these wavelengths are difficult to observe due to geocoronal and interstellar contamination. On account of these observational restrictions, a stellar atmosphere model may be used to compute the stellar extreme ultraviolet (EUV; 100 - 912 \AA) spectrum. We present a case study of the ultra-cool M8 dwarf star, TRAPPIST-1, which hosts seven transiting short-period terrestrial sized planets whose atmospheres will be probed by the James Webb Space Telescope. We construct semi-empirical non-LTE model spectra of TRAPPIST-1 that span EUV to infrared wavelengths (100 \AA\ - 2.5 m) using the atmosphere code PHOENIX. These upper-atmosphere models contain prescriptions for the chromosphere and transition region and include newly added partial frequency…
Click any figure to enlarge with its caption.
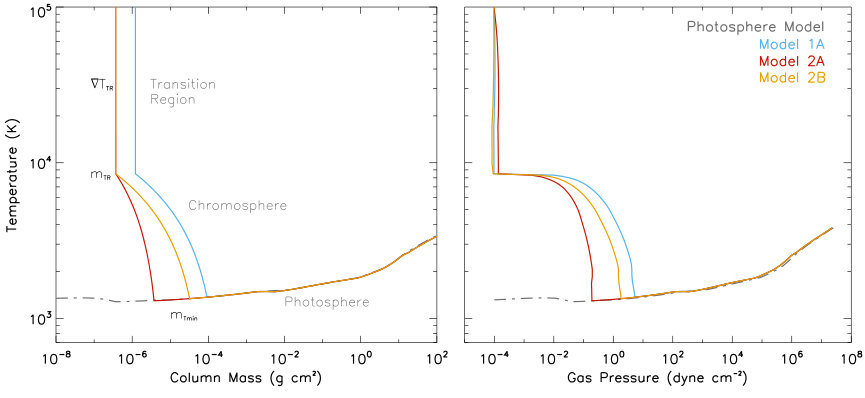 Figure 1
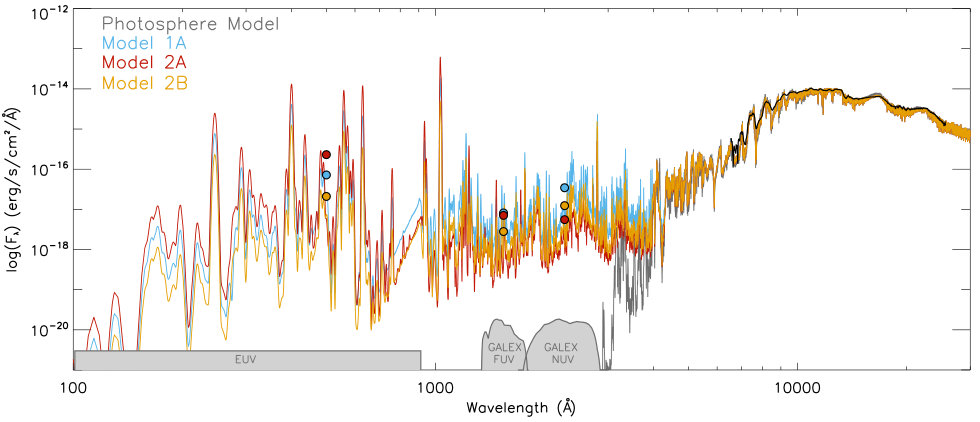 Figure 2
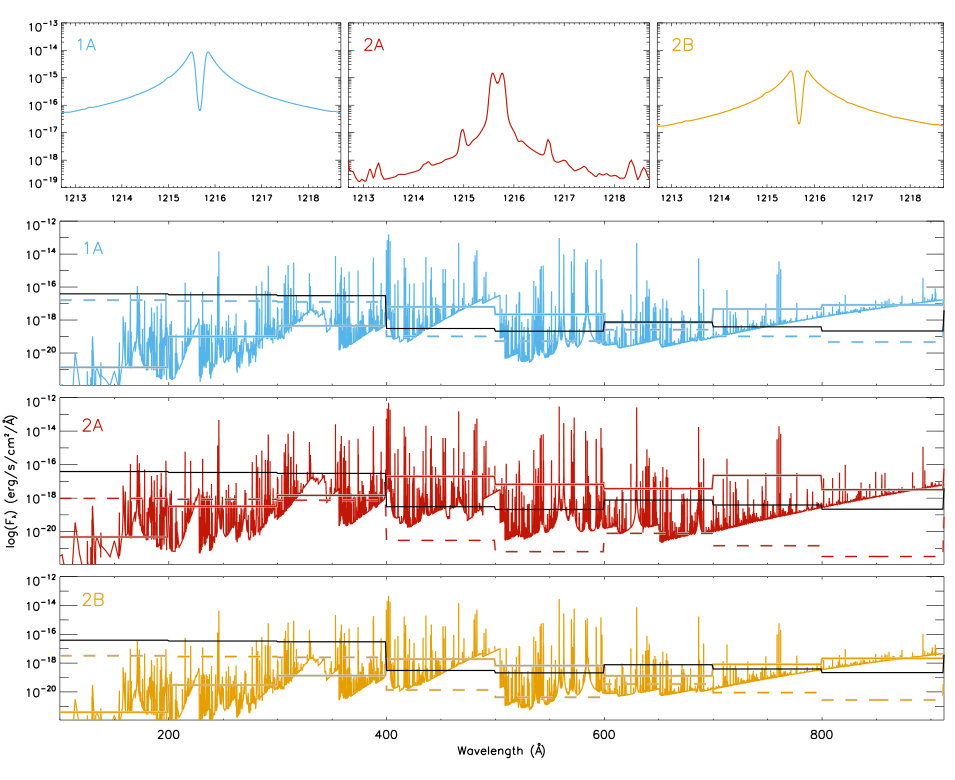 Figure 3
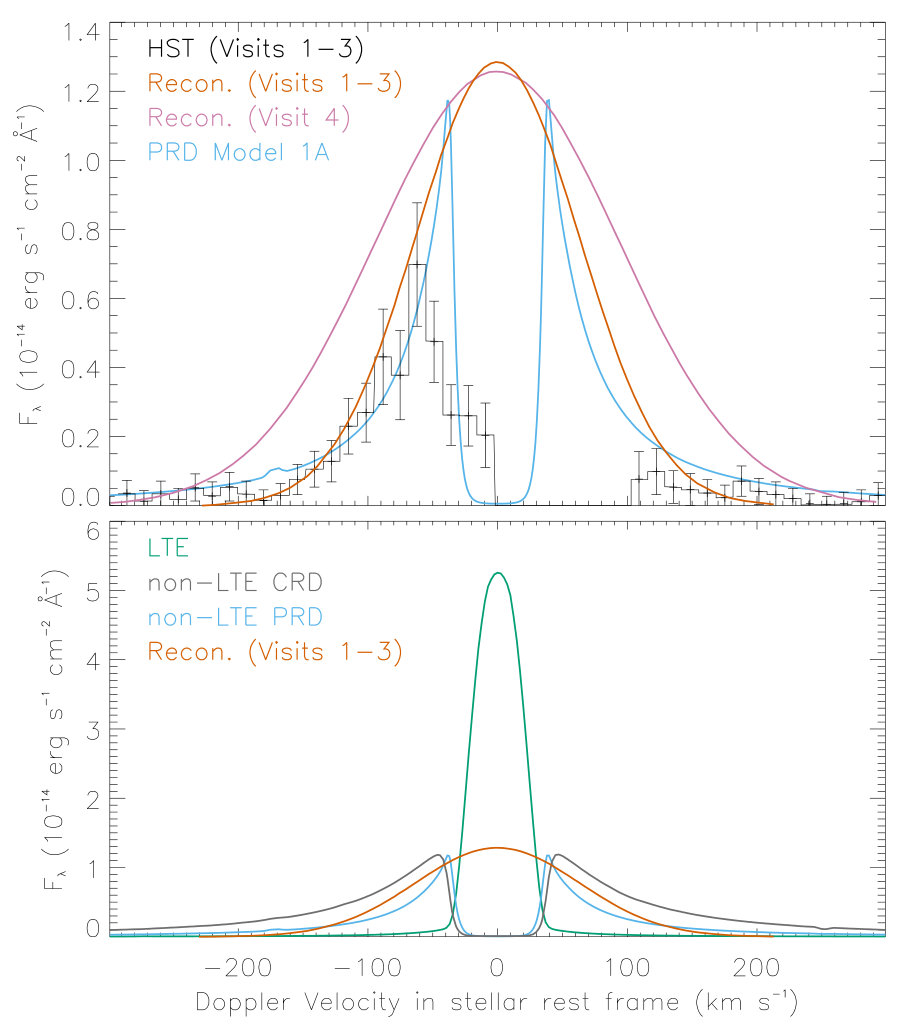 Figure 4
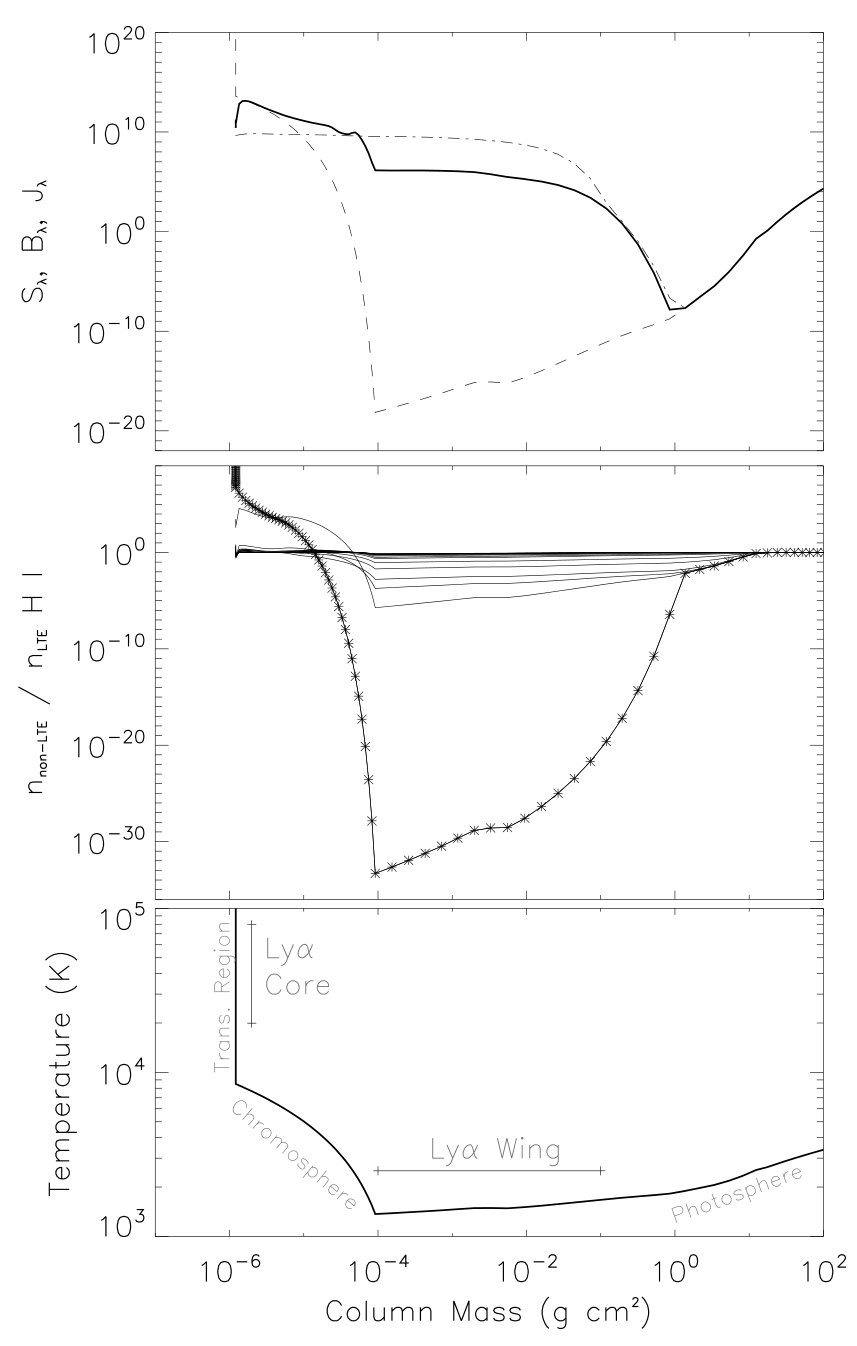 Figure 5
| Model | TTR | mTR | mTmin |
|---|---|---|---|
| (K g-1 cm-2) | (g cm2) | (g cm2) | |
| 1A | 109 | 10-6 | 10-4 |
| 2A | 108 | 10-6.5 | 10-5.5 |
| 2B | 109 | 10-6.5 | 10-4.5 |
| Star | TRAPPIST-1 |
|---|---|
| Spectral Type | M8 |
| Teff (K) | 2559 5011footnotemark: |
| M⋆ (M⊙) | 0.080 0.00711footnotemark: |
| R⋆ (R⊙) | 0.117 0.00311footnotemark: |
| Distance (pc) | 12.1 0.411footnotemark: |
| Age (Gyr) | 7.6 2.222footnotemark: |
| Spectral | Distance | Teff | log(FFUV)aaFlux density scaled to 12.1 pc | log(FNUV)aaFlux density scaled to 12.1 pc | |
|---|---|---|---|---|---|
| Type | (pc) | (K) | (erg s-1 cm-2 Å-1) | (erg s-1 cm-2 Å-1) | |
| M8 Field Stars | |||||
| 2MASS 12590470-4336243 | M8 | 7.74 0.0711footnotemark: | 257033footnotemark: | -16.4 | -16.9 0.2 |
| 2MASS 10481463-3956062 | M8.5 | 4.05 0.0211footnotemark: | 250044footnotemark: | -17.0 | -17.1 0.1 |
| 2MASS 18353790+3259545 | M8.5 | 5.66 0.0222footnotemark: | 257855footnotemark: | -17.5 | -16.9 0.01 |
| HAZMAT III Sample66footnotemark: | |||||
| 0.08-0.35 M☉, 5 Gyr | M3.5 – M9 | -17.3 | -17.0 | ||
| PHOENIX Models | |||||
| Model 1A | 2559 | -17.1 | -16.5 | ||
| Model 2A | 2559 | -17.1 | -17.2 | ||
| Model 2B | 2559 | -17.5 | -16.9 |
| Species | (Å) | Model 1A | Model 2A | Model 2B |
|---|---|---|---|---|
| Si II | 1264.73 | 110.83 | 0.12 | 24.45 |
| Si III | 1298.95 | 0.29 | 0.05 | 0.10 |
| O I | 1302.17 | 5.01 | 0.03 | 0.73 |
| O I | 1304.86 | 4.52 | 0.02 | 0.48 |
| O I | 1306.03 | 3.54 | 0.01 | 0.24 |
| Si II | 1309.28 | 103.09 | 7.91 | 26.08 |
| C II | 1335.71 | 36.60 | 0.18 | 5.42 |
| Fe II | 1391.08 | 210.72 | 36.87 | 75.94 |
| Si II | 1526.71 | 44.29 | 0.09 | 5.92 |
| Si II | 1533.43 | 47.67 | 0.20 | 6.94 |
| C IV | 1550.77 | 17.12 | 8.34 | 9.83 |
| Al II | 1670.79 | 310.14 | 0.11 | 101.20 |
| Al I | 1766.39 | 470.93 | 151.80 | 158.00 |
| Mg II k | 2796.35 | 6919.41 | 1281.44 | 8274.69 |
| Mg II h | 2803.53 | 11297.31 | 286.99 | 4432.94 |
| Ca II K | 3934.78 | 389.44 | 1.06 | 50.74 |
| Ca II H | 3969.59 | 302.74 | 0.79 | 34.15 |
Peer Reviews
No public reviews on file for this paper yet. If you reviewed it on a platform where reviews are public (OpenReview, ICLR, NeurIPS, ICML), you can paste yours below so the community can read it here.
Videos
No videos yet. Explain this paper in a talk, walkthrough, or lecture? Add one.
PREDICTING THE EXTREME ULTRAVIOLET RADIATION ENVIRONMENT OF EXOPLANETS AROUND LOW-MASS STARS: THE TRAPPIST-1 SYSTEM
Sarah Peacock
University of Arizona, Lunar and Planetary Laboratory, 1629 E University Boulevard, Tucson, AZ 85721, USA
Travis Barman
University of Arizona, Lunar and Planetary Laboratory, 1629 E University Boulevard, Tucson, AZ 85721, USA
Evgenya L. Shkolnik
School of Earth and Space Exploration, Arizona State University, Tempe, AZ 85281, USA
Peter H. Hauschildt
Hamburger Sternwarte, Gojenbergsweg 112, D-21029 Hamburg, Germany
E. Baron
Homer L. Dodge Department of Physics and Astronomy, University of Oklahoma, 440 W. Brooks, Rm 100, Norman, OK 73019-2061 USA
Hamburger Sternwarte, Gojenbergsweg 112, D-21029 Hamburg, Germany
(Accepted 2018 December 14)
Abstract
The high energy radiation environment around M dwarf stars strongly impacts the characteristics of close-in exoplanet atmospheres, but these wavelengths are difficult to observe due to geocoronal and interstellar contamination. On account of these observational restrictions, a stellar atmosphere model may be used to compute the stellar extreme ultraviolet (EUV; 100 – 912 Å) spectrum. We present a case study of the ultra-cool M8 dwarf star, TRAPPIST-1, which hosts seven transiting short-period terrestrial sized planets whose atmospheres will be probed by the James Webb Space Telescope. We construct semi-empirical non-LTE model spectra of TRAPPIST-1 that span EUV to infrared wavelengths (100 Å – 2.5 m) using the atmosphere code PHOENIX. These upper-atmosphere models contain prescriptions for the chromosphere and transition region and include newly added partial frequency redistribution capabilities. In the absence of broadband UV spectral observations, we constrain our models using HST Ly observations from TRAPPIST-1 and GALEX FUV and NUV photometric detections from a set of old M8 stars (1 Gyr). We find that calibrating the models using both data sets separately yield similar FUV and NUV fluxes, and EUV fluxes that range from (1.32 – 17.4) 10*-14* ergs s*-1* cm*-2*. The results from these models demonstrate that the EUV emission is very sensitive to the temperature structure in the transition region. Our lower activity models predict EUV fluxes similar to previously published estimates derived from semi-empirical scaling relationships, while the highest activity model predicts EUV fluxes a factor of ten higher. Results from this study support the idea that the TRAPPIST-1 habitable zone planets likely do not have much liquid water on their surfaces due to the elevated levels of high energy radiation emitted by the host star.
stars: activity, stars: chromospheres, stars: low-mass, ultraviolet: stars
††journal: ApJ††software: PHOENIX (Hauschildt, 1993; Hauschildt & Baron, 2006; Baron & Hauschildt, 2007)
\NewPageAfterKeywords
1 Introduction
High energy radiation is damaging to close-in exoplanets, as increased levels of exposure can cause atmospheric expansion and escape and lead to the loss of global oceans (Lammer et al., 2007; Owen & Jackson, 2012; Luger & Barnes, 2015; Chadney et al., 2016). Planets become vulnerable to water loss as stellar far-ultraviolet (FUV; 1150 – 1700 Å) fluxes dissociate atmospheric H2O, yielding atomic hydrogen susceptible to ionization by stellar extreme ultraviolet (EUV; 100 – 912 Å) radiation (Kasting et al., 1985; Miguel et al., 2015; Bolmont et al., 2017). As the combined X-ray and EUV (XUV; 5 – 912 Å) radiation heats and expands a planet’s upper atmosphere, mass loss occurs via the hydrodynamic outflow of hydrogen or in the form of ion pickup by the stellar wind (Tian et al., 2008; Murray-Clay et al., 2009; Rahmati et al., 2014; Tripathi et al., 2015).
Current capabilities allow for FUV and limited X-ray (5 – 175 Å) measurements, but observing stars other than the Sun across the EUV is impossible due to a lack of instruments operating in the necessary wavelength range. Additionally, EUV observations are hindered by contamination from Earth’s geocoronal hydrogen and helium gas and optically thick interstellar hydrogen absorbing most of the spectrum between 400 – 912 Å (Barstow & Holberg, 2007). Under such restrictions, efforts to quantify EUV radiation rely on semi-empirical models that extrapolate into the EUV from either X-ray or UV observations (e.g. Lecavelier Des Etangs, 2007; Sanz-Forcada et al., 2011; Fontenla et al., 2016) or empirical scaling relationships based on existing X-ray (Chadney et al., 2015) or Lyman (Ly; 1215.67 Å) (Linsky et al., 2014) observations. Ly is the strongest emitting line in the FUV and likely drives photochemistry in the upper atmospheres of planets (Trainer et al., 2006).
Sanz-Forcada et al. (2011) produced synthetic XUV spectra of 82 late-F to mid-M planet hosts using emission measure distribution coronal models based on XMM-Newton, Chandra, and ROSAT X-ray observations. While emission features of highly ionized lines found at X-ray and EUV wavelengths form in the corona, the EUV continuum and many EUV and FUV emission lines form at cooler temperatures in the transition region and chromosphere. Since X-ray measurements only yield information about the hottest temperature layers of the star, relying solely on these observations to estimate the EUV and FUV spectrum results in under-predicted line fluxes (France et al., 2016; Louden et al., 2017).
Adapting their semi-empirical solar atmosphere code to apply to M stars, Fontenla et al. (2016) used the Solar-Stellar Radiation Physical Modeling (SSRPM) tools to compute a 1D non-local thermodynamic equilibrium (non-LTE) spectrum of the M2 star, GJ 832. This M dwarf atmosphere model includes a prescription for the chromosphere, transition region, and corona and has direct comparison to observed spectra in FUV, NUV, and optical wavelengths. In this model, FUV spectra from the Hubble Space Telescope (HST) were used to constrain the transition region structure, while the total X-ray luminosity and the formation temperature of the observed Fe XII 1242 Å line were used to determine the temperature structure of the corona. The SSRPM model spectrum fits the observed UV and optical emission lines and continua well and predicts EUV luminosities similar to the active Sun.
The compact system around TRAPPIST-1 presents an interesting case study for examining the effects of high energy radiation on several close-in exoplanets. TRAPPIST-1 is a moderately active (Gillon et al., 2016) ultracool dwarf star located at 12.1 pc, which hosts seven transiting planets orbiting within 6.3 10*-2* AU. Of these terrestrial-sized planets, three have surface equilibrium temperatures that could allow water to exist in liquid form on their surface (e, 0.0282 AU; f, 0.0371 AU; g, 0.0451 AU).
Recent studies estimate the XUV flux incident on the TRAPPIST-1 planets using X-ray and Ly observations and analyze the stability of the planet atmospheres exposed to the predicted radiation levels. Wheatley et al. (2017) observed TRAPPIST-1 with XMM-Newton and found that the X-ray luminosity of the star is similar to that of the quiet Sun. Using an scaling relationship from Chadney et al. (2015), they estimate the XUV flux to be (6.8 – 10.1) 10*-14* ergs s*-1* cm*-2*. Bourrier et al. (2017a, b) observed the Ly line with HST in a series of four visits where the shape of the line profile appears to vary over time?. They calculate the EUV flux using the scaling relationship from Linsky et al. (2014) and summing with the observed X- ray fluxes from Wheatley et al. (2017), estimate the stellar XUV flux from TRAPPIST-1 to be (3.0 – 4.1) 10*-14* ergs s*-1* cm*-2*. Inputting these values into simple energy limited escape models, both studies find that there is sufficient high energy radiation to lead to the complete loss of oceans and atmospheres from the three habitable zone planets.
In this paper, we present new, non-LTE model EUV-IR spectra of the M8 star, TRAPPIST-1. The stellar EUV-NUV spectrum is important for studying star-planet interactions and is a critical input for both photochemical and atmospheric escape models of exoplanet atmospheres. These models include prescriptions for the stellar upper atmosphere, including the chromosphere and transition region, where EUV, FUV and NUV fluxes originate. In Section 2, we describe the construction of the model. We discuss how we constrain our models and compare resulting spectra to observations in Section 3. In Section 4, we explore the application of the scaling relationship to our models and discuss current challenges in predicting high energy emission from low mass stars. Conclusions are given in Section 5.
2 Model
We construct 1D chromosphere models of TRAPPIST-1 using the atmosphere code PHOENIX (Hauschildt, 1993; Hauschildt & Baron, 2006; Baron & Hauschildt, 2007). This self-consistent multi-level non-LTE code is equipped with current atomic level data (Dere et al., 1997; Kurucz, 2014; Del Zanna et al., 2015; Kurucz, 2017) suitable for the high temperatures and low densities found in M dwarf upper atmospheres and has been used in previous chromospheric investigations to model lines in the optical region of M dwarf spectra (Hauschildt et al., 1996; Andretta et al., 1997; Short & Doyle, 1998; Fuhrmeister et al., 2005, 2006).
Our PHOENIX models are computed in hydrostatic equilibrium on a log(column mass) grid (Figure 1, Table 1). We begin with a photosphere-only model (gray, dash-dot line) in radiative-convective equilibrium that corresponds to the effective temperature, surface gravity, and mass of the star (Table 2). The chemistry in the photosphere includes ions, molecules, and condensates, and is calculated directly using standard Gibbs free energy minimization. In this region, collisions dominate and LTE is an appropriate approximation for the atomic and molecular level populations.
Increasing temperature distributions that simulate a chromosphere and transition region are superimposed to the underlying photosphere model, similar to the construction used in Andretta et al. (1997), Short & Doyle (1998), and Fuhrmeister et al. (2005). The chromosphere and transition region are characterized by high temperatures and low densities such that the collisional rates are low and radiative transfer is dominated by non-LTE effects. In addition to including the LTE opacity from hundreds of millions of atomic and molecular transitions, PHOENIX is also capable of self-consistently modeling departures from LTE for many atoms and ions (Hauschildt, 1993; Hauschildt & Baron, 2006; Baron & Hauschildt, 2007).
For our models, we compute most light elements up to Ni in full non-LTE radiative transfer using species and background opacities provided by the PHOENIX and CHIANTI V8 (Del Zanna et al., 2015) databases. These non-LTE calculations take into account 11,931 levels and 356,058 lines for 62 specifically considered ionization stages of the most abundant elements in the Sun: H I; stages I – II of He, Ne, P; stages I – III of Na, Mg, Al, S, Cl, Ca, Cr, Mn, Ni; stages I – IV of C, N, O, Si; and stages I – VI of Fe.
The low density of the plasma in the upper atmosphere allows most emitted photons to escape with no further scattering such that pressure broadening is negligible in this region. This is not the case for strong resonance lines that form over extensive depths in a stellar atmosphere. In these lines, wings form in deeper atmospheric layers in LTE and are naturally broadened. The wings are controlled by the outward decrease of the source function, while the cores form in the upper atmosphere in non-LTE and only weakly depend on temperature and are instead more closely tied to the mean intensity (Figure 2). This can result in optically thick lines in emission with self-reversed cores (e.g. Ly, Mg II h&k, Ca II H and K, H) (Wood et al., 2005; Fontenla et al., 2016; Short & Doyle, 1998; Doyle et al., 1994).
We employ a linear temperature rise with log(column mass) in our chromosphere and transition region that corresponds to a non-linear structure in pressure. This temperature-pressure profile is similar to the solar-inspired structure used by Fontenla et al. (2016), characterized by a steep lower-chromosphere followed by a temperature “plateau” in the upper-chromosphere. If high resolution spectra are available, non-linear profiles can be tailored to fit individual lines, however, investigations have found that linear log(column mass) structures give better overall continuum fits (Fuhrmeister et al., 2005; Andretta et al., 1997; Eriksson et al., 1983). Especially in the case of TRAPPIST-1, where the only UV spectral observation is the Ly line (Bourrier et al., 2017a, b), it is advantageous to utilize a linear temperature-log(column mass) structure in the chromosphere and transition region to predict the full UV spectrum.
We set the temperature at the top of the chromosphere to be between 8000 – 8500 K since above these temperatures, hydrogen is fully ionized and is no longer an efficient cooling agent (Ayres, 1979). This thermally unstable transition region extends steeply upwards until stability is reattained near the corona. In our models, we set the hottest layer to be 105 K, which corresponds to the top of the transition region.
Increasing the temperature in the outer layers through the addition of a chromosphere and transition region leads to large flux increases at shorter wavelengths. The chemistry switches from being dominated by molecules such as H2 and CO, to atoms and ions in the lower chromosphere near 2000 K. The UV spectrum is characterized by strong emission lines of ionized species and bound-free edges from continuous opacity sources, particularly, the Lyman continuum and Si I continuum. PHOENIX has been updated to include bound-free molecular opacities for H2, CO, CH, NH, and OH, which are particularly important in shaping the NUV continuum in M stars (Fontenla et al., 2015, and references within).
We adjust our model temperature structures through altering the location (mTmin) and thickness of the chromosphere (mTR) and transition region (TTR). Higher UV emission is generated by attaching the chromosphere deeper in the atmosphere and decreasing the temperature gradient in the transition region. The integrated flux density across the FUV band (1340 – 1811 Å) is very sensitive to changes in all three parameters, while the NUV (1687 – 3008 Å) is most sensitive to the depth at which the chromospheric temperature rise begins. Specifically, the entire UV pseudo-continuum111Pseudo-continuum is defined as the theoretical real continuum as affected by numerous molecular absorption features. increases uniformly as the upper atmosphere is statically shifted towards higher column mass, while the FUV flux density changes by 2 – 4 times that of the NUV when altering TTR or mTR alone. Increasing mTmin leads to more overall UV flux, with flux densities increasing 2 – 3 times more in the NUV band than in the FUV band.
3 Model Comparisons
In the absence of broadband UV spectral or photometric observations of TRAPPIST-1, we use two methods to constrain the UV spectrum. First, we construct a model (1A) with the primary intent to replicate the reconstructed TRAPPIST-1 Ly observation from Bourrier et al. (2017a). For our second method, we use photometry from the Galaxy Evolution Explorer (GALEX) of the only three field-age M8 stars that have known distances and scale them to 12.1 pc (Table 2). We create a pair of models (2A&B) to represent the range of NUV detections and the more rigorous FUV photometric upper limits, since all three stars are physically consistent with a log(FFUV) -17.5.
We also considered calibrating the models to the range of GALEX FUV and NUV fluxes for a larger sample of field-age M stars (type M1 –M4) from the HAZMAT program (Shkolnik & Barman, 2014). However, in an extension of that work to lower-mass M stars (HAZMAT III), Schneider & Shkolnik (2018) found that old ( 5 Gyr) late-type M stars retain higher levels of UV flux compared to early M stars, indicating that the sample from Shkolnik & Barman (2014) would not accurately represent UV emission from TRAPPIST-1. We instead examined the FUV and NUV flux densities for a large number of field-age late-M stars (0.08 – 0.35 M☉) in HAZMAT III in order to refer to a more applicable sample of representative stars. The median values from these 56 FUV and 62 NUV detections from low-mass M3.5 – M9 stars (Table 2) falls within the range of flux densities of the three M8 stars, so we proceeded with calibrating the models to the original sample.
Our PHOENIX spectra are presented in Figure 3; we compare the model that matches the Ly observations (1A) to those that are calibrated to the GALEX NUV detections from the three M8 stars (2A&B). The corresponding model temperature structures are shown in Figure 1 with parameters listed in Table 1. A photosphere model computed with the Teff, M*⋆*, and log(g) of TRAPPIST-1 is plotted as the dash-dot curve in Figure 1 and as the gray curve in Figure 3. We validate the stellar parameters used in this base photosphere model by comparing it to a near-infrared spectrum of TRAPPIST-1 (Gillon et al., 2016). This photosphere-only model spectrum is dominated by molecular absorption features and vastly under-predicts the UV spectrum due to a lack of a prescription for the upper atmosphere.
At ultraviolet wavelengths, the optical depth reaches unity in the chromosphere where the source function deviates from the Planck function and non-LTE effects become important. Allowing for departures from LTE influences the emergent UV spectrum through increased flux levels in the Lyman continuum due to pumping effects of strong lines (Fuhrmeister et al., 2006), but most notably through the decrease in the emergent flux of Ly (top panel, Figure 4) and ionized chromospheric iron lines. Individual line profiles are impacted by the non-LTE treatment in both line strengths and the potential for self-reversal. These lines are typically narrower than LTE lines since they form higher in the atmosphere and are therefore not subject to pressure broadening. When treating our list of 62 species in non-LTE, the FUV flux density relative to a model computed fully in LTE decreases by a factor of 3, and the NUV flux density, which is dominated by contributions from iron lines, decreases by a factor of 50.
3.1 Comparison to TRAPPIST-1 Ly Observation
Our first method for constraining the UV spectrum for the model uses the only UV observations of TRAPPIST-1: reconstructed Ly spectra from Bourrier et al. (2017a, b). The HST observations were taken with the G140M grating on STIS in four separate visits throughout 2016. The average of the raw spectra taken during Visits 1 – 3 is plotted as the black histogram in the top panel of Figure 4. The Ly wings did not vary significantly in the observations during these first visits, but differences in Visit 4 led to increased flux in the reconstructed wings, suggesting the shape of the line evolved throughout the four month observation period. Bourrier et al. (2017b) hypothesize that this variation could be caused by a trailing hydrogen exosphere from a transiting planet or could have stellar origins relating to the flow of hydrogen gas within the stellar atmosphere. Observations of Ly for stars other than the Sun are contaminated by interstellar hydrogen and deuterium absorption near the line core and therefore only provide the intrinsic wing profiles. To correct for the geocoronal and ISM absorption, reconstructions must be performed on the observed line profiles (e.g., Wood et al., 2005; France et al., 2013; Youngblood et al., 2016). Single-component Gaussian reconstructions from Bourrier et al. (2017a, b) of Visits 1-3 and Visit 4 are shown in the top panel of Figure 4.
Since hydrogen is the dominant atomic species in stellar atmospheres, line formation occurs at various depths and at lower densities than most other resonance lines. Non-LTE effects impacting both the size and shape of the Ly line are seen in the bottom panel of Figure 4. At this wavelength scale, when treated in LTE, Ly appears as a narrow line in full emission (green), vastly overpredicting the line center and underpredicting the wings of the reconstruction (red). When non-LTE calculations are considered (gray, blue), the line profile broadens and presents a self-reversed core. Emission lines with self-reversals occur when wings form deeper in the atmosphere, where the source function is increasing with temperature and the atmosphere is relatively close to thermal equilibrium, while the core is forming in the upper atmosphere, where departures from LTE are large and emerging photons are no longer coupled to the local temperature (Figure 2).
When considering the model atmosphere calculations, in addition to non-LTE, partial frequency redistribution (PRD) becomes necessary for the accurate computation of radiative losses in strong resonance lines such as Ly. Complete frequency redistribution (CRD) accounts for overlapping radiative transitions, and is appropriate for computing most spectral lines. The addition of the PRD formalism becomes important in strong lines where coherent scattering is a major excitation mechanism (e.g., Ly, Mg II, and Ca II). As part of this work, PHOENIX is now equipped with PRD capabilities, implementing the methods detailed in Uitenbroek (2001) and Hubeny & Lites (1995). Coherent scattering of photons largely affects the shape of the wings in the line profiles of strong resonance lines, as seen in the bottom panel of Figure 4 where Ly treated in CRD is plotted in gray versus in PRD in blue.
Although self-reversal in the Ly emission line is seen in observations of both the quiet and active Sun (Fontenla et al., 1988; Tian et al., 2009), some reconstruction techniques (including those plotted in Figure 4) assume that the line is fully in emission and neglects the potential for a self-reversed core. To aid in the reconstruction of the Ly line, it is possible to utilize observations of chromospheric Mg II h and k (2794.5, 2802.3 Å) emission lines. Similar to Ly, this NUV doublet is optically thick and the observations have to be corrected for interstellar contamination. While Mg II h and k form at slightly lower temperatures than Ly, they have similar line profiles in the observed solar spectrum (Donnelly et al., 1994; Lemaire et al., 1998). Wood et al. (2005) reconstructs intrinsic Ly emission lines for 33 cool stars by fitting the ISM absorption. They use Mg II h and k lines to estimate the shape of the central portion of the Ly profile, and the majority of the best fits to observed spectra for F – K stars show a central reversal in both Ly and Mg II h and k, while those for M stars do not. Uncertainties in measurements, target variability, and stellar rotation period contribute to an overall uncertainty in FLyα of 30% using this technique. Unlike the M stars in Wood et al. (2005), high resolution HST observations of the M-dwarf GJ 832 show reversed cores in the Mg II doublet, and along with the Ly line, are modeled with a central reversal in the Fontenla et al. (2016) GJ 832 M-dwarf upper atmosphere model. Obtaining similar resolution Mg II h and k observations of TRAPPIST-1 would provide important information to help better estimate the central portion of the intrinsic Ly profile.
Another way to improve reconstructions of Ly profiles and conclusively determine if M star Ly cores contain inversions is through observations high radial velocity stars. Kapteyn’s Star presents an ideal case where the M1 star has a high radial velocity ( +245 km s*-1*) such that the Ly line is Doppler shifted 0.99 Å away from the geocoronal emission feature. Guinan et al. (2016) observed the Ly emission region (1214.5 – 1217.5 Å) with HST, and their “stellar only” emission profile contains a very slight self-reversal. Conversely, Youngblood et al. (2016) fit this same observation with no self-reversal. Due to the ambiguity in these analyses, it would be beneficial to increase the number of high resolution Ly observations of high radial velocity M stars.
The Ly line from Model 1A is plotted in blue in Figure 4 (top and bottom panels). The line profile matches the wings of the reconstruction for Visits 1 – 3 well and displays a prominent self-reversal with the depth of the inverted core dropping to continuum flux levels, resulting from non-LTE effects. The depth of the central reversal is very sensitive to the thermal structure in the transition region in addition to other input physics. As seen in the top panel of Figure 5, Models 1A and 2B both have deep inverted cores and both have temperature gradients in the transition region of K g*-1* cm*-2*, while Model 2A has a much shallower reversal and a TTR of K g*-1* cm*-2*. We suspect additional uncertainties in the line center may come from the lack of a corona in our model, which would photoionize the lower layers, affecting the collisional rates where the core is forming. The model-predicted Ly integrated line flux is 38% less than the reconstructed profile from Visits 1 – 3 and 2.4 times less than that from Visit 4 (Table 4).
Computing synthetic GALEX photometry for Model 1A yields an FUV flux density consistent with the M8 field stars and the inner quartiles of the HAZMAT III sample. The NUV flux density is slightly above these ranges, but within the total spread of the full HAZMAT III sample for old low mass M stars (Table 2).
3.2 Comparison to M8 Field Star UV Photometry
In a second analysis, we construct models that match the NUV flux densities of the M8 field stars in Table 2 and that are consistent with the more rigorous FUV upper limits. Model 2A is tailored to the lower log(FNUV) = -17.1 erg s*-1* cm*-2* Å2 and has slightly more FUV emission than Model 2B, which has the higher log(FNUV) = -16.9 erg s*-1* cm*-2* Å2 and an FUV flux density equal to the strictest upper limit. The resulting EUV flux densities span an order of magnitude, strongly tied to the factor of ten difference in their transition region temperature gradients.
The EUV continuum and many strong emission lines at EUV and FUV wavelengths form in the transition region at temperatures between log(T) 4.3 – 4.78 K (Sim & Jordan, 2005). Examples include He I (584 Å), C III (977 Å), H I Ly (1025.7 Å), C II (1036.3, 1037 Å), and Si IV (1393.7, 1402.7 Å). A decrease in TTR results in higher EUV continuum flux as well as more emergent line flux (e.g. O V at 629.7, 760.2, 760.4, and 762.0 Å). Full resolution EUV spectra of the models are shown in Figure 5.
The synthetic FUV photometry is calculated over the GALEX FUV filter profile wavelength range and does not include Ly. The majority of the flux comes from a few strong emission lines, most notably: Al II, Si II, and Fe II. The pseudo-continuum in the covered FUV wavelength range is shaped by bound-free opacities of Si, Mg, and Fe, while the NUV is shaped more by molecular opacity sources. In the NUV spectrum, most flux comes from the Mg II h and k doublet, Al lines, and a forest of ionized Fe lines. Lines strengths for select lines that have formation temperatures in the chromosphere and transition are given in Table 5.
4 Discussion
The EUV fluxes from our upper atmosphere models range from (1.32 – 17.4) 10*-14* ergs s*-1* cm*-2* (Table 4). Models 1A and 2B fall within the range of previous FEUV predictions derived from X-ray and Ly observations. Model 2A, which replicates the lower limit of the M8 field star NUV flux densities and has the lowest FLyα, yields an EUV flux 10 times higher than previous upper estimates.
The EUV continuum is dominated by bound-free edges from both H I at 912 Å and He I at 504 Å and contains many emission lines of highly ionized species. We caution that our EUV spectra are to be taken as upper limits for wavelengths 300 Å. Many of the strong EUV emission lines form in the transition region, where radiative rates dominate and non-LTE effects are important. Our current models do not calculate every line in non-LTE, and as a result, the brightest lines in the model EUV spectrum: Fe VII at 246 Å, Ne IV at 401.9 Å, O V at 629.7 Å, and O VI at 1031.1 and 1037.6 Å are narrow, but very strong LTE lines. Since there are no EUV observations of M8 stars to directly measure against, we estimate that compared to the Bourrier et al. (2017a) predicted spectrum, in our most active model (2A), the EUV spectrum for wavelengths 300 Å could be overestimating the actual EUV flux by a factor of 20.
For wavelengths 300 Å, the model spectra should be taken as lower limits. Our models do not include a corona, and therefore under-predict X-ray and some EUV continuum flux. Additionally, some highly ionized EUV emission lines that form in the corona, including Fe X & XI, Mg IX, and Ne XIII & X are calculated in LTE. Comparing the model spectra below 300 Å to the predicted EUV flux from Wheatley et al. (2017), we estimate that our lowest activity model, Model 2B, could be under-predicting the flux in these wavelengths by up to a factor of 103.
4.1 FEUV/FLyα
We compare our model EUV spectra to estimated EUV flux densities calculated in 100 Å wavelength bands using the Linsky et al. (2014) FEUV/FLyα empirical scaling relationship in Figure 5. The EUV spectrum using the Ly reconstructed flux of Visits 1 – 3 from Bourrier et al. (2017a) is plotted in black. The scaling relationship is derived from solar observations and is used for predicting FEUV for earlier type stars than TRAPPIST-1 (F5 -– M5), but generally agrees well with our model spectra, especially Models 1A and 2B. The largest discrepancies occur 300 Å where the model spectra yield 102 – 105 times less flux than the scaling relationship. Between 300 – 900 Å, the models yield on average 1 – 20 times more flux than the scaling relationship, mostly stemming from continuum flux in the H I bound-free edge (800 – 900 Å) and the overestimated LTE lines.
We calculate the line flux from our model Ly over the same wavelength range as Bourrier et al. (2017a) and compute the 100 Å EUV wavelength band fluxes (plotted as dashed lines in corresponding colors in Figure 5). While our Model 1A Ly matches the wings of the Bourrier et al. (2017a) reconstruction, the deep inverted cores in Models 1A and 2B and the more narrow line profiles of Model 2A result in line fluxes that are 75 – 85% less than the Visits 1 – 3 reconstruction. Calculating the broadband EUV spectrum with our model FLyα yields EUV fluxes that are a factor of 1.6 – 35 lower than when using the reconstructed Ly observation. Comparing the model EUV average flux density bins (solid colored lines) to their FEUV/FLyα predicted bins, the discrepancies increase at wavelengths 400 Å, especially for Model 2A, where the scaling relationship predicts 102 – 105 times less flux than the spectrum. This large difference in Model 2A is likely due to the narrow line shape and small line flux in Ly.
4.2 Challenges
It is difficult to constrain precise models with a single data point. For example, Models 1A and 2A have identical FUV flux densities, but both their NUV and EUV fluxes differ by approximately one order of magnitude. Model 1A, which is constrained by a single emission line, is potentially overpredicting the NUV, although these observations are of different stars and it is unknown if they occurred when the stars were in a similar activity state. Correct estimates of stellar EUV flux are important for studying the photochemistry and stability of exoplanet atmospheres, but there are several challenges in attempting to derive these values:
Stellar Activity: M stars are prone to flare in the ultraviolet (Monsignori Fossi et al., 1996; Hawley et al., 2003), with the largest flares elevating the continuum emission by up to 200 quiescent levels (Loyd et al., 2018). Late-type M stars remain UV active for much longer than their early-M counterparts, typically with more variability in the FUV than the NUV (Miles & Shkolnik, 2017). This results in increased stellar variability even for field-age stars and can be seen in the evolving line profile in Visits 1 – 3 versus Visit 4 of the TRAPPIST-1 Ly observations. With the increased potential for UV activity in late-type M stars of all ages, in order to create a realistic panchromatic stellar spectrum, it is crucial that the observations be taken while the star is in the same activity state. UV observations are critically important for constraining stellar upper atmosphere models, and long-duration UV monitoring, like that to be done with the NASA-funded Star-Planet Activity Research CubeSat (SPARCS), is important for advancing our understanding of M star upper atmospheres in providing much needed variability and flaring data (Shkolnik et al., 2018; Ardila et al., 2018).
Extensions of empirical scaling relationships to late-type M stars: Both the FEUV/FX and FEUV/FLyα scaling relationships are based on solar observations and while they have been used to predict EUV fluxes for early to mid-M stars, they have not been validated in applications to late-M stars. Comparing the estimates to our models, we find that in some cases the empirical scaling relationships yield EUV fluxes consistent with the model spectra, however, our model with the lowest Ly flux yielded and EUV flux 10 times higher than predicted by the scaling relationships.
Lack of corona in our model: The models presented in this paper do not include a prescription for a corona. The 106 K coronal layers are a major source of X-ray fluxes as well as some EUV flux. While the majority of EUV radiation originates in the transition region, the models lack the flux contribution from highly ionized lines that form at coronal temperatures. Additionally, the hot corona irradiates downwards onto underlying layers in the stellar atmosphere and can alter the radiative rates. We anticipate that the addition of a corona to the model will increase the EUV flux mainly through changes in the continuum below 300 Å. In a future paper, Peacock et al. (in prep), the impact of the corona is explored in detail.
5 Conclusions
Using two separate datasets, TRAPPIST-1 Ly reconstructions and GALEX UV photometry from old M8 field stars, we obtain model spectra with EUV fluxes that are closely aligned with previous estimates. The model EUV fluxes range from (1.32 – 17.4) 10*-14* ergs s*-1* cm*-2*, as compared to the (0.7 – 5.8) 10*-14* ergs s*-1* cm*-2* derived from X-ray and Ly empirical scaling relationships. The model EUV spectra and line centers in the Ly profiles demonstrate sensitivity to the temperature structure in the transition region and are likely to increase with the addition of a corona to the model.
Analyses based on the previous estimates find the XUV flux to be high enough to erode both oceans and atmospheres on the TRAPPIST-1 habitable zone planets over several billion years. Applying the observed X-ray fluxes summed with our model EUV fluxes to an energy limited escape model would yield the same or greater mass loss rates, further suggesting these planets likely do not have much liquid water on their surfaces.
We would like to thank B. Fuhrmeister, I. Short and J. Aufdenberg for useful discussions. We also thank A. Schneider for providing GALEX photometry fluxes and D. Bardalez Gagliuffi for providing the TRAPPIST-1 SpeX spectrum. We gratefully acknowledge the helpful comments from the anonymous referee. This work was supported by NASA Headquarters under the NASA Earth and Space Science Fellowship Program - Grant NNX15AQ94H. An allocation of computer time from the UA Research Computing High Performance Computing (HPC) at the University of Arizona is gratefully acknowledged. Resources supporting this work were also provided by the NASA High-End Computing (HEC) Program through the NASA Advanced Supercomputing (NAS) Division at Ames Research Center. This work was supported in part by DFG GrK 1351. A portion of the calculations presented here were performed at the Höchstleistungs Rechenzentrum Nord (HLRN), and at the National Energy Research Supercomputer Center (NERSC), which is supported by the Office of Science of the U.S. Department of Energy under Contract No. DE-AC03-76SF00098. We thank all these institutions for a generous allocation of computer time. E.B. acknowledges support from NASA Grant NNX17AG24G. E.S. appreciates support from the NASA Habitable Worlds grant NNX16AB62G.
The reference list from the paper itself. Each links out to its DOI / PubMed record.
- 1Andretta et al. (1997) Andretta, V., Doyle, J. G., & Byrne, P. B. 1997, A&A, 322, 266
- 2Ardila et al. (2018) Ardila, D. R., Shkolnik, E., Scowen, P., et al. 2018, ar Xiv:1808.09954
- 3Ayres (1979) Ayres, T. R. 1979, Ap J, 228, 509
- 4Baron & Hauschildt (2007) Baron, E., & Hauschildt, P. H. 2007, A&A, 468, 255
- 5Barstow & Holberg (2007) Barstow, M. A., & Holberg, J. B. 2007, Extreme Ultraviolet Astronomy, by Martin A. Barstow , Jay B. Holberg, Cambridge, UK: Cambridge University Press, 2007,
- 6Bolmont et al. (2017) Bolmont, E., Selsis, F., Owen, J. E., et al. 2017, MNRAS, 464, 3728
- 7Berger et al. (2010) Berger, E., Basri, G., Fleming, T. A., et al. 2010, Ap J, 709, 332
- 8Bourrier et al. (2017 a) Bourrier, V., Ehrenreich, D., Wheatley, P. J., et al. 2017, A&A, 599, L 3