Inferring the size of the causal universe: features and fusion of causal attribution networks
Daniel Berenberg, James P. Bagrow

TL;DR
This paper introduces NetFUSES, a method to combine multiple causal attribution networks with ambiguous nodes, estimating that current surveys cover less than 6% of the total human causal attribution universe.
Contribution
The paper presents NetFUSES, a novel approach for merging causal networks with ambiguous nodes and estimates the total size of human causal attribution networks.
Findings
Existing surveys cover about 5.77% of causes and effects.
Estimated total causal attribution network contains approximately 293,000 causes and effects.
Current surveys capture less than 1% of all cause-effect relationships.
Abstract
Cause-and-effect reasoning, the attribution of effects to causes, is one of the most powerful and unique skills humans possess. Multiple surveys are mapping out causal attributions as networks, but it is unclear how well these efforts can be combined. Further, the total size of the collective causal attribution network held by humans is currently unknown, making it challenging to assess the progress of these surveys. Here we study three causal attribution networks to determine how well they can be combined into a single network. Combining these networks requires dealing with ambiguous nodes, as nodes represent written descriptions of causes and effects and different descriptions may exist for the same concept. We introduce NetFUSES, a method for combining networks with ambiguous nodes. Crucially, treating the different causal attributions networks as independent samples allows us to use…
Click any figure to enlarge with its caption.
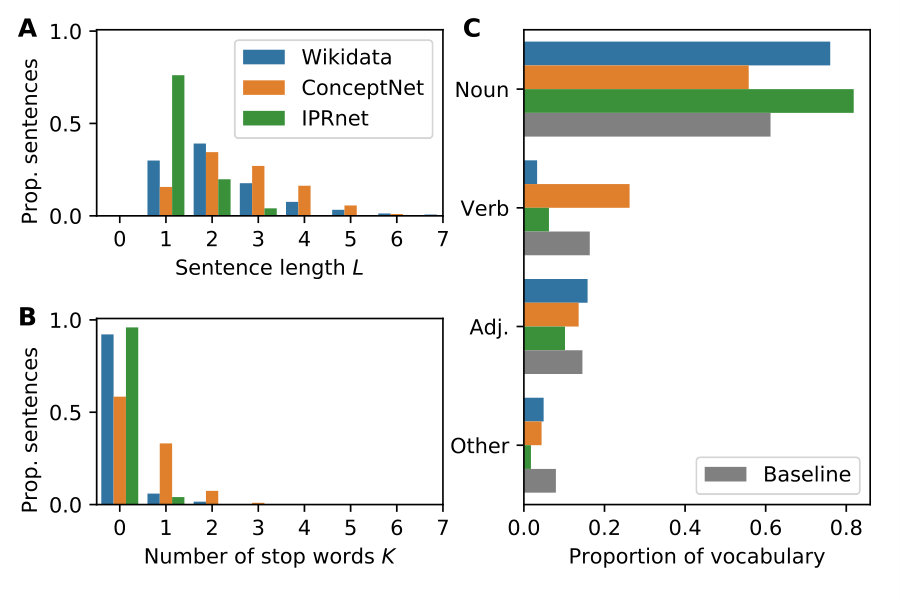 Figure 1
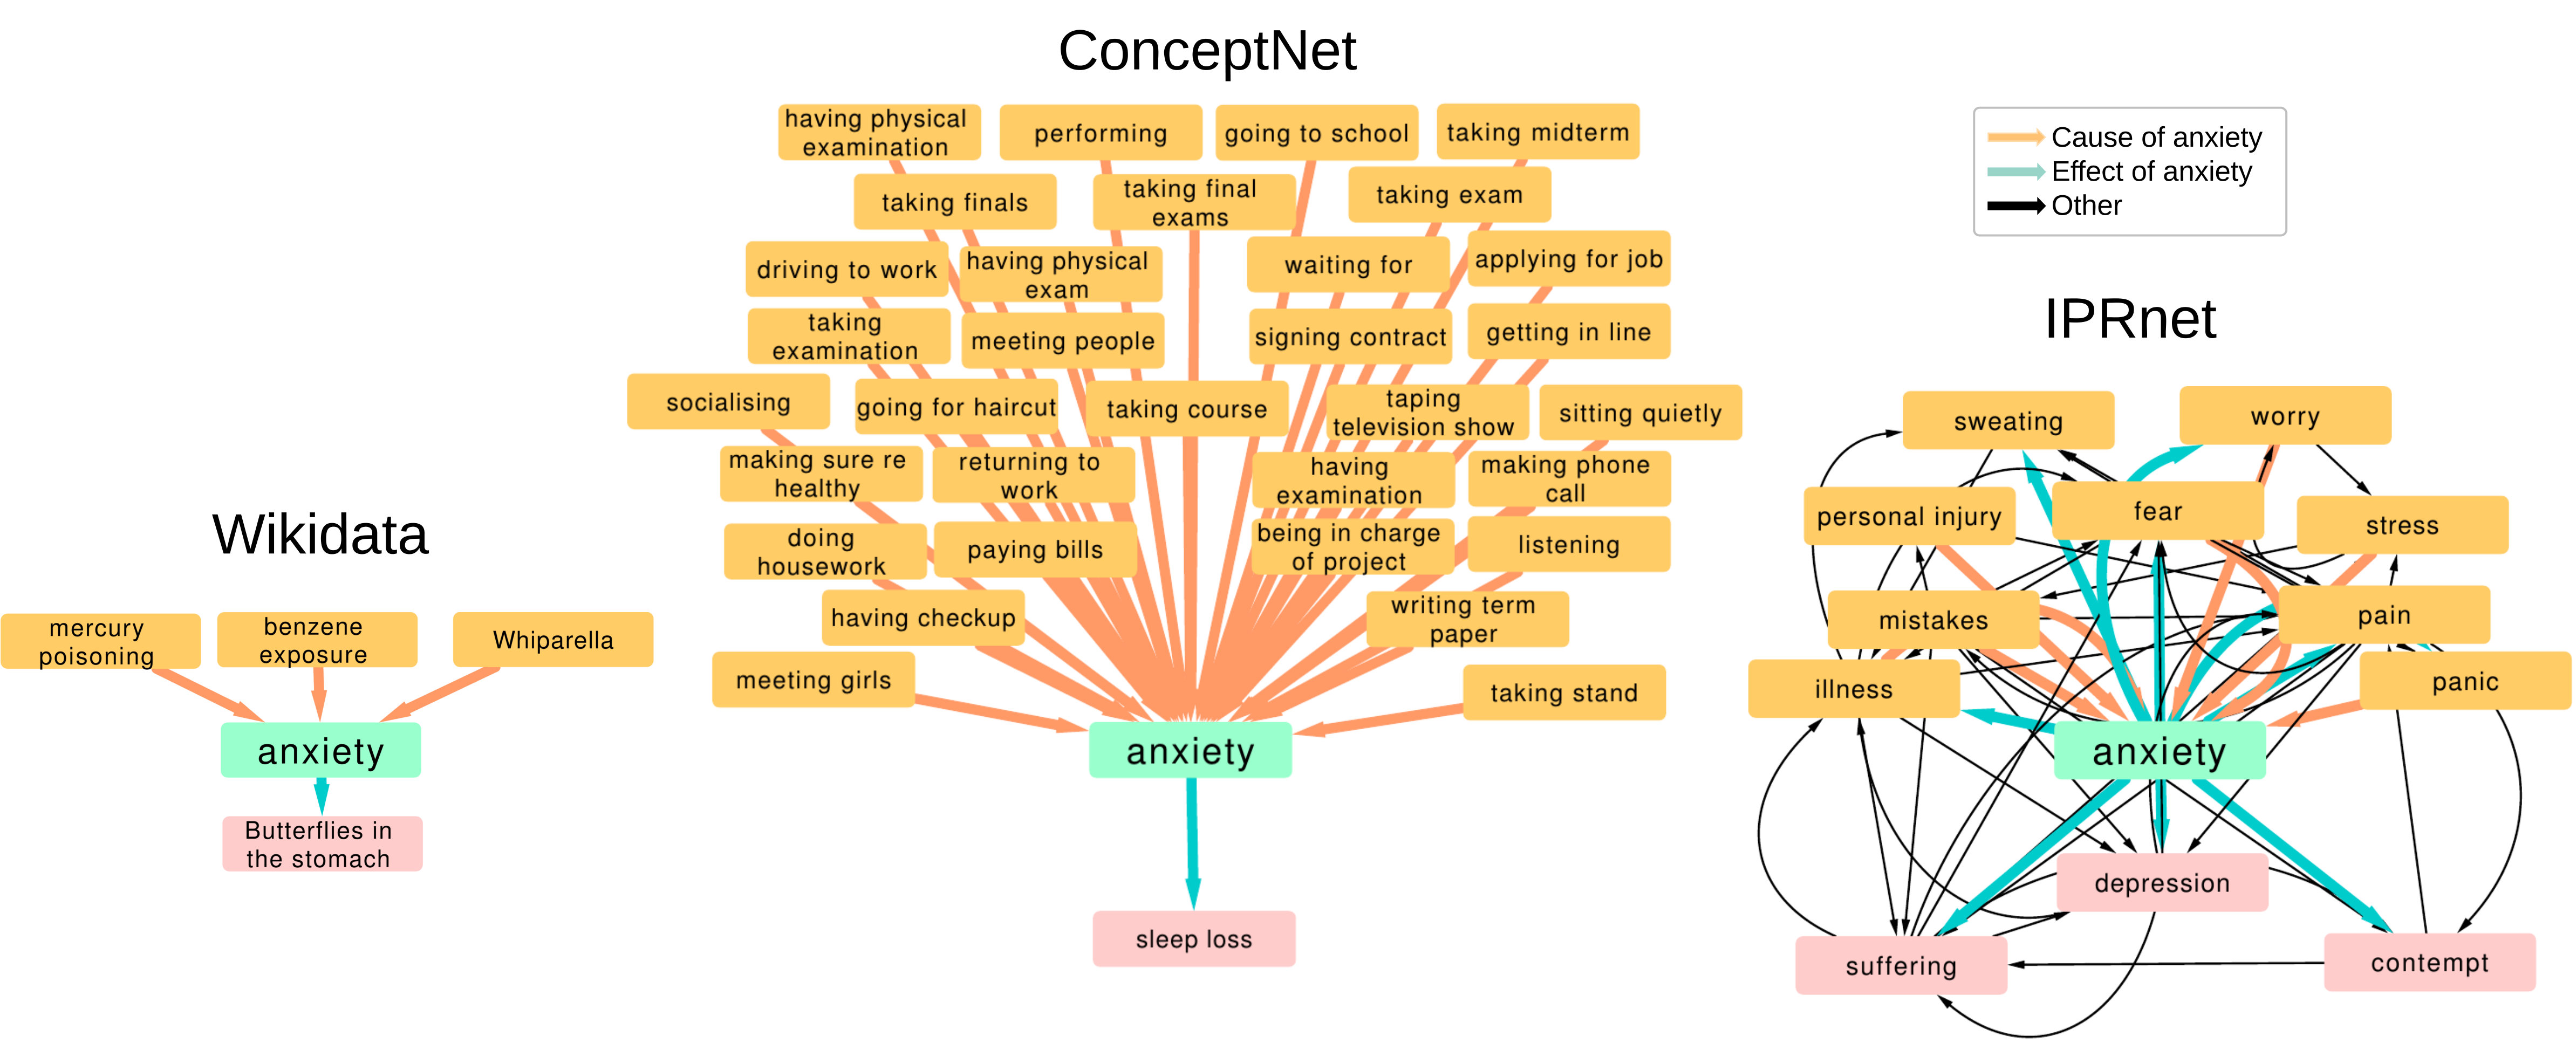 Figure 2
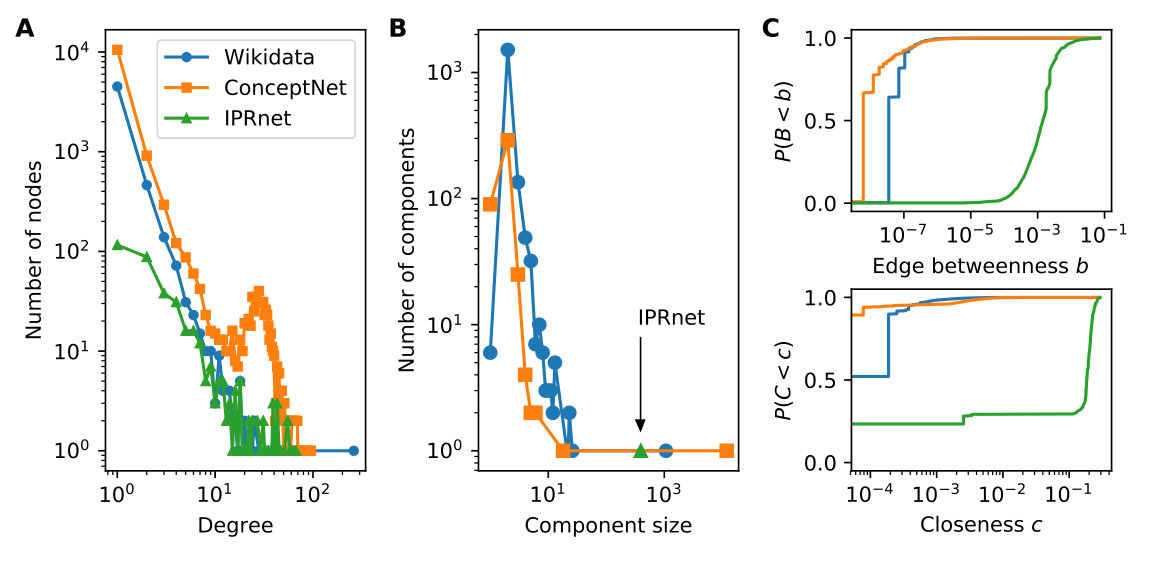 Figure 3
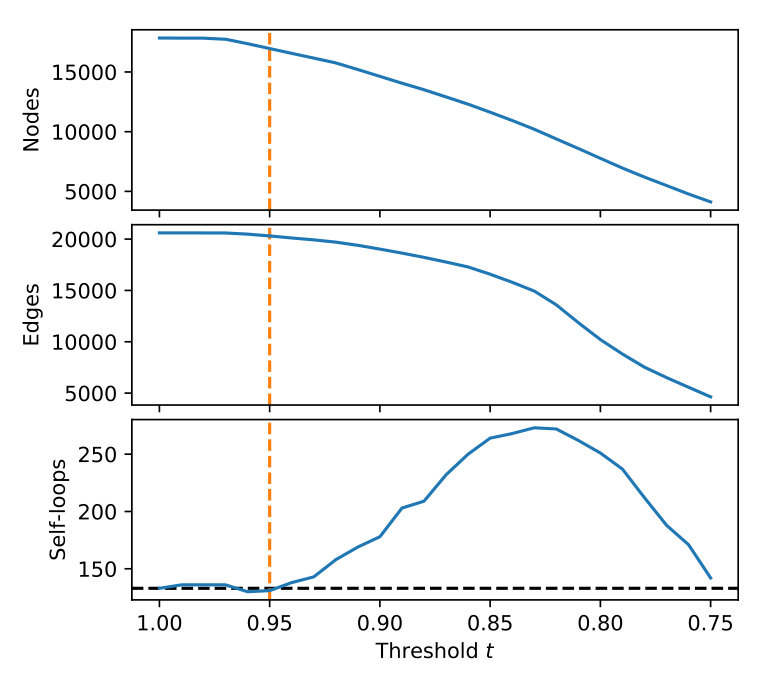 Figure 4
| Wikidata | ConceptNet | IPRnet | |
| Nodes | 5 316 | 12 741 | 394 |
| Edges | 3 818 | 16 796 | 1 329 |
| Causes | 2 558 | 1 497 | 302 |
| Effects | 3 022 | 11 687 | 361 |
| Self-loops | 7 | 126 | 1 |
| Reciprocated edges | 7 | 7 | 214 |
| Feedback loops | 0 | 1 | 986 |
| Feedforward loops | 0 | 87 | 3541 |
| Average degree | 1.436 | 2.637 | 6.746 |
| Clustering (u) | 0.004194 | 0.00568 | 0.3804 |
| Assortativity | -0.06101 | -0.0569 | -0.1627 |
| Longest shortest path (d) | 7 | 8 | 15 |
| Longest shortest path (u) | 25 | 12 | 11 |
| Connected components (w) | 1 780 | 415 | 1 |
| Connected components (s) | 5 309 | 12 732 | 153 |
| Giant component size (w) | 1 069 | 11 940 | 394 |
| Giant component size (s) | 3 | 3 | 242 |
Peer Reviews
No public reviews on file for this paper yet. If you reviewed it on a platform where reviews are public (OpenReview, ICLR, NeurIPS, ICML), you can paste yours below so the community can read it here.
Videos
No videos yet. Explain this paper in a talk, walkthrough, or lecture? Add one.
Taxonomy
TopicsCognitive Science and Mapping · Cognitive Science and Education Research
Inferring the size of the causal universe: features and fusion of causal attribution networks
Daniel Berenberg
Department of Computer Science, University of Vermont, Burlington, VT, United States
Vermont Complex Systems Center, University of Vermont, Burlington, VT, United States
James P. Bagrow
Department of Mathematics & Statistics, University of Vermont, Burlington, VT, United States
Vermont Complex Systems Center, University of Vermont, Burlington, VT, United States
Corresponding author. Email: [email protected], Homepage: bagrow.com
(December 14, 2018)
Abstract
Cause-and-effect reasoning, the attribution of effects to causes, is one of the most powerful and unique skills humans possess. Multiple surveys are mapping out causal attributions as networks, but it is unclear how well these efforts can be combined. Further, the total size of the collective causal attribution network held by humans is currently unknown, making it challenging to assess the progress of these surveys. Here we study three causal attribution networks to determine how well they can be combined into a single network. Combining these networks requires dealing with ambiguous nodes, as nodes represent written descriptions of causes and effects and different descriptions may exist for the same concept. We introduce NetFUSES, a method for combining networks with ambiguous nodes. Crucially, treating the different causal attributions networks as independent samples allows us to use their overlap to estimate the total size of the collective causal attribution network. We find that existing surveys capture 5.77% 0.781% of the 293 000 causes and effects estimated to exist, and of the 10 200 000 attributed cause-effect relationships.
Keywords— causality; knowledge graphs; graph alignment; natural language processing; word embeddings; capture-recapture estimators
Causality and causal reasoning are central questions of statistics, computer science, philosophy, and the cognitive sciences [1, 2, 3, 4]. Recently, our understanding of causality has been revolutionized by new insights and large volumes of data [5, 6]. Large-scale data collection and surveys of large numbers of individuals are now possible at an unprecedented scale. One class of new data enabled by the internet is very large-scale knowledge graphs, annotated semantic networks codifying large numbers of factual statements, events, and interrelationships between concepts [7, 8, 9]. Knowledge graphs allow generalization to new relationships using graph algorithms, and these algorithms have been applied to causal predictions [10].
In this work we study causal relationships encoded into networks. Nodes in these networks represent causes and effects, and directed links indicate cause-effect relationships. Generally, these relationships are gathered by large-scale surveying of individuals, often as part of larger efforts to build general-purpose semantic networks [11, 12], although dedicated experiments have also been conducted [13]. As these relationships are contributed by individuals or groups of individuals, we refer to these networks as causal attribution networks. Attribution theory, the study of how individuals perceive causality and attribute causes to effects, has long explored the cognitive biases that affect causal attribution [14, 15, 16].
We study causal attribution networks extracted from three sources, the collaboratively constructed knowledge graph “Wikidata”, the long-running project “ConceptNet,” and “IPRnet,” a network built by members of a crowdsourcing platform to test a network data collection method called “Iterative Pathway Refinement” [13]. Figure 1 shows examples from all three networks, centered on “anxiety” a term common to all three. Wikidata and ConceptNet encode other relationships, but we focus on causal relationships. All three networks represent different efforts to explore the larger causal attribution network, and our goal is to understand similarities and difference between these networks, and whether or not they can be fruitfully combined into a single, larger network. A key challenge when combining these data is resolving ambiguity between entities or concepts: most causes and effects in these networks are originally identified only by short written descriptions, and it is possible to describe the same entity in many different ways. Yet, overcoming this challenge to fuse multiple causal attribution networks together brings multiple benefits: it provides a common network dataset for researchers to study causality and attribution, and by measuring the overlap of different network samples we can estimate the size of the single underlying, incompletely observed causal attribution network.
The rest of this paper is organized as follows. Section 1 describes the data collection and network and text analysis procedures, introduces a method called NetFUSES for fusing graphs with potentially ambiguous node identities, and discusses capture-recapture estimators for inferring the size of partially observed populations. Section 2 compares the three causal networks using both network and text statistics (Sec. 2.1), then investigates how well these networks may be combined (Sec. 2.2). Section 2.3 leverages these results to estimate the size of the underlying causal attribution network using capture-recapture methods. Finally, we discuss our results in Sec. 3.
1 Data and Methods
1.1 Causal attribution datasets
In this work we compare causal attribution networks derived from three datasets. A causal attribution dataset is a collection of text pairs that reflect cause-effect relationships proposed by humans (for example, “virus causes sickness”). These written statements identify the nodes of the network (see also our graph fusion algorithm for dealing with semantically equivalent statements) while cause-effect relationships form the directed edges (“virus” “sickness”) of the causal attribution network.
We collected causal attribution networks from three sources of data: English Wikidata [12], English ConceptNet [11], and IPRnet [13]. Wikidata and ConceptNet, are large knowledge graphs that contain semantic links denoting many types of interactions, one of which is causal attribution, while IPRnet comes from an Amazon Mechanical Turk study in which crowd workers were prompted to provide causal relationships. Wikidata relations were gathered by running four search queries on the Wikidata API (query.wikidata.org). These queries searched for relations with the properties: ”has immediate cause”, ”has effect”, ”has cause”, or ”immediate cause of”. The first and third searches reverse the order of the cause and effect which we reversed back. We discarded any Wikidata relations where the cause or effect were blank, as well as one ambiguous relation where the cause was ”NaN”. ConceptNet attributions were gathered by searching the English ConceptNet version 5.6.0 assertions for “/r/Causes/” relations. Lastly, IPRnet was developed in [13] which we use directly.
The three networks together contain causal links and unique terms, of which there are and unique causes and effects, respectively.
1.2 Text processing and analysis
Analyzing causal sentences
Each node in our causal attribution networks consists of an English sentence, a short written description of an associated cause and/or effect. Text analysis of these sentences was performed using CoreNLP v3.9.2 and NLTK v3.2.2 [17, 18]. We computed Part-of-Speech (POS) tags and identified (but did not remove) stop words for these sentences. We used the standard Brown corpus as a text baseline for comparison. Text processing procedures such as lemmatization or removal of casing were not performed in order to retain information for subsequent operations. A small number of ConceptNet sentences contained ‘/n’ and ‘/v’ codes within the text denoting parts-of-speech tags; we removed these before applying our own POS tagger. POS tagging of the causal sentences and the baseline dataset was performed using CoreNLP by tokenizing each input using the Penn Treebank tokenizer then applying the Stanford POS tagger. This tagger uses Penn Treebank tags. We aggregated these 36 tags into NLTK’s universal tagset which consists of a simpler set of 12 tags including NOUN, VERB, ADJ, and more. To simplify presentation, we chose to further collect all non-verb, non-noun, and non-adjective tags into an “Other” tag. Stop words were identified using NLTK’s English stop words corpus.
Vector representations for words and sentences
Word vectors, or embeddings, are modern computational linguistics tools that project words into a learned vector space where context-based semantics of text are preserved, enabling computational understanding of text via mathematical operations on the corresponding vectors [19]. Many different procedures exist for learning these vector spaces from text corpora [19, 20, 21, 22]. Document embeddings, or “sentence vectors,” extend word vectors, representing more complex multi-word expressions in a vector space of their own [23]. Given two nodes and with corresponding sentences and and sentence vector representations and , respectively, the vector cosine similarity is a useful metric for estimating the semantic association between the nodes. High vector similarity implies that textual pairs are approximately semantically equivalent and sentence vectors can better compare nodes at a semantic level than more basic approaches such as measuring shared words or n-grams.
We computed sentence vectors using TensorFlow [24] v1.8.0 using the Universal Sentence Encoder v2, a recently developed embedding model that maps English text into a 512-dimensional vector space and achieves competitive performance at a number of natural language tasks [25]. This model was pretrained on a variety of text corpora [25]. The Universal Sentence Encoder was tested on several baseline NLP tasks including sentiment classification and semantic textual similarity, for each of which it performs with the highest accuracy. Given the higher performance of the Universal Sentence Encoder with respect to textual similarity tasks, we elected to utilize it instead of other sentence encoding models including the character level CNN architecture used in Google’s billion word baseline [26], and weighted averaging of word vector representations [27].
1.3 Graph fusion
Graph fusion takes two graphs and and computes a fused graph by identifying and combining semantically equivalent nodes (according to some measure of similarity) within and between and . Graph fusion is closely related to graph alignment and (inexact) graph matching [28], although fusion assumes the need to identify node equivalents both within and between the networks being fused, unlike alignment and matching which generally focus on uncovering relations between and . Graph fusion is particularly important when a canonical representation for nodes, such as an ID number, is lacking, and thus equivalent nodes may appear and need to be combined. This is exactly the case in this work, where each node is a written description of a concept, and the same concept can be equivalently described in many different ways.
Here we describe Network FUsion with SEmantic Similarity (NetFUSES). This algorithm computes the fused graph given a node similarity function . This should encode the semantic closeness between nodes and , with for semantically equivalent and and for semantically non-equivalent and . We assume and .
To fuse and into , first compute . One can interpret as (the edges of) a fusion indicator graph defined over the combined node sets of and . Each connected component in then corresponds to a subset of that should be combined into a single node in . (One can also take a stricter view and combine nodes corresponding to completely dense connected components of instead of any connected components, but this strictness can also be incorporated by making more strict.) Let indicate the connected component of containing node . Abusing notation, one can also consider as representing the node in that the unfused node maps onto. Lastly, we define the edges of the fused graph based on the neighborhoods of nodes in . The neighborhood of each node in the fused graph is the union of the neighborhoods of the nodes connected to in : for any node , let and Then the neighborhood defines the edges incident on in the fused graph and may now be computed. Notice by this procedure that if an edge already exists in and/or between two nodes and that share a connected component in , then a self-loop is created in when and are combined. For our purposes these self-loops are meaningful, but otherwise they can be discarded.
**Semantic similarity ** In this work, each node is represented only by a short written sentence , and two sentences may in fact be different descriptions of the same underlying concept. Hence the need for NetFUSES. To relate two sentences and semantically, we rely upon recent advances in natural language processing that can embed words and multiword expressions into a semantically-meaningful vector space (see Sec. 1.2). Let be the “sentence vector” corresponding to . Then define if and zero otherwise, for some parameter . In other words, we consider nodes and to be semantically equivalent when the cosine similarity between their vectors exceeds a given threshold . Our procedure in the main text determined as an approach threshold.
1.4 Capture-recapture
Capture-recapture (also known as mark-and-recapture and recapture sampling) methods are statistical techniques for estimating the size of an unobserved population by examining the intersection of two or more independent samples of that population [29, 30]. For example, biologists wishing to understand how many individuals of a species exist in an environment may capture individuals, tag and release them, then later gather another sample by capturing individuals. The more individuals in the second sample that carry tags, the more likely it is that the overall population is small; conversely, if the overlap in the samples is small, then it is likely that is large. Capture-recapture is commonly used by biologists and ecologists for exactly this purpose, but it has been applied to many other problems as well, including estimating the number of software faults in a large codebase [29] and estimating the number of relevant academic articles covering a specific topic of interest [31].
The simplest estimator for the unknown population size is the Lincoln-Petersen estimator. Assuming the samples generated are unbiased, meaning that each member of the population is equally likely to be captured, then the proportion of captured individuals in the second sample who were tagged should be approximately equal to the overall capture probability for the first sample, . Solving for gives the intuitive Lincoln-Petersen estimator , for . While a good starting point, this estimator is known to be biased for small samples [30], and much work has been performed to determine improved estimators, such as the well-known Chapman estimator [32].
In this work we use the recently developed Webster-Kemp estimator [31]:
[TABLE]
which assumes (i) that one tried to capture as many items as possible (as opposed to predetermining and and capturing until reaching those numbers) and (ii) the total number of items found . Webster and Kemp also derive the variance of this estimator:
[TABLE]
with , allowing us to assess our estimate uncertainty. Equations (1) and (2) are approximations when assuming a flat prior on but are exact when assuming an almost-flat prior on that slightly favors larger populations over smaller [31].
2 Results
Here we use network and text analysis tools to compare causal attribution networks (Sec. 2.1). Crucially, nodes in these networks are defined only by their written descriptions, and multiple written descriptions can represent the same conceptual entity. Thus, to understand how causal attribution networks can be combined, we introduce and analyze a method for fusing networks (Sec. 2.2) that builds off both the network structure and associated text information and explicitly incorporates conceptual equivalencies. Lastly, in Sec. 2.3 we use the degree of overlap in these networks as a means to infer the total size of the one underlying causal attribution network being explored by these data collection efforts, allowing us to better understand the size of collective space of cause-effect relationships held by humans.
2.1 Comparing causal networks
We perform a descriptive analysis of the three datasets, comparing and contrasting their features and properties. We focus on two aspects, the network structure and the text information (the written descriptions associated with each node in the network). Understanding these data at these levels can inform efforts to combine different causal attribution networks (Sec. 2.2).
Network Characteristics
The reference list from the paper itself. Each links out to its DOI / PubMed record.
- 1[1] J. Pearl, Causality: Models, Reasoning, and Inference . Cambridge university press, 2009.
- 2[2] M. Bunge, “Causality–the place of the causal principle in modern science,” 1960.
- 3[3] D. Hume, A Treatise of Human Nature . Oxford University Press, 1738.
- 4[4] I. Kant, Critique of pure reason . Cambridge university press, 1999.
- 5[5] J. Pearl et al. , “Causal inference in statistics: An overview,” Statistics surveys , vol. 3, pp. 96–146, 2009.
- 6[6] R. M. Shiffrin, “Drawing causal inference from big data,” Proceedings of the National Academy of Sciences , 2016.
- 7[7] T. Berners-Lee, J. Hendler, and O. Lassila, “The semantic web,” Scientific american , vol. 284, no. 5, pp. 34–43, 2001.
- 8[8] F. M. Suchanek, G. Kasneci, and G. Weikum, “Yago: a core of semantic knowledge,” in Proceedings of the 16th international conference on World Wide Web , pp. 697–706, ACM, 2007.