Search for the rare decay $B^{+} \rightarrow {\mu}^{+}{\mu}^{-}{\mu}^{+}{\nu}_{{\mu}}$
LHCb collaboration: R. Aaij, C. Abell\'an Beteta, B. Adeva, M., Adinolfi, C.A. Aidala, Z. Ajaltouni, S. Akar, P. Albicocco, J. Albrecht, F., Alessio, M. Alexander, A. Alfonso Albero, G. Alkhazov, P. Alvarez Cartelle,, A.A. Alves Jr, S. Amato, S. Amerio, Y. Amhis, L. An

TL;DR
This paper reports a search for a rare B+ meson decay involving three muons and a neutrino, using LHCb data, resulting in setting an upper limit on its branching fraction due to no significant signal detection.
Contribution
First search for the $B^{+} ightarrow \mu^{+}\mu^{-}\mu^{+} u_{\mu}$ decay using LHCb data, establishing an upper limit on its branching fraction.
Findings
No significant excess observed over background.
Upper limit on branching fraction set at $1.6 imes 10^{-8}$.
Analysis in the specified kinematic region.
Abstract
A search for the rare leptonic decay is performed using proton-proton collision data corresponding to an integrated luminosity of fb collected by the LHCb experiment. The search is carried out in the region where the lowest of the two mass combinations is below MeV/c. The data are consistent with the background-only hypothesis and an upper limit of at 95% confidence level is set on the branching fraction in the stated kinematic region.
Click any figure to enlarge with its caption.
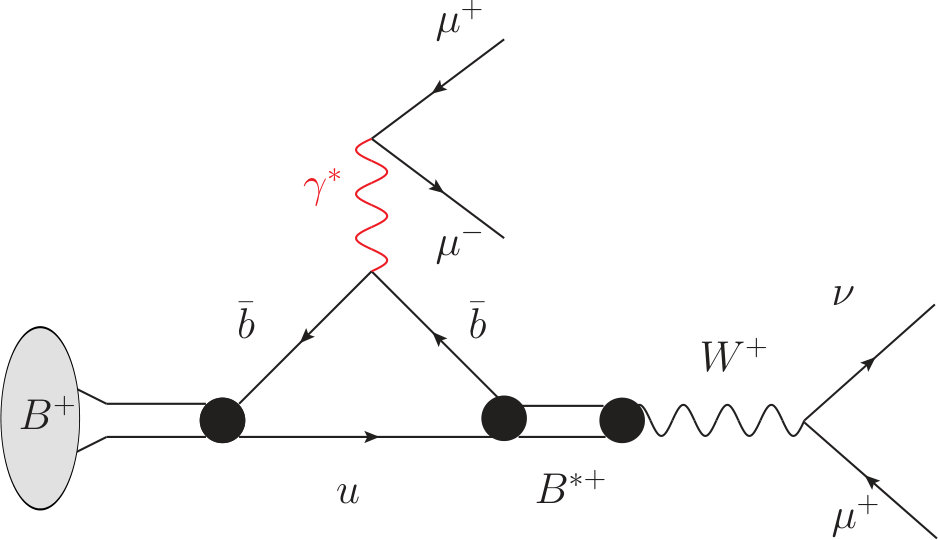 Figure 1
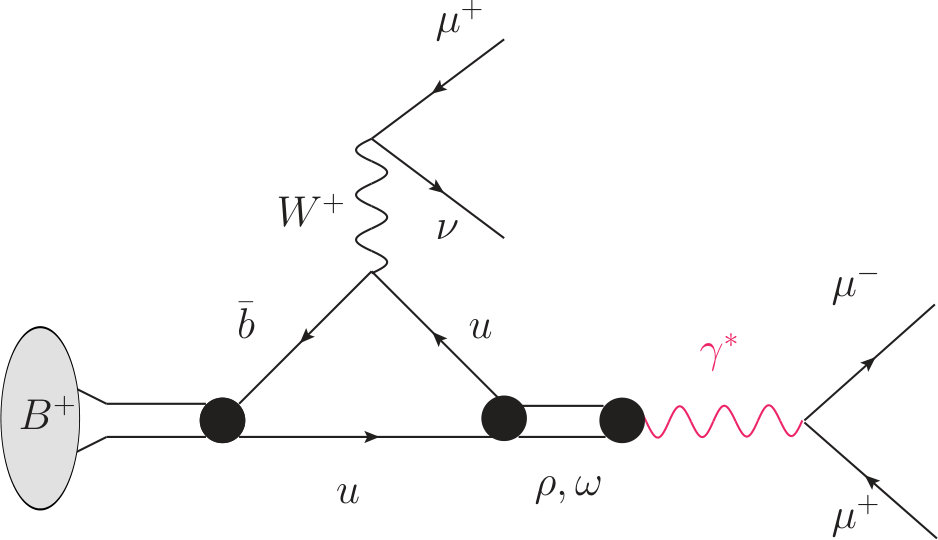 Figure 1
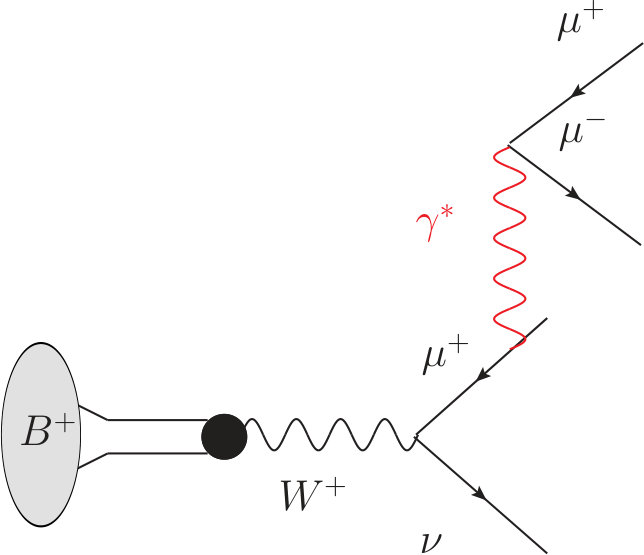 Figure 1
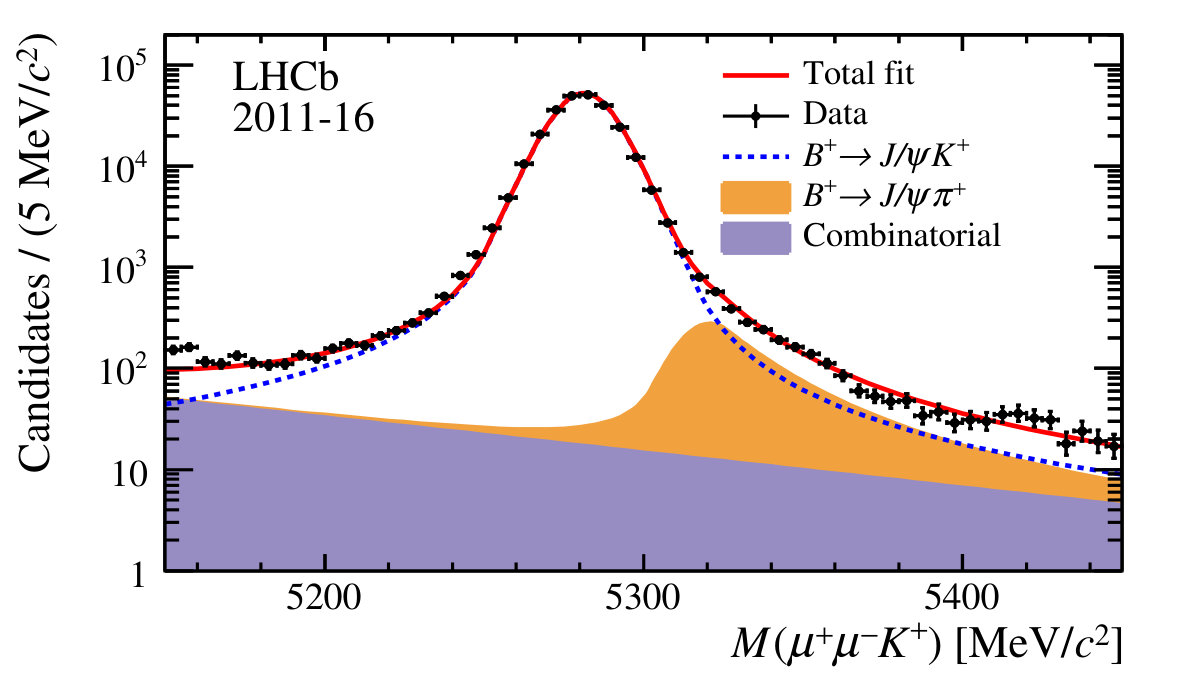 Figure 2
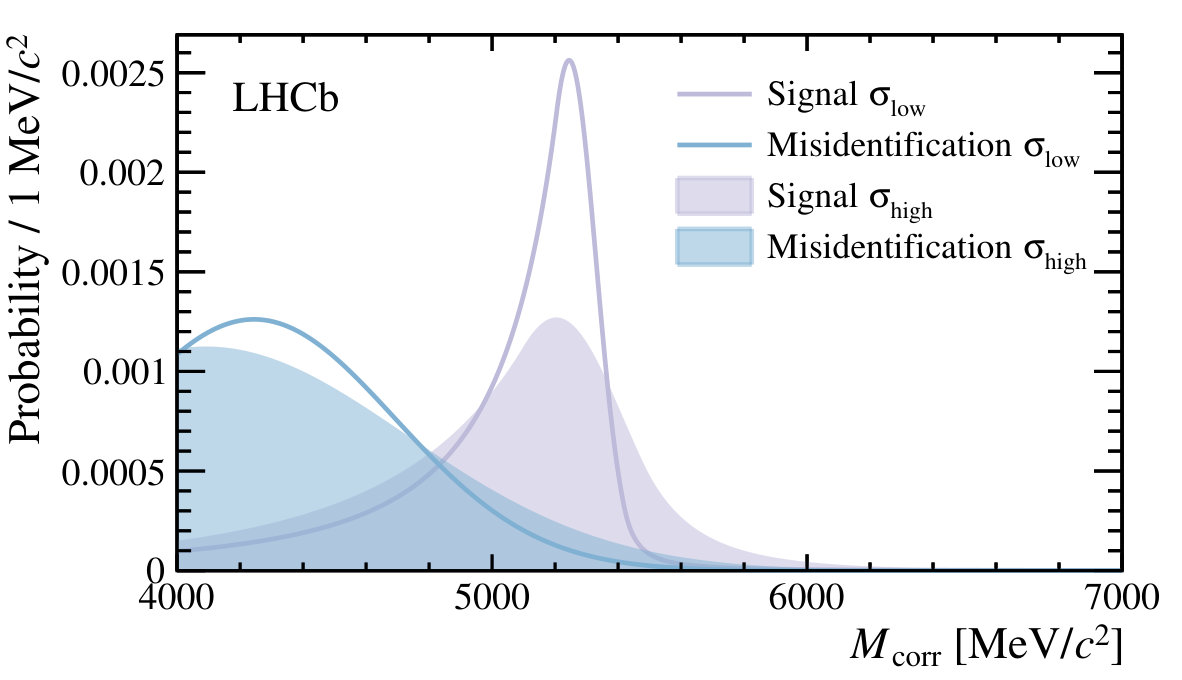 Figure 3
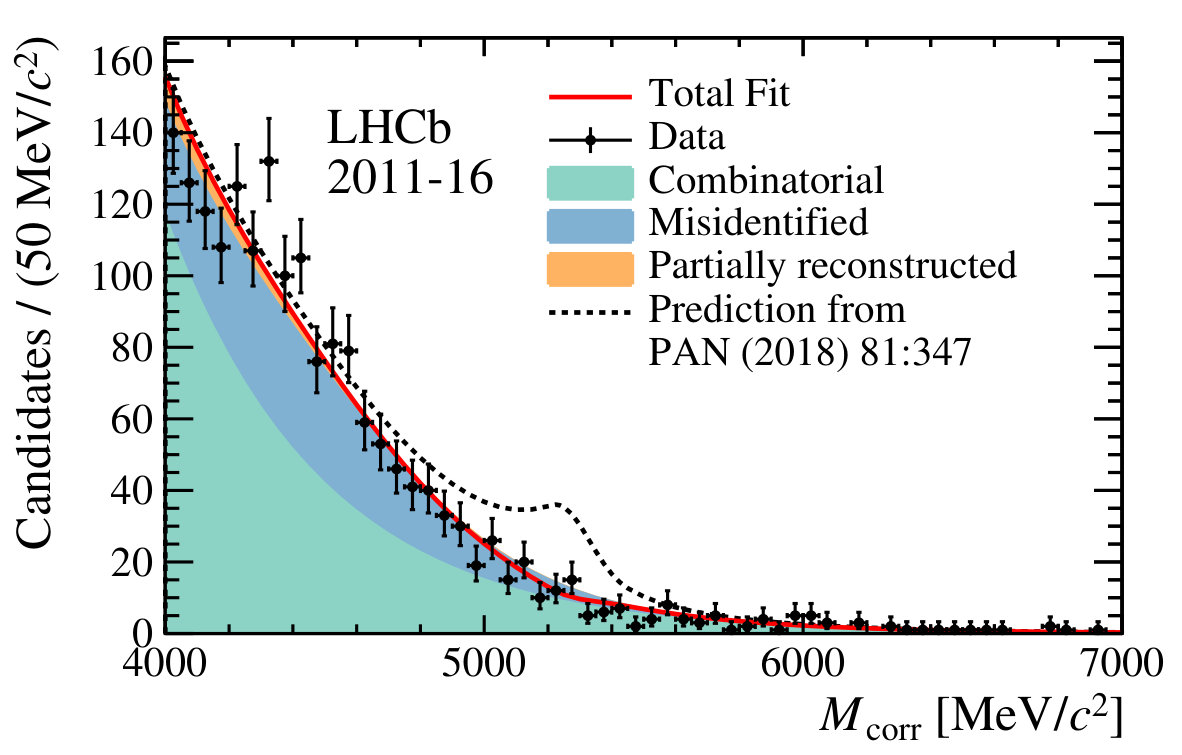 Figure 4
| Source | Relative normalisation uncertainty [%] |
|---|---|
| Combinatorial background shape | 14.2 |
| Choice of signal decay model | 04.6 |
| Trigger efficiency data/simulation | 03.5 |
| Normalisation mode branching fraction | 03.0 |
| Kaon interaction probability | 02.0 |
| Production kinematics | 01.5 |
| Fit bias | 01.0 |
| Simulation sample size | 00.8 |
| Total | 15.9 |
Peer Reviews
No public reviews on file for this paper yet. If you reviewed it on a platform where reviews are public (OpenReview, ICLR, NeurIPS, ICML), you can paste yours below so the community can read it here.
Videos
No videos yet. Explain this paper in a talk, walkthrough, or lecture? Add one.
EUROPEAN ORGANIZATION FOR NUCLEAR RESEARCH (CERN)
CERN-EP-2018-293
LHCb-PAPER-2018-037
August 20, 2019
Search for the rare decay
LHCb collaboration†††Authors are listed at the end of this paper.
A search for the rare leptonic decay is performed using proton-proton collision data corresponding to an integrated luminosity of fb*-1* collected by the LHCb experiment. The search is carried out in the region where the lowest of the two mass combinations is below 980$${\mathrm{\,Me\kern-1.00006ptV\!/}c^{2}}. The data are consistent with the background-only hypothesis and an upper limit of at 95% confidence level is set on the branching fraction in the stated kinematic region.
Published in Eur. Phys. J. C 79 (2019) 675
© 2024 CERN for the benefit of the LHCb collaboration. CC-BY-4.0 licence.
1 Introduction
Leptonic decays of the meson are rare, as branching fractions are proportional to the squared magnitude of the small Cabibbo-Kobayashi-Maskawa (CKM) matrix element . Among these processes, the decays and have precise Standard Model (SM) predictions [1] given the absence of hadrons in the final state.111The inclusion of charge-conjugate processes is implied throughout this paper. Due to helicity suppression, they are also highly sensitive to particles predicted in extensions of the SM such as charged scalars [2]. Measurements of the decay from the factories [3, 4, 5, 6] lead to an average branching fraction of [7] consistent with the SM prediction within the experimental uncertainty. An upper limit of [8] is set on the branching fraction at 90% confidence level.
The radiative version of the muonic decay, , is important for two reasons; it is a background for the decay, and its branching fraction is a direct measurement of the inverse moment of the meson light cone distribution amplitude, which is very difficult to calculate theoretically [9]. The upper limit on the branching fraction for the decay is [10] at 90% confidence level.
A decay vertex with just a single charged particle makes a search for the and decays highly challenging in the LHC environment. This problem is not present for the decay , depicted in Fig. 1. The decay receives a contribution from the with amplitude, where the annihilation to the pair occurs through an intermediate meson. It also receives contributions from the amplitude, where denotes a vector meson such as the or the , that can decay to a pair of muons. With these contributions, nearly all decays have a muon pair with a mass below 1. The only theoretical calculation available is based on vector-meson dominance and predicts that the corresponding branching fraction, , is around [11].
This paper describes a search for the decay using a partial reconstruction method that infers the momentum of the missing neutrino to obtain a mass estimate of decays. This search uses proton-proton () collision data corresponding to an integrated luminosity of collected during the three periods 2011 (7 collision energy), 2012 (8) and 2016 (13) at the LHCb experiment. The detector is described in Sec. 2, followed by a description of how the signal is separated from backgrounds using two multivariate classifiers in Sec. 3. The evaluation of the background is covered in Sec. 4, the normalisation of the branching fraction of the signal to the decay with in Sec. 5, the limit on the branching fraction in Sec. 6 and the systematic uncertainties in Sec. 7. Finally, conclusions are presented in Sec. 8.
2 Detector and simulation
The LHCb detector [12, 13] is a single-arm forward spectrometer covering the pseudorapidity range , designed for the study of particles containing or quarks. The detector includes a high-precision tracking system consisting of a silicon-strip vertex detector surrounding the interaction region [14], a large-area silicon-strip detector located upstream of a dipole magnet with a bending power of about , and three stations of silicon-strip detectors and straw drift tubes placed downstream of the magnet. The tracking system provides a measurement of the momentum, , of charged particles with a relative uncertainty that varies from 0.5% at low momentum to 1.0% at 200. The minimum distance of a track to a primary vertex (PV), the impact parameter (IP), is measured with a resolution of (15+29/\mbox{p_{\mathrm{T}}}){\,\upmu\mathrm{m}}, where is the component of the momentum transverse to the beam, in . The secondary vertex (SV) resolution for three-body decays is around 20 in the plane transverse to the beam axis and 200 along the beam axis.
Different types of charged hadrons are distinguished using information from two ring-imaging Cherenkov detectors [15]. Photons, electrons and hadrons are identified by a calorimeter system consisting of scintillating-pad and preshower detectors, an electromagnetic and a hadronic calorimeter. Muons are identified by a system composed of alternating layers of iron and multiwire proportional chambers [16].
The online event selection is performed by a multistage trigger[17]. For the analysis described here, the events are first required to pass a hardware trigger, selecting events containing at least one muon with high . In the subsequent software trigger at least one muon candidate is required to have high and a large impact parameter with respect to any PV. The dominant path through the last level of the trigger is a selection that requires a SV consisting of two muons with a high combined mass.
Simulated events are used to optimise the signal selection, estimate background contamination as well as calculate the relative efficiency between the signal and a normalisation channel. In the simulation, collisions are generated using Pythia [18, *Sjostrand:2007gs] with a specific LHCb configuration [20]. Decays of hadronic particles are described by EvtGen [21], in which final-state radiation is generated using Photos [22]. The interaction of the generated particles with the detector, and its response, are implemented using the Geant4 toolkit [23, *Agostinelli:2002hh] as described in Ref. [25].
Three different models are used in the simulation for the decay. The nominal model, with which efficiency for signal selection () is calculated, has a photon pole for one of the muon pairs and a uniform mass distribution for the combination of the third muon and the neutrino. For systematic checks, a flat phase space model is used. As a third model, the recently proposed vector-meson dominance model for the decay is used [11].
3 Selection
Signal decay candidates are reconstructed by combining one negatively and two positively charged tracks. These tracks are required to be of good quality, be inconsistent with originating from any PV, be positively identified as muons and form a good-quality SV displaced from any PV. The PV with the smallest is the associated PV, where is defined as the difference in the vertex-fit of a given PV reconstructed with and without the trajectory included. The momentum vector of the decay products is required to point in the same direction as the line connecting the associated PV and the SV with an allowance made for the momentum that is carried away by the neutrino in the decay.
At most one hit in the muon stations is allowed to be shared between two different muon candidates. This reduces the rate of hadrons misidentified as muons when there is already a muon of the same sign in the detector. In this analysis that has two muons of the same sign in the final state it is essential to reduce this type of misidentification. The search for the signal is performed in the region where the lower of the two mass combinations is below 980$${\mathrm{\,Me\kern-1.00006ptV\!/}c^{2}} to avoid potential background from decays. Moreover, above this mass the combinatorial background grows and the expected signal yield is minimal, making a search there difficult. Backgrounds originating from candidates involving and decays are removed by vetoing the mass regions and of the higher of the two mass combinations. Finally, a tight particle identification (PID) selection, based on a neural network, is applied to reject misidentified hadrons.
The missing neutrino in the reconstruction of the candidate is accounted for with the addition of the momentum component perpendicular to meson flight direction, . This direction is determined from the position of the PV where the meson is produced and the SV where it decays. The resulting corrected mass is defined as,
[TABLE]
where is the mass of the three muons. Candidates are kept if they satisfy . Inside this a signal region is defined as . To avoid any bias in the development of the signal selection algorithm, the data in this region was not analysed until the selection was finalised and the systematic uncertainties evaluated. The uncertainty on the corrected mass is dominated by the resolution of the SV.
To reduce combinatorial background, where random tracks are combined to emulate the signal, a boosted decision tree classifier (BDT) [26] with the AdaBoost algorithm[27] as implemented in the TMVA toolkit [28, *TMVA4] is used. The BDT classifier is trained using simulation as a signal sample and the upper sideband of data as a proxy of the combinatorial background candidates. To best exploit the limited amount of data available for training, a ten-fold cross-validation method [30] is employed. The BDT contains information about kinematic and geometric properties of the candidate and associated muon tracks together with the total number of reconstructed tracks in the event. The most distinguishing properties between signal and combinatorial background candidates are the isolation of the decay vertex (as described in Ref. [31]), the of the vertex, and the with respect to the associated PV for all three muon candidates. The requirement on the BDT response is optimised by maximising the figure of merit [32] where is the signal efficiency of the selection and refers to the estimated number of background candidates in the signal region. The optimal BDT working point is efficient on simulated signal events while rejecting of the combinatorial background. For the optimisation, only relative changes in signal efficiency are relevant and these are obtained from the simulation.
A second BDT is trained to reject contamination from misidentified background. This background originates mostly from cascade decays where a hadron undergoes a semileptonic decay through the dominant to transition and the resulting hadron also decays semileptonically. The second BDT shares the same architecture, features and working-point optimisation strategy as the BDT designed to reject combinatorial background. It is trained on a background sample selected in data where two tracks are positively identified as muons and the third track is required to be in the fiducial region covered by the muon chambers but with a veto on muon identification. The signal sample is using the simulated sample after it has been accepted by the first BDT. The optimisation results in that of the signal sample is retained and of the misidentified background is rejected.
The overall selection results in 1797 candidates. There are no events with multiple candidates. The total efficiency for selecting the signal is about 0.1%.
4 Background estimation
The main categories of background are: combinatorial; misidentified combinations, where two muons are correctly identified but the third particle is a misidentified hadron; and partially reconstructed that have an almost identical final state to the signal.
As the combinatorial background arises from random combinations of three correctly identified muons, it has no peaking features in the considered region of corrected mass. Its contribution is estimated as part of the final fit to the data.
In order to estimate the number of misidentified background candidates and their distribution in the variable, a data sample is obtained with the same selection as for the signal, apart from a reversal of the muon identification requirements for one of the candidate tracks. This track is still required to be within the fiducial volume of the muon detector. This selects a sample of candidates in data, where denotes any hadron of either negative or positive charge. The sample is a mixture of partially reconstructed -hadron decays, where both the -hadron and the subsequent charm hadron decays semileptonically, and combinatorial background. Backgrounds where two hadrons are identified as muons are only contributing to the selected events at an insignificant level.
Probabilities of misidentifying hadrons as muons are obtained from data as a function of momentum and pseudorapidity by using control samples where the hadron species are determined purely from the kinematic properties of the decay chain [15]. As the misidentification probability is different for pions, kaons and protons [33], the species of the hadron must be determined. This is done by isolating the hadrons in the sample into separate hadron PID regions and then taking into account the cross-feed, calculated using an iterative approach, between these regions. The iterative approach splits the data sample into three PID regions, where the hadron candidate is consistent with the kaon, pion and proton hypotheses, respectively. Initially, the number of misidentified candidates of a given species is assumed to be zero, and the cross-feed between regions is calculated. From this first estimate of the number of misidentified particles in each of the PID regions, the cross-feed can then be recalculated. The process repeats until the number of total misidentified particles does not change significantly from one iteration to the next when compared to the statistical uncertainty from the sample size.
Once the cross-feed between the different hadron species has been taken into account, the probability for a specific hadron to pass the stringent muon PID requirements applied in the analysis is calculated. The presence of the two real muons in the background increases the probability to misidentify the hadron as a muon, mainly due to hit sharing in the muon stations. To take this into account, the hadron misidentification probability is obtained using the decay , with and , as a calibration sample. It has two muons present as in the signal, and the kaon and pion can be identified without PID requirements on the particle under consideration. In this way the probability of identifying the kaon or the pion from the decay as a muon can be measured. Double misidentification in the calibration sample, where the kaon and pion hypotheses are swapped, is reduced by requiring a loose hadron identification on the hadron not under consideration for misidentification and subsequently fitted for. The background coming from protons misidentified as muons is insignificant, requiring no further action.
The final distribution of the misidentified background in is obtained by multiplying the sample with the muon identification reversed with the relevant misidentification probabilities.
The level of partially reconstructed backgrounds, where three muons are correctly identified but one or more particles in addition to a neutrino are not reconstructed, is determined using simulation. An example of this type of decay is where and the , and particles are not reconstructed. For this particular background, the measurements of the branching fractions of [34] and [35] are used. In total, partially reconstructed backgrounds are estimated at the level of eleven candidates in the signal region of corrected mass.
Other potential backgrounds are considered. The decay with the kaon misidentified as a muon contributes in candidates with a corrected mass outside the signal region. This is not the case for the decay, but the low branching fraction combined with the requirement for misindentification of the pion results in a negligible background level. The decay , followed by the decay , is also considered and found to be at a negligible level after the selection criteria are applied. Finally, backgrounds that involve a charmonium state decaying to a pair of muons are excluded by the previously mentioned vetos on the and masses.
5 Normalisation method
The branching fraction of a signal is obtained by normalising to the decay as
[TABLE]
where is the yield of the decay, is the overall efficiency to reconstruct and select the decay. The braching fractions are taken from Ref. [35].
The candidates are selected in the same way as the signal, except that the third particle must be consistent with the kaon hypothesis and the dimuon mass consistent with the mass. This reduces the impact of systematic uncertainties related to the ratio of efficiencies in Eq. (2). Most of the signal and normalisation selection efficiencies are estimated using simulation. Efficiencies of the PID are obtained using control data samples where identities of the final-state particles can be deduced from the kinematics of the decay. The total efficiency of the signal is around relative to the normalisation channel. This lower efficiency is caused by the lower dimuon mass for the signal that affects the trigger, reconstruction and BDT efficiencies. The muon PID requirements are also less efficient due to the sharing of muon hits between the different final-state muons in the signal decay.
The yield is determined by performing an unbinned extended maximum-likelihood fit to the mass distribution. The shape of the mass distribution is described by a Hypatia function [36] that accounts for non-Gaussian tails on both sides of the peak. In the fit, the mean and width parameters are allowed to vary and all other parameters are determined from simulation. The shape of the misidentified background contribution of decays is modelled with a Gaussian core with power law tails on each side of the peak. The mean and width are allowed to vary freely in the fit while the tail parameters are determined from simulation. Combinatorial background is parameterised with an exponential function with a decay constant that is allowed to vary in the fit. The result of the fit is shown in Fig. 2 and yields decays.
6 Signal yield determination
In order to determine the signal yield, an extended unbinned maximum-likelihood fit is performed to the corrected mass distribution. To improve the sensitivity of the mass fit, an event-by-event uncertainty on the corrected mass is calculated by propagating the uncertainties of the PV and SV. The data is then split into two equally sized regions with high and low fractional corrected mass uncertainties. This improves the branching fraction sensitivity by approximately 11% due to the different signal distributions in the two samples, as shown in Fig. 3.
The signal shape is modelled with the sum of two Gaussian functions with power law tails, where the tails are on both sides of the peak. The parameters of the signal shape are determined using simulation and kept fixed in the subsequent fit to the data. The combinatorial background is modelled using an exponential function, whose slope is allowed to vary in the fit and whose parameterisation is verified using simulation. The yield is left free to float in the fit.
The background from misidentified muons is obtained from the control sample described in Sec. 4. The distribution and yield of this sample is fitted to a Gaussian function with a power-law tail at high corrected mass. This parameterisation is cross-checked by fitting a sample with a looser muon identification requirement. The uncertainties on the associated parameters are propagated to the fit using a multivariate Gaussian constraint. The shape and the yield of the partially reconstructed background are taken from simulation. Yields that are obtained from control samples and simulation are allowed to vary in the fit within constraints from a Poisson distribution.
The fit to the corrected-mass distribution, combining both corrected-mass uncertainty categories, is shown in Fig. 4. The signal yield is negative, , resulting in the total fit component being slightly below the sum of the background contributions. As there is no significant signal component, a limit on the branching fraction,
[TABLE]
at 95% confidence level is set using the method [37]. From pseudoexperiments, the expected upper limit is found to be and the present result represents a downward fluctuation of . Systematic uncertainties are included in this limit and are discussed in the following section.
7 Systematic uncertainties
A summary of the systematic uncertainties is given in Table 1, yielding a total relative uncertainty of on the normalisation of the branching fraction of the signal.
The largest systematic uncertainty arises due to the choice of the shape for the combinatorial background. If the combinatorial background is allowed to have two components with different exponential slope, the upper limit on the branching fraction changes by 14.2%. While the fit does not improve from adding in an extra component, its existence cannot be excluded from the fit to the data.
In simulation, the nominal signal model, as described in Sec. 2, creates a photon pole, increasing the branching fraction in the low dimuon mass region. The associated systematic uncertainty is estimated by replacing this decay with a model assuming a uniform phase-space distribution, but still with one of the muon pairs having a mass below 980. This results in a systematic uncertainty. Using the model from Ref. [11] results in a smaller variation.
Differences in simulation and data for the ratio of trigger efficiencies between the signal and normalisation channels gives rise to a systematic uncertainty as well. The effect is evaluated by comparing the difference between the trigger efficiency of decays in simulation and data, yielding a systematic uncertainty. This value represents a conservative estimate since it does not take into account an expected cancellation between signal and normalisation modes. The uncertainty in the branching fraction of the normalisation mode leads to a 3% uncertainty.
Another difference between the signal and the normalisation channels is that the kaon in the decay can undergo nuclear interactions in the detector with a probability proportional to the amount of material traversed and thus have a lower tracking efficiency. Following the procedure outlined in Ref. [38], the uncertainty on this amount of material leads to a 2% systematic uncertainty.
Inaccuracies in the modelling of the production kinematics lead to differences in efficiency between the signal and the normalisation channels. To account for this, correction weights to the meson momentum for the simulated samples are calculated using the measured distribution from decays. The difference of 1.5% in the relative efficiency between the signal and the normalisation channels, compared to the case where no weights are applied, is assigned as a systematic uncertainty.
Other smaller systematic uncertainties are assigned to account for a small fit bias due to the low amount of data available and the finite size of the simulation samples.
In the fit for the signal yield, all systematic uncertainties, apart from the variation in the background shape, affect the efficiency ratio and are added as Gaussian constraints on the relevant efficiency ratios when calculating the limit. They are assumed to be fully correlated between the bins of fractional corrected mass uncertainty and uncorrelated between the different effects. For the background shape, the increased freedom in the shape leads to a larger uncertainty in the signal yield. The likelihood distribution used for determining the limit is stretched by the relative change in uncertainty around the minimum to reflect this.
8 Conclusions
A search has been performed for the rare leptonic decay , using 4.7 of proton-proton collision data collected by the LHCb experiment. No signal is observed for the decay and an upper limit of at 95% confidence level is set on the branching fraction, where the lowest of the two mass combinations is below 980$${\mathrm{\,Me\kern-1.00006ptV\!/}c^{2}}. The limit for the full kinematic region stays the same under the assumption that the decay is dominated by intermediate vector mesons.
Acknowledgements
We express our gratitude to our colleagues in the CERN accelerator departments for the excellent performance of the LHC. We thank the technical and administrative staff at the LHCb institutes. We acknowledge support from CERN and from the national agencies: CAPES, CNPq, FAPERJ and FINEP (Brazil); MOST and NSFC (China); CNRS/IN2P3 (France); BMBF, DFG and MPG (Germany); INFN (Italy); NWO (Netherlands); MNiSW and NCN (Poland); MEN/IFA (Romania); MSHE (Russia); MinECo (Spain); SNSF and SER (Switzerland); NASU (Ukraine); STFC (United Kingdom); NSF (USA). We acknowledge the computing resources that are provided by CERN, IN2P3 (France), KIT and DESY (Germany), INFN (Italy), SURF (Netherlands), PIC (Spain), GridPP (United Kingdom), RRCKI and Yandex LLC (Russia), CSCS (Switzerland), IFIN-HH (Romania), CBPF (Brazil), PL-GRID (Poland) and OSC (USA). We are indebted to the communities behind the multiple open-source software packages on which we depend. Individual groups or members have received support from AvH Foundation (Germany); EPLANET, Marie Skłodowska-Curie Actions and ERC (European Union); ANR, Labex P2IO and OCEVU, and Région Auvergne-Rhône-Alpes (France); Key Research Program of Frontier Sciences of CAS, CAS PIFI, and the Thousand Talents Program (China); RFBR, RSF and Yandex LLC (Russia); GVA, XuntaGal and GENCAT (Spain); the Royal Society and the Leverhulme Trust (United Kingdom); Laboratory Directed Research and Development program of LANL (USA).
The reference list from the paper itself. Each links out to its DOI / PubMed record.
- 1[1] D. Silverman and H. Yao, Relativistic treatment of light quarks in D 𝐷 D and B 𝐵 B mesons and W 𝑊 W\! -exchange weak decays , Phys. Rev. D 38 (1988) 214 · doi ↗
- 2[2] G. Isidori and P. Paradisi, Hints of large tan ( β ) 𝛽 \tan(\beta) in flavour physics , Phys. Lett. B 639 (2006) 499 , ar Xiv:hep-ph/0605012 · doi ↗
- 3[3] Belle collaboration, B. Kronenbitter et al. , Measurement of the branching fraction of B + → τ + ν τ → superscript 𝐵 superscript 𝜏 subscript 𝜈 𝜏 B^{+}\rightarrow\tau^{+}\nu_{\tau} decays with the semileptonic tagging method , Phys. Rev. D 92 (2015) 051102 , ar Xiv:1503.05613 · doi ↗
- 4[4] Belle collaboration, K. Hara et al. , Evidence for B − → τ − ν ¯ τ → superscript 𝐵 superscript 𝜏 subscript ¯ 𝜈 𝜏 B^{-}\rightarrow\tau^{-}\bar{\nu}_{\tau} with a hadronic tagging method using the full data sample of Belle , Phys. Rev. Lett. 110 (2013) 131801 , ar Xiv:1208.4678 · doi ↗
- 5[5] Ba Bar collaboration, J. P. Lees et al. , Evidence of B + → τ + ν → superscript 𝐵 superscript 𝜏 𝜈 B^{+}\rightarrow\tau^{+}\nu decays with hadronic B tags , Phys. Rev. D 88 (2013) 031102(R) , ar Xiv:1207.0698 · doi ↗
- 6[6] Ba Bar collaboration, B. Aubert et al. , Search for B + → ℓ + ν ℓ → superscript 𝐵 superscript ℓ subscript 𝜈 ℓ B^{+}\rightarrow\ell^{+}\nu_{\ell} recoiling against B − → D 0 ℓ − ν ¯ X → superscript 𝐵 superscript 𝐷 0 superscript ℓ ¯ 𝜈 𝑋 B^{-}\rightarrow D^{0}\ell^{-}\bar{\nu}X , Phys. Rev. D 81 (2010) 051101(R) , ar Xiv:0912.2453 · doi ↗
- 7[7] Heavy Flavor Averaging Group, Y. Amhis et al. , Averages of b 𝑏 b -hadron, c 𝑐 c -hadron, and τ 𝜏 \tau -lepton properties as of summer 2016 , Eur. Phys. J. C 77 (2017) 895 , ar Xiv:1612.07233 , updated results and plots available at https://hflav.web.cern.ch/ · doi ↗
- 8[8] Belle collaboration, A. Sibidanov et al. , Search for B − → μ − ν ¯ μ → superscript 𝐵 superscript 𝜇 subscript ¯ 𝜈 𝜇 B^{-}\rightarrow\mu^{-}\bar{\nu}_{\mu} decays at the Belle experiment , Phys. Rev. Lett. 121 (2018) 031801 , ar Xiv:1712.04123 · doi ↗