Data Provenance for Sport
Andrew J. Simmons, Scott Barnett, Simon Vajda, Rajesh Vasa

TL;DR
This paper introduces a custom provenance notation tailored for sport performance analysis, evaluates existing standards and tools, and highlights the need for domain-specific adaptations to improve data traceability.
Contribution
It proposes a domain-specific provenance notation for sports, maps it to W3C PROV, and assesses the limitations of current tools in capturing sport workflows.
Findings
W3C PROV and VisTrails cannot fully capture sport workflows
Existing tools have usability and terminology issues
Domain-specific adaptations are necessary for effective provenance management
Abstract
Data analysts often discover irregularities in their underlying dataset, which need to be traced back to the original source and corrected. Standards for representing data provenance (i.e. the origins of the data), such as the W3C PROV standard, can assist with this process, however require a mapping between abstract provenance concepts and the domain of use in order to apply them effectively. We propose a custom notation for expressing provenance of information in the sport performance analysis domain, and map our notation to concepts in the W3C PROV standard where possible. We evaluate the functionality of W3C PROV (without specialisations) and the VisTrails workflow manager (without extensions), and find that as is, neither are able to fully capture sport performance analysis workflows, notably due to limitations surrounding capture of automated and manual activities respectively.…
Click any figure to enlarge with its caption.
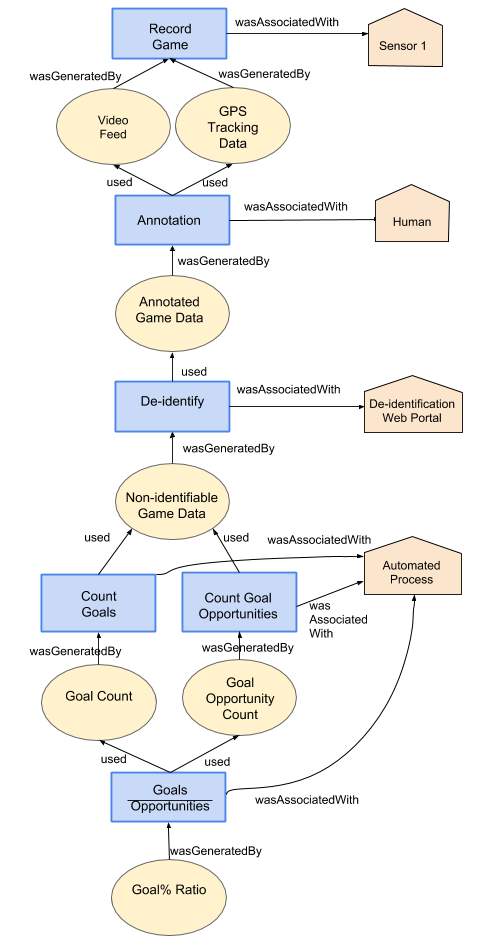 Figure 1
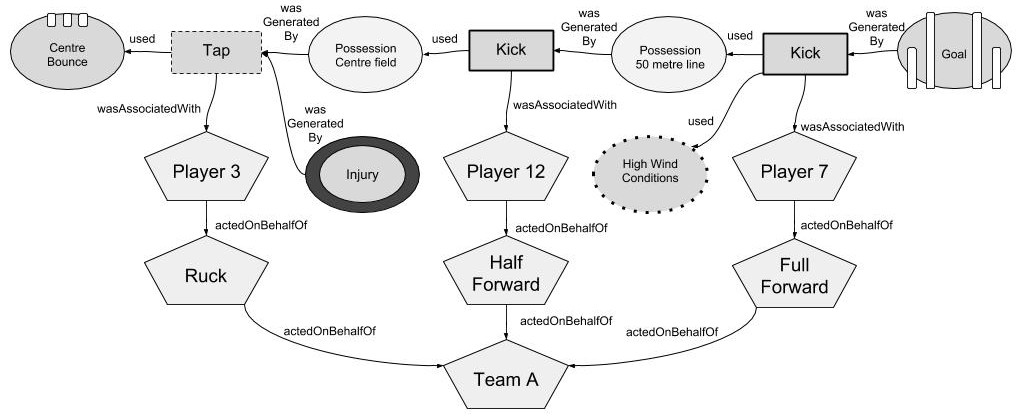 Figure 2
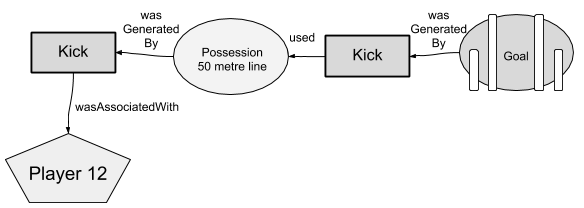 Figure 3
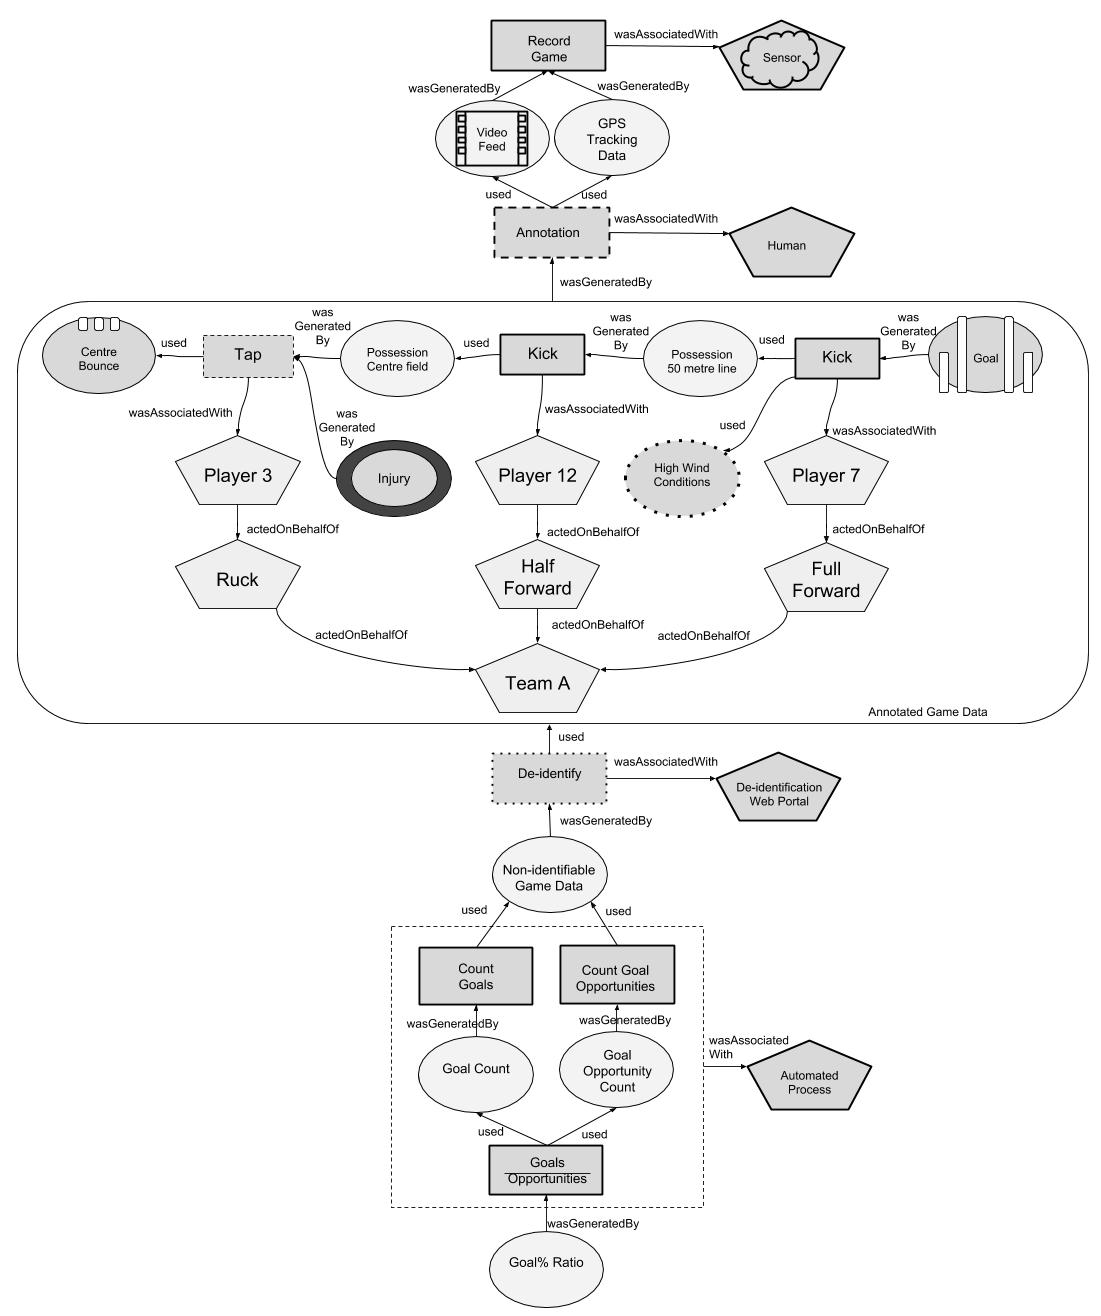 Figure 4
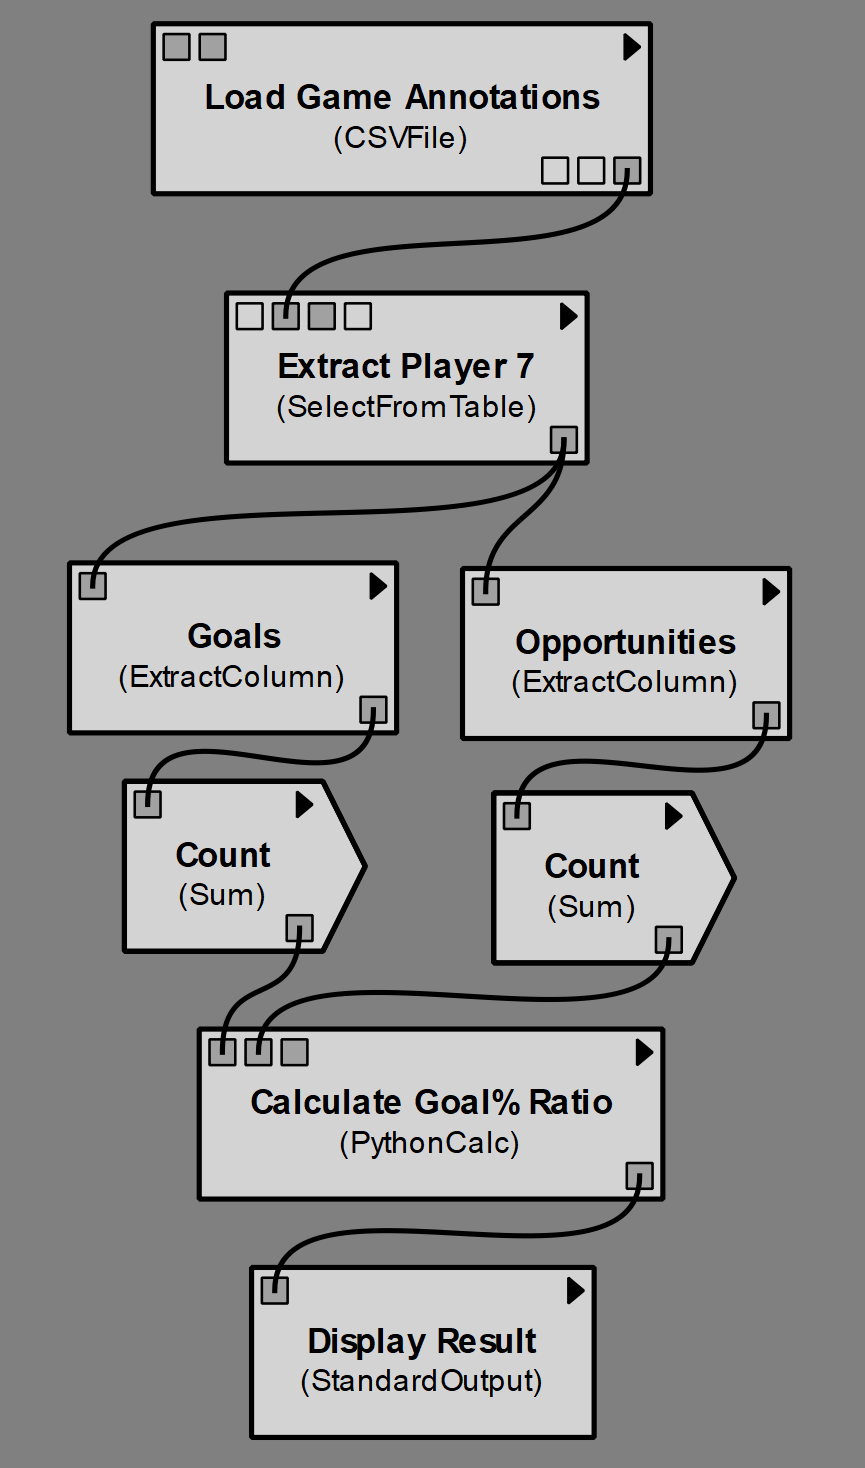 Figure 5
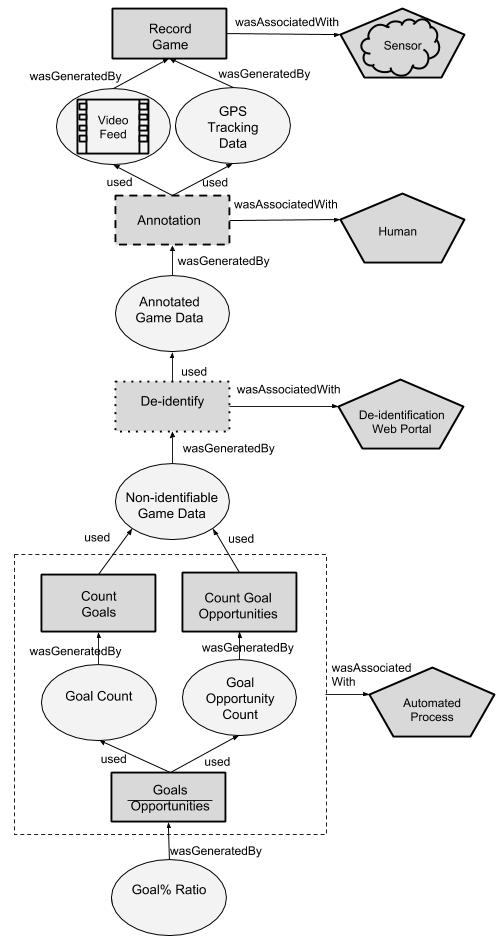 Figure 6
| Requirement | Description |
|---|---|
| Integrated support for working with video data | The ability to interactively annotate segments of a video timeline as events of interest, capture the relationships between these events, and to visually playback the video for an event. |
| Support for automated processes | The ability to automate interconnected computations such that they can be recomputed on an updated dataset with minimal manual intervention. |
| Support for manual interaction | The ability to interweave manual processes with automated processes within a workflow, and to manually override the result of automated processes. |
| Partial / shared workflow graphs | The ability to share different parts of the workflow with different users (e.g. external collaborators should not be able to reverse the de-identification operation), and to merge changes from other users (e.g. changes suggested by external collaborators) back into one’s own workflow. |
| Provenance / Reverse Debugging | The ability to trace the provenance of an analysis result back to the raw inputs that contributed, and to scrutinise the intermediate calculations at each step of the process. |
| Streaming data | The ability to perform calculations in real-time as new data become available. To prevent latency, automated processes should be performed in parallel where possible, and recompute only what is necessary. Similarly, any manual processes in the workflow should be crowdsourced to a team of annotators to prevent bottlenecks. |
| Semantic Construct (W3C PROV) | Description (in context of Sport) | Specialised Semantic Construct (in context of Sport) | ID |
| Entity | Entities can be either digital data, or physical concepts such as the state of having possession of the ball. | Video feed | 1 |
| Physical game state | 2 | ||
| Metric | 3 | ||
| Activity | A process, whether manual or automated | Annotation | 4 |
| Computation | 5 | ||
| De-identify | 6 | ||
| Agent | The person or device involved in performing an activity. | Human | 7 |
| Player | 8 | ||
| Player Role | 9 | ||
| Sensor | 10 | ||
| Web portal | 11 | ||
| Connection | While data provenance deals with data dependency, physical provenance deals with causality. | Data dependency | 12 |
| Physical causality | 13 |
| Requirement | W3C PROV777For W3C PROV, we evaluate the ability to model provenance information, however an external system would be needed to actually capture the provenance information and explore it. | VisTrails |
|---|---|---|
| Integrated support for working with video data | No888Partial support may be possible via extending the language with additional modules / semantics. | No††footnotemark: |
| Support for automated processes | No††footnotemark: | Yes |
| Support for manual interaction | Yes | Partial |
| Partial / shared workflow graphs | Yes | Partial |
| Provenance / Reverse Debugging | Yes | Partial |
| Streaming data | Yes | Partial |
| Criterion | W3C PROV | VisTrails |
| Semiotic Clarity (fraction of semantic constructs in Table 2 mapped to unique symbols) | 4/13 Contains high level semantics for entity, activity, agent and connection. | 3/13 Metric (port), computation, data dependency (connection). No concept of agents. No ability to directly model real world. No concept of connection causality. |
| Perceptual Discriminability (fraction of symbols with unique visual variables) | 4/4 Could be improved: different colours / shapes for specialisations. (Points still awarded because top level constructs have distinct symbols) | 3/3 Ports and activities share same shape as each other, but differ by size. Could be improved: ports with different types should have different colours / shapes. Activities with different types should have different colours and use a larger variety of shapes. (Points still awarded for these because only one type of sport semantic construct was supported) |
| Semantic Transparency (fraction of symbols with obvious meanings) | 0/4 Use of circles for entities and rectangles for processes conflicts with data flow diagrams (which use circles for processes). Use of house shaped pentagons for agents is only memorable when agent represents an organisation. Arrows are in direction of data dependency, but intuitive interpretation is in direction of data flow. | 3/3 Analogy: electric circuit (rectangular components, small contacts, connection wires) Could be improved: While obvious square is a port, not obvious which port is which (user has to memorise order). While obvious that box is a process, specific type of process is not obvious (e.g. uses pentagon for control flow rather than conventional diamond for “if” condition) |
| Complexity Management (can it visualize complex workflows?) | Yes Ontologies support the “Open-world assumption”, thus allowing specifying as much or as little detail as appropriate. | Yes Supports grouping nodes |
| Cognitive Integration (can the user navigate without getting lost?) | Yes Includes concept of “bundles” to annotate information required to navigate documents at meta-level. E.g. to describe provenance of provenance information. | Yes Top level workflow acts as overview, then user can drill down into parameter values, history variations, etc. |
| Visual Expressiveness (fraction of visual variables used) | 2/8 Shape and colour. | 1/8 Shape Colour is used for execution state, but this is not one of semantic constructs, and brightness is used to determine if a port is connected, but neither of these map to semantic constructs of relevance. |
| Dual Coding (fraction of symbol parameters with multiple unique visual variables) | 1/3 Shape and colour used together to ensure symbols are distinct (i.e. colours improve distinguishability of symbols, and even if user is colour blind, symbols are still distinguishable by shape) | 0/3 In theory shape and colour can be assigned if designing custom module, but colour is not used in any of the default modules. |
| Graphic Economy (total symbols, less is better as it reduces cognitive load) | 4 | 3 (If we were to remove all features that we are not assessing) |
| Cognitive Fit (is the notation understandable to performance analysts?) | Partial When arrows are labeled, visual notation is unambiguous. | Partial Intuitive flow metaphor, however advanced operations require writing custom Python scripts. |
| Criterion | Support | Issues |
| Visibility of system status | Shows progress indicator when evaluating workflow. Displays which modules executed / have errors. | |
| Match between system and the real world | Boxes for processes connected by lines resembles real-world electronic wiring of modules. | Some terms may present confusion for non-technical users: “PythonCalc” (evaluate an expression), “StandardOutput” (display result in the terminal), and “Map” (a higher order function, not a geological map). |
| User control and freedom | Full tracking of history as tree | |
| Consistency and standards | Some terms such as “port” (rather than input / output) may increase time to learn. | |
| Error prevention | Ports have types to ensure that user can only connect two ports if their types match. | |
| Recognition rather than recall | The system provides some support to aid the user’s memory (e.g. dark ports to remind the user a default has been set) | The user needs to memorise the port order of modules to use the interface efficiently. |
| Flexibility and efficiency of use | Provides shortcut key combinations for advanced users | |
| Aesthetic and minimalist design | Main focus of the application is on the workflow | |
| Help users recognize, diagnose, and recover from errors | System highlights module(s) with error | Use of colour as sole indicator of error could be problematic for users with colour blindness. |
| Help and documentation | User manual includes step-by-step guidelines on how to use. In-built option to display documentation for the selected module | In-built documentation for module often missing |
Peer Reviews
No public reviews on file for this paper yet. If you reviewed it on a platform where reviews are public (OpenReview, ICLR, NeurIPS, ICML), you can paste yours below so the community can read it here.
Videos
No videos yet. Explain this paper in a talk, walkthrough, or lecture? Add one.
Taxonomy
TopicsScientific Computing and Data Management · Research Data Management Practices · Data Visualization and Analytics
Data Provenance for Sport
Andrew J. Simmons
Deakin UniversityApplied Artificial Intelligence InstituteLocked Bag 20000GeelongVICAustralia3220
,
Scott Barnett
Deakin UniversityApplied Artificial Intelligence InstituteLocked Bag 20000GeelongVICAustralia3220
,
Simon Vajda
Deakin UniversityApplied Artificial Intelligence InstituteLocked Bag 20000GeelongVICAustralia3220
and
Rajesh Vasa
Deakin UniversityApplied Artificial Intelligence InstituteLocked Bag 20000GeelongVICAustralia3220
(2016)
Abstract.
Data analysts often discover irregularities in their underlying dataset, which need to be traced back to the original source and corrected. Standards for representing data provenance (i.e. the origins of the data), such as the W3C PROV standard, can assist with this process, however require a mapping between abstract provenance concepts and the domain of use in order to apply them effectively. We propose a custom notation for expressing provenance of information in the sport performance analysis domain, and map our notation to concepts in the W3C PROV standard where possible. We evaluate the functionality of W3C PROV (without specialisations) and the VisTrails workflow manager (without extensions), and find that as is, neither are able to fully capture sport performance analysis workflows, notably due to limitations surrounding capture of automated and manual activities respectively. Furthermore, their notations suffer from ineffective use of visual design space, and present potential usability issues as their terminology is unlikely to match that of sport practitioners. Our findings suggest that one-size-fits-all provenance and workflow systems are a poor fit in practice, and that their notation and functionality need to be optimised for the domain of use.
Data provenance, Sport
††copyright: rightsretained††doi: 10.475/123_4††isbn: 123-4567-24-567/08/06††conference: ACM Woodstock conference; July 1997; El Paso, Texas USA††journalyear: 1997††price: 15.00††ccs: Information systems Data provenance
1. Introduction
Sport performance analysis involves a combination of manual annotation of video, automatable derivation of performance statistics from the annotations, and ad-hoc interplay of manual and automated processes to refine data and define new metrics. The competitive nature of sport, and the the explosion of available data captured by in-game sensors, had led to demand for increasingly sophisticated forms of analysis. However, without some form of data provenance describing all processes and data sources used in the derivation of the final performance statistic, there is limited ability to reproduce the analysis, nor to audit the process for human error, software bugs, or data entry errors that may have affected the result.
We begin by providing a motivating scenario inspired by real challenges faced by sport performance analysts, and highlight the need for data provenance to audit and reproduce the processes. These scenarios are used to elicit requirements, that form the basis for our proposed provenance notation optimised for sport performance analysis.
We then evaluate the functionality, notational effectiveness, and usability of existing tools for the description and capture of data provenance, specifically the W3C PROV standard and the VisTrails workflow manager. We identify shortcomings of existing systems, and conclude with recommendations on how to bridge the language gap between abstract provenance concepts and the sport performance domain.
2. Motivating Scenario
Consider Ellie, a high performance sport performance analyst for an Australian Rules Football team, who wants to test a new player evaluation metric.
2.1. Physical Provenance Scenario
Ellie begins by annotating video footage of past games using a timeline annotation tool, such as Sportscode111https://www.hudl.com/elite/sportscode. From the centre bounce (start of play), Player 3 taps the ball to player 12, who kicks it to Player 7, who scores a goal. As per the laws of the game, after the goal, the ball is returned to the centre of the field for the next centre bounce.
Upon annotating the video footage from all past games, Ellie decides to investigate one of the goals within more detail. For example, she might want to investigate goal assists that led to scoring the goal (assume that the club does not already have a custom label to represent the set of goal assists). While she can re-watch the video footage, ideally she would like to be able to extract an abstract representation of the provenance of the goal (i.e. how the goal came to be) using the data that she has coded in order to allow her to efficiently investigate a large number of cases without needing to re-watch the footage.
Within her timeline tool, Ellie is able to search for a goal and scan back in time to see the possession chain, however her timeline is cluttered with additional annotations such as the medical team’s annotation of an on-field injury to Player 3’s knee. While she can hide certain event types, she cannot instruct her timeline tool to automatically hide everything that did not contribute to the goal, as her timeline tool has no concept of how events are connected to each other. Furthermore, she sees events prior to the centre bounce and after the goal, as her timeline tool does not recognise that these events reset the game state.
2.2. Workflow Provenance Scenario
Ellie’s timeline tool allows her to qualitatively analyse specific events through the medium of video, but does not provide a way for her to directly compute custom metrics from her annotations. To do so, she exports her timeline annotations to an intermediate format (e.g. CSV), so that she can statistically analyse the data using an external analysis tool (e.g. Microsoft Excel).
Prior to conducting the analysis, Ellie de-identifies the exported annotation data by substituting player identifiers with anonymised codes. This allows her to collaborate on the analysis with external researchers who for privacy reasons should not be given access to identifiable player data. Ellie retains a private copy of the mapping between player identifiers and anonymous codes.
Using her analysis tool, Ellie imports the de-identified game annotations, and – with some assistance from her research collaborators – computes the player evaluation metric for each (anonymised) player. Once the analysis is complete, Ellie re-identifies the players in the final output using the mapping she kept.
Player 7 is upset at the result of their metric, and requests to see game video clips of events that contributed to the calculation. Fortunately, Ellie saved the intermediate calculation spreadsheet, but the calculations are difficult for Ellie to explain, as the the inputs are expressed as numerical time offsets rather than embedded video clips, and furthermore the calculations were performed using anonymised identifiers. In order to allow the player to audit the calculations, Ellie has to reverse the process by looking up the anonymised identifier for Player 7 such that she can find the relevant calculations, then extract video segments for each time offset associated with inputs to the calculations records.
Upon scrutinising the raw video with the player, Ellie notices that the video shows that one of the missed goals was due to high wind conditions rather than the fault of the player, but the wind sensor (anemometer) was malfunctioning at the time so wasn’t automatically accounted for in Ellie’s model of goal opportunity. Ellie manually overrides the data in the wind sensor file for that period to indicate high wind conditions, and reruns her calculations. However, she has to be cautious that her manual changes aren’t overwritten when she next synchronises sensor data with the device.
2.3. Streaming Scenario
The coach is impressed with Ellie’s proposed metric, and asks if she could annotate the game live as it is played and provide regular updates of each player’s metric over the course of the game. While existing timeline annotation tool interfaces provide buttons and hotkeys to allow the data entry rate needed for annotating the game live, Ellie’s current workflow for calculating her metric requires manually exporting the data and running a computationally intensive process. She needs a mechanism to automatically recompute the results in real-time as new data become available.
2.4. Requirements Elicitation
From the pain points outlined in the above tasks, we extract requirements for the solution. These are presented in Table 1.
3. Background
Sport performance analysis is a form of applied sport science, and implicitly involves the construction of scientific workflows to analyse data (note that workflows can involve ad hoc human tasks, and are not necessarily formally documented, if at all).
Scientific workflows (Gil2007, 16) may involve both manual and automated processes, as well as ad hoc data transformations to explore the data from different perspectives (Jankun-Kelly2007, 17). It is generally accepted that one should, in principle, be able to reproduce the steps in order to obtain the same final result. In practice however, science is facing a “reproducibility crisis” (Baker2016, 2) wherein researchers are unable to reproduce others’ results, or in many cases their own. Data provenance systems aim to alleviate this issue through support for capture and query of information pertaining to the origins of data, such as the primary data source, processes applied, and agents (i.e. both humans and software) involved.
While systems for automated workflows and provenance capture have gained traction in specialised domains such as bioinformatics, the use, or indeed recognition of the need for provenance more generally, such as in the biomedical field as a whole remains “quite low” (Baum2017, 4).
Prominent scientific workflow management tools include VisTrails (Callahan2006, 7), Taverna (Oinn2004, 24), and Kepler (Bowers2006, 5). VisTralils and Taverna represent the workflow of tasks as a directected acyclic graph (DAG), while Kepler provides the user with a choice of the model of computation that will be used. Workflow systems can be integrated with data provenance systems in order to capture both the process (prospective provenance) and trace of results (retrospective provenance) (Missier2013, 19).
The W3C PROV standard (Moreau2015, 22) was introduced in 2013 in an attempt to standardise provenance sharing on the Web. The PROV standard is a component of the semantic web that cross-cuts the ontology, logic and proof layer of the semantic web (Moreau2013, 21) (note that these layers were part of the semantic web vision, but some aspects, particularly the poof layer, remain “largely unrealized” (Shadbolt2006, 26)). Since its release, PROV has been proposed for a range of applications including tracking the source of citation information in curated citation databases (Peroni2017, 25), as an export format for Git version control history (DeNies2013, 14), and as a tool for coordination of human and autonomous agents in disaster response222http://www.orchid.ac.uk/. VisTrails and Taverna both support export of data provenance information according to the W3C PROV standard.333https://github.com/taverna/taverna-prov 444“PROV support” https://github.com/VisTrails/VisTrails/issues/1075
According to the W3C PROV specification, entities may be “physical, digital, conceptual … real or imaginary” 555https://www.w3.org/TR/2013/REC-prov-o-20130430/#Entity. This has led others to consider the use of the specification as a means to model physical provenance, such as the process of creating scientific specimens (Cox2015, 12), and as a tool for modelling the provenance of food (Batlajery2018, 3) to infer sources of contamination. When modelling the provenance of physical systems in this manner, provenance is often assigned a causal definition (i.e. arrows represent causality rather than just dependency), which may optionally be supplemented with probabilities to permit Bayesian reasoning using the provenance graph (Chapman2010, 8).
4. Approach
4.1. Physical Provenance
In this section, we consider the suitability of the W3C PROV specification as a tool to model in-game sports events. Specifically, we focus on modelling the physical provenance of the ball (i.e. the game states that it transitions through). We achieve this through the following mapping of concepts in the sport domain to concepts in the W3C provenance standard: game states (i.e. position on the field and state of possession) as PROV entities; actions that transform the game state (e.g. kicks) as PROV activities; and players that perform the actions as PROV agents. To support reasoning about the game in terms of either specific players (e.g. Cyril Rioli) or the roles they represent (e.g. Half Forward), we use the PROV actedOnBehalfOf relation to describe a many:many relationship between players and roles. This allows our model to handle role changes (e.g. a substitution of player roles due to an injury).
While this mapping is sufficient for formalisation purposes, we must also consider the usability of such a system by a sport performance analyst. Specifically, the abstract concepts of entities, activities and agents are unlikely to be familiar to users in the sport domain, and thus breaks the usability heuristic that software should “speak the user’s language” (Nielsen1994, 23). As such, we propose specialising the notation of PROV with custom symbols for game events in order to translate it into the language of sport.
We provide an example of how the provenance of the goal described in the Motivating Scenario could be modelled in Fig 1. We see that the goal resulted from a kick performed by Player 7, who possessed the ball as a result of a kick by Player 12, who in turn possessed the ball as a result of a tap by Player 3 from the centre bounce which served as the origin of the possession chain.
Due to the tendency of sport to focus on the single point of the ball, we can see the provenance information tends to take the form of a sequential chain. In a hypothetical variant of the game with multiple balls, the provenance would take the form of a graph with parallel branches for each ball and occasional cross-links when games events relating to one ball interfere with game events relating to the other ball. Nevertheless, our example still includes some branching, such as injuries generated by game events that may be handled while the rest of the game progresses, and external events such as wind conditions that occasionally interact with the game through influencing the outcome of a kick.
By annotating the game in such a manner, it becomes possible to express queries about game events in the same manner as one would query a more conventional data provenance graph. For example, the performance analyst may be interested in how a goal came to be, specifically examining goal assists. Without provenance, the performance analyst would have to either rewatch the raw video for the game or read the match feed and filter out irrelevant information. With provenance, they can query the provenance graph for influences on the creation of the goal, supplementing their query to filter to certain node types or depth limits (in this case, filtering to chains involving agents separated by 2 activities). An example of the result one might receive is shown in Fig 2.
4.2. Workflow Provenance
In the previous section, we showed how the W3C PROV specification could be translated into the sports domain to model physical provenance. However, as most sport games focus on a single linear sequence of events, representing the physical aspects of the game as a provenance graph is, by itself, of limited benefit when compared to a traditional linear timeline. The true value of this approach comes when provenance can be traced throughout the entire system to link game events with player metrics.
In this section, we consider the use of the W3C PROV specification to describe the derivation of digital data, such as metrics, computed as part of a workflow. As this task is more abstract, the concepts at this level are not clearly sports specific, especially when compared to our physical provenance model for sport. Nevertheless, we argue that the functional and quality requirements of the sports domain have implications on the selection of an appropriate workflow representation.
Video analysis is one of the primary tools that sport performance analysts use to analyse the game and communicate results to players and coaches. This is evidenced by the popularity of video timeline based annotation tools such as Sportscode amongst elite sports teams. As such, our representation introduces a custom symbol for video data, and we envision that if our representation was used as part of an interactive tool, it would allow the user to directly play back video segments when they form part of the provenance graph, without the need to open the video in an external program and scan to the time of events.
Sport analysis workflows requires a combination of automated processing (e.g. metric calculation) and manual processing (e.g. video annotation). The W3C PROV standard does not make any distinction between manual versus automated processes, so in theory can model both. However, in practice, due to its generality, capturing automated processes fully such that they could be recomputed requires extending the standard to specify these details, such as to capture the source code and software environment involved.
Unlike the physical sciences, sports science involves working with human participants (i.e. sports players). As such, there is often a need to de-identify data for privacy reasons, for example, if a sports club decides to share player data with researchers outside the club. This has implications on the provenance capture system, as it means that different users need access to different parts of the provenance graph (e.g. the researcher should have an incomplete graph that prevents them tracing provenance of the player data back past the de-identify operation, while the sport club should be able to reconstruct the entire provenance graph once the researcher shares their final findings and provenance data).
In Fig 3, we present an example of our proposed notation to capture the provenance of a computation of player goal accuracy.
4.3. Combined Provenance
In the previous sections, we suggested notation for physical provenance to describe game events and separately for workflow provenance to describe metrics and computations. In Fig 4, we show that the annotated game dataset that forms part of the workflow can be decomposed into the underlying game events it represents, and thus physical provenance and workflow provenance can be integrated as part of a single provenance graph.
Combining our customised notation for workflow and physical provenance graphs ensures that all aspects of the provenance system will be expressed using concepts the user can interpret. For example, consider that a sport performance analyst performs a query to trace the provenance of a metric back the the game events that contributed to it. While the query references a metric (Goal% Ratio, etc.) that is defined at the workflow level, the resulting answer needs to be in terms of game events, which can be communicated in the language of sport practitioners by using the same physical provenance notation used to express the physical query response in Fig 2. This prevents the user from being exposed to the underlying system encoding of the game data (as would be the case if they exported the game events using an arbitrary format determined by their video annotation software), thus increasing the overall usability of the system through consistency and familiarity of the representation.
While the broad semantic constructs such as Entities, Activites, Agents, and Connections already exist in the W3C PROV standard, we highlighted the need for specialised semantic constructs (along with syntactic representations) to meet the needs of the sports domain. We provide an overview of the key specialisations required in Table 2.
5. Comparative Evaluation
In this section we compare our proposed approach to the W3C PROV standard and the VisTrails workflow management system, within the context of the sports domain. We evaluate their functionality against the tasks outlined in our motivating scenario (section 2), the effectiveness of their visualisation against design principles described by the Physics of Notations framework (Moody2010, 20), and their usability against Nielsen’s heuristics for user interface design (Nielsen1994, 23).
5.1. Functionality
We will begin by modelling the workflow provenance scenario (see Motivating Scenario) in each system so that we can compare differences of the modelling languages.
The W3C PROV standard includes semantic constructs for modelling entities (e.g. a dataset), activities (e.g. a process) and agents (e.g. people that perform the process). It also includes the concept of a plan to describe how a process was carried out, but the details of how to execute a plan is left open, so cannot fully capture the details of an automated process without introducing additional semantics. We use the W3C PROV standard to describe the computation of player evaluation metric in Fig 5.
VisTrails models workflows as a directed graph of automated processing elements (usually visually represented as rectangular boxes). Each processing element has “ports” that represent the inputs (top of box) and outputs (bottom of box) to/from the process. The user drags connections between output ports and input ports to wire up the workflow. Ports contain type information, which the interface uses to prevent the user from accidentally connecting ports with conflicting types. The resultant workflow is fully automated and reproducible, however is not able to model processes that require human input, other than at the level of tracking manual changes to the the workflow itself. We show an implementation of the metric computation pipeline within VisTrails in Fig 6.
We evaluate these systems against the requirements set out in the Motivating Scenario.
Integrated support for working with video data: The W3C PROV standard does not provide a means to directly represent datasets other than as plain text using the prov:value property. However, it integrates with semantic web technologies such as the Resource Description Framework (RDF) which could, in theory, be used to model and describe a video source. VisTrails contains predefined modules for working with tabular data, but does not provide inbuilt modules for working with video data. One could implement custom modules for loading video data and visualising the final output as video. However, without architectural changes to the source code, the system does not have the flexibility to support interactive editing or display of video sources as it flows through the processing pipeline.
Support for automated processes: The W3C PROV standard includes the concept of a plan to describe how an activity was conducted, but does not capture details such as the source code or software environment that would be needed to reproduce the process. In contrast, VisTrails is a workflow automation tool designed to ensure reproducibility (although this reproducibility may still be undermined by missing data or dependencies on broken web services) and provides a selection of built-in processing modules as well as allowing user-defined Python scripts to cater to situations where the built-in modules are insufficient for a particular task. VisTrails supports export to the W3C PROV standard, but achieves this through mixing in resources within the VisTrails namespace so that it can represent the concepts missing from the PROV standard, as shown in the sample displayed in Listing 1.
Support for manual interaction: Because the W3C PROV standard does not distinguish between manual and automated processes, and only models details of activities at a high level, it is well suited to describing manual processes and the agents (people) involved. VisTrails provides a way for users to explore the parameter space and to interactively view the output of the workflow, however does not provide a way to capture manual processes as steps of the workflow, other than by capturing the history of changes to the structure of the workflow itself. Other workflow systems such as Taverna support interactive processes as components of the workflow that either run locally and interact with the user, or run through a web interface.666https://taverna.incubator.apache.org/documentation/interaction/ However these are limited to self-contained sequential tasks rather than iterative ad-hoc tasks that require interaction with the rest of the pipeline.
Partial / shared workflow graphs: The W3C PROV standard was designed for sharing of provenance information on the web. References to resources that make up the provenance graph are represented as URIs, and thus information referenced by the provenance graph could potentially be restricted by controlling access to the resources referred to. As a concrete example, part of the provenance graph could include a URI referencing a document that contains the mapping of player identifiers to anonymised codes, however the document the URI refers to could be hosted on the sport club’s intranet and require a password to gain access. Social platforms for scientific data sharing have proposed sharing data alongside workflow information, such as MyExperiment (DeRoure2009, 15) for sharing Taverna workflows, and CrowdLabs (Mates2011, 18) for sharing VisTrails workflows. However, a study of Taverna workflows shared on myExperiment found that “nearly 80% of the tested workflows failed to be either executed or produce the same results” (Zhao2012, 28), thus suggesting there still exist practical issues sharing and archiving workflows in a manner that results can be replicated, particularly in cases where certain data cannot be shared for confidentiality reasons. VisTrails contains in-built support for workflow “diff” and “merge”, as well as “visualisation by analogy” which automatically translates changes applied to one workflow to another workflow. These features could potentially ease collaboration on shared workflows.
Provenance / Reverse Debugging: There are multiple types of provenance information. “Workflow provenance” tracks the the processes applied to datasets, but usually does not allow inspection of these processes, whereas “data provenance” is fined-grained provenance that tracks how individual data items are derived from each other (Tan2007, 27). Data provenance is further split into “why” provenance (Widom2000, 13) which captures all data records that contribute to a result, “where” provenance (Buneman2001, 6) which deals with only the parts of records that are copied into a result, and “dependency” provenance (Cheney2007, 9)(Cheney2011, 10) which is similar to why provenance, but formalises the notion of what it means for part of a data record to contribute to a result.
While VisTrails’ provenance browser by default only shows coarse-grained workflow provenance information pertaining to when each component of the workflow was executed, the user can roll back to any version of the workflow, modify the components of interest to output additional debugging information such as inputs and outputs, then re-run workflow using cached results where available. The W3C PROV standard only deals with modelling and representing provenance, not how to capture provenance. The level of granularity expressed is the choice of the person or process that generates the provenance.
Streaming data: The W3C PROV standard can be used to describe provenance in situations involving real-time streams of sensor data by using the standard to describe the provenance of each individual sensor observation (Compton2014, 11). The VisTrails user manual includes a section “streaming in VisTrails” that describes how functions can incrementally process data. This could potentially be utilised to process a stream of sensor data, however the stream would need to terminate eventually for the workflow execution to complete successfully.
We summarise our above findings in Table 3.
5.2. Effectiveness of visual notation
In Table LABEL:EvalNotation, we summarise our findings of the effectiveness of the visual notation used by each system. As the W3C PROV standard provides textual serialisations such as XML, but does not formally specify a visual notation, we evaluate the (non-normative) visualisations the standard uses to document examples.
5.3. Heuristic Usability Evaluation
In Table LABEL:EvalUsability, we summarise the usability issues identified in VisTrails as a result of a heuristic evaluation. We did not attempt to evaluate the usability of the W3C PROV standard, as it does not specify any particular implementation to create provenance documents.
6. Key Findings
- (1)
Automated workflow tools often lack support for capturing ad-hoc manual processes that cannot be automated. Conversely, provenance standards such as W3C PROV recognise the need to document the inputs and procedures involved in ad-hoc manual processes, but lack semantics for describing the code and execution environment necessary to reproduce automated parts of the analysis. Supporting the needs of the sports domain – and other fields where manual and automated analysis are intertwined – requires combining these as part of a unified standard to ensure a complete and reproducible capture of the analysis. 2. (2)
As automated workflow tools treat processes as black boxes with limited traceability, their provenance logs typically only show basic execution information such as the time the process ran and status of the result. However, analysts in the sport domain require fine-grained data provenance to trace results back to raw events. Although the black box nature of workflows prevents support of “why” provenance and “where” provenance methods designed for analysing provenance of SQL query results, we noted that workflows implicitly support a form of retrospective investigation through the ability to roll back history and recompute key processes with additional logging information or with modified data inputs to observe the effects on the output. In cases where capturing fine-grained provenance is not possible, we suggest that workflow systems could support the user to retrospectively reason about the likely provenance of data by guiding the user through the procedure of retrospectively collecting intermediate states and manipulating inputs to infer which data values had an impact on the result of the process. This approach could also be used to support user reasoning about provenance in workflows that involve complex probabilistic processes (such as neural networks) by supporting the user with the tools to rewind the process and “prod” at intermediate data to understand what is most relevant (i.e. sensitivity analysis) and whether expected properties hold (i.e. metamorphic testing) rather than overloading the user with information about the computations carried out. 3. (3)
Our analysis of the notations used shows poor utilisation of the available design space. Notably the “graphic economy” of the systems studied could be improved by utilising additional visual variables such as texture to further distinguish symbols. As certain domains demand a different set of semantic constructs to others (e.g. the reliance on video annotation within the sport domain), we advocate for optimising the visual notation for the domain. Translating abstract provenance concepts into concrete concepts in the language of the domain would reduce the number of usability issues faced by practitioners.
7. Conclusions
While general purpose workflow managers and provenance notations exist, we have demonstrated that these systems need extensions and specialisations respectively in order to express the sport domain. Our proposed notation demonstrates what such a language could look like in the sport domain, however would need to be supplemented with tooling to make this a reality.
Future work is needed to evaluate how potential users respond to our proposed notation. A study by Bachour et al. in which a computer game presented gamers with a visualisation inspired by the W3C PROV standard suggests that non-expert users may be confused by the direction of the arrows, as they are intuitively interpreted as data flow rather than data dependency (Bachour2015, 1). An empirical evaluation is needed to detect whether similar issues also exist in the sport domain.
We speculate that usability issues arising from the use of general provenance systems in the context of a domain with specialised needs and terminology could be hindering the uptake of provenance systems despite the widely recognised need for reproducible research. While we have explored issues from the perspective of the sport domain, it is possible that other scientific subfields could also benefit through the introduction of customised provenance languages for their scientific domain. Thus another avenue for future work is to use our methodology to generate a family of provenance systems, each optimised for a particular scientific domain.
Appendix A Appendices
The reference list from the paper itself. Each links out to its DOI / PubMed record.
- 1(1) Khaled Bachour, Richard Wetzel, Martin Flintham, Trung Dong Huynh, Tom A. Rodden and Luc Moreau “Provenance for the People: An HCI Perspective on the W 3C PROV Standard through an Online Game” In 33rd Annual ACM Conference on Human Factors in Computing Systems (CHI’15) , 2015 URL: http://eprints.nottingham.ac.uk/37612/1/PROV%20CHI%20v 1.4%20camera%20ready.pdf
- 2(2) Monya Baker and Dan Penny “Is there a reproducibility crisis?” In Nature 533.7604 , 2016, pp. 452–454 DOI: 10.1038/533452 A · doi ↗
- 3(3) Belfrit Victor Batlajery, Mark Weal, Adriane Chapman and Luc Moreau “Belief Propagation Through Provenance Graphs” In Provenance Week ’18: 7th International Provenance And Annotation Workshop , 2018 URL: https://kclpure.kcl.ac.uk/portal/en/publications/belief-propagation-through-provenance-graphs(c 1b 7a 54d-4e 9c-4a 9f-8d 7d-cce 4a 6b 1e 4ab).html
- 4(4) Benjamin Baum, Christian R. Bauer, Franke Thomas, Kusch Harald, Parciak Marcel, Rottmann Thorsten, Umbach Nadine and Sax Ulrich “Opinion paper: Data provenance challenges in biomedical research” In it - Information Technology 59.4 , 2017, pp. 191–196 DOI: 10.1515/itit-2016-0031 · doi ↗
- 5(5) Shawn Bowers, Timothy Mcphillips, Bertram Ludascher, Shirley Cohen, Susan B Davidson and Bertram Ludäscher “A Model for User-Oriented Data Provenance in Pipelined Scientific Workflows” In Lecture Notes in Computer Science 4145.4145 , 2006, pp. 133–147 DOI: 10.1007/11890850˙15 · doi ↗
- 6(6) Peter Buneman, Sanjeev Khanna, W Tan and Tan Wang-Chiew “Why and Where: A Characterization of Data Provenance” In Proceedings of International Conference on Database Theory (ICDT) 1973.January , 2001, pp. 316–330 DOI: 10.1007/3-540-44503-X˙20 · doi ↗
- 7(7) Steven P. Callahan, Juliana Freire, Emanuele Santos, Carlos E. Scheidegger, Cláudio T. Silva and Huy T. Vo “Vis Trails: Visualization meets Data Management” In Proceedings of the 2006 ACM SIGMOD international conference on Management of data - SIGMOD ’06 , 2006, pp. 745 DOI: 10.1145/1142473.1142574 · doi ↗
- 8(8) Adriane Chapman, Barbara Blaustein and Chris Elsaesser “Provenance-based Belief” In Proceedings of the 2nd Conference on Theory and Practice of Provenance San Jose, California: USENIX Association, 2010, pp. 1–14 URL: https://dl.acm.org/citation.cfm?id=1855806