Detection of nonmagnetic metal thin film using magnetic force microscopy
Fujio Wakaya, Kenta Oosawa, Masahiro Kajiwara, Satoshi Abo, and Mikio, Takai

TL;DR
This paper explores how magnetic force microscopy can detect nonmagnetic metal thin films by analyzing tip oscillations, enabling contactless measurement of properties like sheet resistivity at the nanoscale.
Contribution
It provides a theoretical framework for detecting nonmagnetic metals with MFM and identifies optimal oscillation frequencies for sensitive measurements.
Findings
Good agreement between theory and experiment.
Detection sensitivity depends on oscillation frequency.
Resonance frequency shifts can indicate metal presence.
Abstract
Magnetic force microscopy (MFM) allows detection of stray magnetic fields around magnetic materials and the two-dimensional visualization of these fields. This paper presents a theoretical analysis of the oscillations of an MFM tip above a thin film of nonmagnetic metal. The results show good agreement with experimental data obtained by varying the tip height. The phenomenon analyzed here can be applied as a "metal detector" at the nanometer scale and for contactless measurement of sheet resistivity. The detection sensitivity is obtained as a function of oscillation frequency, thus allowing determination of the best frequency for phase-shift measurement. The shift in resonance frequency due to the presence of a nonmagnetic metal is also discussed.
Click any figure to enlarge with its caption.
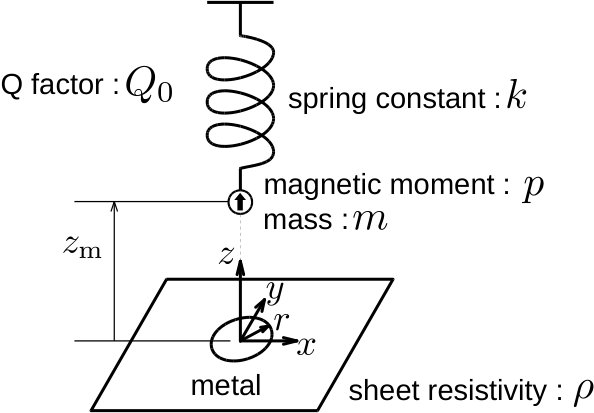 Figure 1
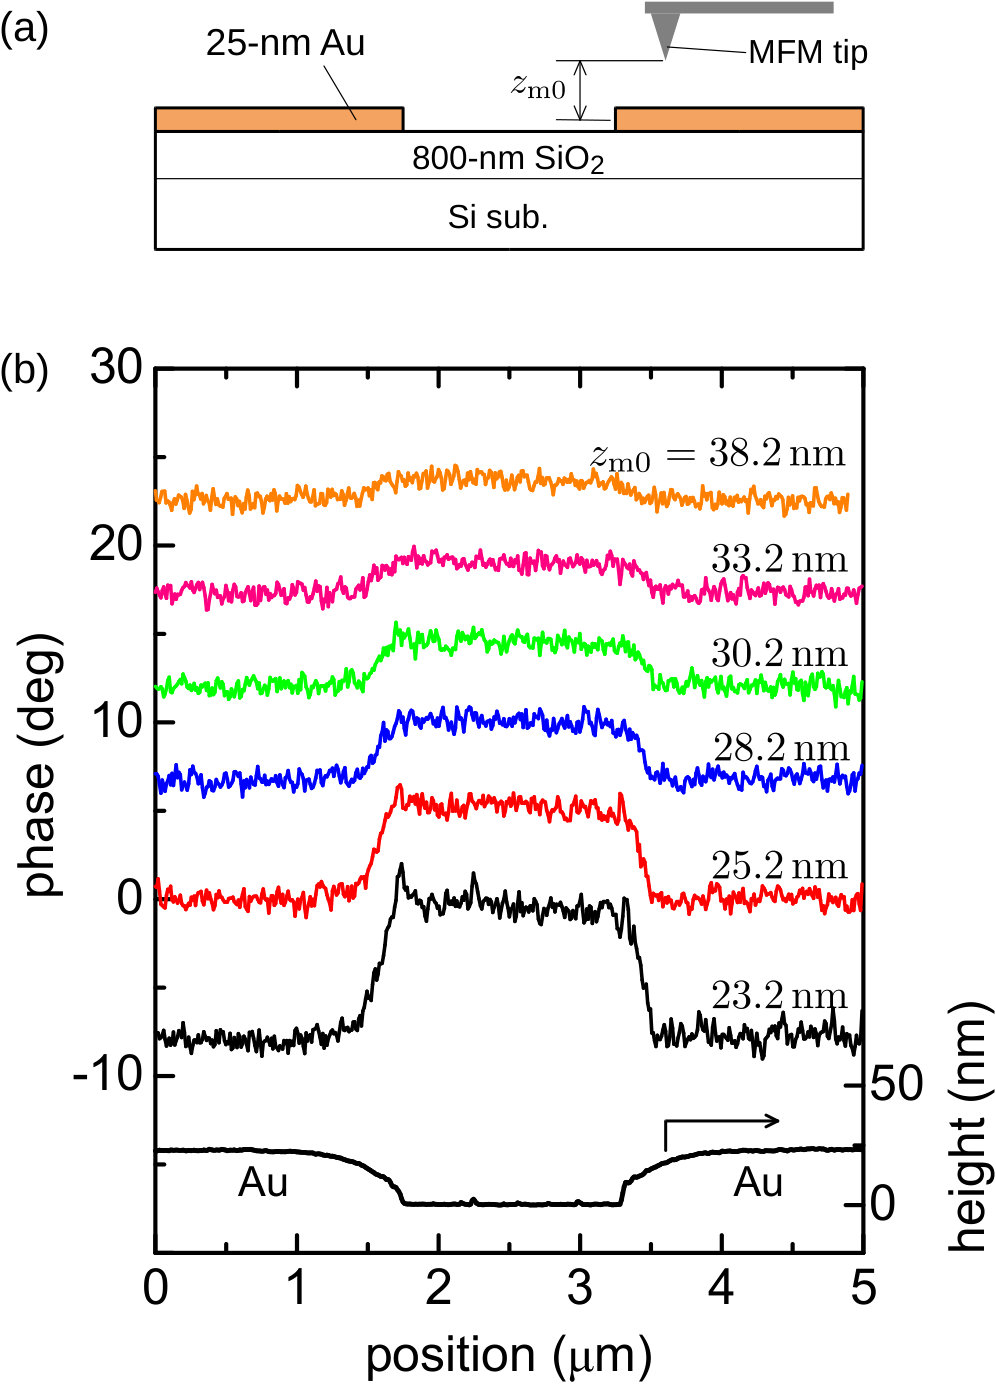 Figure 2
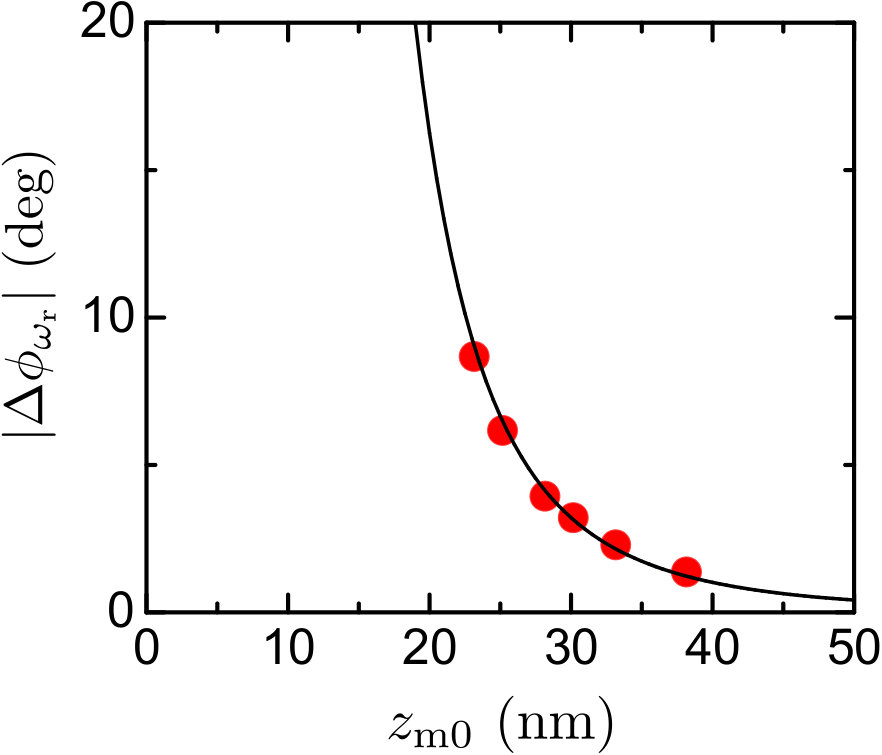 Figure 3
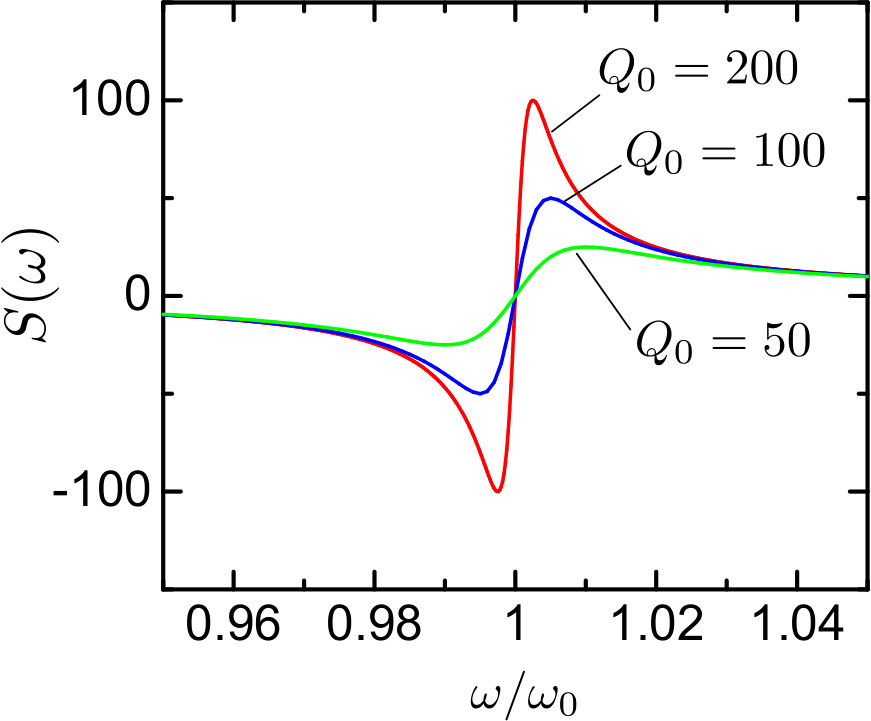 Figure 4
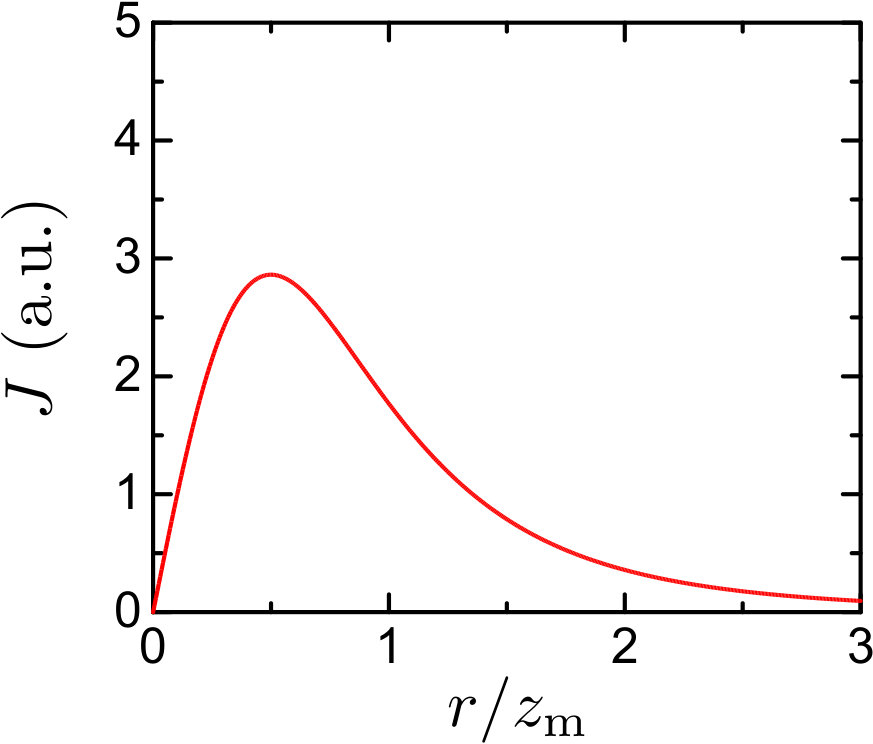 Figure 5
Peer Reviews
No public reviews on file for this paper yet. If you reviewed it on a platform where reviews are public (OpenReview, ICLR, NeurIPS, ICML), you can paste yours below so the community can read it here.
Videos
No videos yet. Explain this paper in a talk, walkthrough, or lecture? Add one.
Present affiliation: ]Daihatsu Motor Co., Ltd.
Detection of nonmagnetic metal thin film using magnetic force microscopy
Fujio Wakaya
Center for Science and Technology under Extreme Conditions, Graduate School of Engineering Science, Osaka University, 1–3 Machikaneyama, Toyonaka, Osaka 560-8531, Japan
Kenta Oosawa
Center for Science and Technology under Extreme Conditions, Graduate School of Engineering Science, Osaka University, 1–3 Machikaneyama, Toyonaka, Osaka 560-8531, Japan
Masahiro Kajiwara
[
Center for Science and Technology under Extreme Conditions, Graduate School of Engineering Science, Osaka University, 1–3 Machikaneyama, Toyonaka, Osaka 560-8531, Japan
Satoshi Abo
Center for Science and Technology under Extreme Conditions, Graduate School of Engineering Science, Osaka University, 1–3 Machikaneyama, Toyonaka, Osaka 560-8531, Japan
Mikio Takai
Center for Science and Technology under Extreme Conditions, Graduate School of Engineering Science, Osaka University, 1–3 Machikaneyama, Toyonaka, Osaka 560-8531, Japan
(Nov. 2, 2018 submitted to Appl. Phys. Lett.; revised on Dec. 2, 2018; accepted on Dec. 4, 2018)
Abstract
Magnetic force microscopy (MFM) allows detection of stray magnetic fields around magnetic materials and the two-dimensional visualization of these fields. This paper presents a theoretical analysis of the oscillations of an MFM tip above a thin film of nonmagnetic metal. The results show good agreement with experimental data obtained by varying the tip height. The phenomenon analyzed here can be applied as a “metal detector” at the nanometer scale and for contactless measurement of sheet resistivity. The detection sensitivity is obtained as a function of oscillation frequency, thus allowing determination of the best frequency for phase-shift measurement. The shift in resonance frequency due to the presence of a nonmagnetic metal is also discussed.
Journal reference: Appl. Phys. Lett. 113, 261601 (2018). published on-line: Dec. 26, 2018.
DOI: 10.1063/1.5079763
Magnetic force microscopy (MFM) is often used for detecting stray magnetic fields near the surfaces of magnetic materials,Sarid (1994); Rugar et al. (1990); Hartmann (1999) with a magnetized tip oscillating above the material. However, in their investigation of the current-induced magnetic field from nonmagnetic metal lines, Tanaka *et al.*Tanaka et al. (2007) reported that MFM can detect small signals from nonmagnetic materials (see Fig. 4 of Ref. Tanaka et al., 2007). They attributed the observed small signals in the absence of current to an effect of surface topography, although they did not specify this effect exactly. Similar small signals have been reported by Stiller et al.,Stiller et al. (2017) who investigated the current-induced magnetic field using a ring-shaped nonmagnetic metal line and observed a ring in the MFM image without any current [see Fig. 3(c) of Ref. Stiller et al., 2017]. However, neither Tanaka *et al.*Tanaka et al. (2007) nor Stiller *et al.*Stiller et al. (2017) discussed the origin of the observed small signals in the absence of magnetic materials and of currents. In the present work, such MFM signals from a thin film of nonmagnetic metal are shown to originate from eddy currents induced in the film by the oscillating MFM tip. This effect enables us to detect the presence of a nonmagnetic metal even if it is buried in an insulator, and therefore it could act as a “metal detector” in the nanometer region and be used for defect inspection in metal-line layers in integrated circuits. Moreover, this effect provides a contactless sheet resistivity measurement method for metallic materials, including doped semiconductors, where the dopant concentration could be measured without the need for the measurement device to come into contact with the probes.
To simplify the real MFM system, the cantilever of the device is modeled as a spring with spring constant , quality factor , and mass . Although the real magnetic dipole moment distributed on the MFM tip surface can be modeled as a monopole and a dipole moment located at the tip,Kong and Chou (1997, 1998); Lohau et al. (1999) we assume in this work a single magnetic dipole moment in the direction located at the tip end, as is often adopted as a simple model of an MFM tip.Kong and Chou (1998) Figure 1 shows a schematic of the system. The equation of motion of the point mass is
[TABLE]
where is the position of the fixed end of the spring, is the dissipation constant of the system, and is the force in the direction. The positions and are the equilibrium positions of the point mass and the fixed end, respectively.
The force originates from the motion of the magnetic moment and is obtained as follows within the quasi-static approximation. The magnetic flux density at a circle of radius in the – plane is
[TABLE]
(SI units will be used throughout, but it should be noted that the unit of magnetic moment adopted here is Wbm, rather than Am2.) The magnetic flux in a circle of radius is therefore
[TABLE]
If the magnetic moment moves with velocity in the direction, then the induced electromotive force, , causes an eddy current in the metal thin film (which is located in the – plane) such that
[TABLE]
where is the sheet resistivity of the metal thin film. Interaction between eddy currents at different radii is ignored in the present work. The eddy current at radius generates a magnetic field in the direction at given by
[TABLE]
The total magnetic field in the direction at is then
[TABLE]
The force in Eq. (1) is therefore
[TABLE]
This equation shows that the direction of the force from the eddy current is opposite to that of the velocity , as expected, which leads to additional dissipation and therefore a reduction in the quality factor, as discussed later.
Using Eqs. (1) and (7), the equation of motion for the oscillating MFM tip above the metal thin film is
[TABLE]
The excitation of the system is assumed to be
[TABLE]
where the positive constant is the amplitude of the exciting oscillation, and and are its angular frequency and time, respectively. In the remainder of this paper, because of the presence of a nonlinear term in Eq. (8), we adopt the small-amplitude approximation and ignore the higher harmonics. With these approximations, we can find a solution of Eq. (8) in the form
[TABLE]
where the positive constant is the amplitude of oscillation of the point mass and is the phase shift relative to the exciting oscillation. The amplitude and phase shift can be expressed as
[TABLE]
[TABLE]
where and is the step function. The modified quality factor in Eqs. (11) and (12) is defined by
[TABLE]
which, owing to the additional dissipation, is smaller than the original quality factor defined by
[TABLE]
Using Eq. (12), the phase shift at the resonance frequency can be calculated as
[TABLE]
where the characteristic tip height is defined by
[TABLE]
The phase shift above an insulator (or when the tip is far from the metal surface) is
[TABLE]
The phase difference between above the metal and above an insulator is therefore
[TABLE]
where the approximation is used. Equation (18) represents an additional phase delay due to the eddy current in the metal.
Figure 2 shows experimental results using a 25-nm-thick Au thin film with 1.5-m gap deposited on a Si substrate with 800-nm-thick SiO2.
The MFM data were recorded along a 5-m-long line across the 1.5-m gap. The additional phase delay due to the presence of the nonmagnetic metal thin film can clearly be seen. The observed phase difference is plotted as a function of in Fig. 3.
The experimentally observed phase differences are quite well fitted using Eq. (18) with nm, which means that the theory presented above provides a good description of the system of MFM measurement of a nonmagnetic metal thin film. We can thus determine the characteristic tip height defined in Eq. (16) by fitting the experimental data with Eq. (18). Thus, we can determine the equivalent magnetic moment of the MFM tip, , if we already know the sheet resistivity of the metal, , or we can determine if we have already calibrated . The phase difference between above the metal and above an insulater was not observed when a tip for normal atomic force microscopy without magnetic moment was used with similar frequency, dimensions and probe height, which means that the observed phase difference originated from the magnetic moment on the tip.
The phase difference between above the metal and above an insulator depends on the oscillation frequency , although this is fixed at in Eqs. (15), (17), and (18). The dependence of the phase shift can be written as
[TABLE]
with Eq. (12). If we define
[TABLE]
then becomes small when the tip height becomes large or when the resistivity becomes large. This means that
[TABLE]
provides the sensitivity of the phase difference as a function of frequency in the case of large tip height and/or a high-resistivity metal thin film. The sensitivity is shown in Fig. 4 for , , and .
As can be seen, the maximum sensitivity is achieved at
[TABLE]
where terms of higher order in are ignored, while the sensitivity becomes zero at . At these optimum frequencies, , the amplitude of oscillation becomes from the maximum, which provides a method for finding the optimum frequencies experimentally. The maximum phase difference is calculated as
[TABLE]
which is a factor of larger than from Eq. (18). It is noteworthy that the phase difference changes sign when the frequency changes across .
The spatial resolution achieved when detecting a metal thin film using the phase shift of the MFM tip oscillation is determined by the distribution of the eddy current induced by the oscillation. From Eq. (4), the current density at a circle of radius is
[TABLE]
as shown in Fig. 5.
As can be seen, most of the eddy current is distributed within a radius , which means that the detection of metal regions smaller than the tip height is difficult; in other words, the spatial resolution is roughly limited by the tip height.
Although phase shifts at a fixed frequency of oscillation have been discussed so far, the force from the eddy current induced by tip oscillation also changes the resonance frequency through additional dissipation. The resonance frequency for is well known to be . The shift in resonance frequency relative to can be calculated as
[TABLE]
where the approximation
[TABLE]
has been used. Such frequency shifts are often utilized in noncontact atomic force microscopy with atomic resolution,Ueyama et al. (1995); Katsube and Abe (2018) which means that resonance-frequency detection might have greater sensitivity than phase-shift detection for experimental detection of nonmagnetic metal.
In summary, theoretical calculations concerning an MFM tip oscillating above a nonmagnetic metal thin film have provided the phase shift due to the force from the eddy current induced by the oscillating tip. The theoretical results are in good agreement with experimental observations obtained by varying the tip height. The sensitivity of the phase shift has been shown to be a function of frequency, which allows determination of the best frequency for phase-shift measurement. The shift in resonance frequency due to eddy currents has also been discussed.
This work was supported by JSPS KAKENHI Grant No. 18K04937.
The reference list from the paper itself. Each links out to its DOI / PubMed record.
- 1Sarid (1994) D. Sarid, Scanning Force Microscopy , revised ed. (Oxford University Press, Oxford, 1994).
- 2Rugar et al. (1990) D. Rugar, H. J. Mamin, P. Guethner, S. E. Lambert, J. E. Stern, I. Mc Fadyen, and T. Yogi, J. Appl. Phys. 68 , 1169 (1990) . · doi ↗
- 3Hartmann (1999) U. Hartmann, Annu. Rev. Mater. Sci. 29 , 53 (1999) . · doi ↗
- 4Tanaka et al. (2007) K. Tanaka, Y. Mori, H. Yamagiwa, S. Abo, F. Wakaya, and M. Takai, Microelectron. Eng. 84 , 1416 (2007) . · doi ↗
- 5Stiller et al. (2017) M. Stiller, J. Barzola-Quiquia, P. D. Esquinazi, S. Sangiao, J. M. De Teresa, J. Meijer, and B. Abel, Meas. Sci. Technol. 28 , 125401 (2017) . · doi ↗
- 6Kong and Chou (1997) L. Kong and S. Y. Chou, Appl. Phys. Lett. 70 , 2043 (1997) . · doi ↗
- 7Kong and Chou (1998) L. Kong and S. Y. Chou, J. Appl. Phys. 81 , 5026 (1998) . · doi ↗
- 8Lohau et al. (1999) J. Lohau, S. Kirsch, A. Carl, G. Dumpich, and E. F. Wassermann, J. Appl. Phys. 86 , 3410 (1999) . · doi ↗