Fermi-LAT Observations of Gamma-Ray Emission Towards the Outer Halo of M31
Chris Karwin, Simona Murgia, Sheldon Campbell, Igor Moskalenko

TL;DR
This study analyzes 7.6 years of Fermi-LAT gamma-ray data to detect and characterize an extended gamma-ray excess around M31's outer halo, exploring its potential origins and the impact of foreground modeling uncertainties.
Contribution
It provides the first detailed analysis of gamma-ray emission in M31's outer halo, revealing an extended excess and highlighting the importance of foreground modeling uncertainties.
Findings
Detected an extended gamma-ray excess up to 120-200 kpc from M31's center.
Identified the excess as distinct from Milky Way foreground emission.
Discussed potential origins and the impact of modeling uncertainties.
Abstract
The Andromeda Galaxy is the closest spiral galaxy to us and has been the subject of numerous studies. It harbors a massive dark matter (DM) halo which may span up to ~600 kpc across and comprises ~90% of the galaxy's total mass. This halo size translates into a large diameter of 42 degrees on the sky for an M31-Milky Way (MW) distance of 785 kpc, but its presumably low surface brightness makes it challenging to detect with gamma-ray telescopes. Using 7.6 years of Fermi Large Area Telescope (Fermi-LAT) observations, we make a detailed study of the gamma-ray emission between 1-100 GeV towards M31's outer halo, with a total field radius of 60 degrees centered at M31, and perform an in-depth analysis of the systematic uncertainties related to the observations. We use the cosmic ray (CR) propagation code GALPROP to construct specialized interstellar emission models (IEMs) to characterize the…
Click any figure to enlarge with its caption.
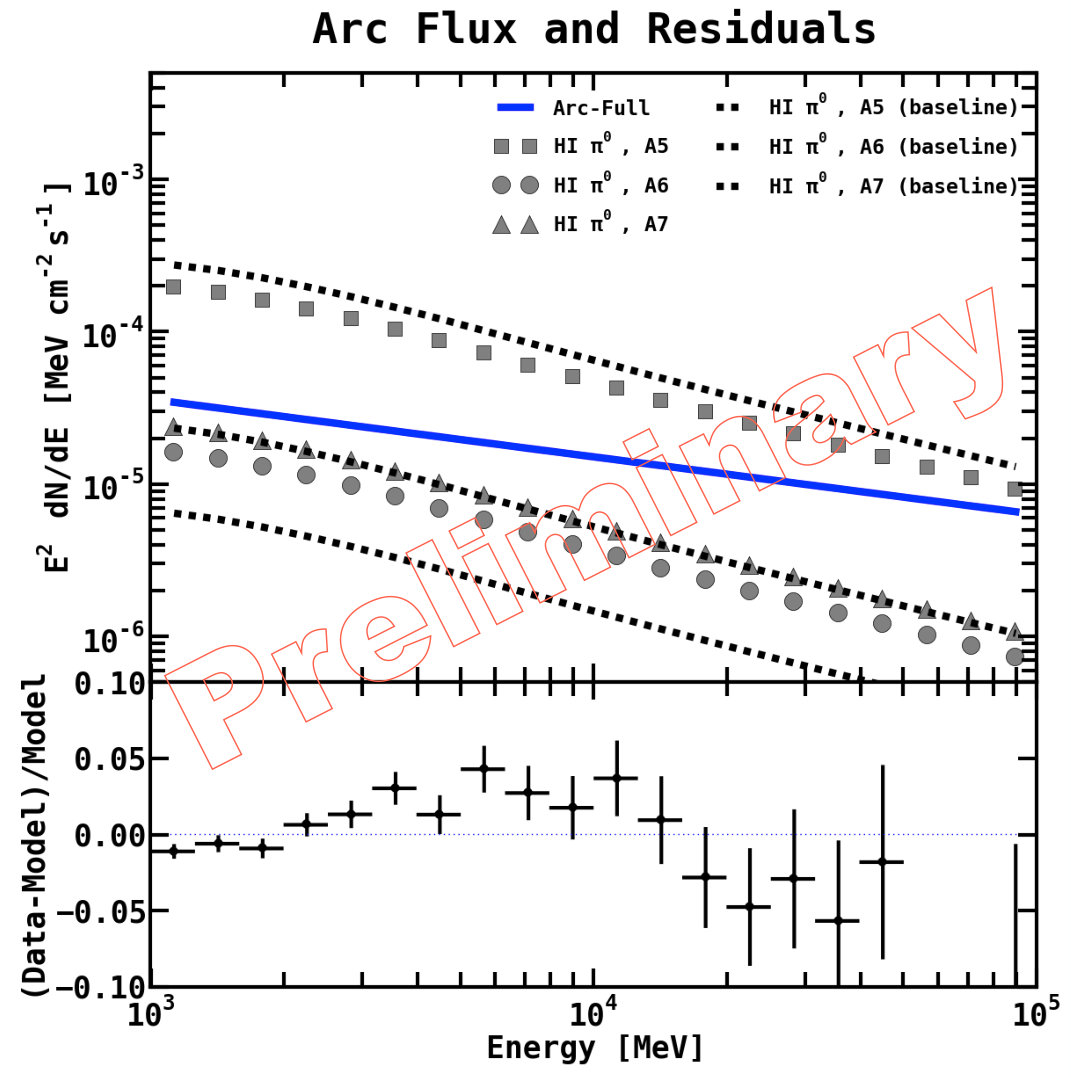 Figure 1
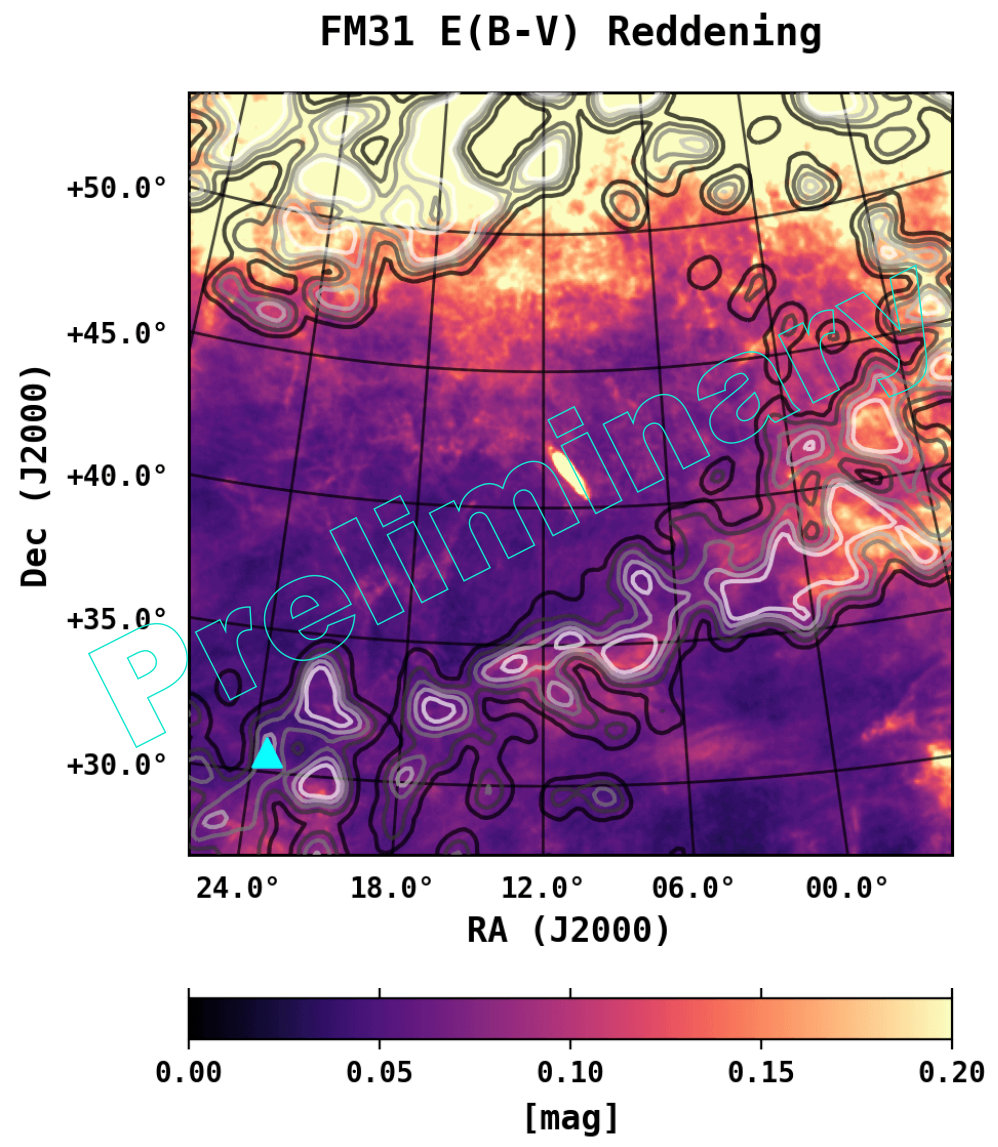 Figure 2
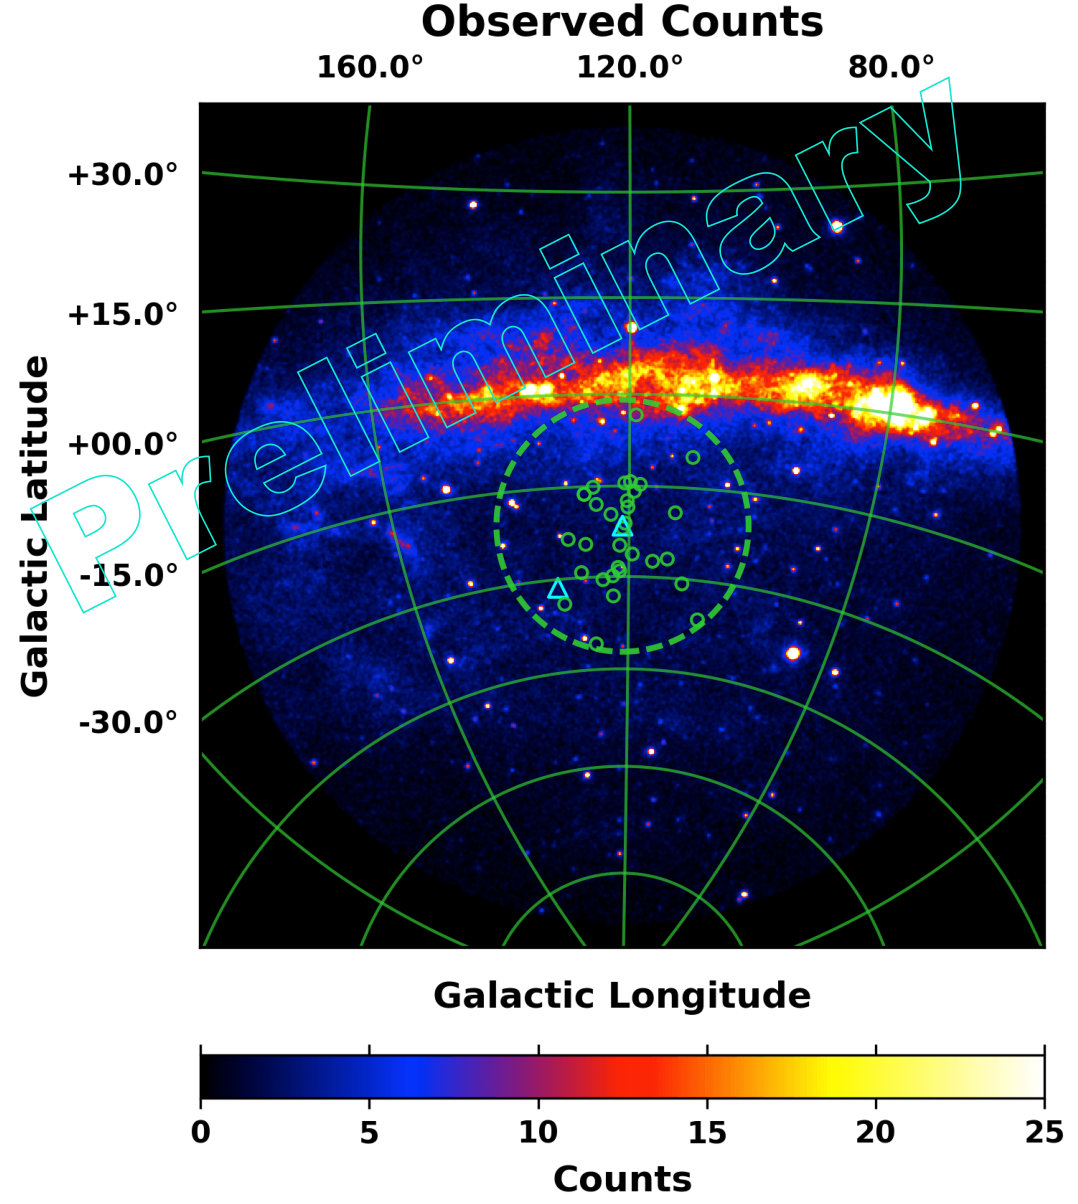 Figure 3
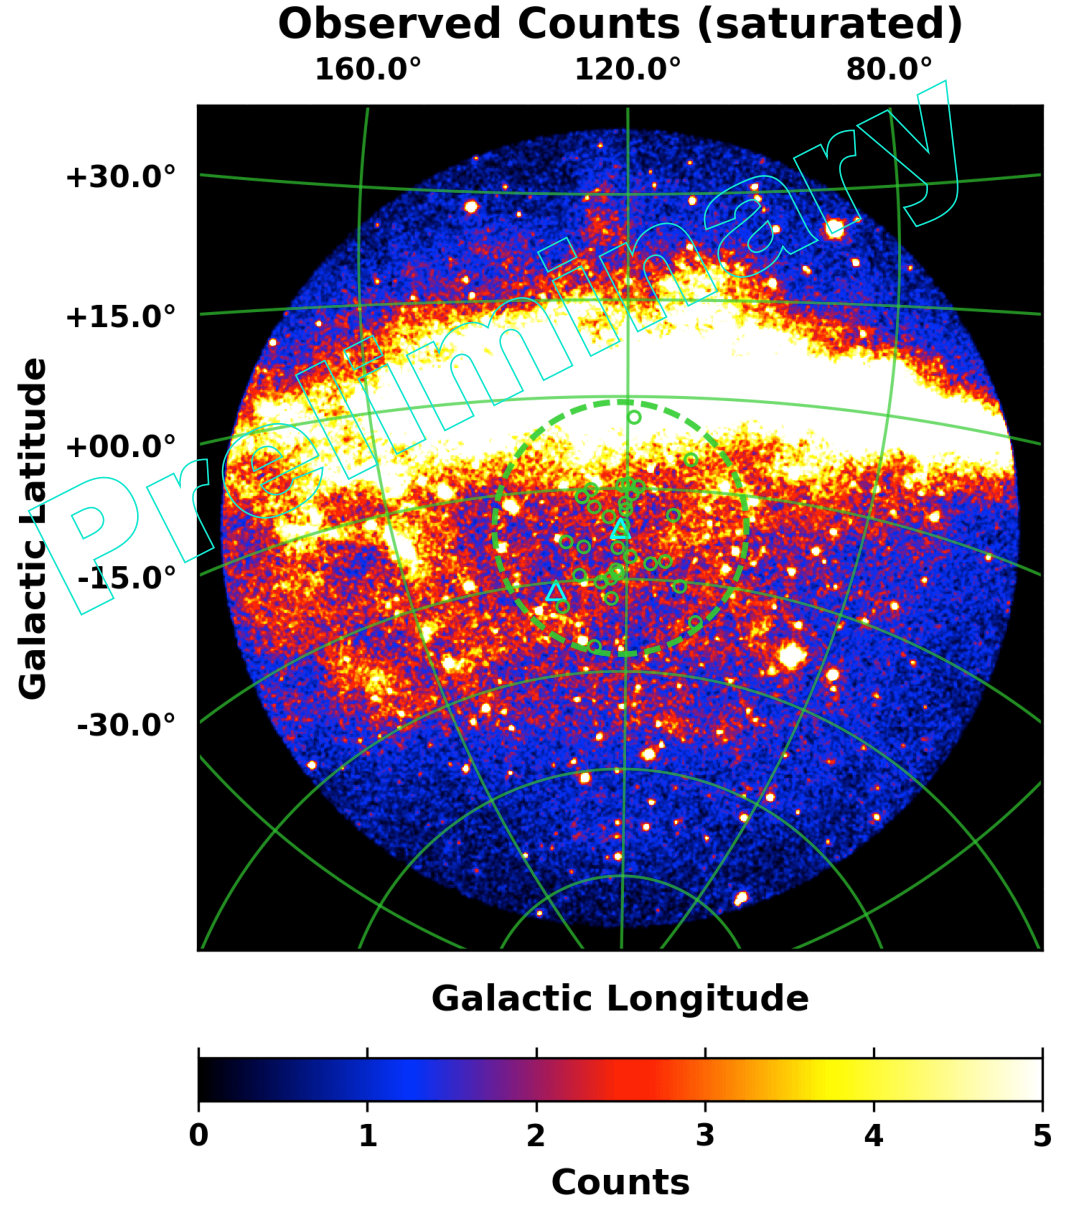 Figure 4
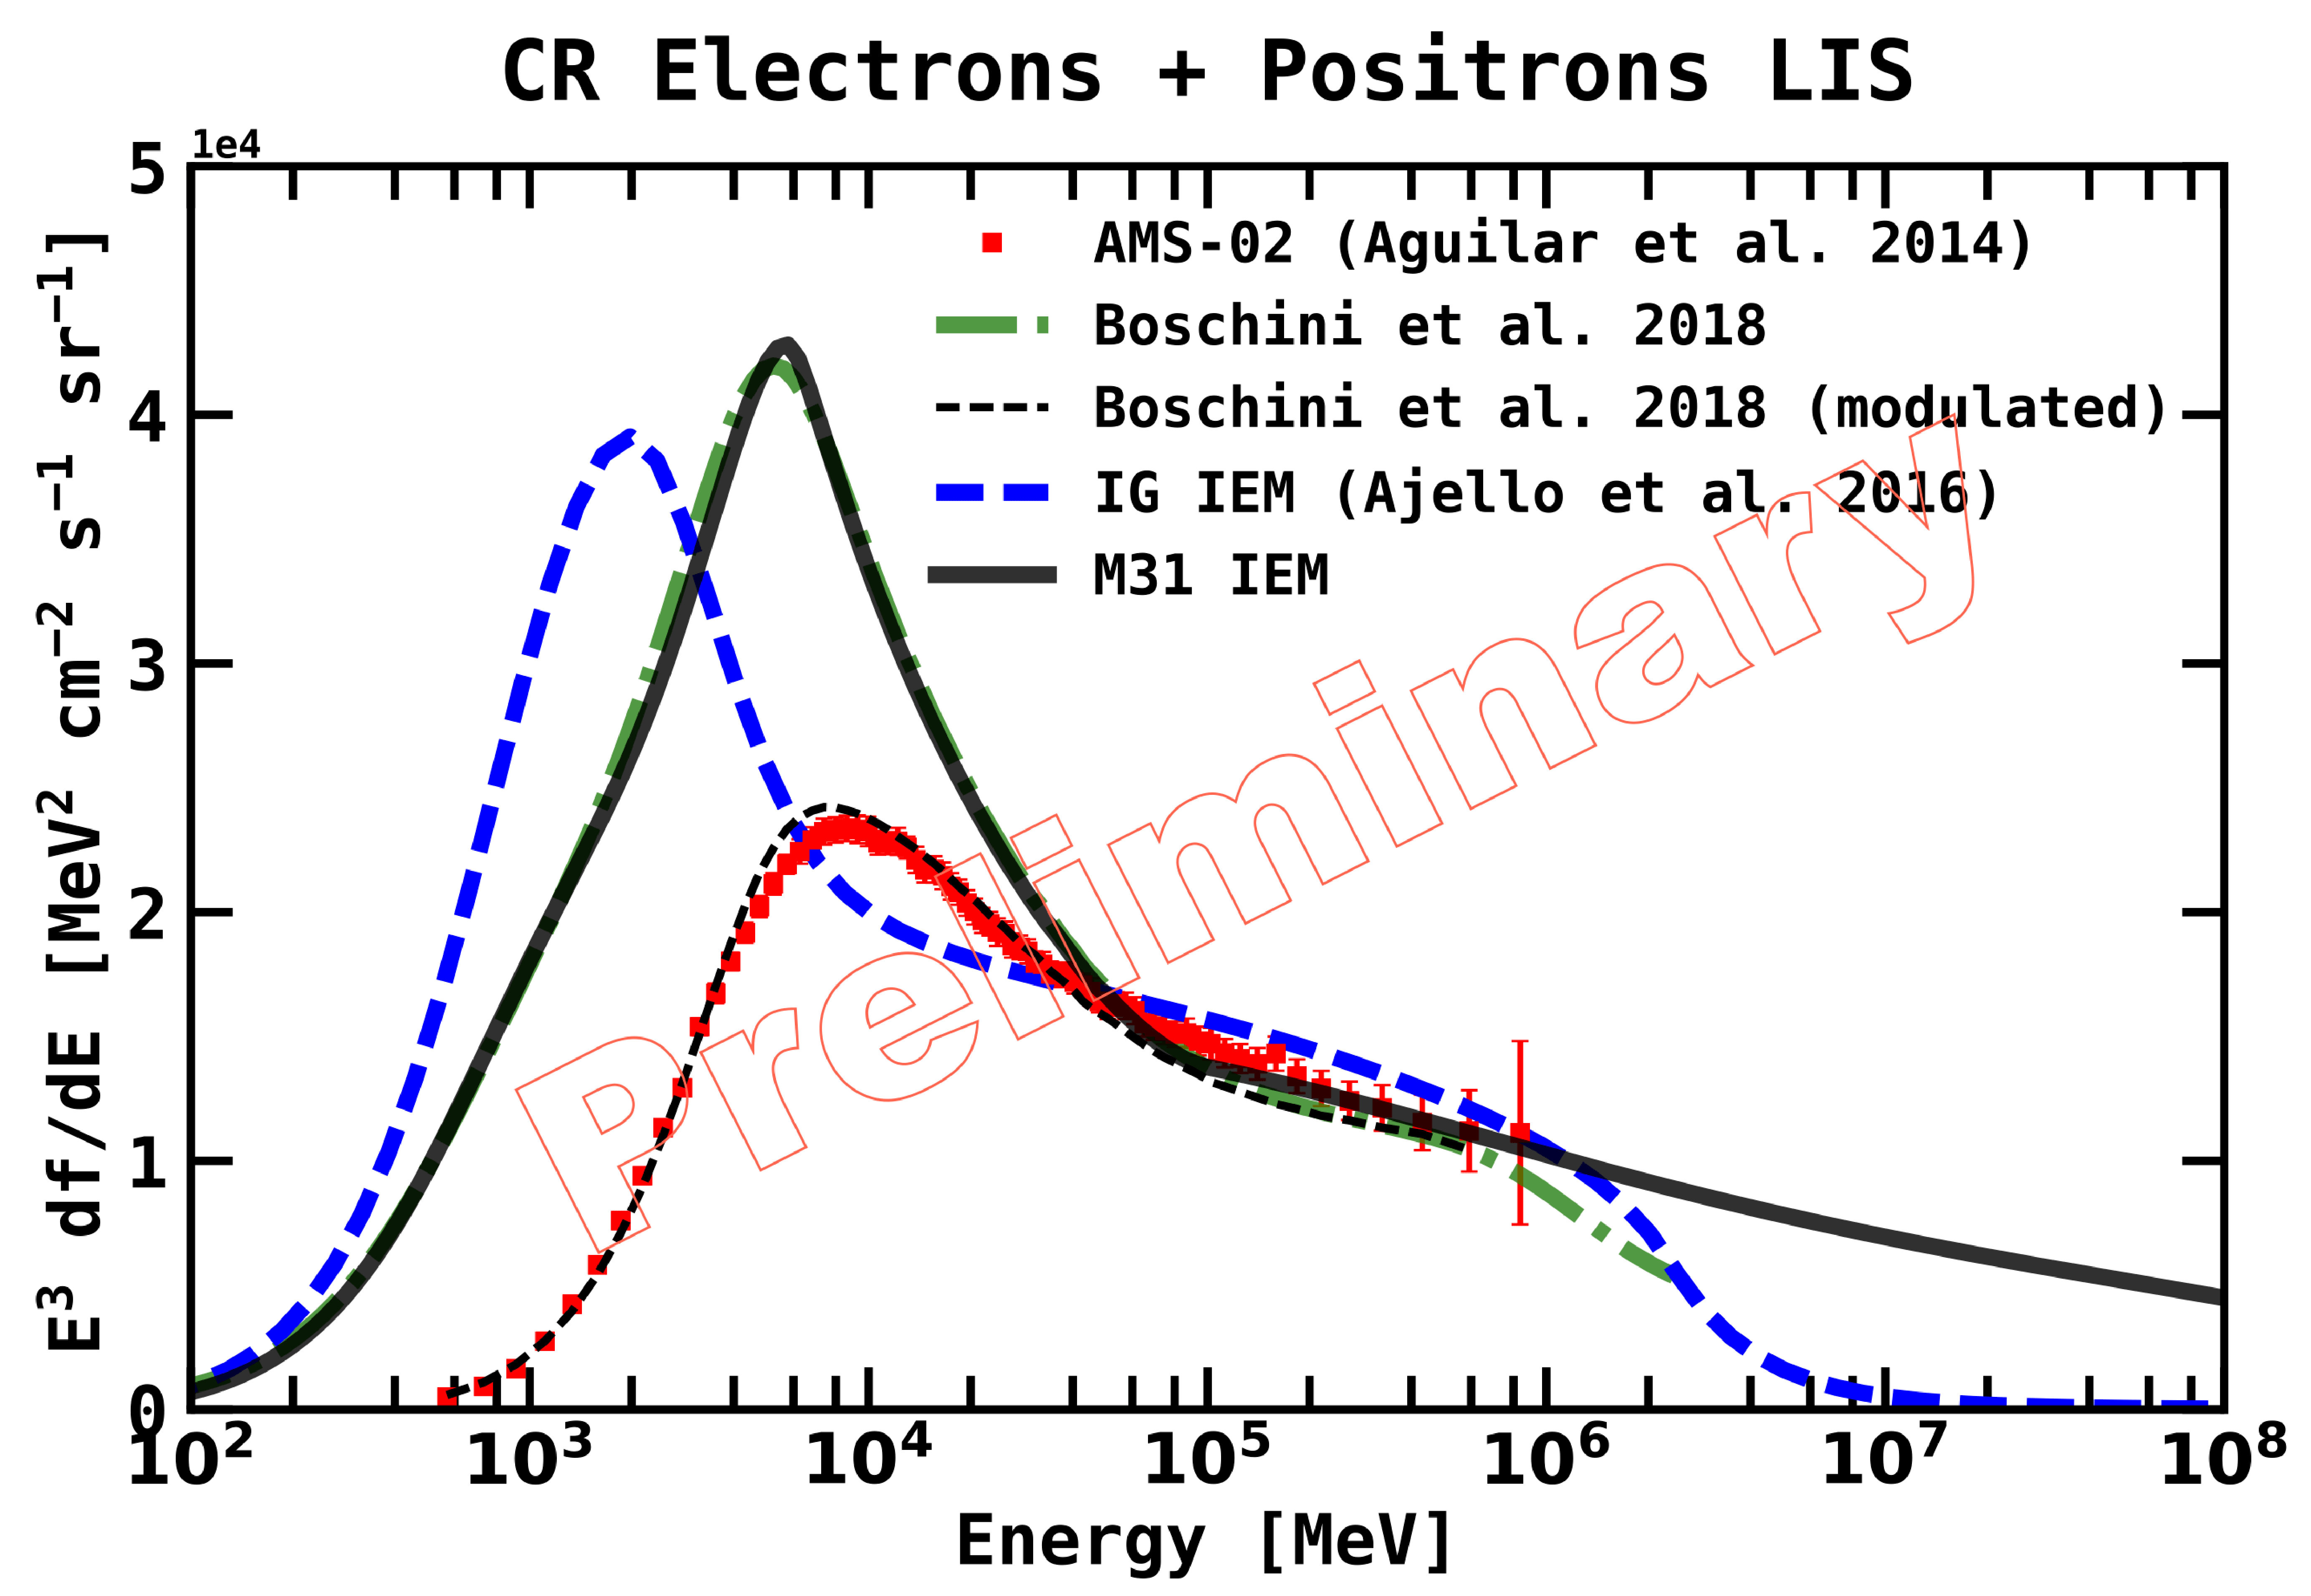 Figure 5
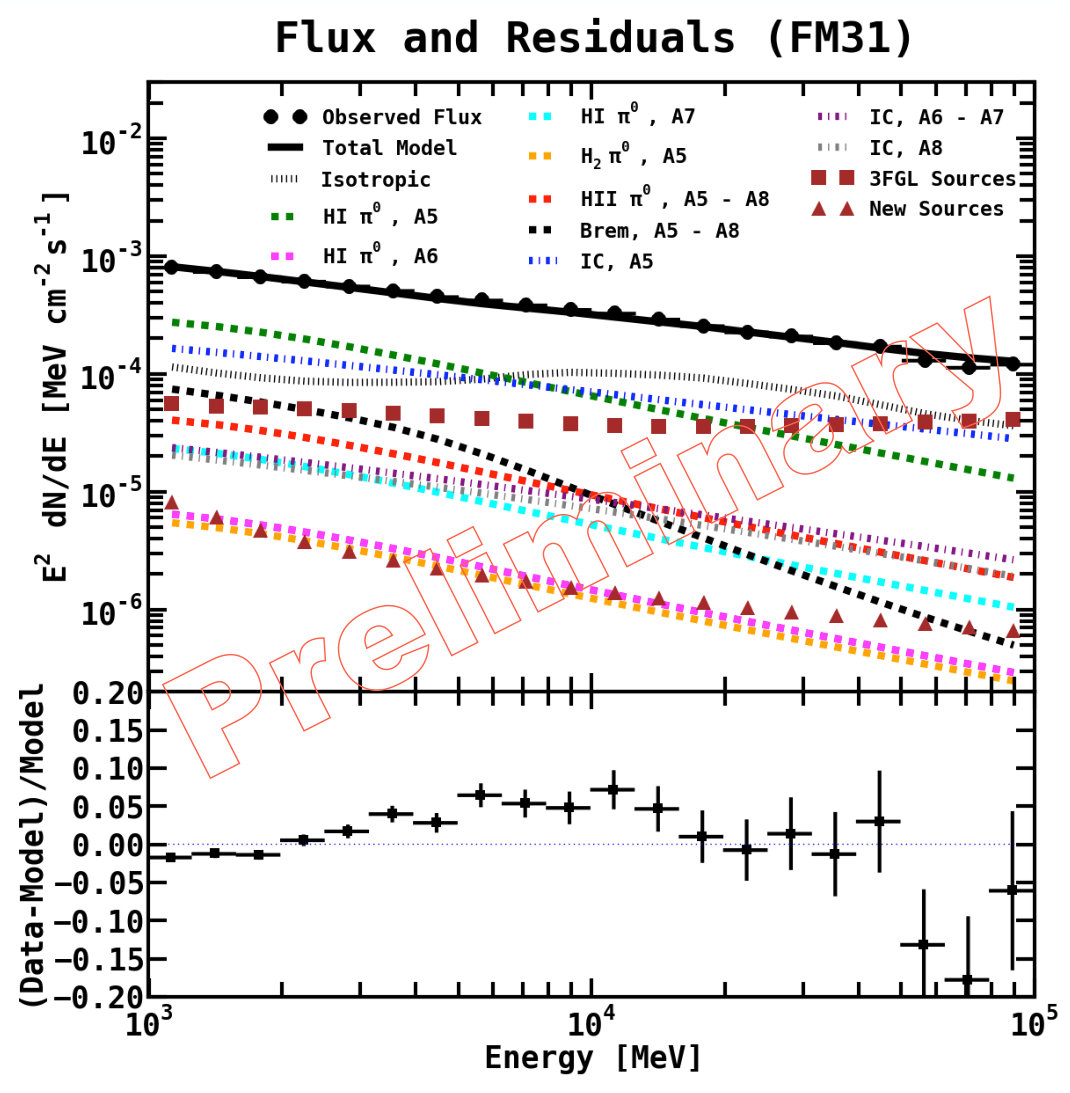 Figure 6
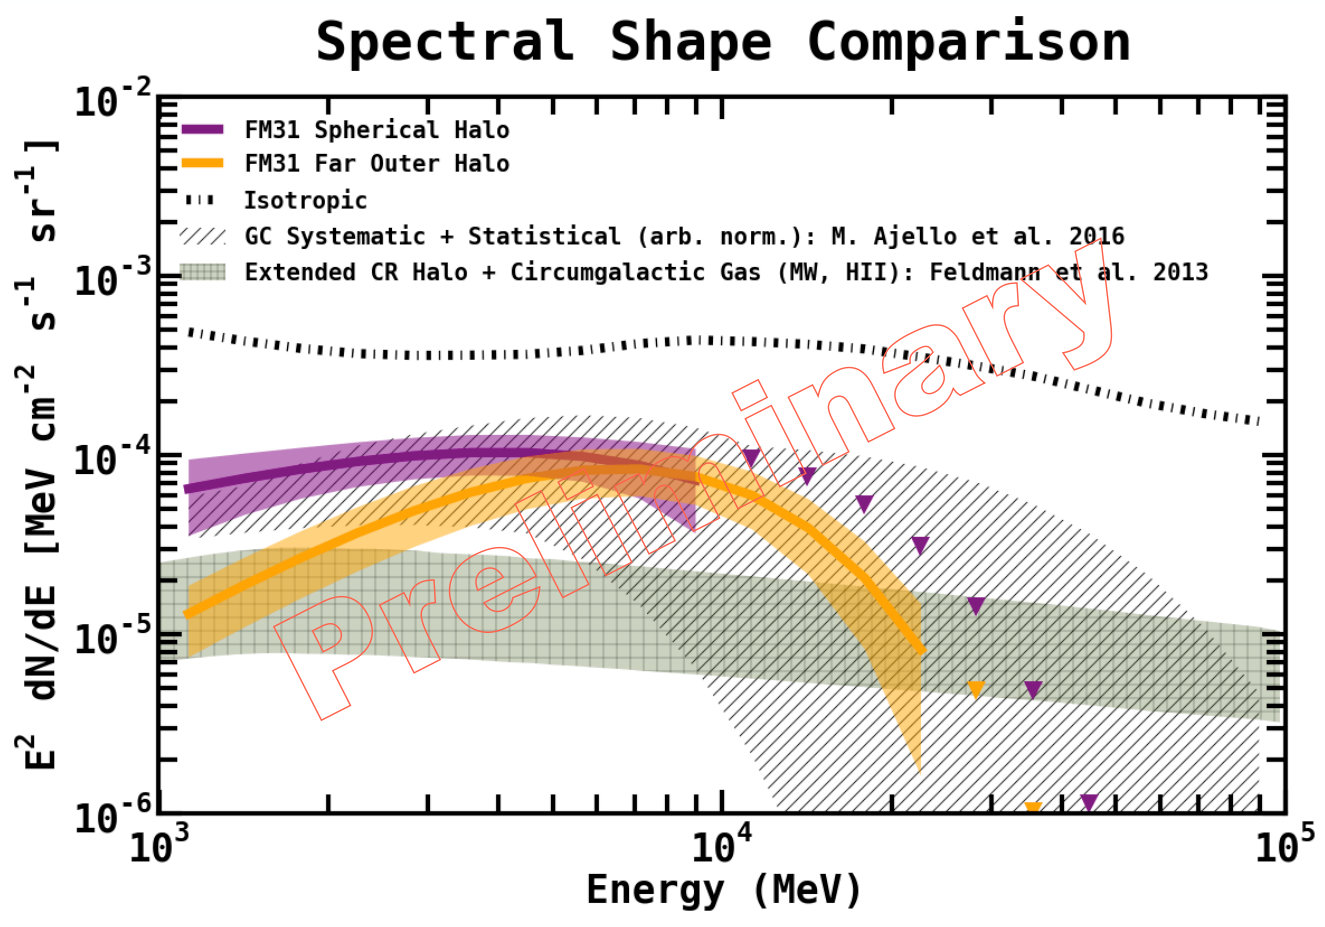 Figure 7
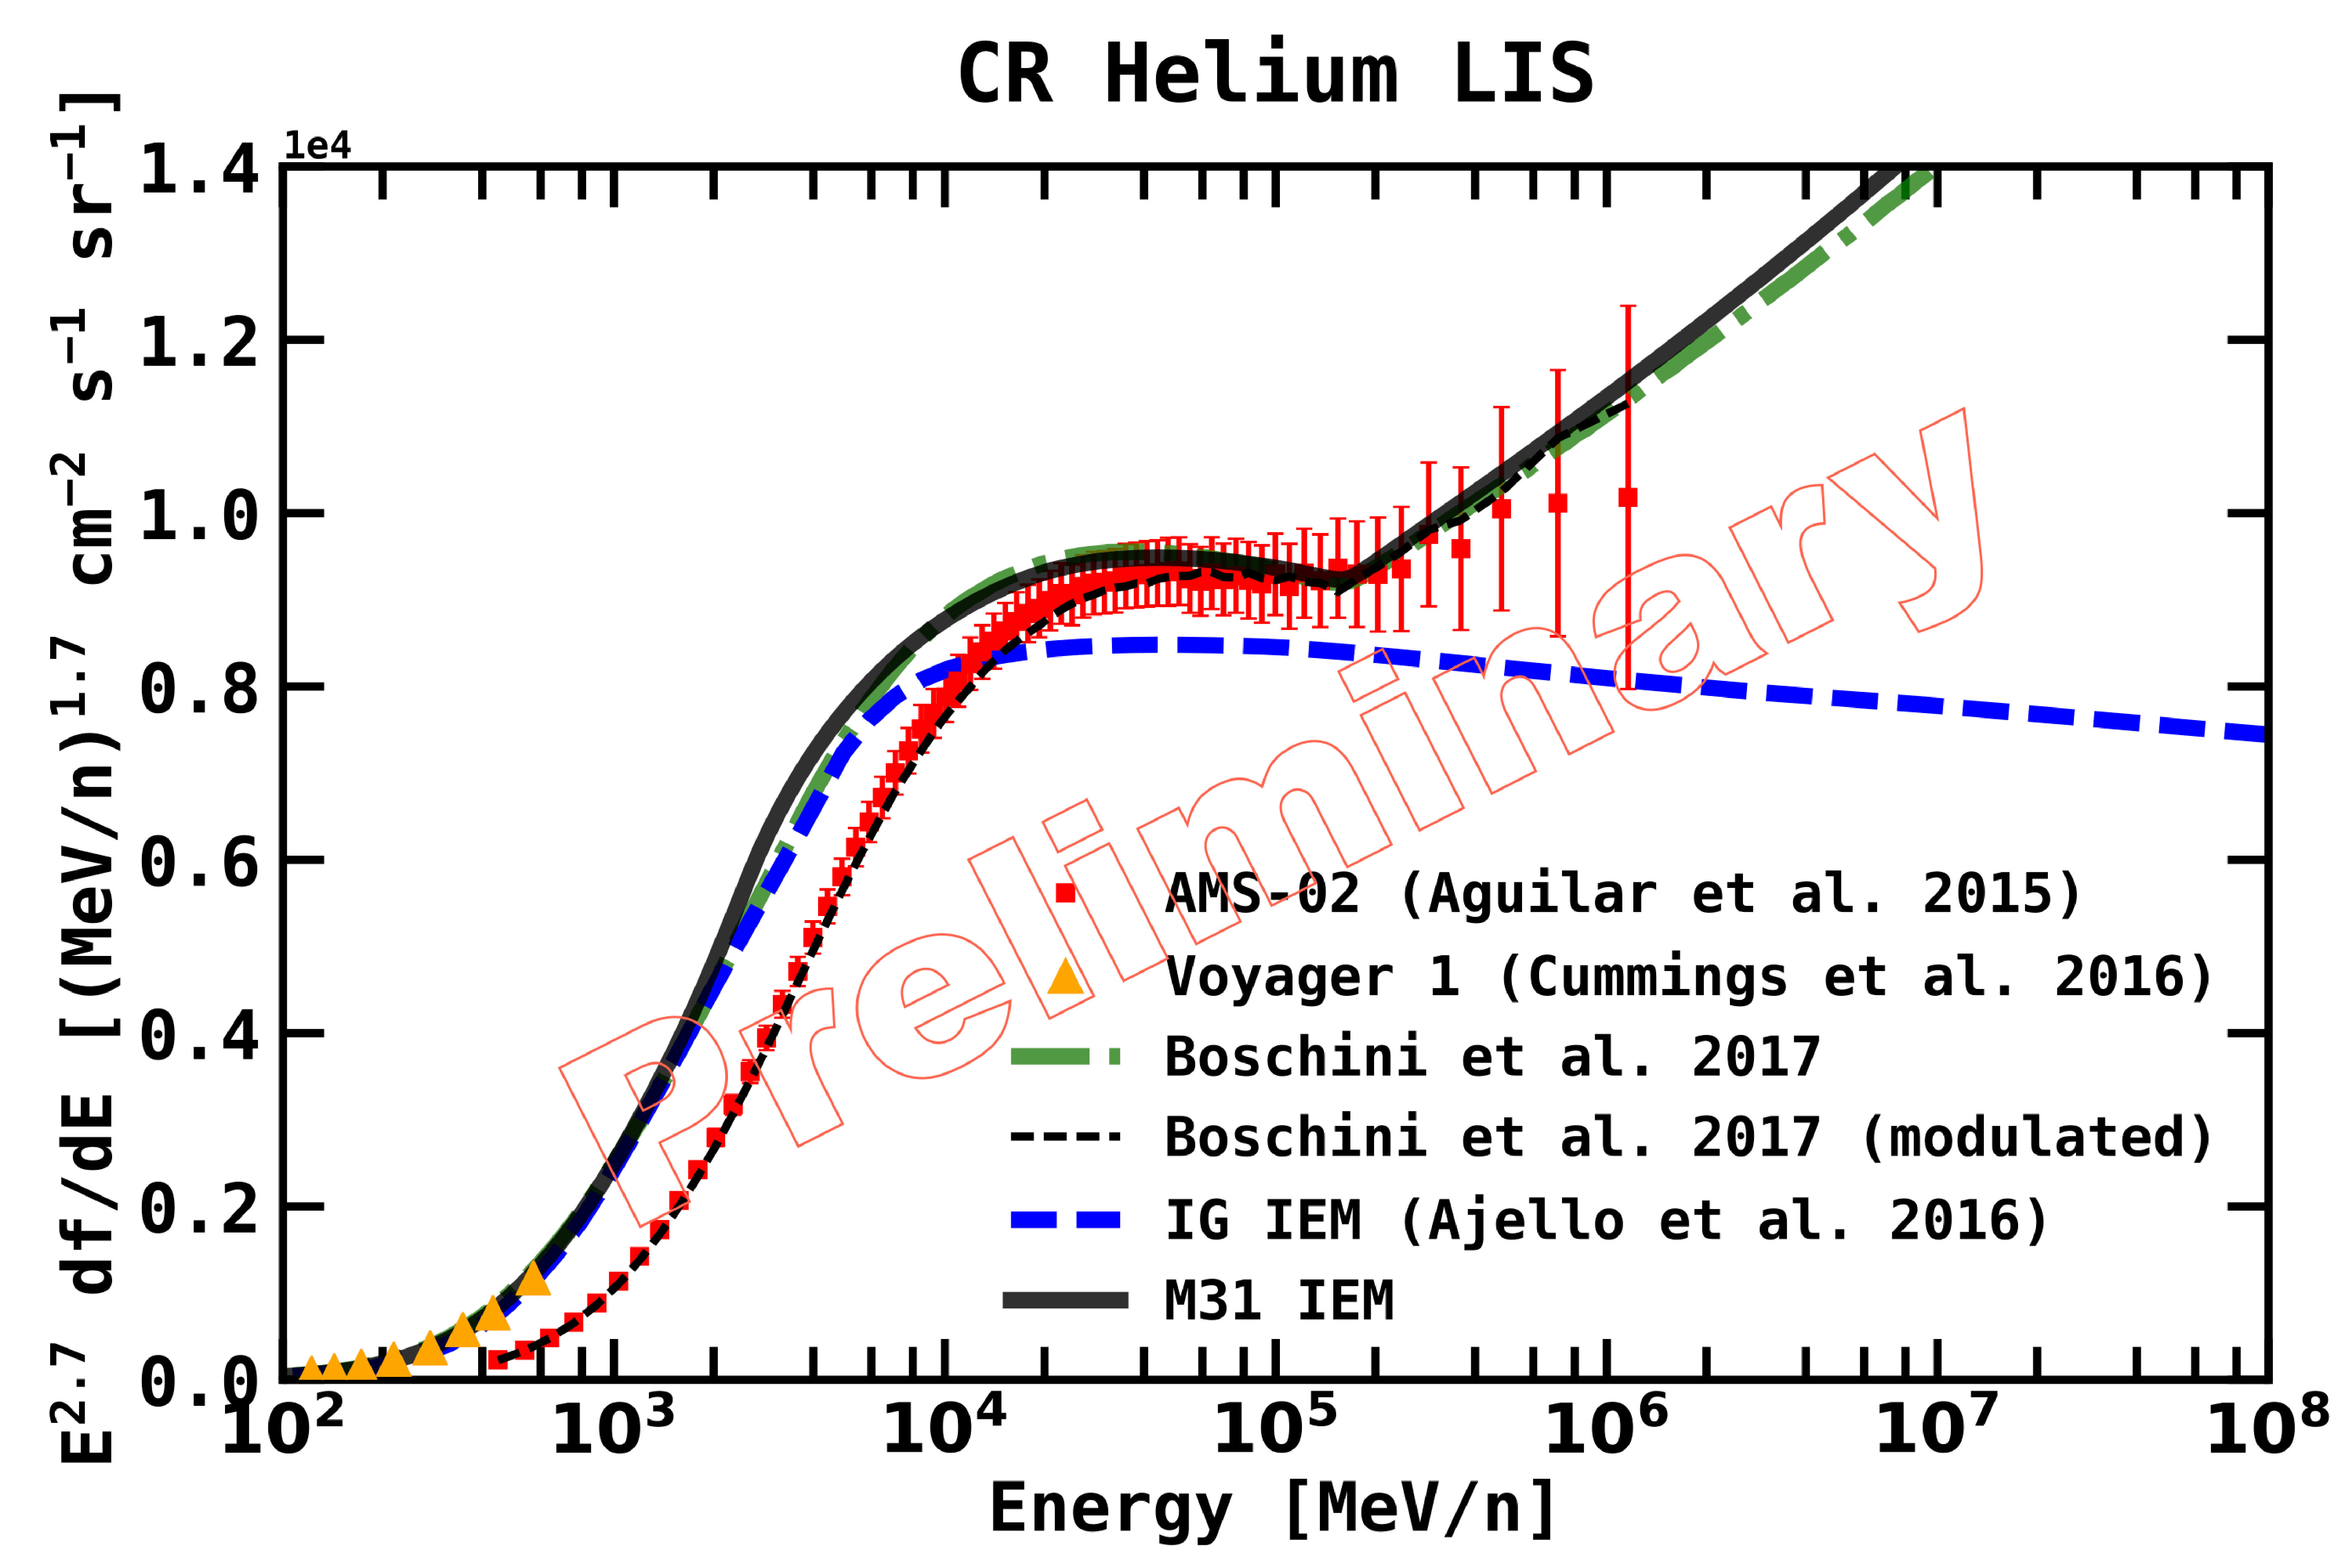 Figure 8
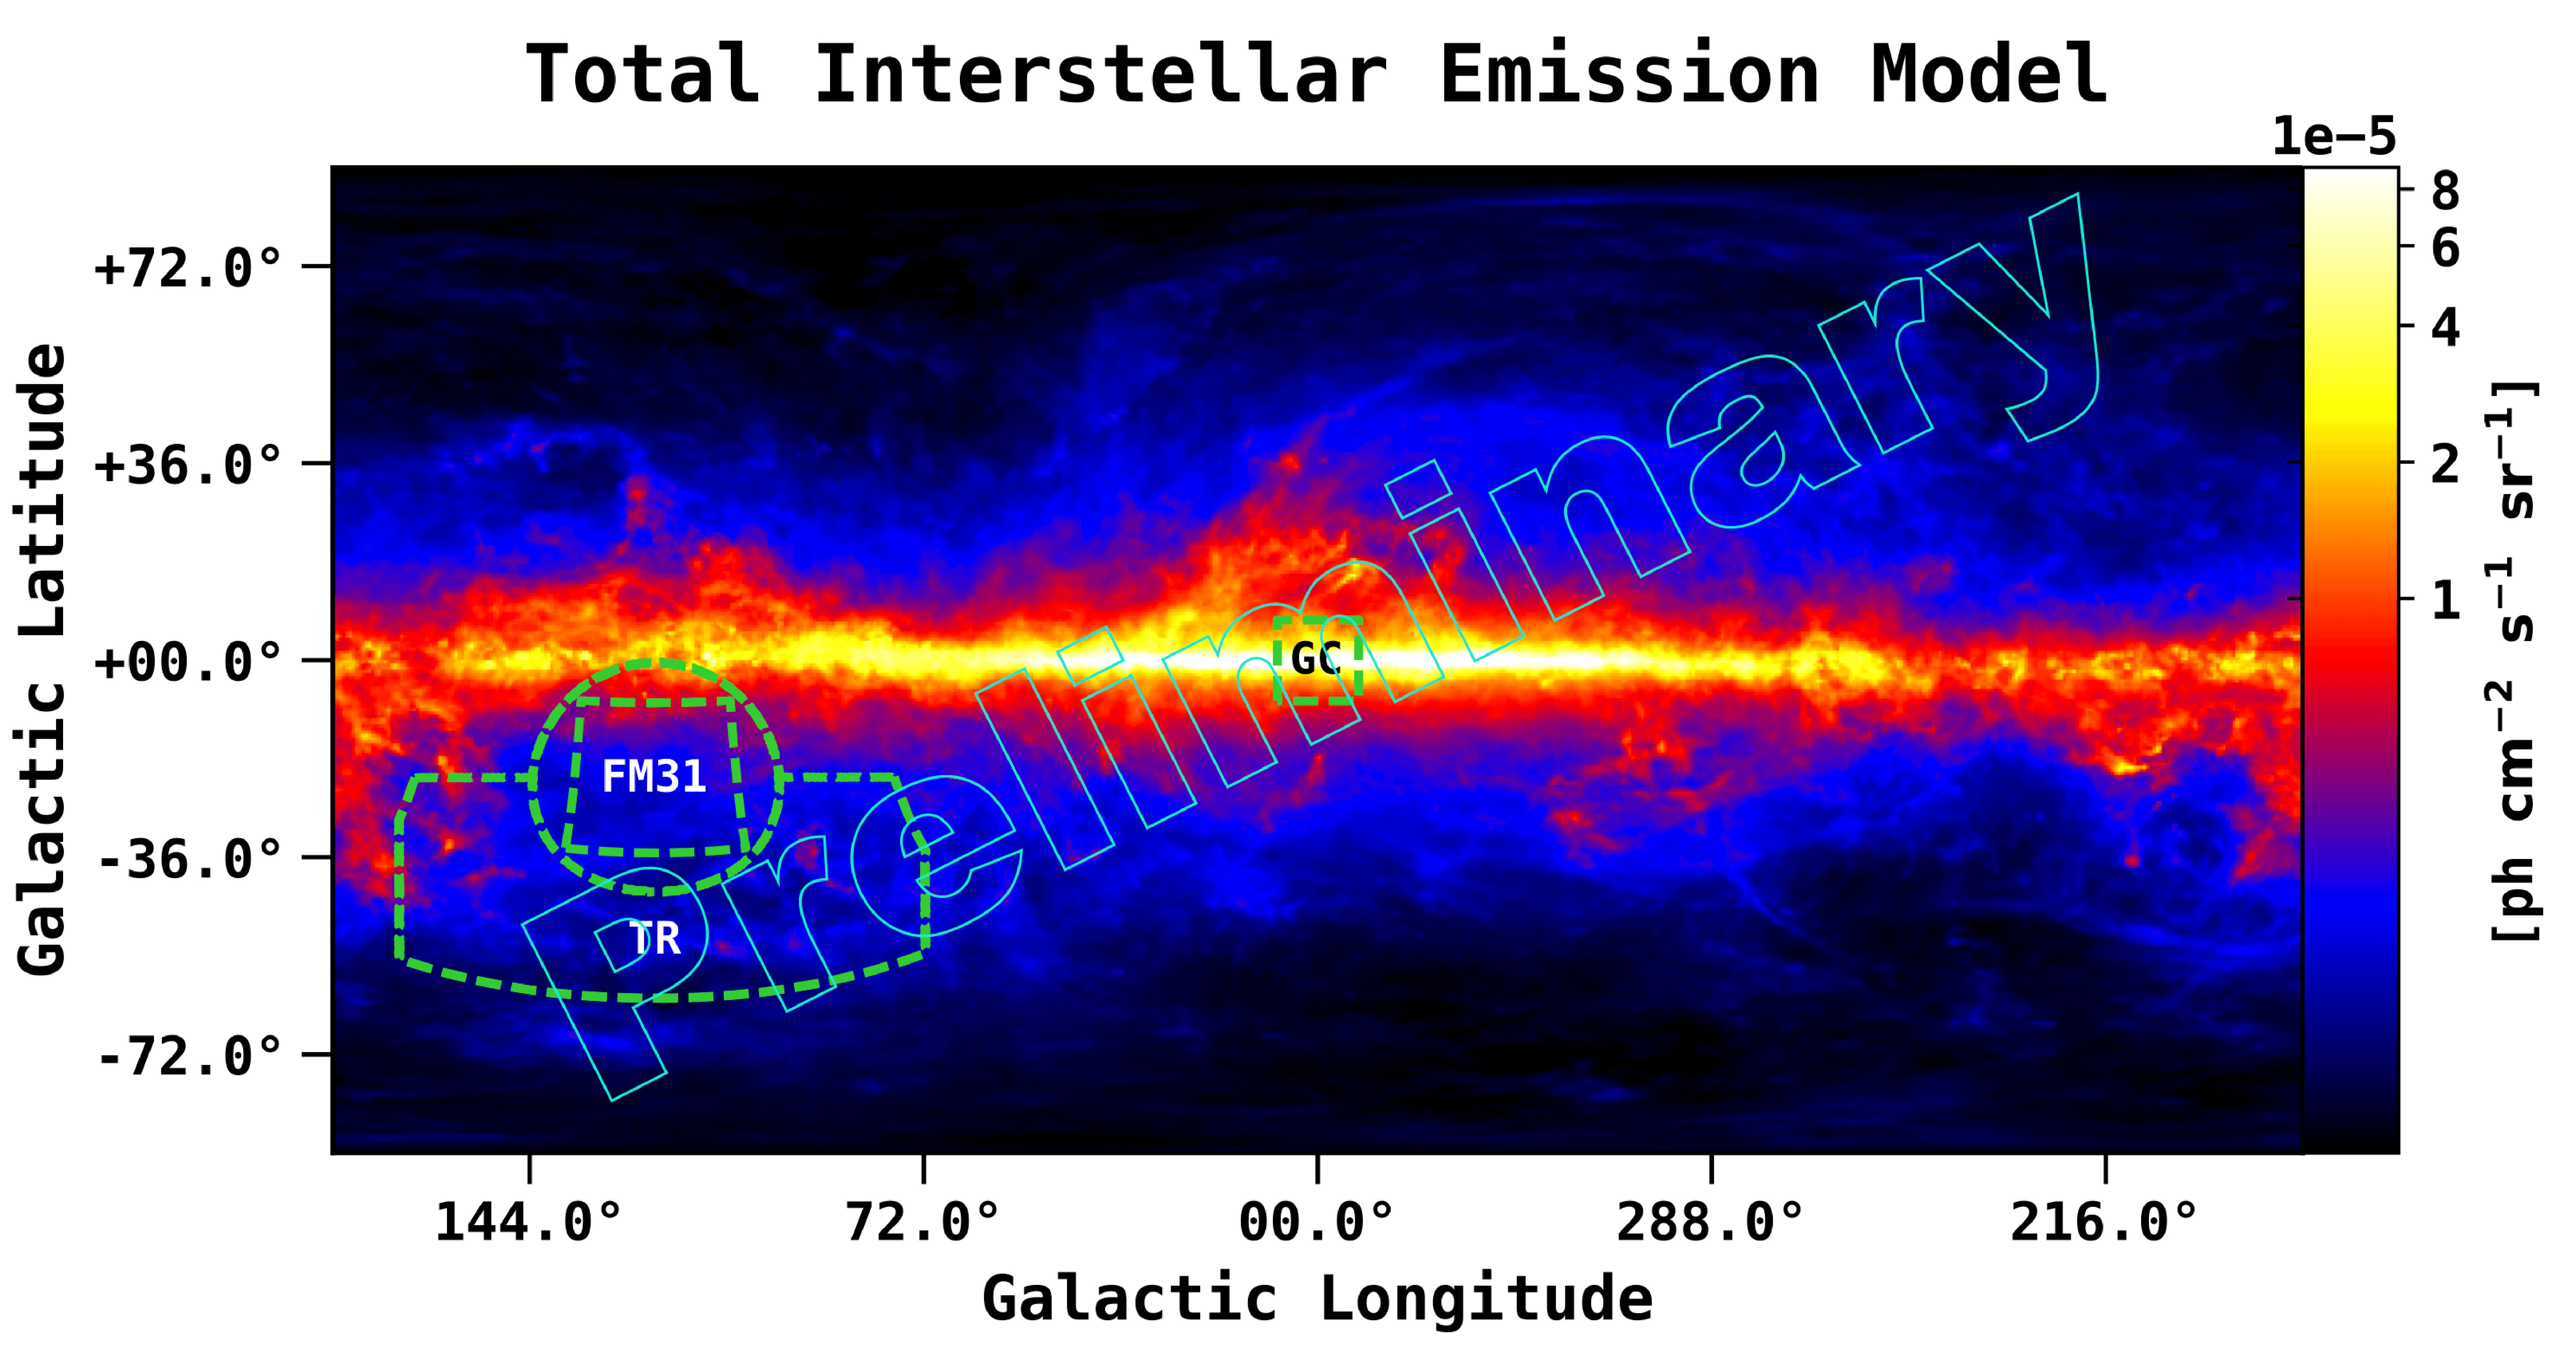 Figure 9
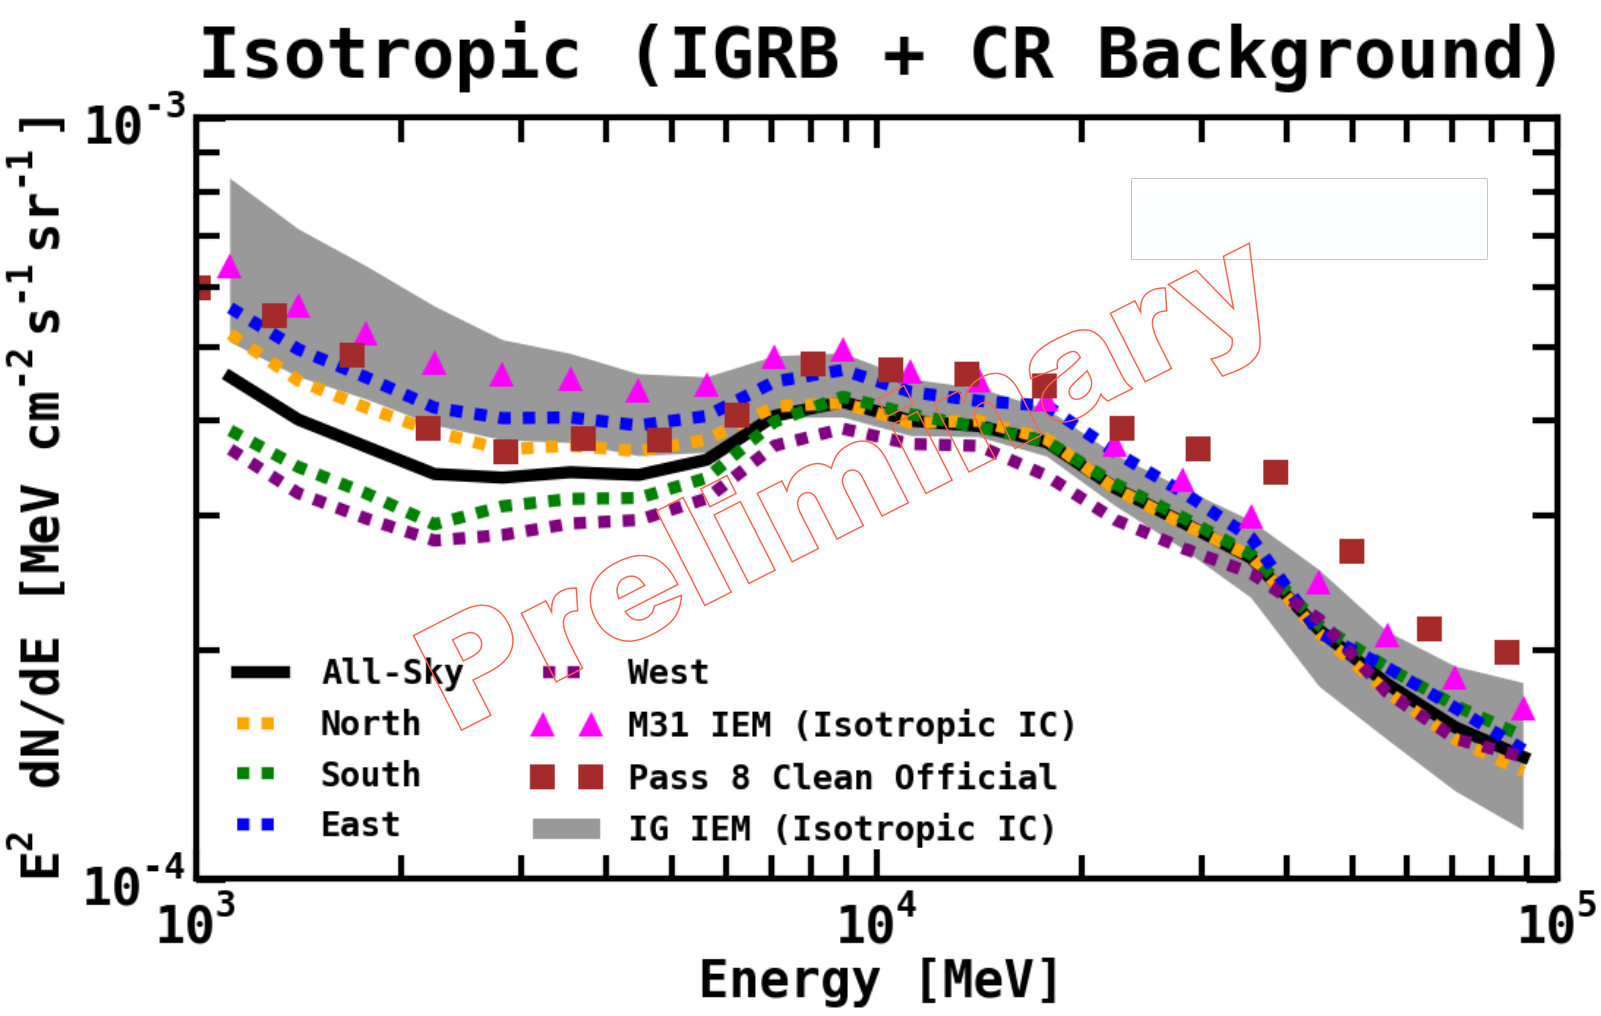 Figure 10
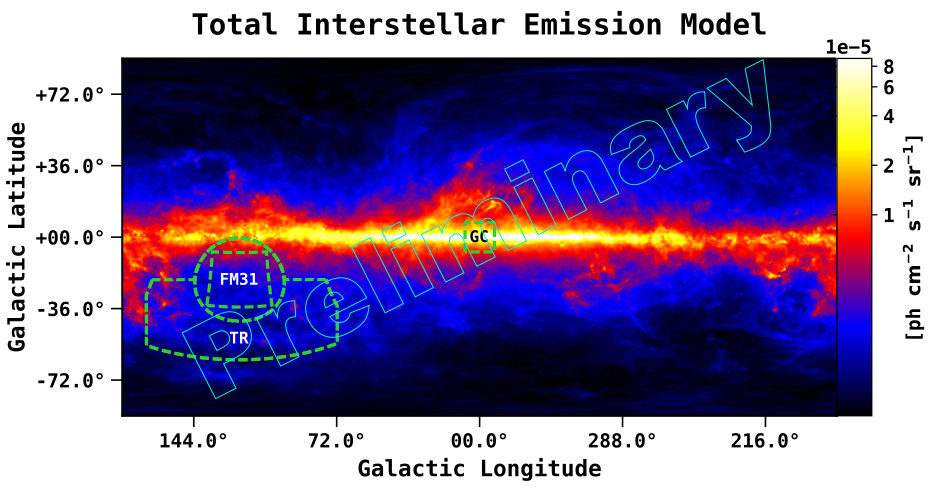 Figure 11
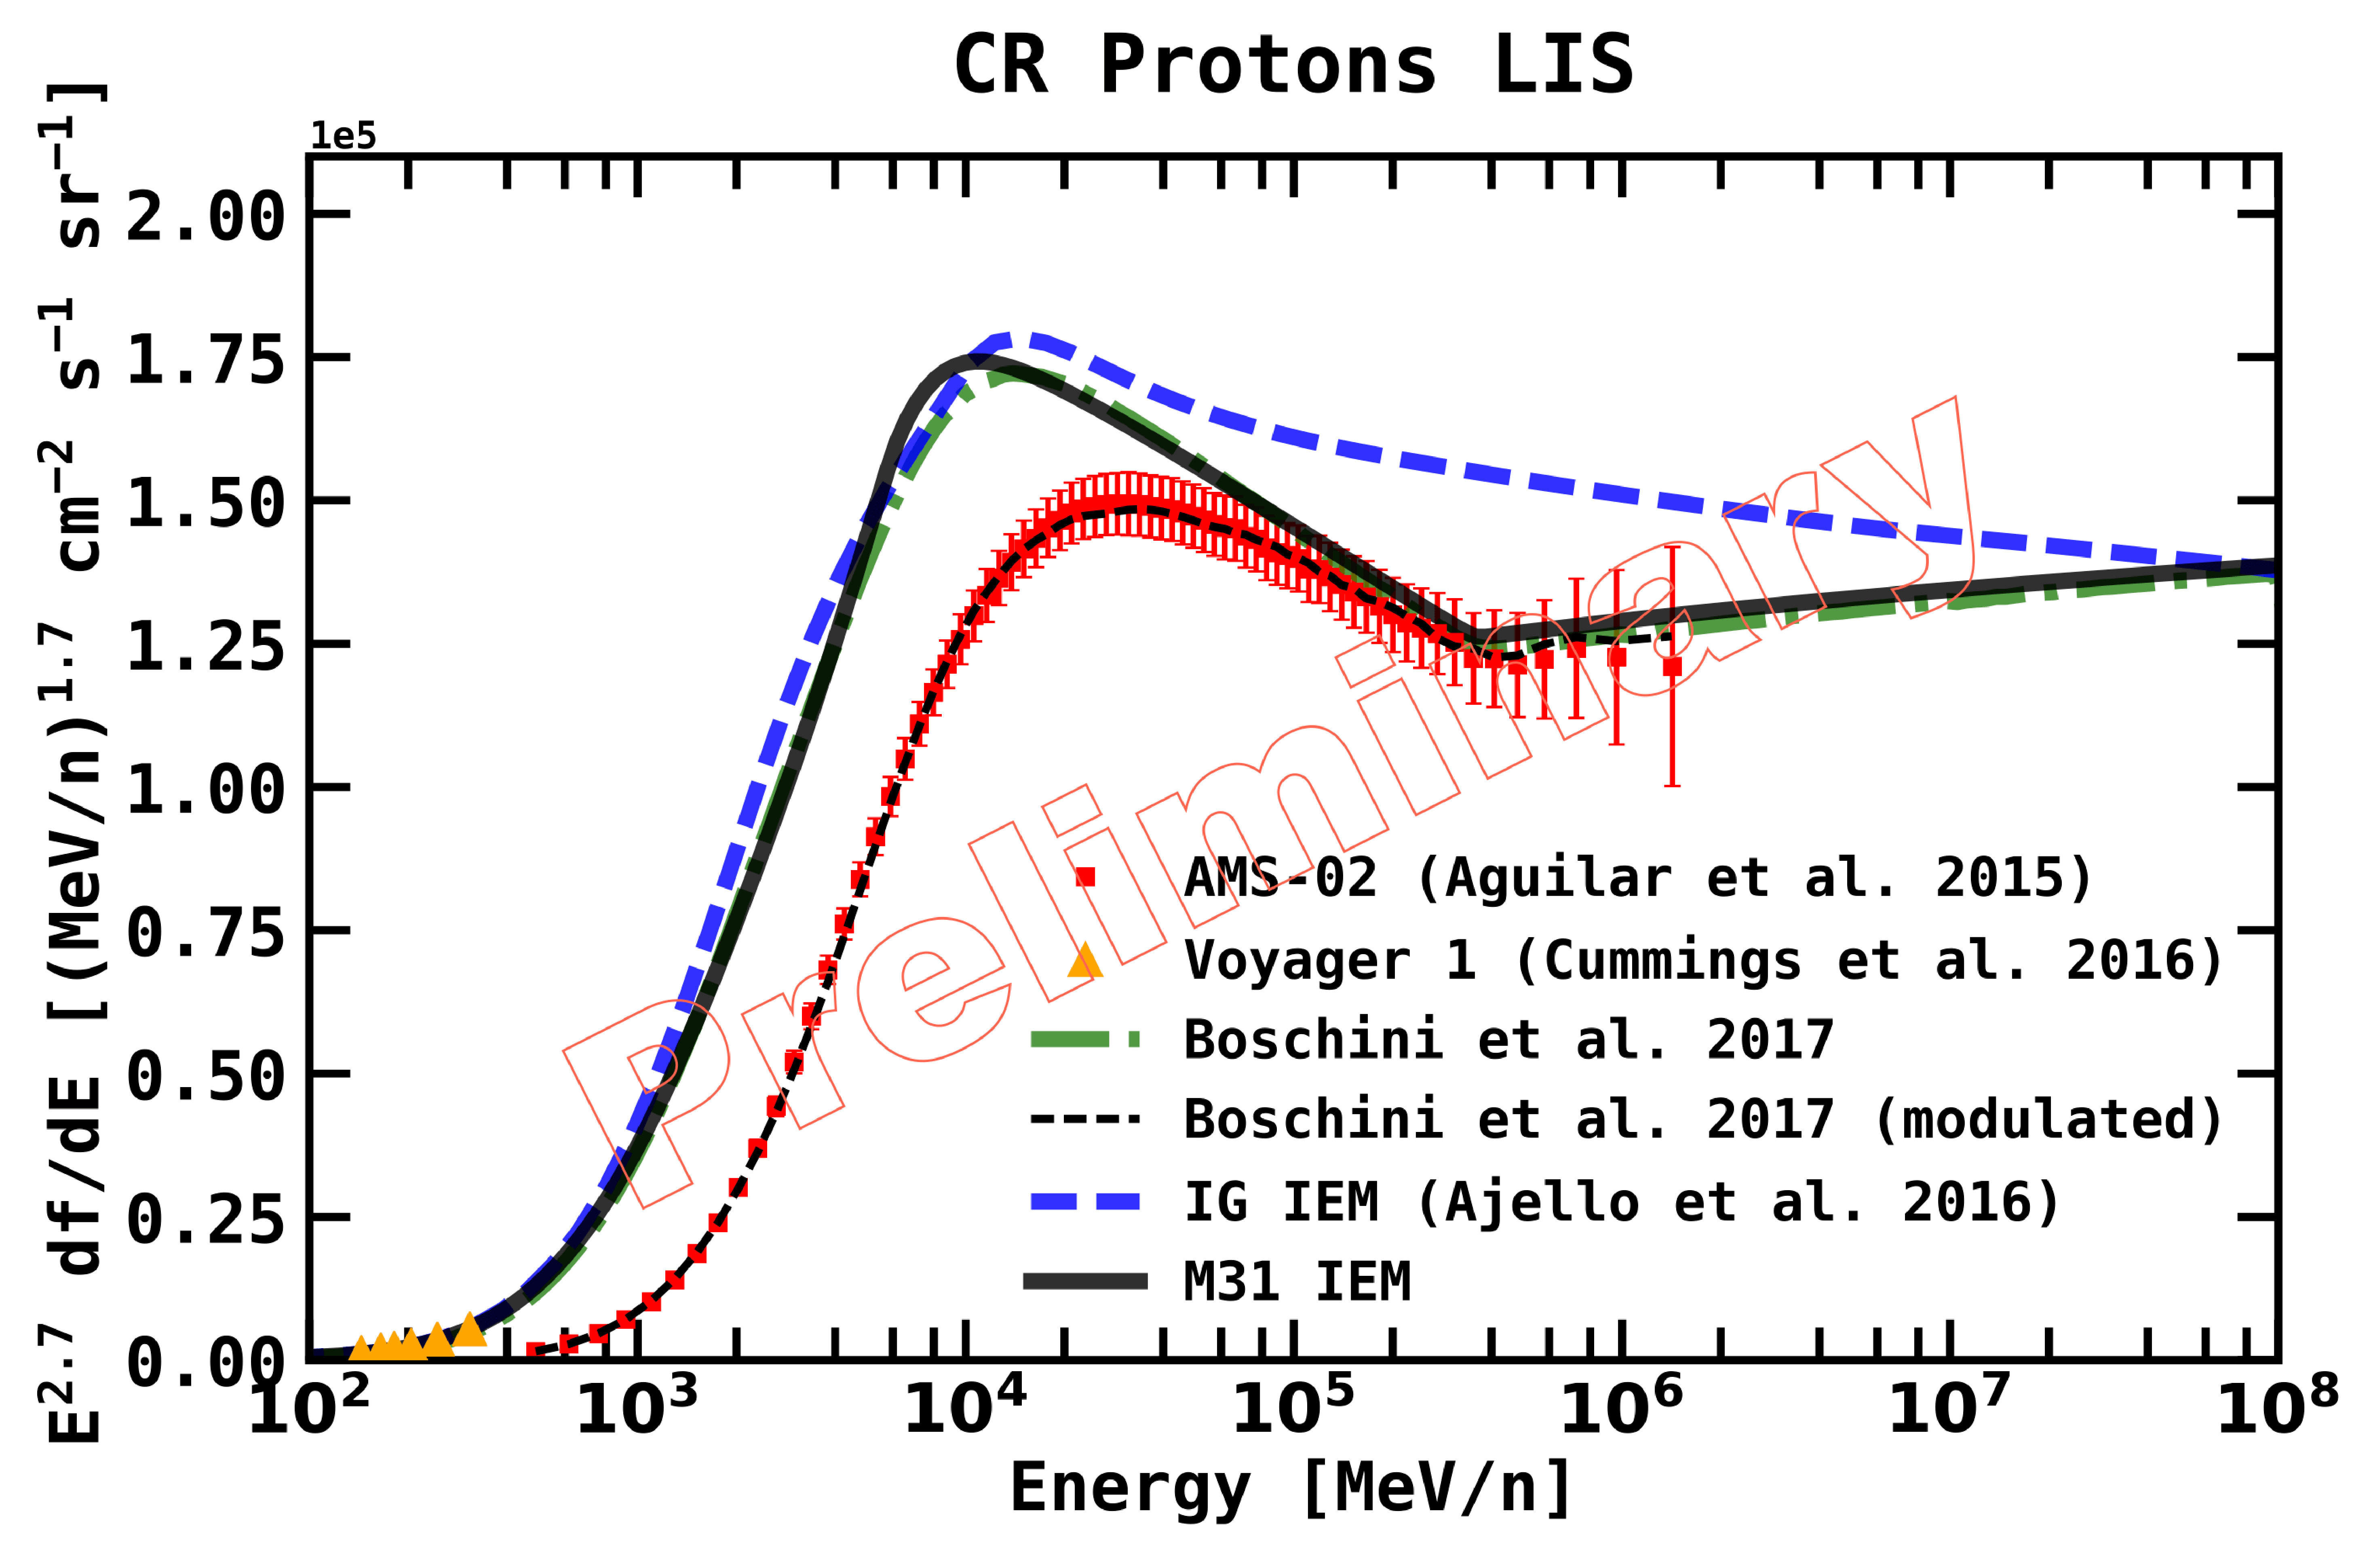 Figure 12
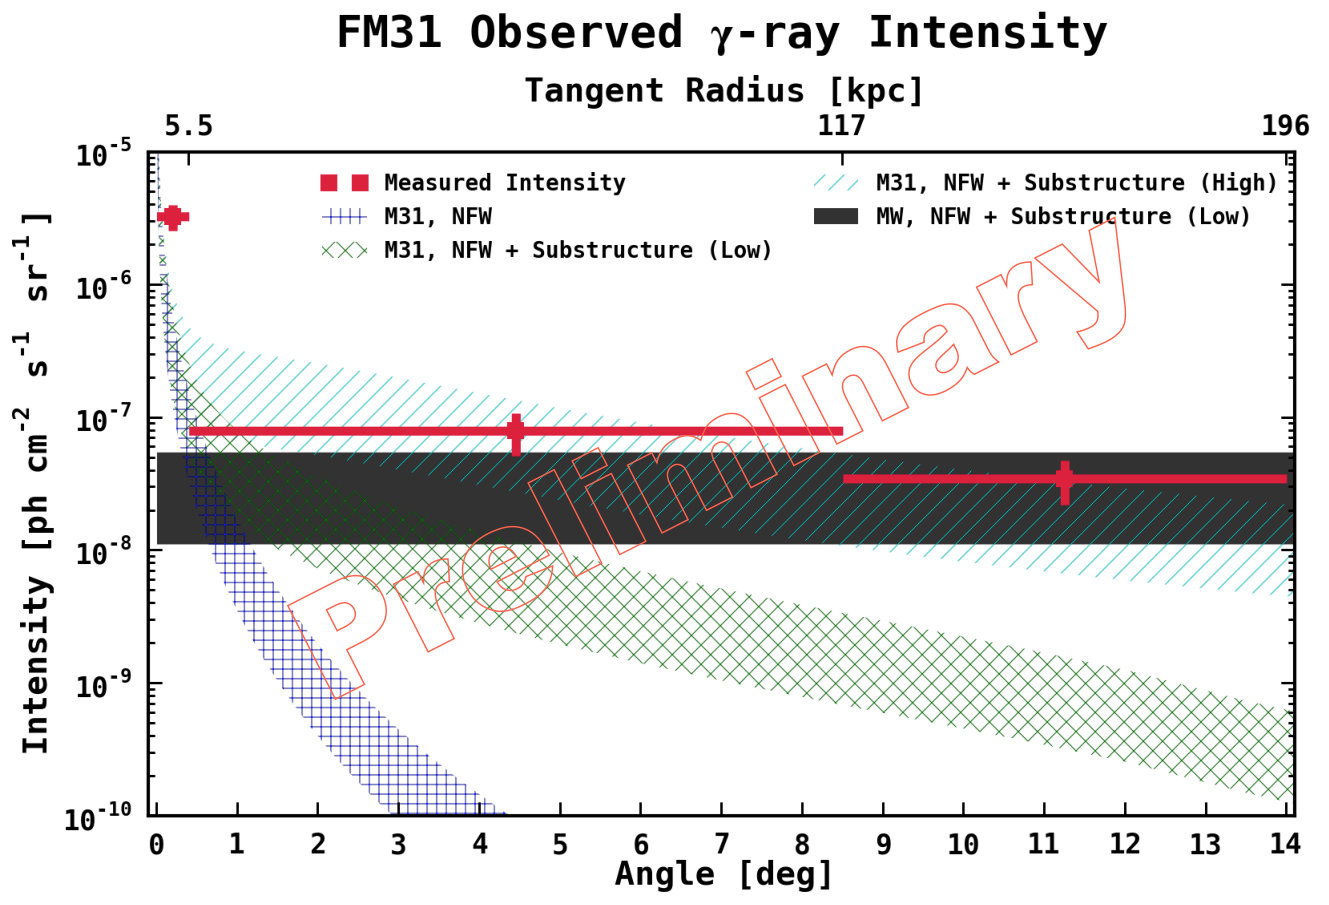 Figure 13
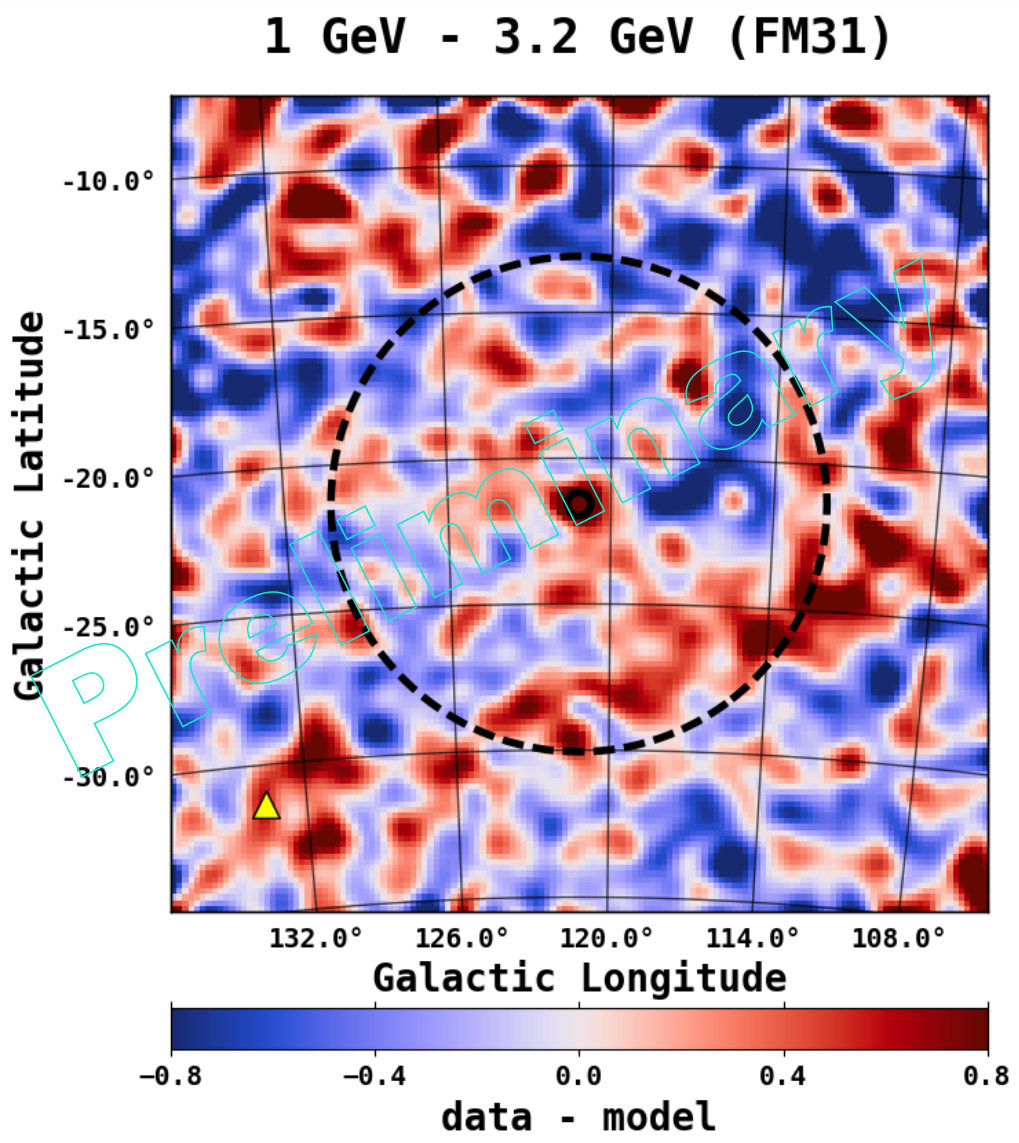 Figure 14
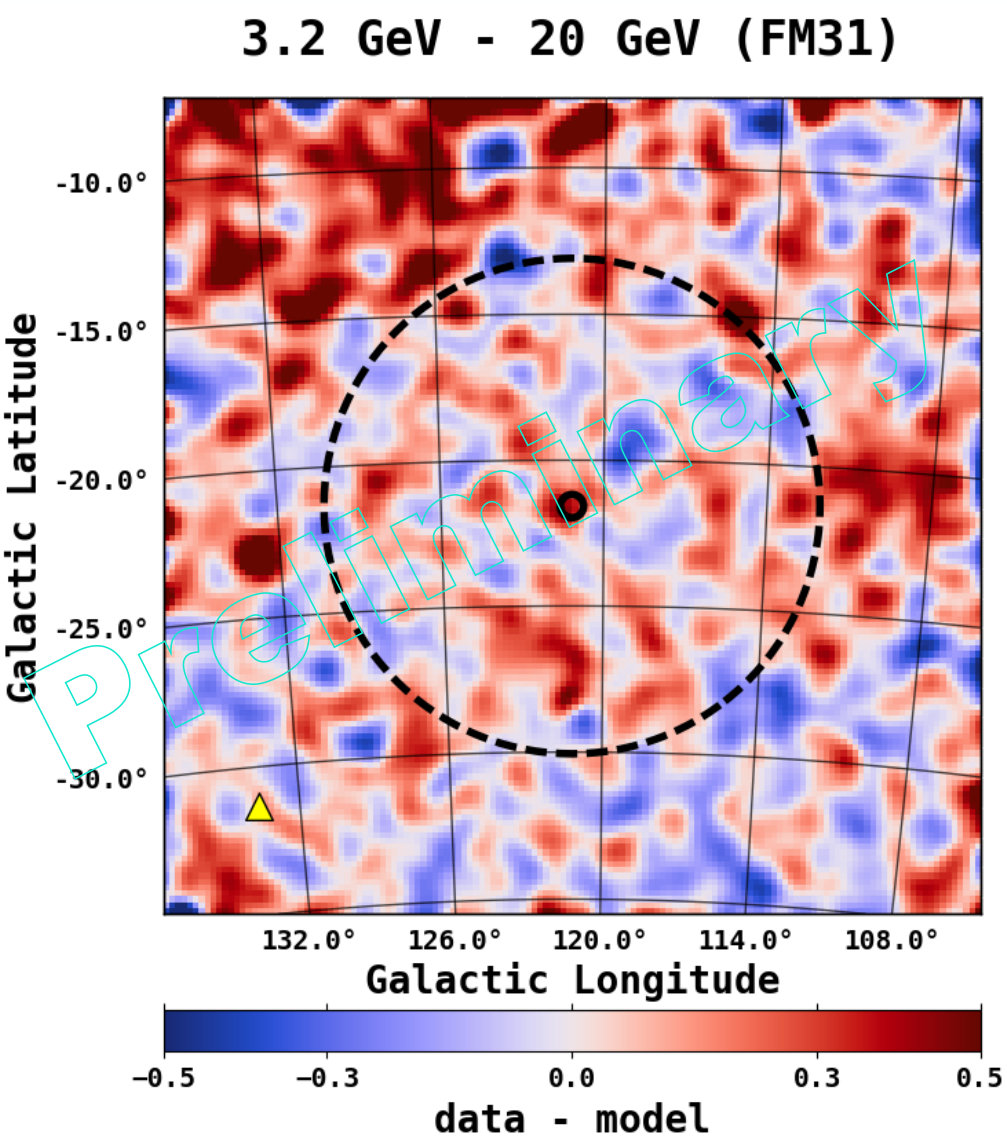 Figure 15
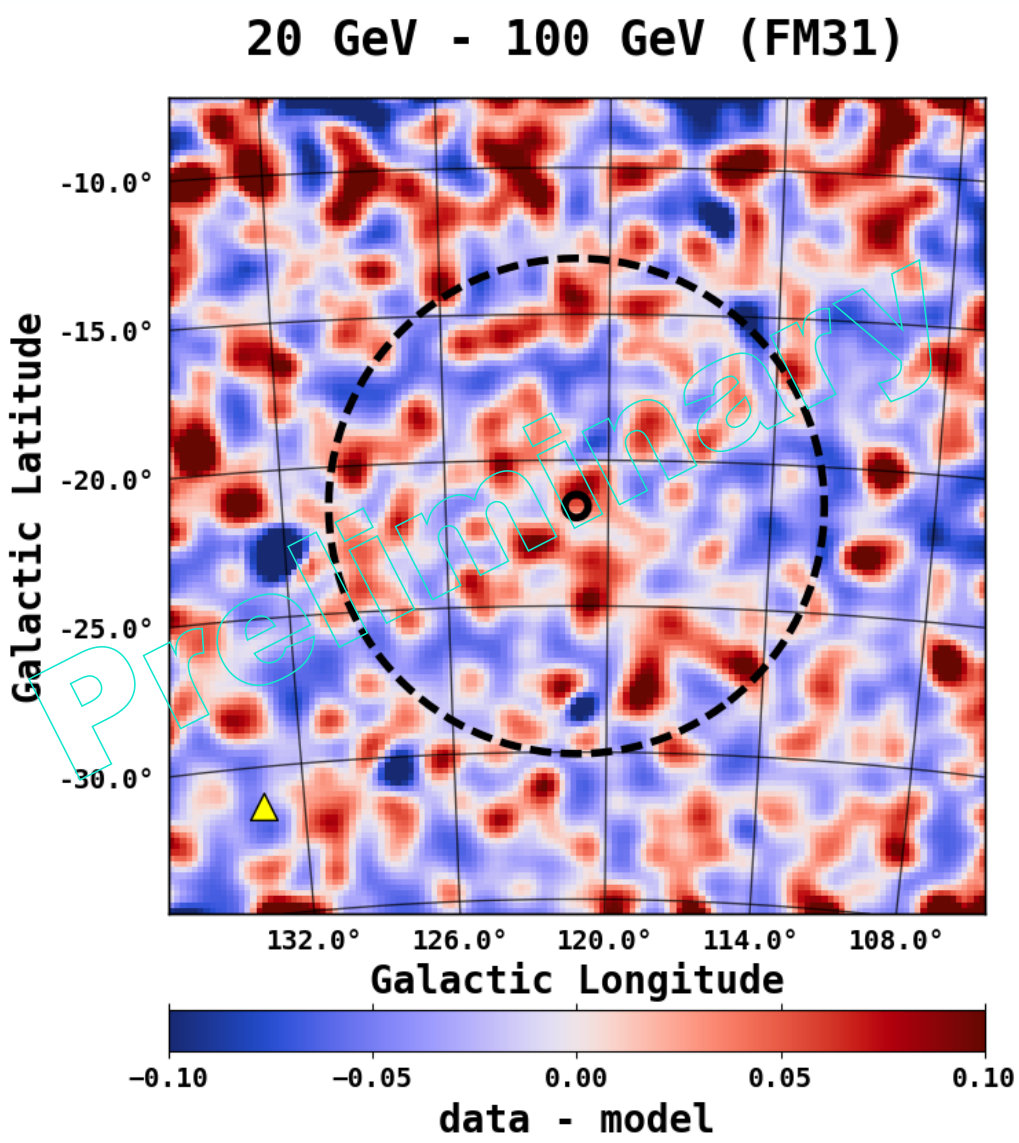 Figure 16
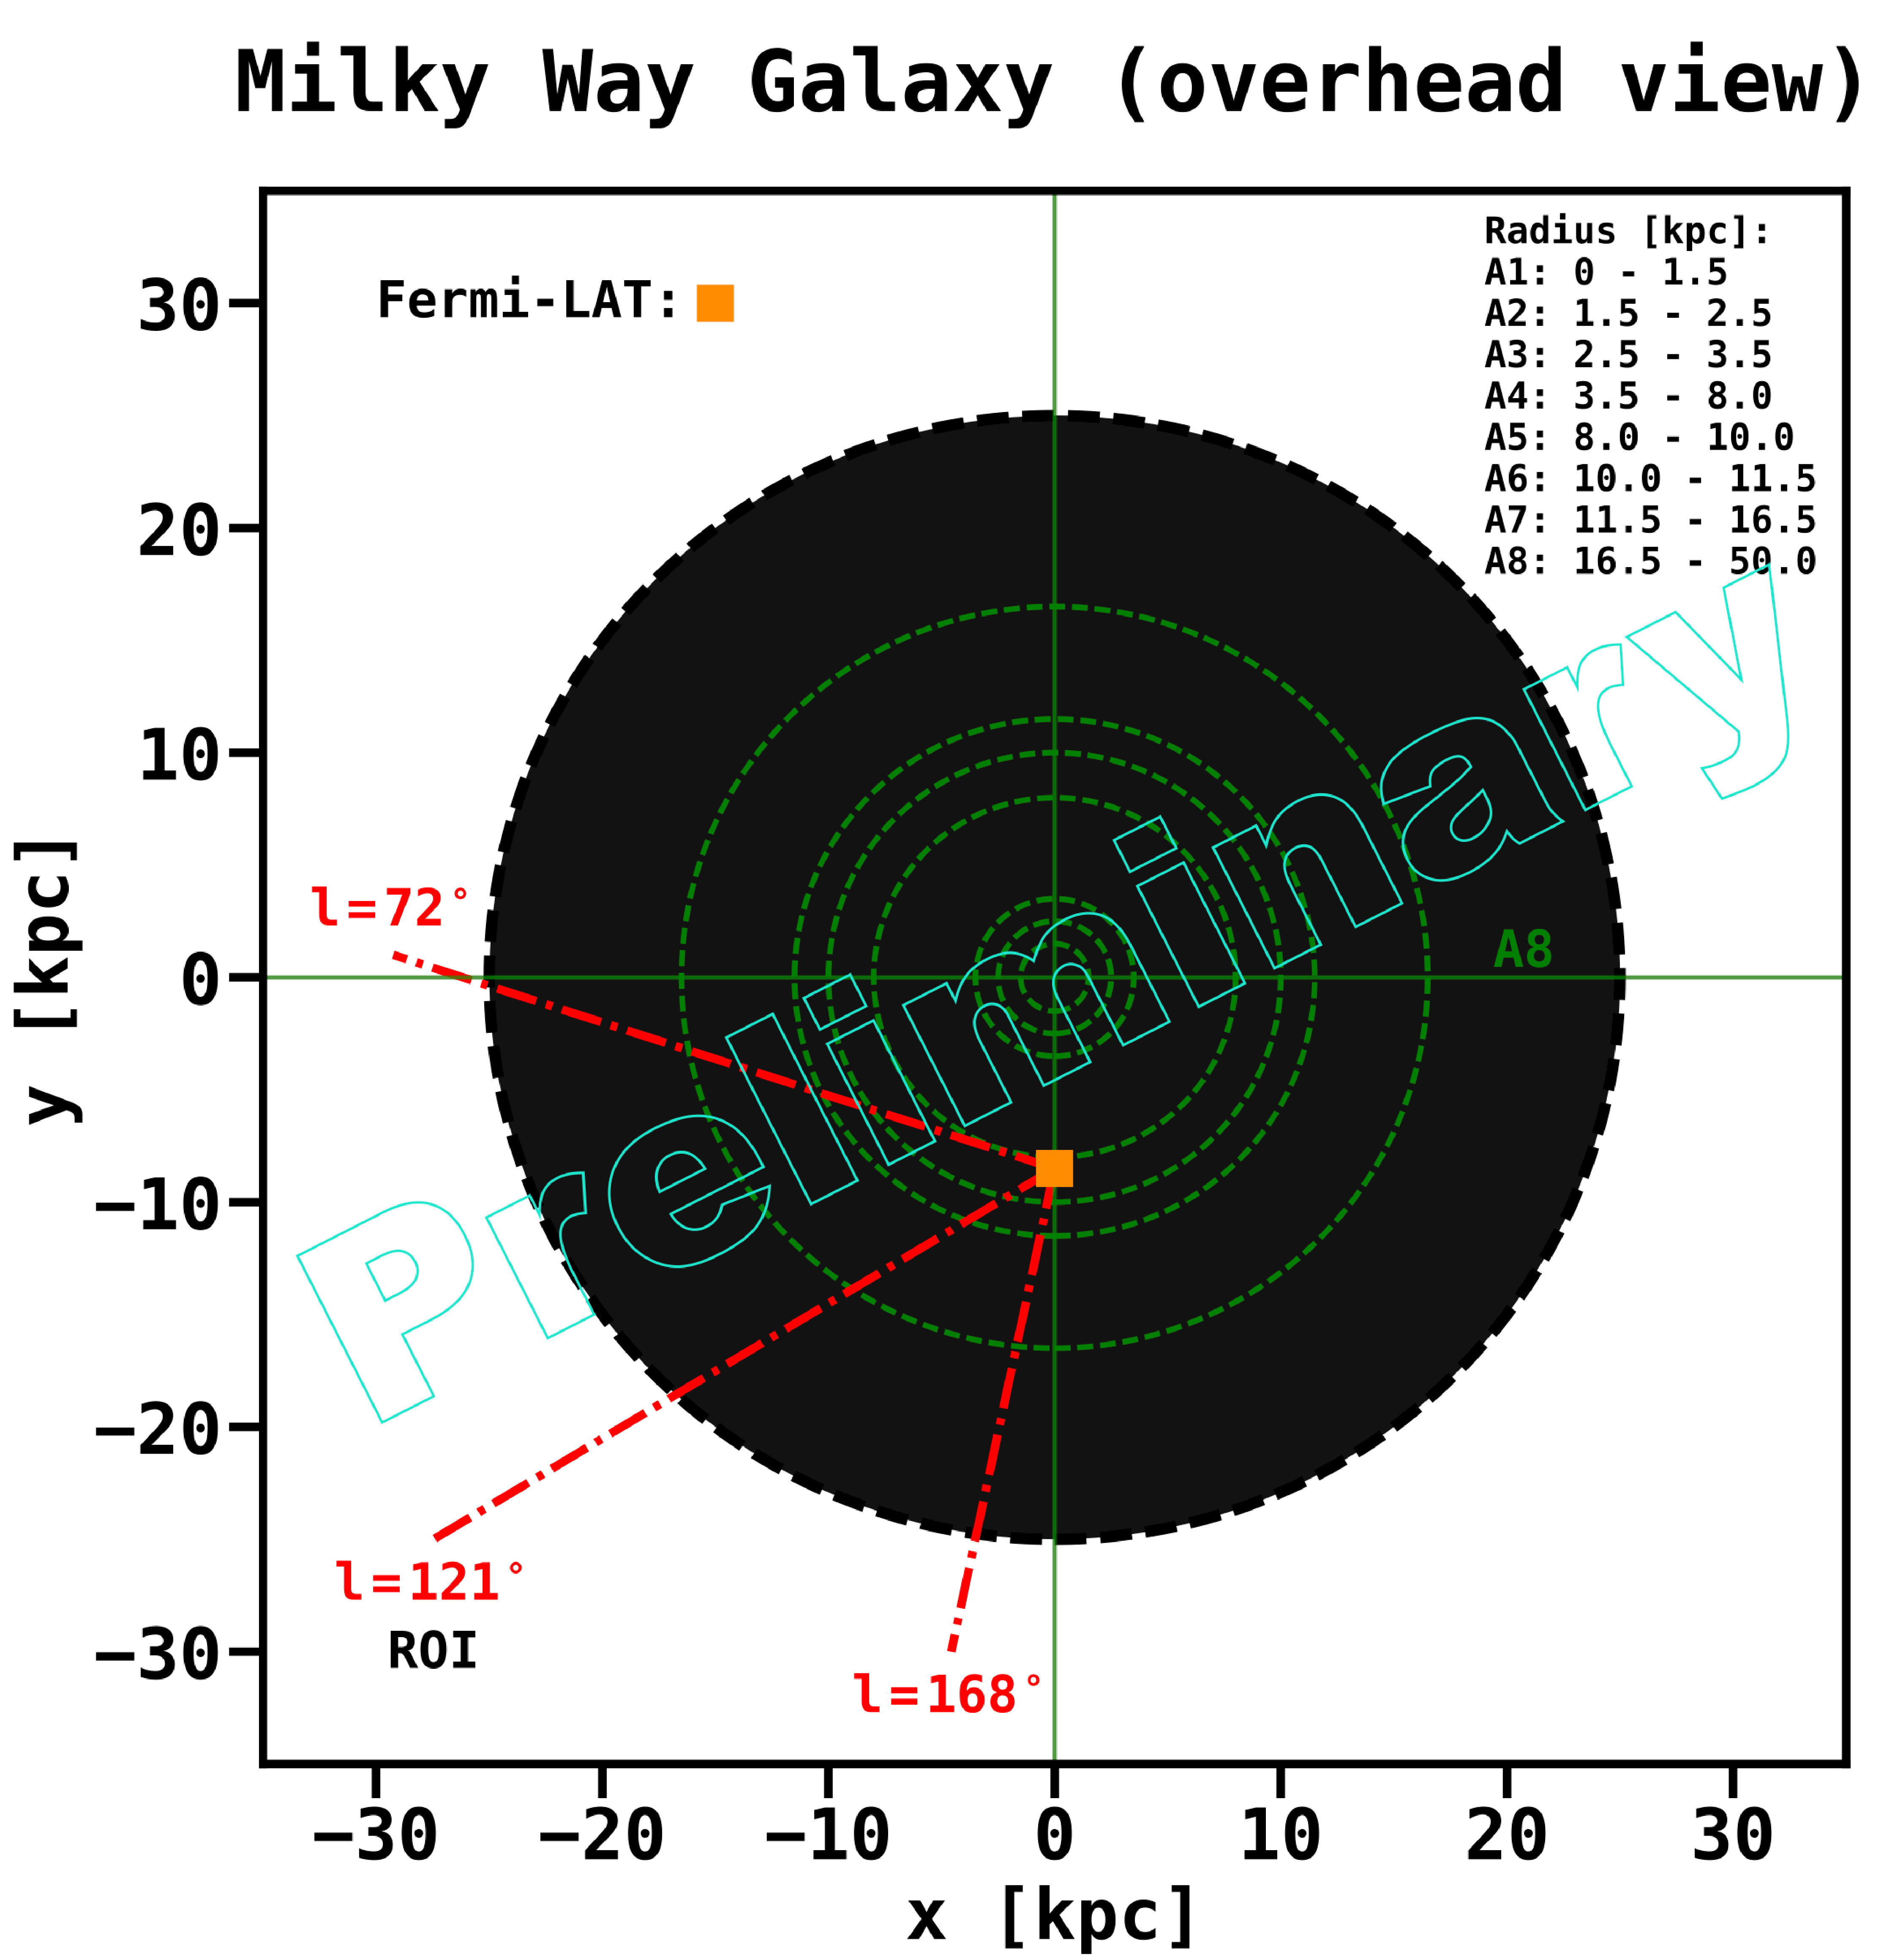 Figure 17
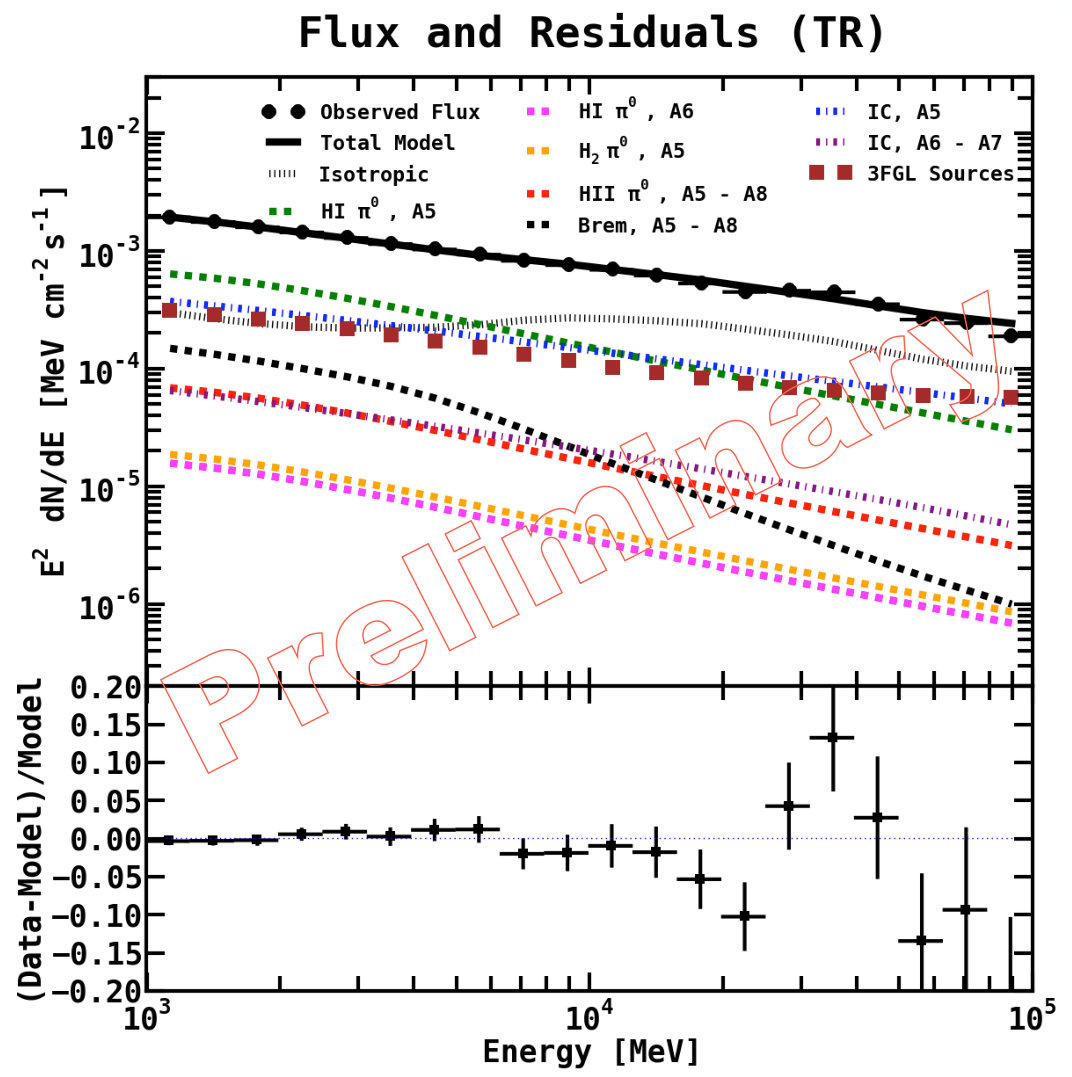 Figure 18
Peer Reviews
No public reviews on file for this paper yet. If you reviewed it on a platform where reviews are public (OpenReview, ICLR, NeurIPS, ICML), you can paste yours below so the community can read it here.
Videos
No videos yet. Explain this paper in a talk, walkthrough, or lecture? Add one.
Fermi-LAT Observations of -Ray Emission Towards the Outer Halo of M31
Christopher M. Karwin\mathrm{\dagger}$$\mathrm{\dagger}affiliation: [email protected] , Simona Murgia\mathrm{\ddagger}$$\mathrm{\ddagger}affiliation: [email protected] , and Sheldon Campbell\mathrm{\mathparagraph}$$\mathrm{\mathparagraph}affiliation: [email protected]
Department of Physics and Astronomy, University of California, Irvine, CA 92697, USA
Igor V. Moskalenko\mathrm{*}$$\mathrm{*}affiliation: [email protected]
*Hansen Experimental Physics Laboratory and Kavli Institute for Particle Astrophysics and Cosmology,
Stanford University, Stanford, CA 94305, USA*
(Presented at the 8th International Fermi Symposium, Oct. 14-19, 2018, Baltimore, MD)
Abstract
The Andromeda Galaxy is the closest spiral galaxy to us and has been the subject of numerous studies. It harbors a massive dark matter (DM) halo which may span up to 600 kpc across and comprises 90% of the galaxy’s total mass. This halo size translates into a large diameter of 42∘ on the sky for an M31–Milky Way (MW) distance of 785 kpc, but its presumably low surface brightness makes it challenging to detect with -ray telescopes. Using 7.6 years of Fermi Large Area Telescope (Fermi–LAT) observations, we make a detailed study of the -ray emission between 1–100 GeV towards M31’s outer halo, with a total field radius of centered at M31, and perform an in-depth analysis of the systematic uncertainties related to the observations. We use the cosmic ray (CR) propagation code GALPROP to construct specialized interstellar emission models (IEMs) to characterize the foreground -ray emission from the MW, including a self-consistent determination of the isotropic component. We find evidence for an extended excess that appears to be distinct from the conventional MW foreground, having a total radial extension upwards of 120–200 kpc from the center of M31. We discuss plausible interpretations of the excess emission but emphasize that uncertainties in the MW foreground, and in particular, modeling of the H i-related components, have not been fully explored and may impact the results. This study was first presented in a poster at the 8th International Fermi Symposium. The article describing the full analysis is under preparation and will be published elsewhere.
1. Introduction
The goal of this work is to search for extended -ray emission originating beyond the galactic disk of M31, and to examine the implications for CRs and DM. There are two primary motivations for this search. First, CR interactions with the radiation field of M31’s stellar halo and/or the circumgalactic gas could generate a detectable signal in -rays. Secondly, M31’s DM halo has a large extension on the sky and could produce a detectable signal within currently allowed DM scenarios, which would be complementary to other targets, and specifically, the Galactic center. What makes M31 advantages in regards to DM searches with -rays is that the entire DM halo is seen from the outside, so we see the extended integral signal. For the MW we see through the halo, and so it can be easily confused with diffuse components. Our primary field of interest is a square region, which amounts to a projected radius of 200 kpc from the center of M31. Our study complements previously published results on M31 (Abdo et al. 2010; Ögelman et al. 2011; Pshirkov et al. 2016a, b; Ackermann et al. 2017) and is the first to explore the farthest reaches of the M31 system in -rays.
2. Observations
Our full region of interest (ROI) corresponds to a radius of centered at the position of M31, . We employ front and back converting events corresponding to the P8R2_CLEAN_V6 selection. The events have energies in the range 1–100 GeV and have been collected from 2008-08-04 to 2016-03-16 (7.6 years). The data are divided into 20 bins equally spaced in logarithmic energy, with pixel size. The analysis is carried out with the Fermi–LAT ScienceTools (version v10r0p5)111Available at http://fermi.gsfc.nasa.gov/ssc/data/analysis. In particular, the binned maximum likelihood fits are performed with the gtlike package.
Figure 1 shows the total observed counts between 1–100 GeV for the full ROI. Two different count ranges are displayed. The map on the left shows the full range. The bright emission along 0∘ latitude corresponds to the plane of the MW. The map on the right shows the saturated counts map, emphasizing the lower counts at higher latitudes. Overlaid is a green dashed circle ( in radius) corresponding to a 300 kpc projected radius centered at M31, for an M31-MW distance of 785 kpc, i.e. the canonical virial radius of M31. Also shown is M31’s population of dwarf galaxies. The primary purpose of the overlay is to provide a qualitative representation of the extent of M31’s outer halo, and to show its relationship to the MW disk. Note that we divide the full ROI into subregions, and our primary field of interest is a square region centered at M31, which we refer to as field M31 (FM31).
3. Building the Interstellar Emission Models
The foreground emission from the MW and the isotropic component (the latter includes unresolved extragalactic diffuse -ray emission, residual instrumental background, and possibly contributions from other Galactic components which have a roughly isotropic distribution) are the dominant contributions in -rays towards the M31 region. We use the CR propagation code GALPROP222Available at https://galprop.stanford.edu(v56) (Moskalenko & Strong 1998, 2000; Strong & Moskalenko 1998; Strong et al. 2000; Ptuskin et al. 2006; Strong et al. 2007; Vladimirov et al. 2011; Jóhannesson et al. 2016; Porter et al. 2017; Jóhannesson et al. 2018; Génolini et al. 2018) to construct specialized interstellar emission models (IEMs) to characterize the MW foreground emission, including a self-consistent determination of the isotropic component. These foreground models are physically motivated and are not subject to the same caveats333The list of caveats on the Fermi–LAT diffuse model is available at https://fermi.gsfc.nasa.gov/ssc/data/analysis/LAT_caveats.html for extended source analysis as the FSSC IEM provided by the Fermi–LAT Collaboration for point source analysis (Acero et al. 2016).
The parameters of the GALPROP model are tuned to the measured local interstellar spectra (LIS) of CRs, including the latest AMS-02 measurements. We have adopted the best-fit parameters from the tuning procedure performed in Boschini et al. (2017, 2018), where GALPROP and HelMod444Available at http://www.helmod.org/ are implemented in an iterative manner, thereby accounting for solar modulation in a physically motivated way when fitting to the local CR measurements. This is summarized in Figure 2.
Figure 3 shows the total interstellar emission model, which consists of individual components for -decay, inverse Compton (IC), and Bremsstrahlung. The components are defined in Galctocentric annuli, as depicted in Figure 4. In total there are 8 annuli, but for FM31 only annulus 5 (the local annulus) and beyond contribute to the foreground emission. FM31 has a significant emission associated with H i gas, but there is very little emission from H2 gas. A uniform spin temperature of 150 K is assumed for the baseline IEM. The foreground emission from H ii and Bremsstrahlung are subdominant. Our model also accounts for the dark neutral medium (DNM). The anisotropic formalism is employed for the calculation of the IC component. In addition to the GALPROP IEM components, we also use a template approach to account for inaccuracies in the foreground model relating to the neutral gas along the line of sight. To model the point sources in the region, we employ the 3FGL as a starting point, and because of the larger statistics of our data set, we account for additional point sources self-consistently with the M31 IEM by implementing a point source finding procedure, which is based on a wavelet transform algorithm.
We calculate the isotropic component self-consistently with the M31 IEM. The main calculation is performed over the full sky in the following region: . In addition, we also calculate the isotropic spectrum in different subregions. The results are summarized in Figure 5. To better determine the normalization of the isotropic component we use a tuning region (TR) directly below FM31, outside of the virial radius. The best-fit normalization is found to be 1.06 0.04, and this remains fixed for all other fits with the M31 IEM. The fit in the TR yields a model that describes the data well across the entire region and at all energies. The best-fit normalizations of the IEM components in the TR are all in reasonable agreement with the GALPROP predictions. The spectra for the IEM components and the remaining fractional energy residuals for the fit in the TR are shown in the left panel of Figure 6.
4. Results for the M31 Field
The baseline fit in FM31 results in positive residual emission in the fractional energy residuals between 3–20 GeV at the level of 5%, as seen in the right panel of Figure 6. Figure 7 shows the corresponding spatial residuals for three different energy bands. The bands are chosen to coincide with the positive residual emission observed in the fractional energy residuals. The spatial residuals show structured excesses and deficits, primarily at lower energies (1–3 GeV). In the second energy bin some of these structures can also be seen, but overall the residual emission is more uniformly distributed than for the first energy bin.
A significant fraction of the structured excess emission in FM31 is found to be spatially correlated with the H i column density and the foreground dust, including regions where the dust is relatively cold. This may be indicative of a spatially varying spin temperature. Correspondingly, the structured residual emission may be related to inaccuracies in the modeling of the DNM, which is determined as part of an all-sky procedure. We, therefore, refine the baseline IEM by constructing a template to account for potential mis-modeling of these components. The template is obtained by selecting the excess emission in FM31 that correlates with H i tracers. We refer to this as the arc template, and the left panel of Figure 8 shows the corresponding contours overlaid to the dust reddening map from Schlegel et al. (1998). This procedure accounts for any un-modeled H i (or other Galactic gas), as well as any mis-modeling in its line of sight distance, spin temperature, and spectral index variations. The right panel of Figure 8 shows the results for the baseline fit with the arc template.
We find that the specialized IEMs for the analysis of FM31, both the baseline model and the baseline model with the arc template, yield an extended excess at the level of 5% in the 3–20 GeV energy range. We show that the excess is also present with similar characteristics when alternative IEMs are employed, and when systematic variations of the spectrum of point sources are considered.
To determine whether the excess presents a spherically symmetric gradient about the center of M31, which would lend support to the hypothesis that it originates from there (at least partially), we perform a further fit in FM31 by including three symmetric uniform templates centered at M31. This also allows us to quantify the spectrum and gradient of the positive residual emission. The templates are fit concurrently with the other components of the baseline IEM, including the arc template. The inner disk (inner galaxy) has a radial extension of 0.4∘ (5.5 kpc projected radius). This is the best-fit morphology as determined in Ackermann et al. (2017), and it corresponds to the bright -ray emission towards M31’s inner galaxy. The intermediate ring (spherical halo) has a radial extension from (117 kpc projected radius). This extension excludes most of the residual emission associated with the arc template, while also enclosing a majority of M31’s globular cluster population (Galleti et al. 2004; Huxor et al. 2008; Peacock et al. 2010; Mackey et al. 2010; Veljanoski et al. 2014; Huxor et al. 2014) and dwarf galaxy population (McConnachie 2012; Martin et al. 2013; Collins et al. 2013), as well as the M31 cloud (Blitz et al. 1999; Kerp et al. 2016), which is a highly extended lopsided gas cloud centered in projection on M31, possibly associated with the M31 system. The outer ring (far outer halo) covers the remaining extent of FM31, corresponding to a total projected radius of 200 kpc, and likewise it begins to approach the MW plane towards the top of the field. Boundaries for these components are overlaid to the residuals in Figure 7. We find that all templates are significantly detected (with a significance of ). Furthermore, the M31-related components are able to flatten the positive residual emission in the fractional energy residuals.
The spectrum and intensity for the inner galaxy are consistent with previously published results. The spherical halo and far outer halo have intensities that are much dimmer than the inner galaxy, and present a mild intensity gradient, tapering off with distance from the center of M31, as shown in the left panel of Figure 9. Their spectra are significantly different from all the other extended components in FM31. They peak between 5–10 GeV, and drop off below and above these energies more steeply than all other contributions. We find it difficult to reconcile these spectra with the possibility that the excess emission originates solely within the MW, further setting it apart from known Galactic sources. Beyond these general features, the spectra for the two outer annuli differ from each other with the far outer halo presenting a harder spectrum at low energies. The best-fit spectra for the FM31 spherical halo and far outer halo components are shown in the right panel of Figure 9. We compare the spectral shapes to the systematic band of the Galactic center excess (for an arbitrary normalization) from Ajello et al. (2016), and find that they are qualitatively consistent, as can be seen in the Figure.
Our results show that if the excess emission originates (at least partially) from the M31 system, its extension may reach a distance upwards of 120–200 kpc from the center of M31. This is consistent with the expectation for a DM signal, as the virial radius for the DM halo extends at least this far. To test this interpretation, in the left panel of Figure 9 we compare the radial profile of the observed excess with predictions for a DM signal, including both the M31 halo and the MW halo along the line of sight, with a spectrum and annihilation cross-section consistent with a DM interpretation of the GC excess. We consider different assumptions for the amount of DM substructure in M31 (and the MW), and we find that if a cold DM scenario is assumed that includes a large boost factor due to substructures, the observed excess emission is consistent with this interpretation. Granted, however, the exact partitioning of individual contributions to the signal remains unclear, i.e. primary emission from M31’s DM halo, secondary emission in M31, emission from the local DM filament between M31 and the MW, and emission from the MW’s DM halo along the line of sight. This is an intriguing finding, however, its implications are far reaching, and better understanding the MW foreground, as well as complementarity with other DM targets, is crucial before drawing any stronger conclusions.
5. Summary
We present the first search for extended emission from M31 in -rays out to a distance of 200 kpc from its center. We find evidence for an extended excess that appears to be distinct from the conventional MW foreground, having a total radial extension upwards of 120–200 kpc from the center of M31. We discuss plausible interpretations for the excess emission, but emphasize that uncertainties in the MW foreground, and in particular modeling of the H i-related components, have not been fully explored and may impact the results. We find that a DM interpretation provides a good description of the observed emission and is consistent with the GC excess DM interpretation. However, better understanding of the systematics, and complementarity with other DM searches, is critical to settle the issue.
These results were first presented in a poster at the 8th International Fermi Symposium, Oct. 14-19, 2018, Baltimore, MD. The article describing the full analysis is under preparation and will be published elsewhere.
Acknowledgements
The authors thank Tsunefumi Mizuno, Gulli Jóhannesson, Alex Drlica-Wagner, and Troy Porter for many useful comments made at the preparation stage of the manuscript. The authors are also pleased to acknowledge conversations with Ketron Mitchell-Wynne, Sean Fillingham, Tim Tait, Philip Tanedo, Mike Cooper, James Bullock, Manoj Kaplinghat, Kevork N. Abazajian, Sebastian Trojanowski, Ferdinand Badescu, Volodymyr Takhistov, Deano Farinella, and Dan Hooper. A majority of the data analysis has been performed on UCI’s HPC, and CK thanks Harry Mangalam for his assistance on numerous occasions. CK also thanks James Chiang for his assistance with the Fermi Science Tools. The work of CK and SM is supported in part by Department of Energy grant DESC0014431. SSC is supported by National Science Foundation Grant PHY-1620638 and a McCue Fellowship. IM acknowledges partial support from NASA grant NNX17AB48G.
The Fermi-LAT Collaboration acknowledges support for LAT development, operation and data analysis from NASA and DOE (United States), CEA/Irfu and IN2P3/CNRS (France), ASI and INFN (Italy), MEXT, KEK, and JAXA (Japan), and the K.A. Wallenberg Foundation, the Swedish Research Council and the National Space Board (Sweden). Science analysis support in the operations phase from INAF (Italy) and CNES (France) is also gratefully acknowledged. This work performed in part under DOE Contract DE-AC02-76SF00515.
The reference list from the paper itself. Each links out to its DOI / PubMed record.
- 1Abdo et al. (2010) Abdo, A., et al. 2010, A&A, 523, L 2
- 2Acero et al. (2016) Acero, F., et al. 2016, Ap JS, 223, 26
- 3Ackermann et al. (2017) Ackermann, M., et al. 2017, Ap J, 836, 208
- 4Aguilar et al. (2014) Aguilar, M., Aisa, D., Alpat, B., et al. 2014, Ph Rv L, 113, 221102
- 5Aguilar et al. (2015 a) —. 2015 a, Ph Rv L, 114, 171103
- 6Aguilar et al. (2015 b) —. 2015 b, Ph Rv L, 115, 211101
- 7Ajello et al. (2016) Ajello, M., et al. 2016, Ap J, 819, 44
- 8Blitz et al. (1999) Blitz, L., Spergel, D. N., Teuben, P. J., Hartmann, D., & Burton, W. B. 1999, Ap J, 514, 818