Unified Analysis of HetNets using Poisson Cluster Process under Max-Power Association
Chiranjib Saha, Harpreet S. Dhillon, Naoto Miyoshi, and Jeffrey G., Andrews

TL;DR
This paper develops an analytical framework to evaluate coverage probability in heterogeneous cellular networks modeled with Poisson cluster processes, considering max-power association, and highlights the impact of cluster size on SINR distribution.
Contribution
It introduces a novel analytical approach for HetNets with PCPs, enabling performance analysis under max-power association and assessing cluster size effects.
Findings
Coverage probability expressed as a product of PGFLs of parent PPPs.
Framework accommodates both PPP and PCP models for BS locations.
Provides insights into how cluster size influences SINR distribution.
Abstract
Owing to its flexibility in modeling real-world spatial configurations of users and base stations (BSs), the Poisson cluster process (PCP) has recently emerged as an appealing way to model and analyze heterogeneous cellular networks (HetNets). Despite its undisputed relevance to HetNets -- corroborated by the models used in industry -- the PCP's use in performance analysis has been limited. This is primarily because of the lack of analytical tools to characterize performance metrics such as the coverage probability of a user connected to the strongest BS. In this paper, we develop an analytical framework for the evaluation of the coverage probability, or equivalently the complementary cumulative density function (CCDF) of signal-to-interference-and-noise-ratio (SINR), of a typical user in a K-tier HetNet under a max power-based association strategy, where the BS locations of each tier…
Click any figure to enlarge with its caption.
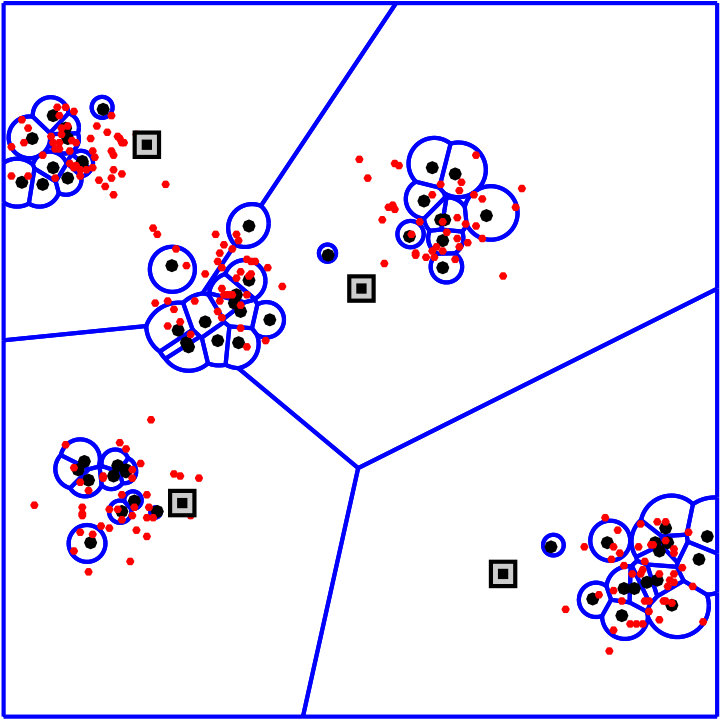 Figure 1
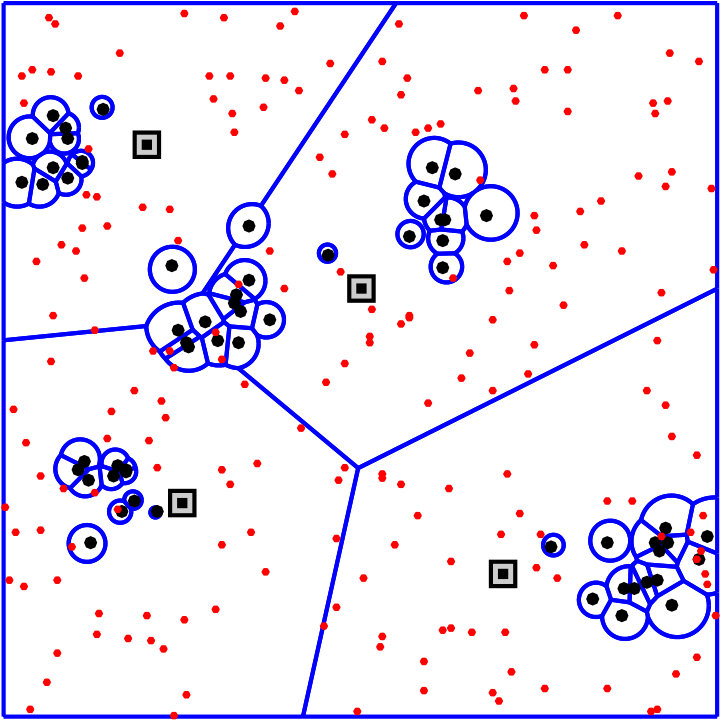 Figure 2
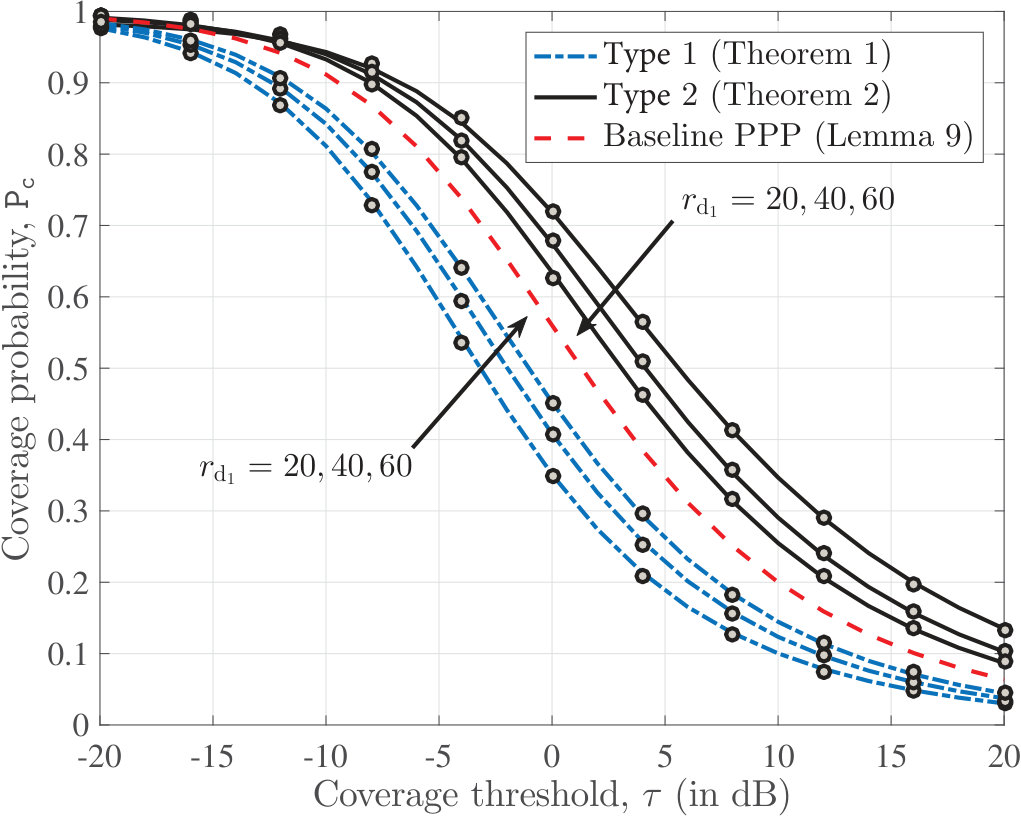 Figure 3
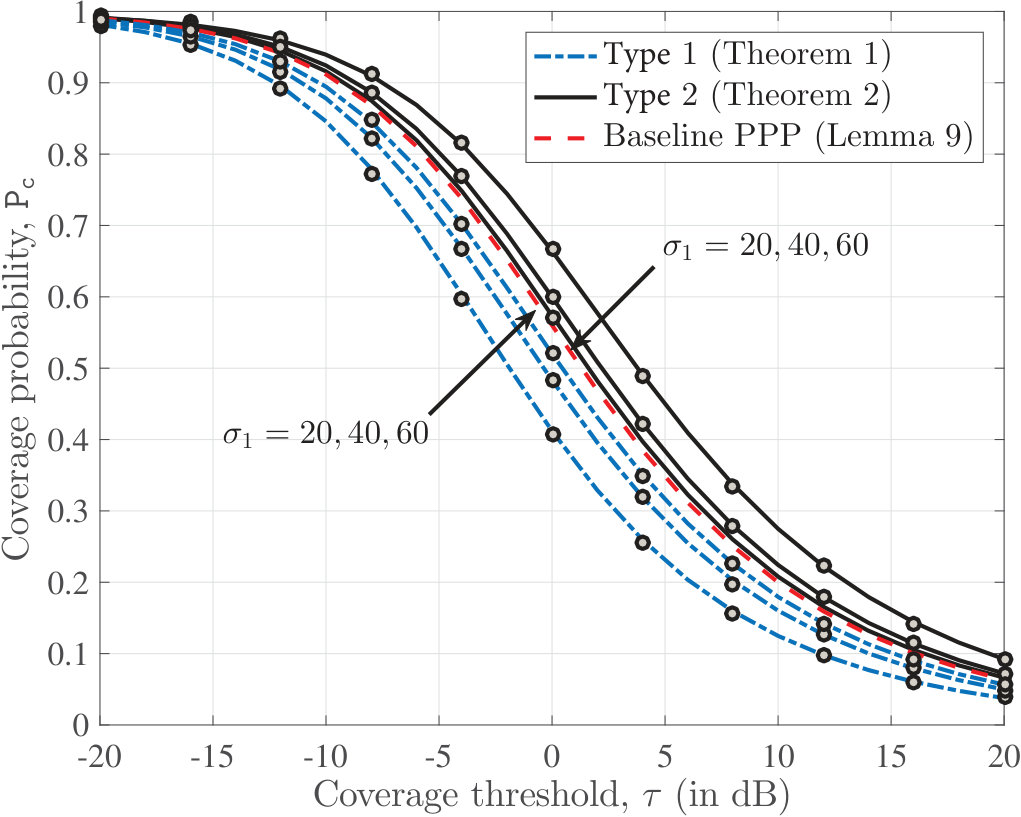 Figure 4
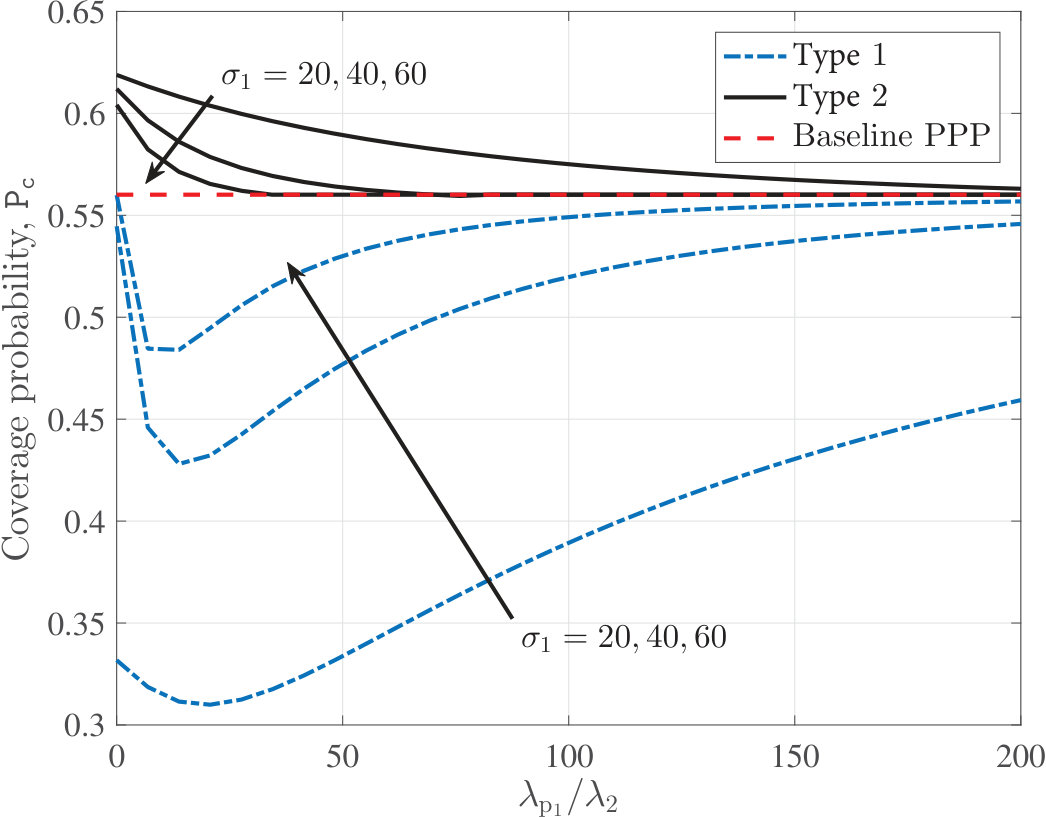 Figure 5
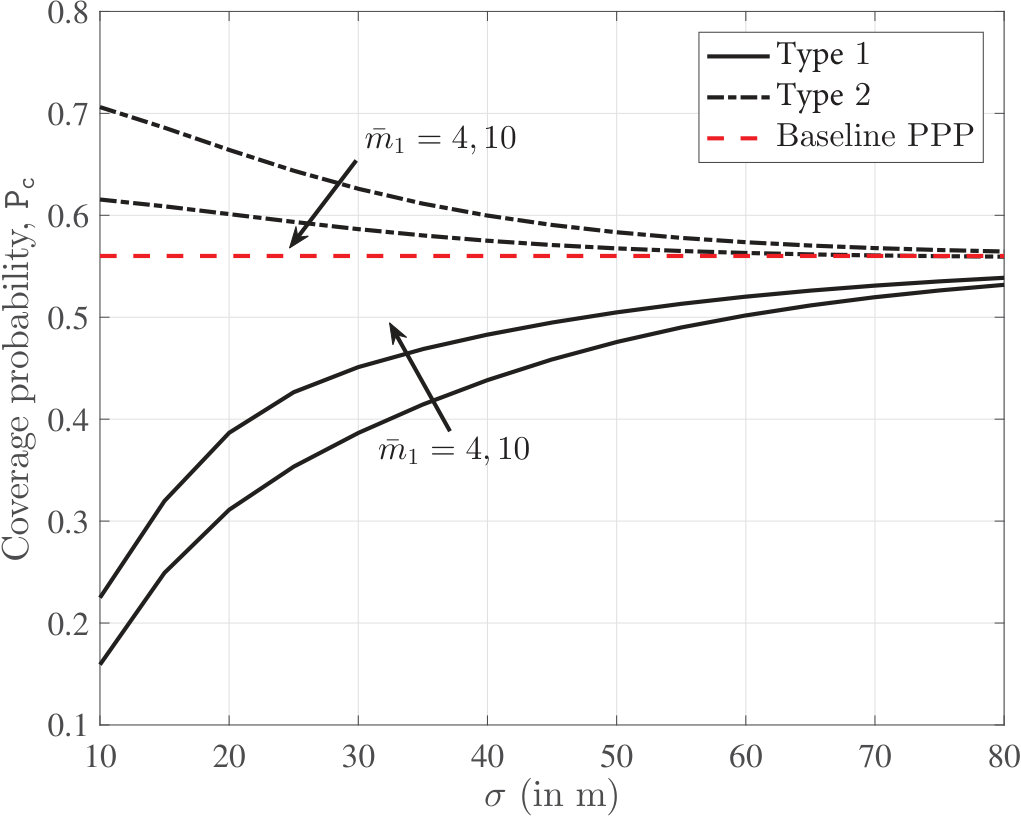 Figure 6
| Index set of all BS tiers () | |
|---|---|
| Index set of all BS tiers modeled as PCP and PPP | |
| The point process of the BS tier, , which is a PCP. | |
| The point process of the BS tier, , which is a PPP. | |
| Transmit power of a BS in | |
| Path-loss exponent () | |
| Coverage threshold of | |
| Conditional PDF of distance of a point of () | |
| from origin given its cluster center is located at () | |
| PDF and CDF of contact distance of | |
Peer Reviews
No public reviews on file for this paper yet. If you reviewed it on a platform where reviews are public (OpenReview, ICLR, NeurIPS, ICML), you can paste yours below so the community can read it here.
Code & Models
Videos
No videos yet. Explain this paper in a talk, walkthrough, or lecture? Add one.
Taxonomy
TopicsAdvanced MIMO Systems Optimization · Human Mobility and Location-Based Analysis · Cooperative Communication and Network Coding
Unified Analysis of HetNets using Poisson Cluster Process under Max-Power Association
Chiranjib Saha, Harpreet S. Dhillon, Naoto Miyoshi, and Jeffrey G. Andrews C. Saha and H. S. Dhillon are with Wireless@VT, Department of ECE, Virginia Tech, Blacksburg, VA, USA. Email: {csaha, hdhillon}@vt.edu. N. Miyoshi is with the Department of Mathematical and Computing Science, Tokyo Institute of Technology, Tokyo, Japan. Email: [email protected]. J. G. Andrews is with the Wireless Networking and Communications Group, The University of Texas at Austin, TX, USA. Email: [email protected]. The support of the US National Science Foundation (Grant CNS-1617896) and Japan Society for the Promotion of Science (JSPS) Grant-in-Aid for Scientific Research (C) 16K00030 is gratefully acknowledged. Last updated: .
Abstract
Owing to its flexibility in modeling real-world spatial configurations of users and base stations (BSs), the Poisson cluster process (PCP) has recently emerged as an appealing way to model and analyze heterogeneous cellular networks (HetNets). Despite its undisputed relevance to HetNets – corroborated by the models used in industry – the PCP’s use in performance analysis has been limited. This is primarily because of the lack of analytical tools to characterize performance metrics such as the coverage probability of a user connected to the strongest BS. In this paper, we develop an analytical framework for the evaluation of the coverage probability, or equivalently the complementary cumulative density function (CCDF) of signal-to-interference-and-noise-ratio (), of a typical user in a -tier HetNet under a power-based association strategy, where the BS locations of each tier follow either a Poisson point process (PPP) or a PCP. The key enabling step involves conditioning on the parent PPPs of all the PCPs which allows us to express the coverage probability as a product of sum-product and probability generating functionals (PGFLs) of the parent PPPs. In addition to several useful insights, our analysis provides a rigorous way to study the impact of the cluster size on the distribution, which was not possible using existing PPP-based models.
Index Terms:
Heterogeneous cellular network, 3GPP, Poisson cluster process, Thomas cluster process, Matérn cluster process.
I Introduction
Network heterogeneity is at the heart of current 4G and upcoming 5G networks. A key consequence of the heterogeneous deployments is the emergence of different types of spatial couplings across the locations of BSs and users. Perhaps the most prominent one is the user-BS coupling, where the users tend to form spatial clusters or hotspots [1, 2, 3] and small cell BSs (SBSs) are deployed within these hotspots to provide additional capacity. Further, depending on the deployment objectives, the point patterns of BSs of a particular tier may exhibit some intra-tier coupling, such as clustering patterns for small cells [4, 5] and repulsive patterns for macrocells deployed under a minimum inter-site distance constraint. Further, inter-tier coupling may exist between the locations of BSs of different tiers, for instance, macrocells and small cells when the latter are deployed at the macrocell edge to boost cell edge coverage [6].
Not surprisingly, the HetNet simulation models used by the standardization bodies, such as the third generation partnership project (3GPP), are cognizant of the existence of this spatial coupling [6]. Unfortunately, this is not true for the stochastic geometry based analytical HetNet models, e.g., see [7, 8], which mostly still rely on the assumption that all network elements (BSs and users) are modeled as independent PPPs. That said, it has been recently shown that PCP-based models are well-suited to capture the aforementioned spatial coupling in a similar way as it is incorporated in 3GPP simulation models [1, 9, 10, 11]. Since PCPs are defined in terms of PPPs, they are also very amenable to mathematical analysis. A key prior work in this area is [1], which completely characterized the downlink coverage probability for a PCP-based HetNet model under max- based association scheme in which the typical user connects to the BS offering maximum instantaneous received [1]. However, the downlink analysis for the more practical association scheme in which the typical user connects to the BS offering the strongest received power requires a very different mathematical treatment and is still a key open problem. In this paper, we plug this knowledge gap by providing a complete characterization of coverage probability under this association model.
I-A Background and related works
Since the use of PPPs for modeling HetNets is by now fairly well-known, we advise interested readers to refer to books, surveys and tutorials, such as [12, 13, 14, 15, 16] to learn more about this direction of research. Although sparse, there have been some works on modeling spatial coupling between BSs and users in random spatial models for cellular networks. In [17], user-BS coupling was introduced in a PPP-based single tier cellular network model by conditionally thinning the user PPP and biasing user locations towards the BS locations. Owing to the natural connection of the formation of hotspots to the clustering patterns of PCPs, PCP was used to model the user distributions in [18, 9, 10, 19], where coupling between the users and BS locations was introduced by placing the SBSs at the cluster centers (parent points) of the user PCP. Further, since intra-tier coupling can be either attractive or repulsive, no single point process is the best choice for capturing it. For modeling repulsions, Matérn hard-core process [20, 21], Gauss-Poisson process [22], Strauss hardcore process [23], Ginibre point process [24, 25], and more general determinantal point processes [26] have been used for BS distributions. On the other hand, for modeling attraction, PCP [11] and Geyer saturation process [23] have been proposed. For modeling inter-tier coupling, Poisson hole process (PHP) has been a preferred choice [27, 28], where the macro BSs (MBSs) are modeled as PPP and the SBSs are modeled as another PPP outside the exclusion discs (holes) centered at the MBS locations. Among these “beyond-PPP” spatial models of HetNets, the PCP has attracted significant interest because of its generality in modeling variety of user and BS configurations and its mathematical tractability [29, 1]. We now provide an overview of the existing work on PCP-based models for HetNets.
In [30, 27], the authors assumed that the SBSs in a two-tier HetNet are distributed as a PCP and derived downlink coverage probability assuming that the serving BS is located at a fixed distance from the receiver, which circumvented the need to consider explicit cell association. While this setting provides useful initial insights, the analysis cannot be directly extended to incorporate realistic cell association rules, such as -power based association [31]. The primary challenge in handling cell association in a stochastic geometry setting is to jointly characterize the serving BS distance and the interference field. This challenge does not appear when BS is assumed to lie at a fixed distance from the receiver, such as in [30, 27]. It is worth noting that the distance of the serving BS from the receiver under -power based association can be evaluated using contact distance distributions of PCPs, which have recently been characterized in [32, 33]. However, these alone do not suffice because we need to jointly characterize the serving BS distance and the interference field, which is much more challenging. This is the main reason why this problem has remained open for several years. In [34], the authors characterized handoff rates for a typical user following an arbitrary trajectory in a HetNet with PPP and PCP-distributed BSs. Although the setup is very similar to this paper, the metric considered in [34] did not require the characterization of coverage probability. In [35], the authors developed analytical tools to handle this correlation and derived coverage probability when the BSs are modeled as a Matérn cluster process (MCP). However, the analysis is dependent on the geometrical constructions which is very specific to an MCP and is hence not directly applicable to a general PCP. The coverage analysis for a general PCP was provided in [11] where analytical tractability was preserved by assuming that the SBSs to be operating in a closed access mode, i.e, a user can only connect to a SBS of the same cluster. In [1], we have provided a comprehensive coverage analysis for the unified HetNet model under -based association strategy with threshold greater than unity. However, the analysis cannot be directly extended to the power-based association setup because of the fundamental difference in the two settings from the analytical perspective. Recently, in [36], the open problem of the coverage analysis for a single tier cellular network under -power connectivity with PCP-distributed BSs and independent user locations was solved by expressing coverage probability as a sum-product functional over the parent PPP of the BS PCP. Motivated by this novel analytical approach, in this paper we provide the complete coverage analysis for -power based association strategy for the unified HetNet model introduced in [1].
I-B Contributions
We derive the coverage probability of a typical user of a unified -tier HetNet in which the spatial distributions of BS tiers are modeled as PCPs and BS tiers are modeled as PPPs (). The PCP assumption for the BS tier introduces spatial coupling among the BS locations. We consider two types of users in this network, Type 1: users having no spatial coupling with the BSs, and Type 2: users whose locations are coupled with the BS locations. For Type 1, the user locations are modeled as a stationary point process independent of the BS point processes. For Type 2, the coupling between user and BS locations is incorporated by modeling the user locations as a PCP with each user cluster sharing the same cluster center with a BS cluster. The key contributions are highlighted next.
Exact coverage probability analysis. Assuming that a user connects to the BS offering the maximum average received power, we provide an exact analysis of coverage probability for a typical user which is an arbitrarily selected point from the user point process. The key enabler of the coverage probability analysis is a fundamental property of PCP that conditioned on the parent PPP, the PCP can be viewed as an inhomogeneous PPP, which is a relatively more tractable point process compared to PCP. Using this property, we condition on the parent PPPs of all the BS PCPs and derive the conditional coverage probability. Finally, while deconditioning over the parent PPPs, we observe that the coverage probability can be expressed as the product of PGFLs and sum-product functionals of the parent PPPs. This analytical formulation of coverage probability in terms of known point process functionals over the parent PPPs is the key contribution of the paper and yields an easy-to-compute expression of coverage probability under -power based association. We then specialize the coverage probability for two instances when the PCPs associated with the BSs are either (i) Thomas cluster process (TCP), where the offspring points are normally distributed around the cluster center, or (ii) MCP, where the offspring points are distributed uniformly at random within a disc centered at the cluster center.
System-level insights. Using the analytical results, we study the impact of spatial parameters such as cluster size, average number of points per cluster and BS density on the coverage probability. Our numerical results demonstrate that the variation of coverage probability with cluster size has conflicting trends for Types 1 and 2: for Type 1, coverage decreases as cluster size increases, and for Type 2, coverage increases as cluster size decreases. As cluster size increases, the coverage probabilities under Type 1 and Type 2 approach the same limit which is the well-known coverage probability of the PPP-based -tier HetNet [31], but from two opposite directions. Our numerical results demonstrate that the impact of the variation of cluster size on coverage probability is not as prominent in Type 2 as in Type 1.
II System Model
II-A PCP Preliminaries
Before we introduce the proposed PCP-based system model for -tier HetNet, we provide a formal introduction to PCP.
Definition 1** (Poisson Cluster Process).**
A PCP in can be defined as:
[TABLE]
where is the parent PPP with intensity and denotes the offspring point process corresponding to a cluster center at where is an independently and identically distributed (i.i.d.) sequence of random vectors with probability density function (PDF) . The number of points in is denoted by , where .
Notation. While we reserve the symbol to denote any point process, to indicate whether it is a PCP or PPP we specify the parameters in parentheses accordingly, i.e., denotes a PCP according to Definition 1 and denotes a PPP with intensity .
A PCP can be viewed as a collection of offspring process translated by for each . Then the sequence of points is conditionally i.i.d. with PDF . Note that the conditional distribution of the point coordinates given its cluster center at is equivalent to translating a cluster centered at the origin to . For a PCP, the following result can be established.
Proposition 1**.**
Conditioned on the parent point process , is an inhomogeneous PPP with intensity
[TABLE]
Proof:
While one can prove this result for a more general setting of Cox processes (see [37]), we prove this result for PCP for completeness as follows. Let be the random counting measure associated with the point process . Then, for a Borel set , where is the Borel -algebra on , is a random variable denoting the number of points of falling in . First it is observed that for , since the probability generating function (PGF) of is
[TABLE]
Here follows from the fact that the offspring points are i.i.d. around the cluster center at , and are obtained by using the PGF of Bernoulli and Poisson distributions, respectively. Hence . Now, conditioned on the PGF of is expressed as:
[TABLE]
where follows from the fact that conditioned on , is sequence of i.i.d. offspring point processes, is obtained by substituting the PGF of . Hence it is observed that . Thus is an inhomogeneous PPP with intensity measure . ∎
II-B -tier HetNet Model
We assume a -tier HetNet where BSs of each tier are distributed as a PPP or PCP. Let and denote the index sets of the BS tiers which are modeled as PCP and PPP, respectively, with and . We denote the point process of the BS tier as , where is either a PCP i.e. () where is the parent PPP or a PPP (). Also define . Each BS of transmits at constant power . We assume that the users are distributed according to a stationary point process . We now consider two types of users in the network.
Type 1: No user-BS coupling. The first type of users are uniformly distributed over the network, such as, the pedestrians and users in transit, and their locations are independent of the BS locations. There is no restriction on the distribution of these users as long as the distribution is stationary. For instance, one way of modeling the locations of these users is to assume that they are distributed as a homogeneous PPP.
Type 2: User-BS coupling. The second type of users are assumed to form spatial clusters (also called user hotspots) and their locations can be modeled as a PCP [9, 1]. When the users are clustered, we also assume that one BS tier (say, the tier, ) is deployed to serve the user hotspots, thus introducing coupling between and . In other words, and are two PCPs having same parent PPP . Hence conditioned on , and are (conditionally) independent but not identically distributed. This assumption is motivated by the way SBSs are placed at higher densities in the locations of user hotspots in 3GPP simulation models of HetNets [4, 5].
Remark 1**.**
For Type 1, can be any general stationary point process including PPP and for Type 2, we do not specify of , since does not appear explicitly in the coverage analysis. However, these specifications of are required when one has to characterize other metrics like BS load and rate coverage probability [38, 39]. Further, the coverage probability analysis that follows can be extended for a general user distribution which is the superposition of PPP and PCPs along similar lines to [9].
In Fig. 1, we provide an illustration of the system model. For both types of user distributions, we perform our analysis for a typical user which corresponds to a point selected uniformly at random from . Since is stationary, the typical user is assumed to be located at the origin without loss of generality. For Type 1, since and , are independent, the selection of the typical user does not bias the distribution of . However, for Type 2, the selection of the typical user affects the BS point process due to the existence of user-BS coupling. We assume that the typical user belongs to a cluster centered at . By construction, is always conditioned to have a cluster centered at . Hence, the typical user will see the palm version of which, by Slivnyak’s theorem, is equivalent to the superposition of and where and are independent. For Type 2, we modify as . Consequently, the underlying parent point process is modified as . The BS cluster is termed as the representative cluster.
Considering the typical user at origin, the downlink power received from a BS at is expressed as , where and denote the small scale fading and path-loss exponent, respectively. We assume that each link undergoes Rayleigh fading, hence is a sequence of i.i.d. random variables with . The user connects to the BS providing the maximum received power averaged over fading. Thus, if is the location of the serving BS, then, , where is the location of candidate serving BS in . Note that the candidate serving BS in is the BS in which is geometrically closest to the user. We first define the association event corresponding to the tier as the event that the serving BS belongs to , denoted as . Conditioned on , the experienced by the typical user is
[TABLE]
where is the thermal noise power. We define the coverage probability as the probability of the union of mutually exclusive coverage events
[TABLE]
where we call the term under the summation as the * tier coverage probability* which is the joint probability of the events and . Here is the threshold for the tier required for successful demodulation and decoding of the received signal.
III Coverage Probability Analysis
We begin our coverage analysis by first conditioning on every parent PPP, i.e., . Following Proposition 1, will be inhomogeneous PPP with intensity . A slightly different situation occurs for in Type 2. However, once is modified by adding a point at to the original parent PPP, again becomes an inhomogeneous PPP with intensity .
Notation. To denote the distance of a point , we use and interchangeably.
III-A Contact Distance Distribution
First we will derive the distribution of , , or the distance distribution of the candidate serving BS of tier . Since is the nearest BS to the typical user which is at origin, the distribution of is the same as the contact distance distribution of , denoted as . Let and denote the PDF and CDF of the distance of a randomly selected point of () given its cluster center is located at . Before presenting the contact distance distributions, we observe the following property of the conditional distance distribution.
Lemma 1**.**
If the offspring points are isotropically distributed around the cluster center i.e., the radial coordinates of the offspring points with respect to the cluster center have the joint PDF , where is the marginal PDF of the radial coordinate, then, and . That is, the conditional distance distribution depends only on the magnitude of .
Proof:
Let is the location of the point whose cluster center is located at . Then,
[TABLE]
Here denotes a disc of radius centered at the origin. Differentiating with respect to ,
[TABLE]
Since the region of the integral over is the perimeter of the disc , it is independent of the choice of .∎
We now characterize the PDF of .
Lemma 2**.**
For , conditioned on , the PDF and CDF of are given as:
[TABLE]
and
[TABLE]
Proof:
For , the CDF of is
[TABLE]
The last step is due the fact that integrating a joint PDF of polar coordinates over is equivalent to integrating the marginal PDF of radial coordinate over . The final result in (6) can be obtained by differentiating the CDF with respect to . ∎
Note that one can obtain the PDF of the contact distance of PCP by deconditioning over [36]. This is an alternative approach to the one presented in [32, 33] for the derivation of contact distance distribution of PCP.
When is a PPP, i.e., , the distribution of is the well-known Rayleigh distribution, given by:
[TABLE]
III-B Association Probability and Serving Distance Distribution
We define association probability to the tier as . The association probability is derived as follows.
Lemma 3**.**
Conditioned on , the association probability to the tier is given by:
[TABLE]
where .
Proof:
See Appendix -A. ∎
We now derive the PDF of the conditional serving distance i.e. given and .
Lemma 4**.**
The PDF of conditioned on association to the tier and is given as:
[TABLE]
Proof:
See Appendix -B. ∎
III-C Coverage Probability
Before deriving the main results on coverage probability, we first introduce PGFL and sum-product functional of a point process which will be appearing repeatedly into the coverage analysis.
Definition 2** (PGFL).**
PGFL of a point process is defined as: , where is measurable.
Lemma 5**.**
When is a PPP, the PGFL is given as [37]:
[TABLE]
When and is homogeneous, then (11) becomes:
[TABLE]
Definition 3** (Sum-product functional).**
Sum-product functional of a point process is defined in this paper as , where and are measurable.
For a PPP, the sum-product functional is given by the following Lemma.
Lemma 6**.**
When is a PPP, the sum-product functional is given as [40, 1]
[TABLE]
When , , and is homogeneous, then (13) becomes:
[TABLE]
Before providing the final expression of coverage probability, we provide an important intermediate expression of the conditional tier coverage probability given all parent point processes. In fact, a key contribution of this paper, as will be evident in sequel, is to show that this conditional coverage probability can be factored as a product of standard functionals (such as PGFL and sum-product functional) of the parent PPPs.
Lemma 7**.**
The tier coverage probability given is given by
[TABLE]
where
[TABLE]
and, , where is the Gauss hypergeometric function [31].
Proof:
See Appendix -C. ∎
Looking closely at the expressions of the tier coverage probability given , we find two terms: (i) in (15a) and (15b), and (ii) in (15a). These two terms are respectively product and sum-product over all points of which will be substituted by the PGFL and sum-product functional of while decondtioning over .
Remark 2**.**
In order to apply PGFL and sum-product functional expressions of PPP given by (12) and (14), respectively, we require the condition: . In [36, Appendix B], it was shown that this condition always holds for the form of given by (16).
Until this point, all results were conditioned on . Remember that in Section II-B, we introduced two types of spatial interaction between the users and BSs. Since, by construction, these two types differ only in for some , we were able to treat Type 1 and Type 2 within the same analytical framework. We now present the final expression of for the two types explicitly by deconditioning the conditional coverage probability over in the following Theorems.
Theorem 1** (Type 1).**
The coverage probability is given as:
[TABLE]
where, the tier coverage probability,
[TABLE]
Proof:
When , we get from (15a),
[TABLE]
This step is enabled by the assumption that -s are independent . The final expression is obtained by substituting the PGFL of for from (12) and the sum-product functional of from (14). The final expression follows from some algebraic simplifications. Now, for , from (15b), we get
[TABLE]
We then use the PGFL of from (12) to obtain the final expression. ∎
Theorem 2** (Type 2).**
The coverage probability can be written as (17), where the tier coverage probability is:
[TABLE]
Here denotes the distance distribution of a point of from its cluster center which resides at origin.
Proof:
See Appendix -D. ∎
We conclude this discussion with the following remark.
Remark 3**.**
The analytical framework developed in this Section provisions to model the BS tier, where as any arbitrary PCP . By looking into the expressions of in Theorems 1 and 2, it is apparent that given PCPs with arbitrary distributions, i.e., , the only non-trivial step is to find the conditional distance distributions which need to be simply plugged into the expressions of in (18)-(19).
The unified model discussed in this paper reduces to the conventional PPP-based HetNet model with no spatial coupling between users and BS locations by setting . For this scenario, Type 2 becomes irrelevant and the coverage probability is given by the following Corollary.
Corollary 1**.**
Setting , coverage probability for Type 1 is given by:
[TABLE]
and, for interference-limited networks (),
[TABLE]
Proof:
This result can be obtained directly from (18b) by setting . See [31, 12] for the intermediate steps between (20) and (21). ∎
III-D Special Cases: TCP and MCP
For the purpose of numerical evaluation of coverage probability, we assume that is either a TCP or an MCP which are defined as follows.
Definition 4** (Thomas Cluster Process).**
A PCP is called a TCP if the distribution of the offspring points in is Gaussian around the cluster center at the origin, i.e. for all , if denotes a point of the offspring point process with cluster center at origin,
[TABLE]
Definition 5** (Matérn Cluster Process).**
*A PCP is called an MCP if the distribution of the offspring points in is uniform within a disc of radius around the origin denoted by . Hence, *
[TABLE]
We now provide the conditional distance distributions of TCP and MCP. When is a TCP, given that is the cluster center of , i.e., , we can write the conditional PDF of as [41]:
[TABLE]
where is the modified Bessel function of the first kind with order zero, and,
[TABLE]
When is an MCP, , where
[TABLE]
IV Results and Discussions
We now numerically evaluate the expressions of derived in Theorems 1 and 2. For the numerical evaluation, we choose a two tier network () with one tier of sparsely deployed MBSs and another tier of densely deployed SBSs. The SBSs are distributed as a PCP and the MBSs are distributed as a PPP, i.e., and . We assume that the network is interference limited () and the downlink transmit powers of each BS in and are set such that . Also, is assumed to be denser than , i.e., . We also assume and . We first verify the analytical results presented in Theorems 1 and 2 with Monte Carlo simulations of the network, for which we set and . The values of for different values of from simulation and analysis are plotted in Fig. 2, where Fig. 2(a) and 2(b) corresponds to being TCP and MCP, respectively. The perfect match between simulation and analytical results, indicated by small circles and curves, respectively, verifies the accuracy of our analysis.
IV-A Variation of Cluster Size
In Fig. 2, is plotted for different cluster sizes of . The cluster size precisely refers to when is a TCP (in Fig. 2(a)) and when is an MCP (in Fig. 2(b)). We observe that the cluster size has a conflicting effect on : for Type 1, increases with cluster size and for Type 2, decreases with cluster size. This can be explained as follows. In Type 2, due to the spatial coupling between and , the candidate serving BS of is more likely to belong to the representative cluster (i.e., the BS cluster with the cluster center of the typical user) and as cluster size increases, this candidate serving BS moves farther away from the user on average. On the other hand, for Type 1, as cluster size increases, the BSs of on average lie closer to the typical user. This phenomenon is the consequence of the spatial coupling between BSs and users and is also observed for the - based association strategy in the similar setup [1]. For both types, as cluster size increases, converges to the coverage probability for a two tier network with both BS tiers being modeled as PPP, more precisely, , , with intensities and , respectively. The reason for this convergence is the fact that as cluster size tends to infinity, the limiting distribution of a PCP is a PPP [37]. Since the trends of are very similar for being TCP and MCP, we set as TCP for the rest of the discussion.
Another interesting observation from Fig. 2 is that the variation of with cluster size is not as prominent for Type 2 as it is for Type 1. For further investigation, we focus on the scenario where is a TCP, fix and plot the variation of with in Fig. 3. We observe that the versus curves for Type 2 are almost flat. The reason can be explained as follows. For Type 2, as cluster size is increased, the nearest BS of belonging to the representative cluster lies farther away while the nearest BS of which does not belong to the representative cluster comes closer. Also, as cluster size increases, the intra-cluster interference, i.e., the aggregate interference from the BSs of the representative cluster decreases while the inter-cluster interference, i.e., the aggregate interference from the BSs of except the representative cluster increases. Due to these conflicting effects, the cluster size variation do not impact strongly for Type 2. On the other hand, for Type 1 these conflicts are not present because and are not coupled and hence there is no representative BS cluster.
IV-B Variation of BS Intensity
We now vary the intensity of the parent PPP () keeping constant and plot the coverage probability in Fig. 4. For an interference-limited HetNet with the same threshold for all tiers, it is a well-known result that if the BSs are modeled as PPPs, is independent of the BS intensity. This can be readily verified by putting in (21) which yields . However, once the spatial distribution of BSs is changed to PCP, we see that is rather strongly dependent on the BS intensity under similar set of assumptions. From Fig. 4, we also observe that for large values of , converges to , i.e., the coverage when the BSs are modeled as PPPs.
Remark 4**.**
Although it is difficult to visualize the variation of in the parameter space, which for the two tier network under consideration is , using the results in [42], it is possible to find the trajectories (known as equi-coverage contours) in the parameter space along which remains constant. The family of equicoverage contours are generated by where is a scalar. When is an MCP, a similar result can be obtained by replacing by .
V Conclusion
Although it is more realistic to model BS and user locations of a HetNet as PCPs, the exact characterization of coverage probability for the -power based association strategy for PCP distributed BSs has remained an open problem for a while. The main contribution of this paper is a concrete resolution of this problem. In particular, we developed an analytical framework for evaluating the coverage probability of a typical user in a -tier HetNet model where the locations of a fraction of BS tiers are modeled as PCP and the rest are modeled as PPP. To be consistent with 3GPP HetNet models, we also assumed that the user distribution is either independent of or spatially coupled to the BS distribution. This work, along with our previous work [1] (focused on - based association), provides a complete characterization of downlink coverage probability in the unified HetNet model, which is an important generalization of the well-known baseline PPP-based model.
This work has numerous extensions. An immediate extension is to study other key performance metrics such as rate coverage probability and percentile rates which will take into account the distributions of load or the number of users connected to the BSs. From stochastic geometry perspective, this will necessitate characterizing the Voronoi cells generated by PCP-distributed BSs whose properties are not well-studied in the literature. From a modeling perspective, another extension is to incorporate more realistic channel models including shadowing, blocking and general pathloss, e.g. in the context of millimeter wave (mm-wave) communication. Especially for mm-wave integrated access and backhaul (IAB) in 5G [43], the PCP is a natural candidate for modeling the locations of the SBSs forming clusters around the MBS that provides wireless backhaul over mmWave links. More generally, the framework developed in this paper will lay the foundation to the performance analysis of such networks where the spatial coupling between the BS and user locations cannot be ignored.
-A Proof of Lemma 3
When ,
[TABLE]
Here follows from the fact that -s are independent, follows from Lemma 2, and denotes the complementary CDF (CCDF) of . When ,
[TABLE]
where the last step follows from Lemma 2.
-B Proof of Lemma 4
The conditional CCDF of given and : is given by:
[TABLE]
Now
[TABLE]
This expression is similar to the expression appearing in the computation of association probability with the additional event that which can be handled by changing the lower limit of the integral in (9). The final step is to differentiate the CCDF with respect to .
-C Proof of Lemma 7
We first compute the probability of the coverage event given as follows.
[TABLE]
where
[TABLE]
Here follows from the fact that , follows from the assumption that all links undergo i.i.d. fading, and is justified since in , there exists no points inside the disc , which is known as the exclusion disc. In the last step, we use the PGFL of PPP from Lemma 5. When , substituting from (10a),
[TABLE]
In the last step, we substitute . The final expression is obtained by some algebraic simplification. When , substituting in (26) by (10b), we get
[TABLE]
The final expression is obtained by some algebraic simplification.
-D Proof of Theorem 2
When ,
[TABLE]
As opposed to Type 1, the product over all points of has to be handled explicitly. The PGFL of for Type 2 evaluated at is given by
[TABLE]
This step is enabled by the fact that and are independent. Substituting and proceeding on similar lines of the proof of Theorem 1, we obtain the final expression. Also note that since the function of under consideration is only dependent on , while taking expectation over , it is sufficient to consider the magnitude distribution of which is denoted as . Now when ,
[TABLE]
where the last term in the expression under integral is the sum-product functional over which is computed as:
[TABLE]
The final expression can be obtained by proceeding on similar lines of the proof of Theorem 1. Now, for ,
[TABLE]
Since expression is very similar to the expression of obtained for , we omit the next steps leading to the final expression.
The reference list from the paper itself. Each links out to its DOI / PubMed record.
- 1[1] C. Saha, M. Afshang, and H. S. Dhillon, “3GPP-inspired Het Net model using Poisson cluster process: Sum-product functionals and downlink coverage,” IEEE Trans. on Commun. , vol. 66, no. 5, pp. 2219–2234, May 2018.
- 2[2] M. Mirahsan, R. Schoenen, and H. Yanikomeroglu, “Het Het Nets: Heterogeneous traffic distribution in heterogeneous wireless cellular networks,” IEEE Journal on Sel. Areas in Commun. , vol. 33, no. 10, pp. 2252–2265, Oct. 2015.
- 3[3] Y. Zhong, G. Wang, R. Li, T. Han, X. Ge, and T. Q. Quek, “Effect of spatial and temporal traffic statistics on the performance of wireless networks,” 2018, available online: arxiv.org/abs/1804.06754.
- 4[4] 3GPP TR 36.872 V 12.1.0 , “3rd generation partnership project; technical specification group radio access network; small cell enhancements for E-UTRA and E-UTRAN - physical layer aspects (release 12),” Tech. Rep., Dec. 2013.
- 5[5] 3GPP TR 36.932 V 13.0.0 , “3rd generation partnership project; technical specification group radio access network; scenarios and requirements for small cell enhancements for E-UTRA and E-UTRAN; (release 13),” Tech. Rep., Dec. 2015.
- 6[6] 3GPP TR 36.814, “Further advancements for E-UTRA physical layer aspects,” Tech. Rep., 2010.
- 7[7] J. Andrews, F. Baccelli, and R. Ganti, “A tractable approach to coverage and rate in cellular networks,” IEEE Trans. on Commun. , vol. 59, no. 11, pp. 3122–3134, 2011.
- 8[8] H. S. Dhillon, R. K. Ganti, F. Baccelli, and J. G. Andrews, “Modeling and analysis of K 𝐾 K -tier downlink heterogeneous cellular networks,” IEEE Journal on Sel. Areas in Commun. , vol. 30, no. 3, pp. 550–560, Apr. 2012.