Laboratory spectroscopic study of isotopic thioformaldehyde, H$_{2}$CS, and determination of its equilibrium structure
H. S. P. M\"uller, A. Maeda, S. Thorwirth, F. Lewen, S. Schlemmer, I., R. Medvedev, M. Winnewisser, F. C. De Lucia, and E. Herbst

TL;DR
This study provides highly accurate spectroscopic parameters for isotopic thioformaldehyde, enabling precise predictions of its rotational spectra in the submillimeter and terahertz regions, which is crucial for interstellar medium research.
Contribution
The paper reports new and improved spectroscopic parameters for seven isotopic species of H2CS, extending prediction accuracy into the terahertz frequency range.
Findings
Spectroscopic parameters enable predictions above 1 THz for most isotopologs.
Accurate laboratory data improve interstellar medium molecular identification.
Predictions for H2(13)C(34)S are reliable up to around 700 GHz.
Abstract
Thioformaldehyde is an abundant molecule in various regions of the interstellar medium. However, available laboratory data limit the accuracies of calculated transition frequencies in the submillimeter region, in particular for minor isotopic species. We aim to determine spectroscopic parameters of isotopologs of H2CS that are accurate enough for predictions well into the submillimeter region. We investigated the laboratory rotational spectra of numerous isotopic species in natural isotopic composition almost continuously between 110 and 377 GHz. Individual lines were studied for most species in two frequency regions between 566 and 930 GHz. Further data were obtained for the three most abundant species in the 1290-1390 GHz region. New or improved spectroscopic parameters were determined for seven isotopic species. Quantum-chemical calculations were carried out to evaluate the…
Click any figure to enlarge with its caption.
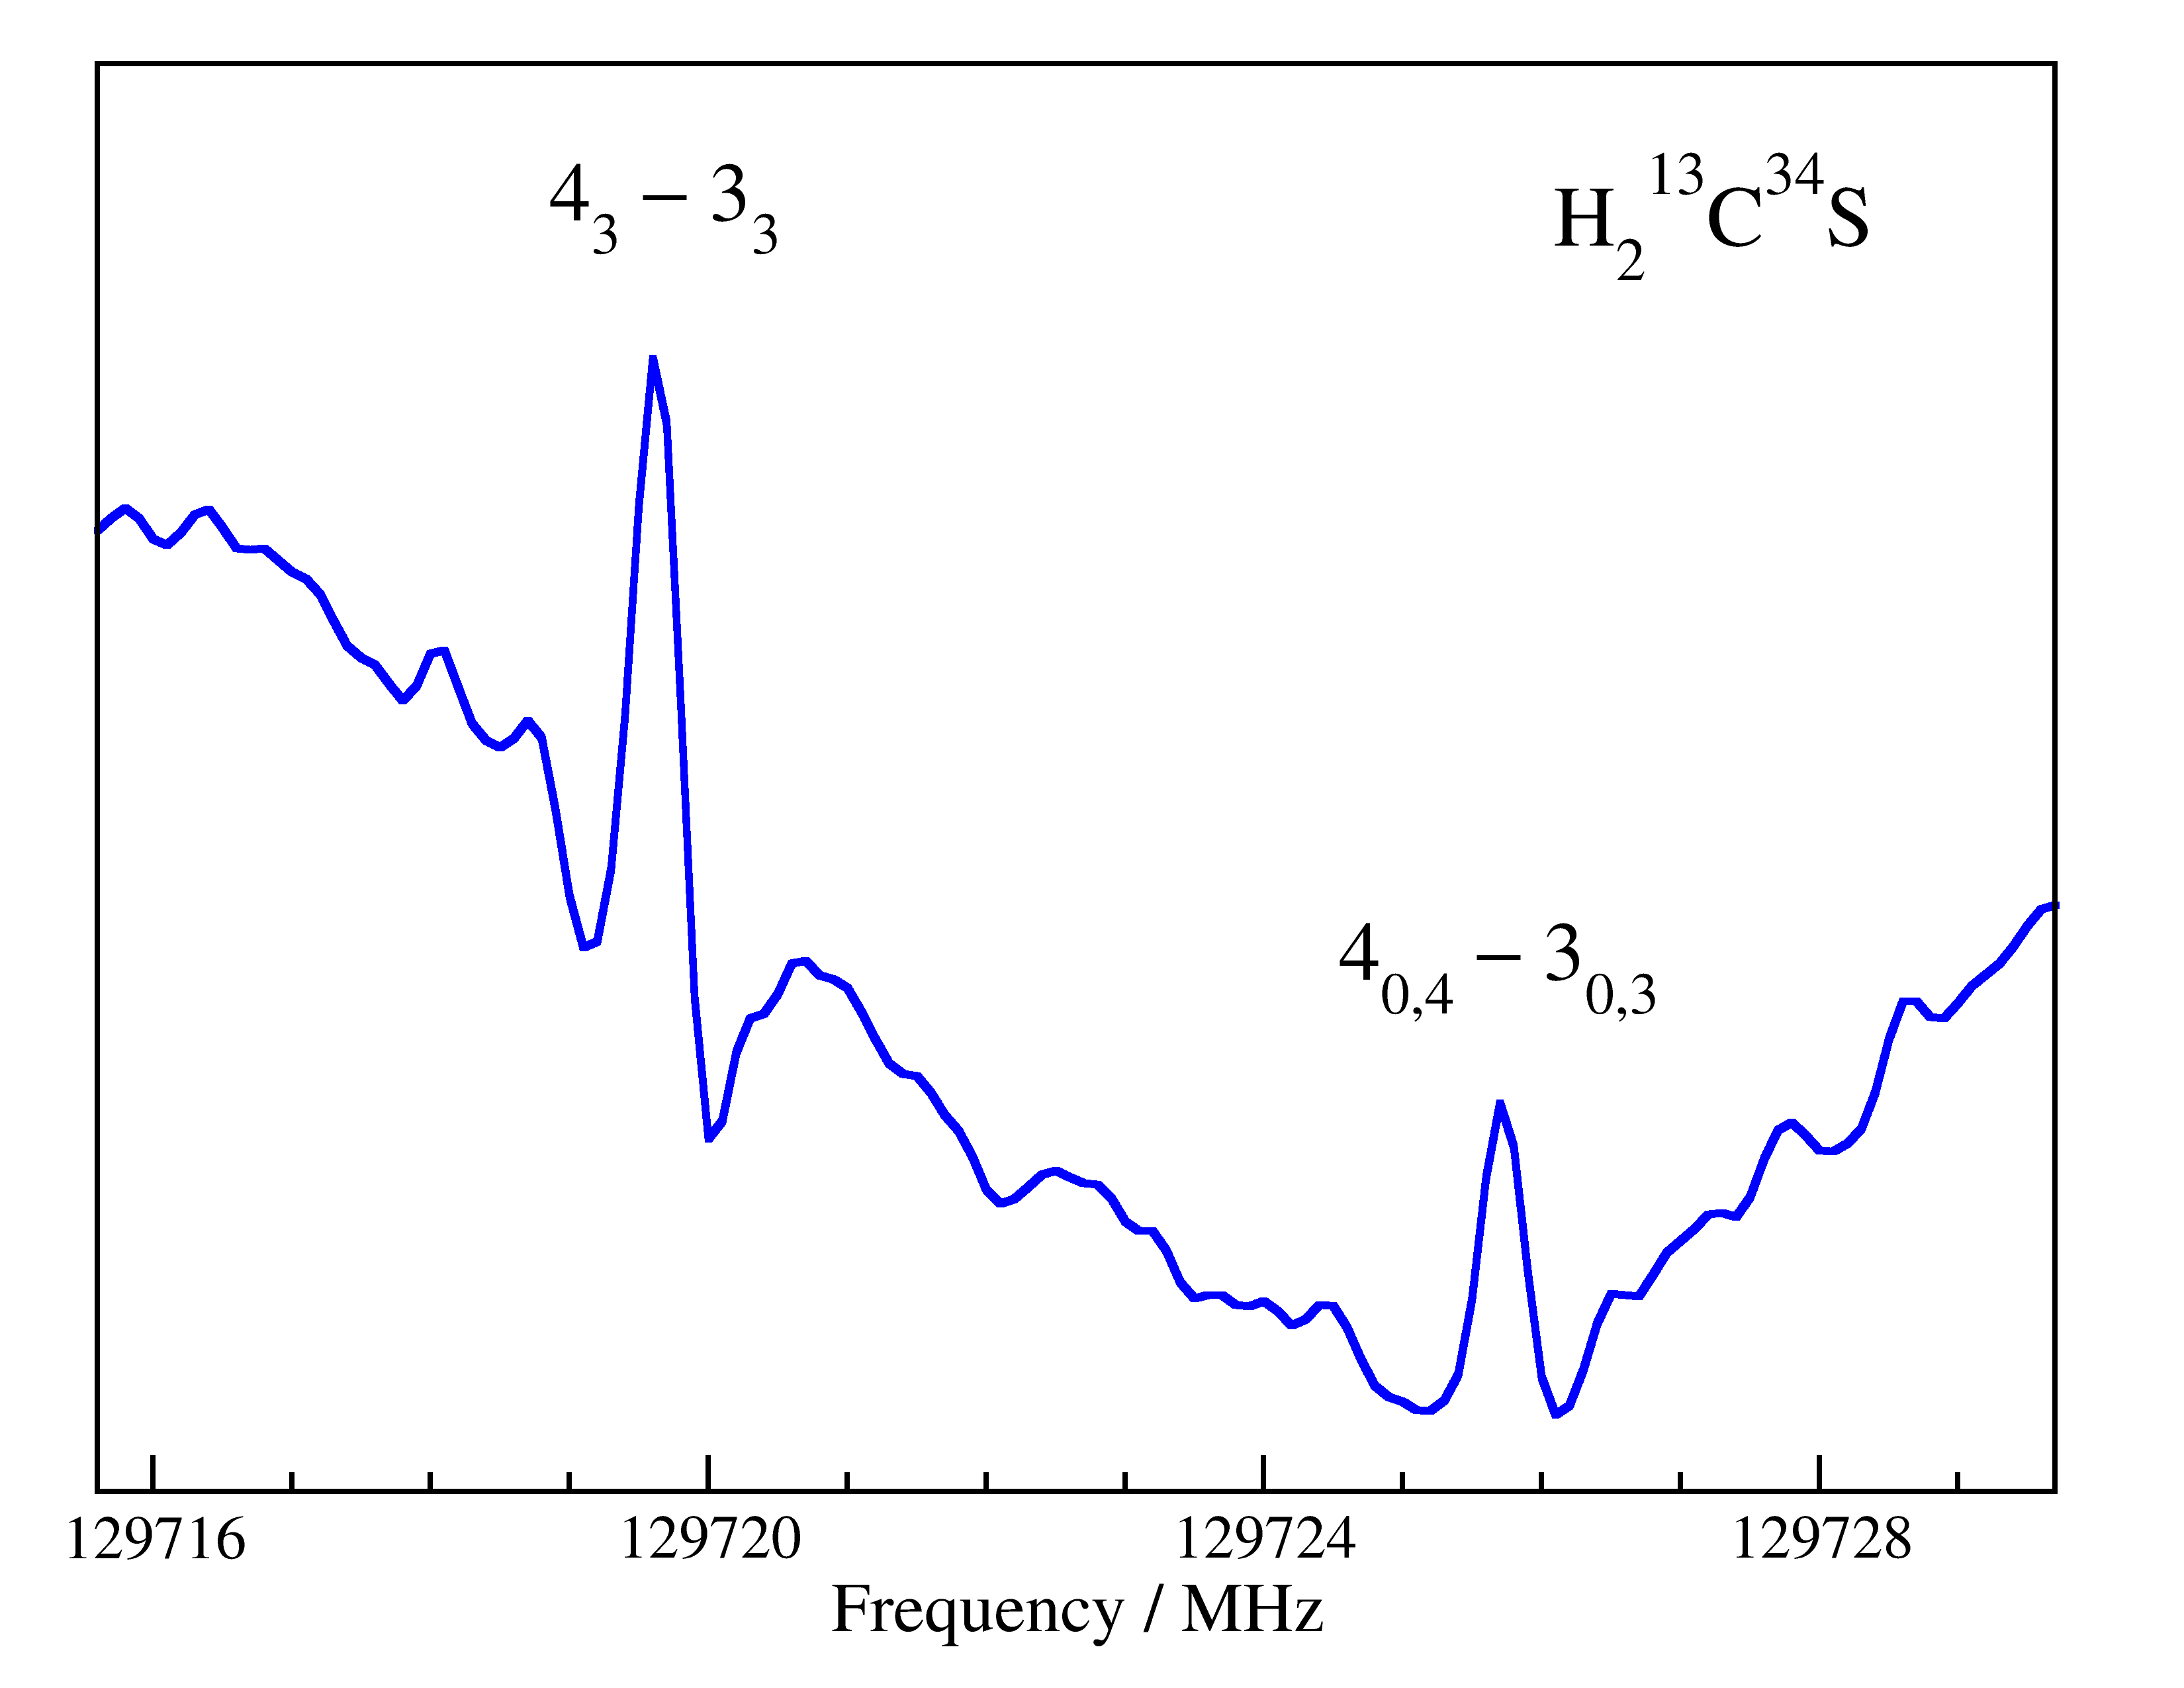 Figure 1
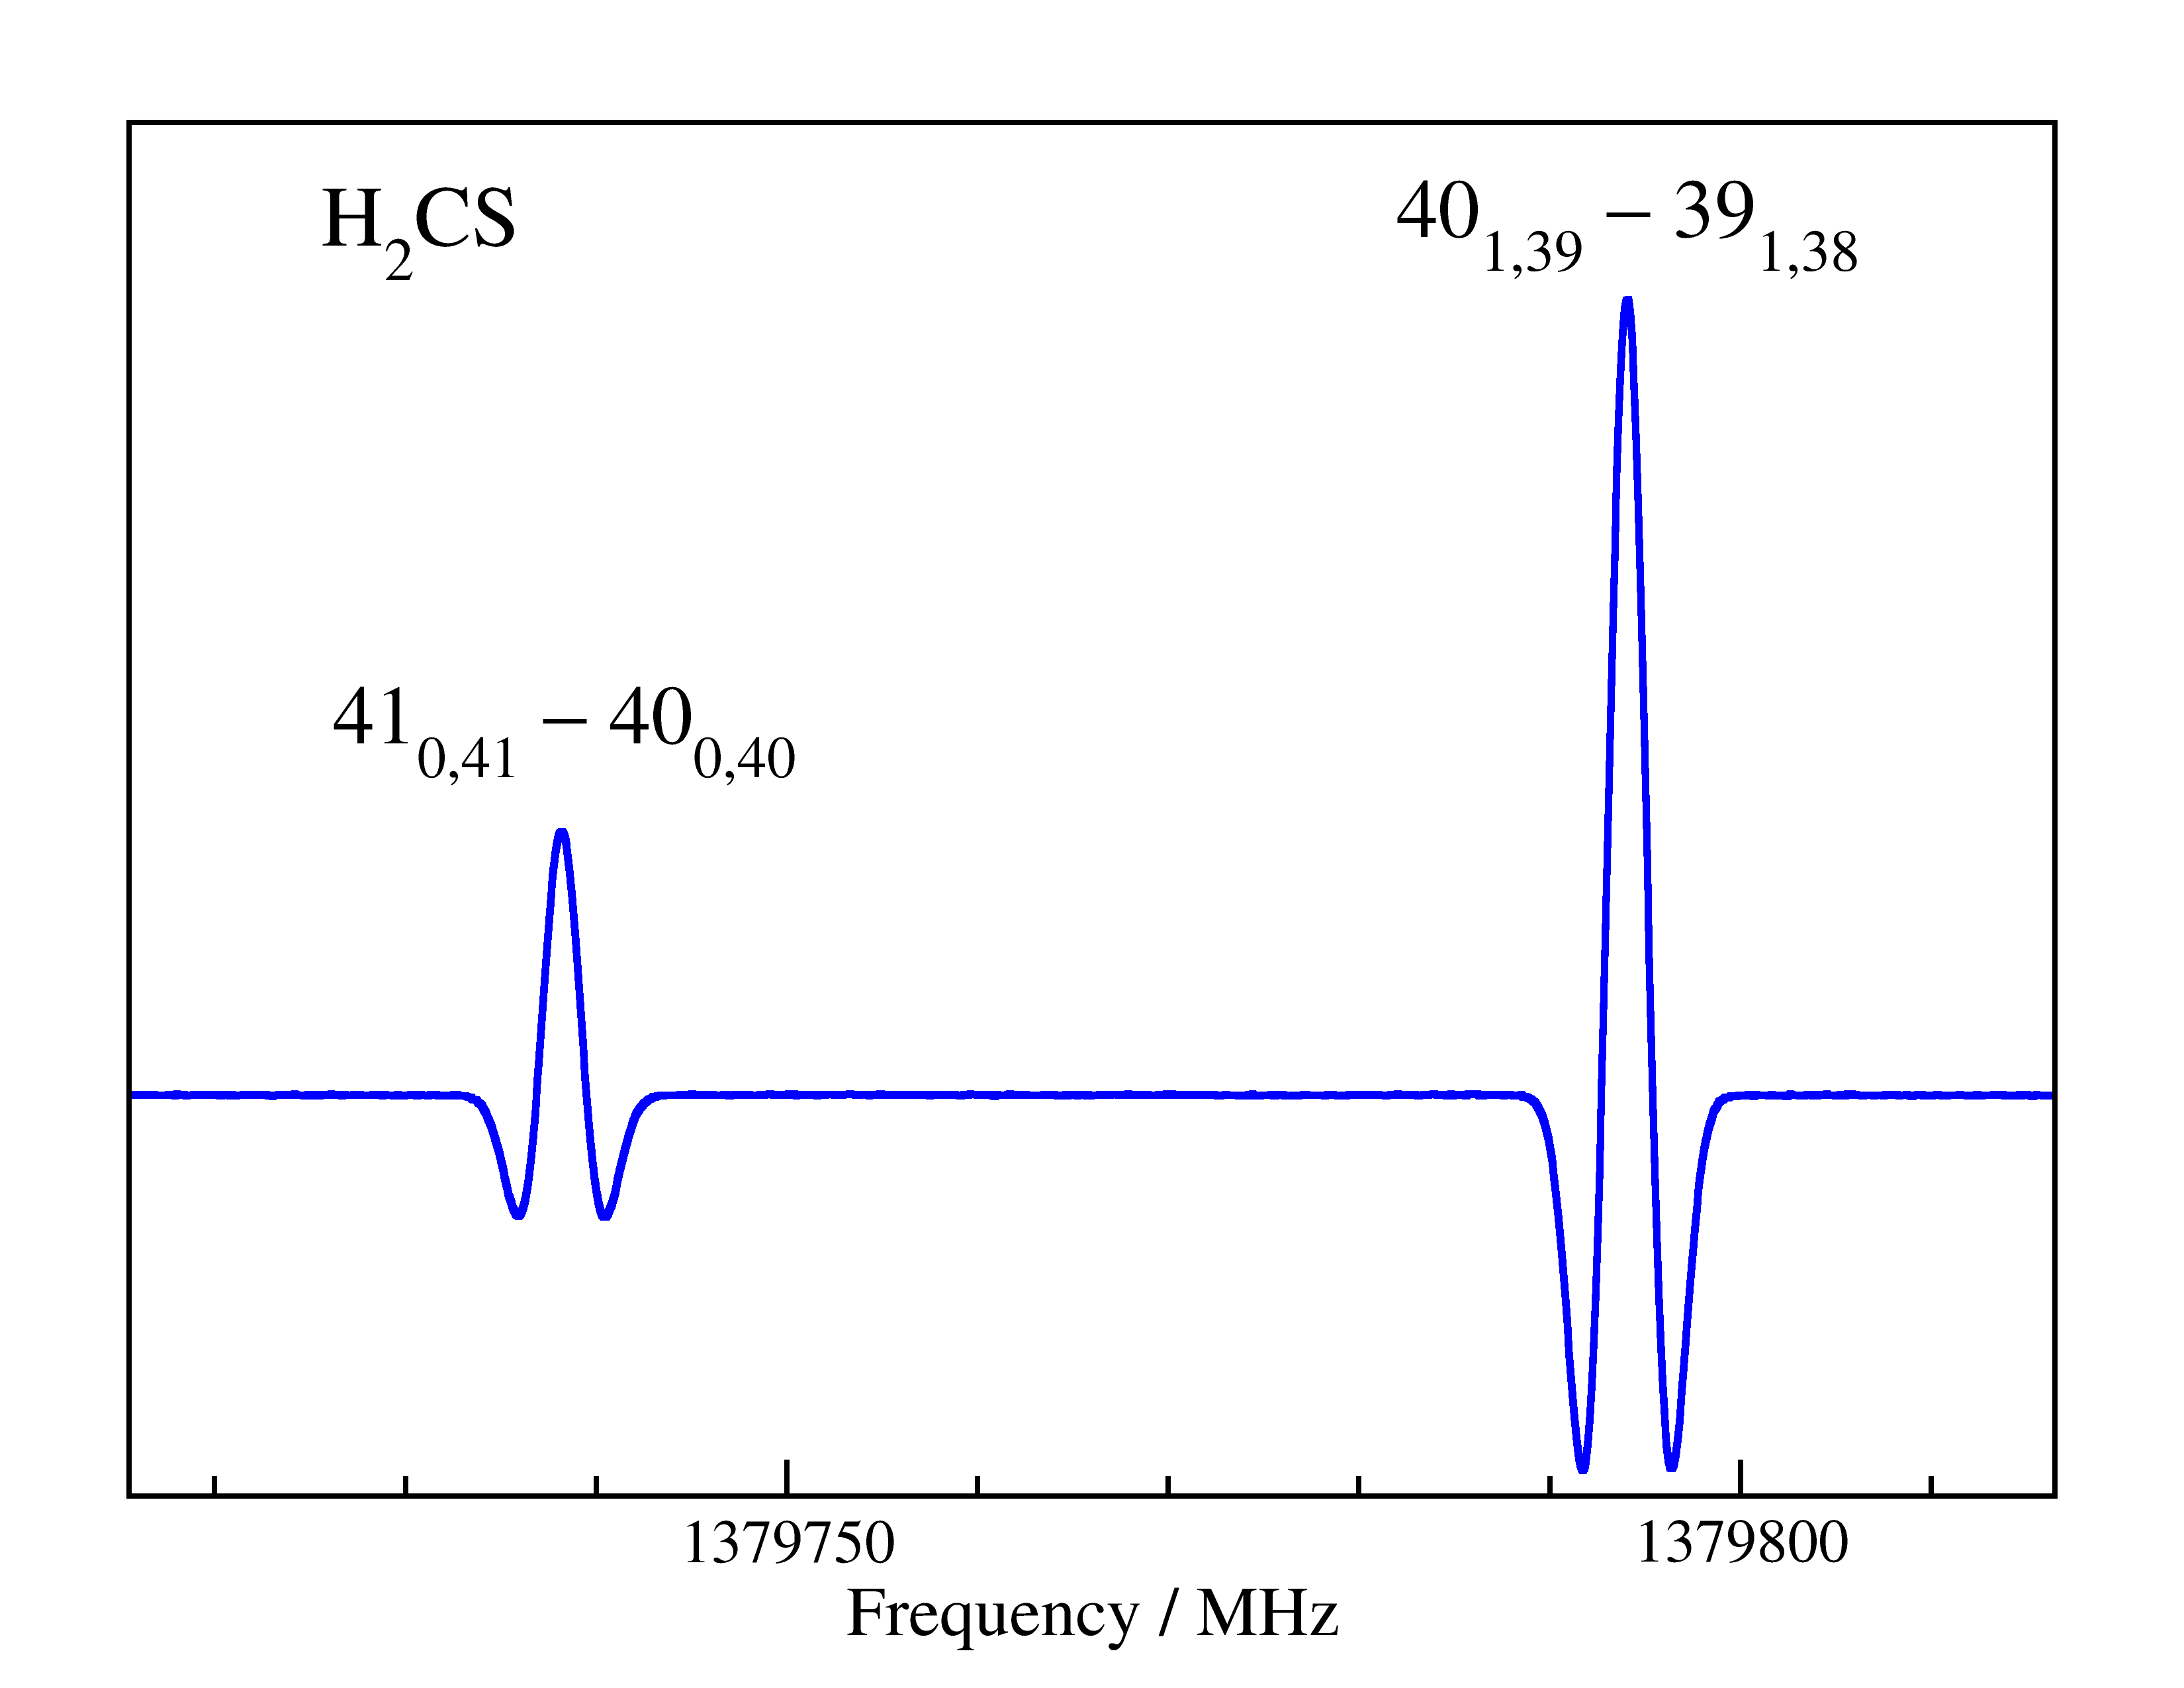 Figure 2
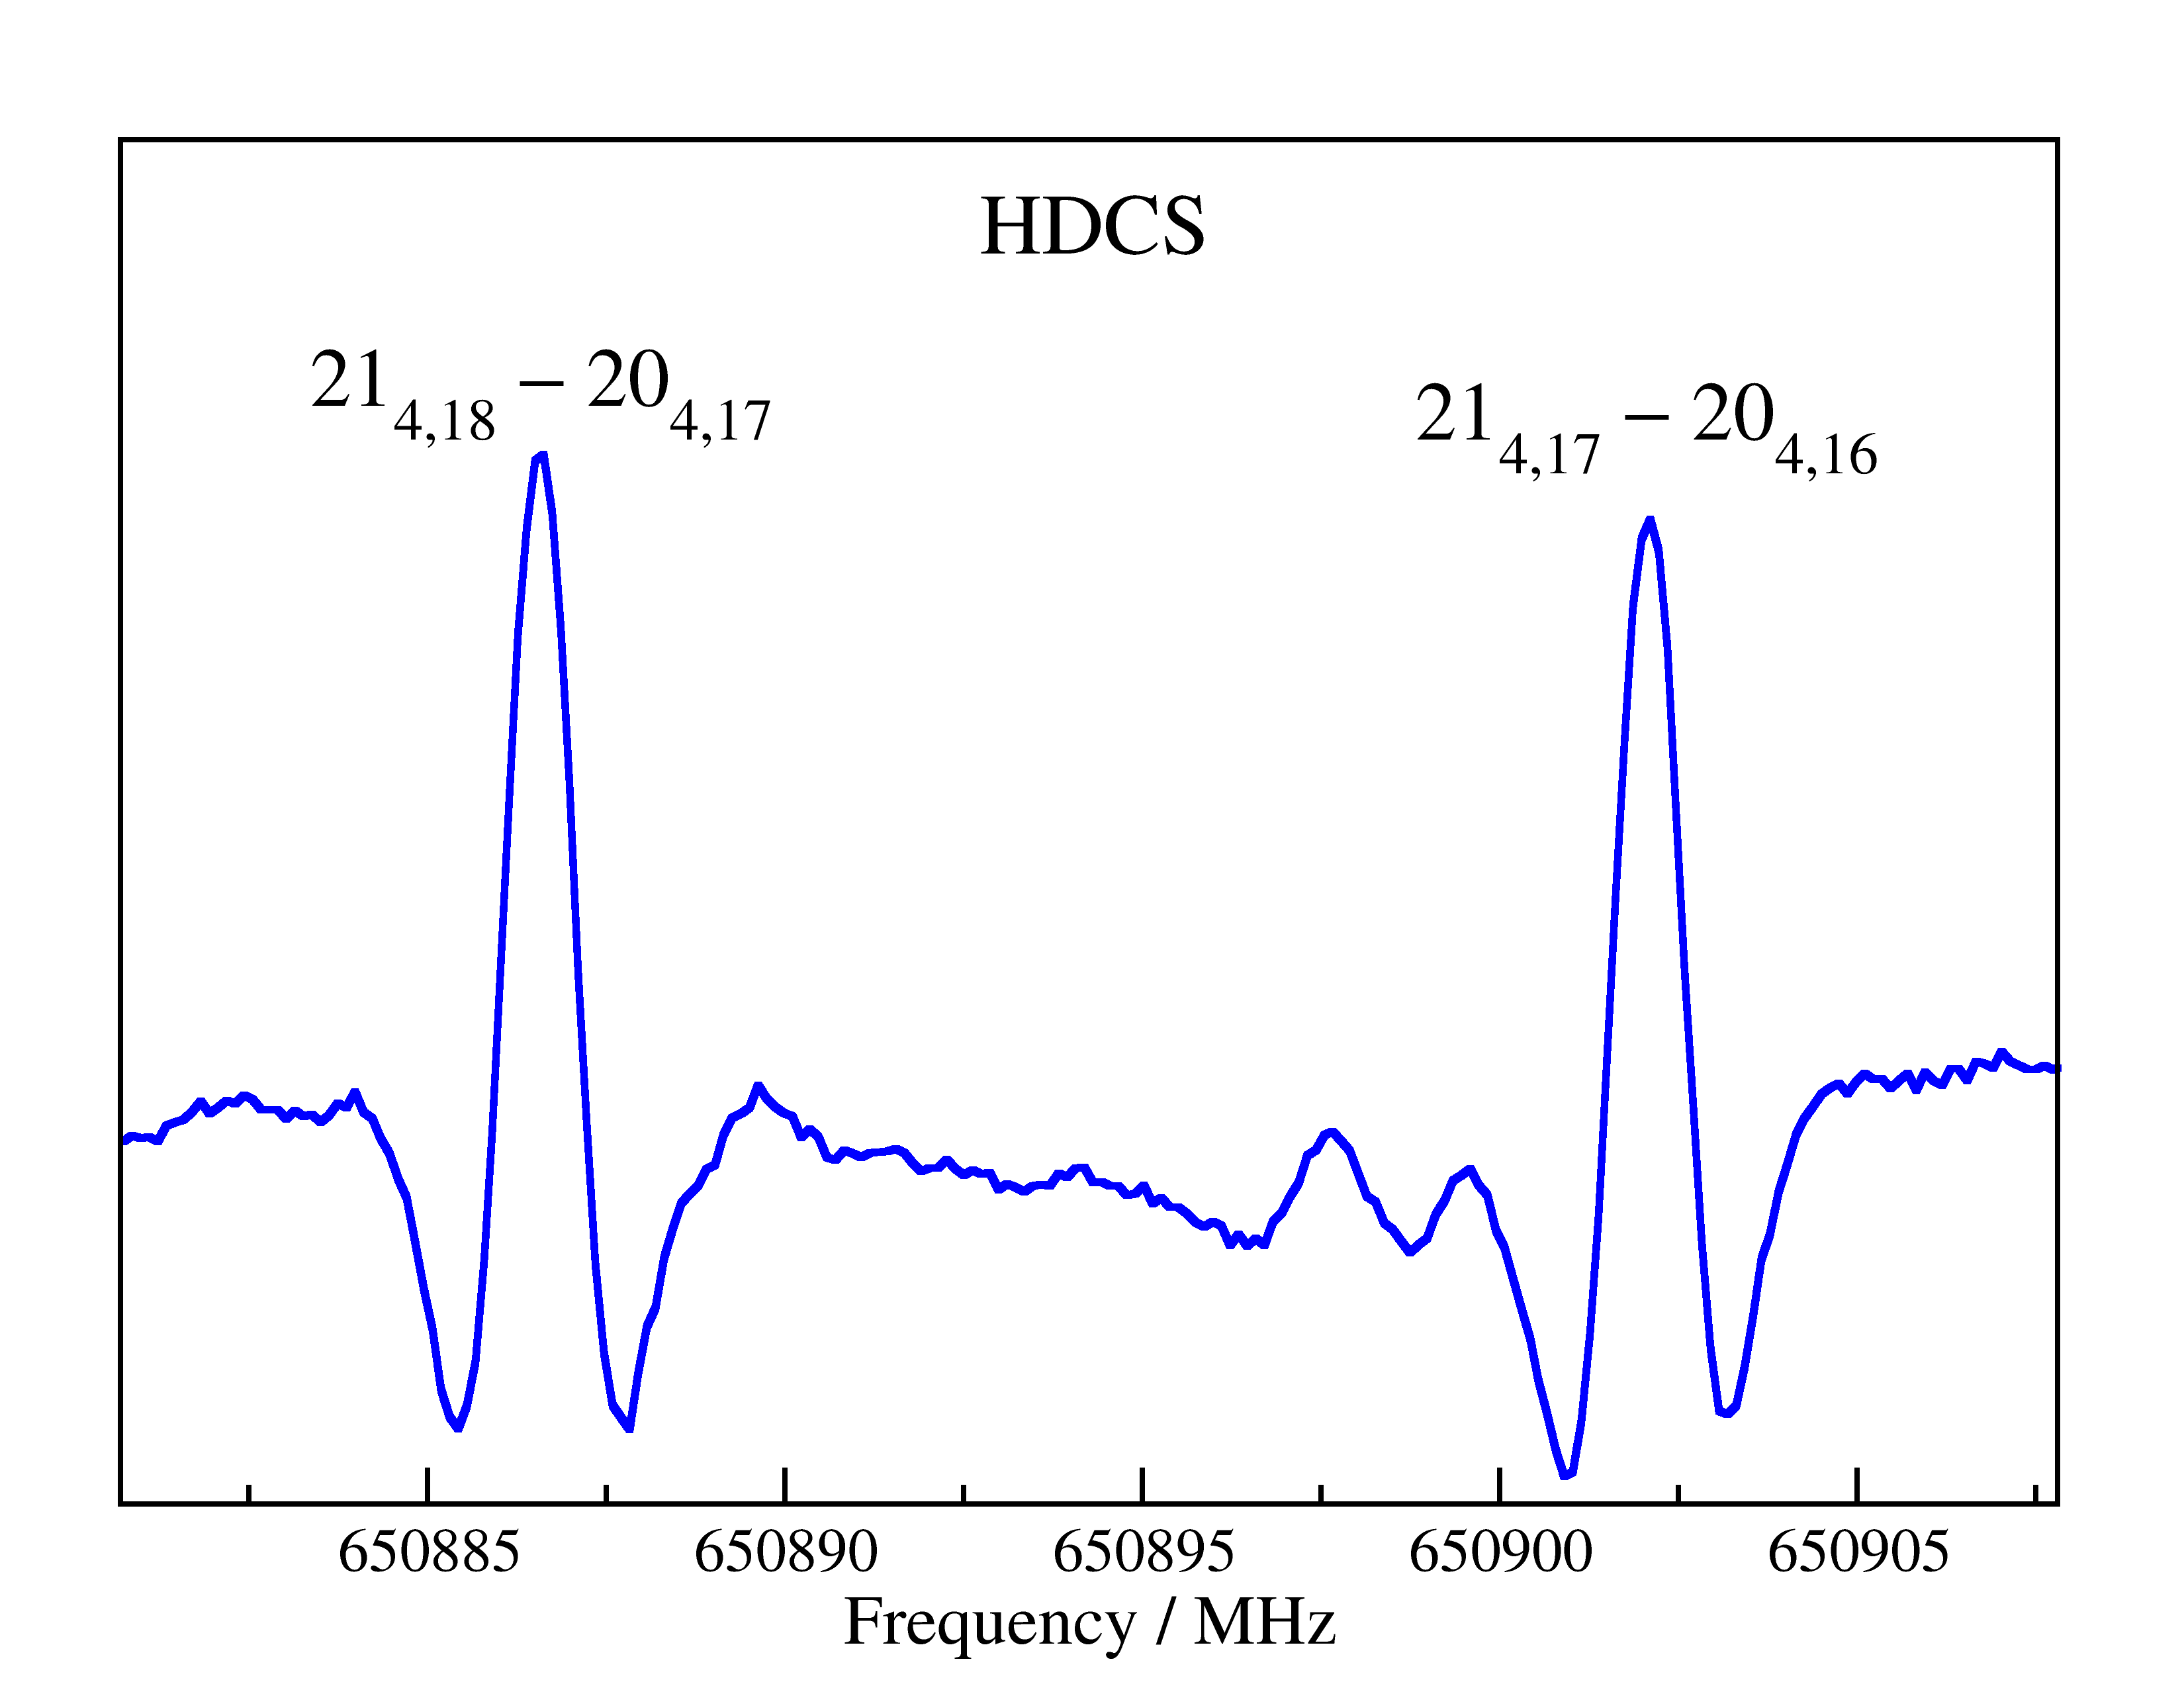 Figure 3
| Parameter | H2CS | H2C33S | H2C34S | H2C36S | ||||
|---|---|---|---|---|---|---|---|---|
| 274437 | .5932 (115) | 274588 | .054 (306) | 274729 | .12 (34) | 274987 | .91 (94) | |
| 17175 | .745955 (196) | 17024 | .740821 (110) | 16882 | .911552 (112) | 16621 | .73726 (35) | |
| 261 | .6240523 (165) | 257 | .050936 (39) | 252 | .793027 (73) | 245 | .04552 (43) | |
| 23 | .34378 (164) | 23 | .408 | 23 | .468 (141) | 23 | .6 | |
| 0 | .5222938 (43) | 0 | .5132638 (95) | 0 | .5048431 (51) | 0 | .489486 (38) | |
| 19 | .01875 (39) | 18 | .700456 (105) | 18 | .404173 (172) | 17 | .86334 (29) | |
| 1 | .208429 (105) | 1 | .176656 (78) | 1 | .148425 (108) | 1 | .09806 (36) | |
| 0 | .1773270 (222) | 0 | .171180 (81) | 0 | .165589 (136) | 0 | .15585 (27) | |
| 5 | .946 (35) | 5 | .97 | 6 | .00 | 6 | .05 | |
| 28 | .155 (86) | 27 | .839 (211) | 28 | .071 (109) | 28 | .16 (61) | |
| 1 | .50409 (270) | 1 | .4502 (39) | 1 | .41629 (70) | 1 | .3346 (203) | |
| 5 | .81 (32) | 5 | .46 | 5 | .100 (40) | 4 | .48 | |
| 3 | .018 (141) | 2 | .792 | 2 | .600 (37) | 2 | .216 | |
| 1 | .6472 (140) | 1 | .524 | 1 | .415 (49) | 1 | .209 | |
| 0 | .3619 (73) | 0 | .3393 | 0 | .3186 (144) | 0 | .2796 | |
| 2 | .109 (206) | 2 | .00 | 2 | .00 | 2 | .00 | |
| 21 | .36 (69) | 23 | .18 (128) | 20 | .86 (65) | 20 | .37 | |
| 0 | .2032 (90) | 0 | .200 | 0 | .197 | 0 | .1909 | |
| 10 | .32 (81) | 9 | .66 | 9 | .0 | 7 | .85 | |
| 0 | .833 (87) | 0 | .766 | 0 | .700 | 0 | .588 | |
| 0 | .358 (47) | 0 | .330 | 0 | .304 | 0 | .258 | |
| 18 | .63 (180) | 18 | .8 | 19 | .0 | 19 | .0 | |
| Parameter | exptl. | B3LYP | MP2 | ae-MP2 | ae-CCSD(T) | |||||
|---|---|---|---|---|---|---|---|---|---|---|
| 11 | .8893 (124) | 12 | .27 | 10 | .31 | 9 | .99 | 12 | .818 | |
| 49 | .9668 (156) | 50 | .26 | 49 | .08 | 48 | .93 | 50 | .030 | |
| c | 38 | .0775 (158) | 37 | .99 | 38 | .77 | 38 | .94 | 37 | .212 |
| 475 | .5 (24) | 526 | .5 | 469 | .3 | 468 | .5 | 456 | .0 | |
| 13 | .6 | 15 | .28 | 13 | .61 | 13 | .63 | 13 | .6 | |
| 10 | .68 (105) | 10 | .98 | 10 | .29 | 10 | .33 | 10 | .2 | |
| Parameter | HCS | HC34S | HDCS | D2CS | ||||
|---|---|---|---|---|---|---|---|---|
| 275113 | .82 (35) | 275418 | .9 (161) | 187214 | .14 (44) | 132198 | .92 (26) | |
| 16514 | .989247 (141) | 16219 | .21918 (122) | 15501 | .179704 (242) | 14200 | .0562 (59) | |
| 241 | .898578 (82) | 233 | .32414 (81) | 304 | .81583 (44) | 352 | .105440 (153) | |
| 23 | .465 (129) | 23 | .51 | 13 | .364 (198) | 5 | .5 | |
| 0 | .4960263 (70) | 0 | .478799 (57) | 0 | .3208611 (107) | 0 | .29091 (146) | |
| 17 | .692846 (203) | 17 | .0998 (66) | 15 | .40446 (68) | 12 | .492 (158) | |
| 1 | .071785 (122) | 1 | .01853 | 1 | .38941 (86) | 1 | .40268 (225) | |
| 0 | .152488 (113) | 0 | .14239 | 0 | .23009 (42) | 0 | .28995 (37) | |
| 6 | .00 | 6 | .00 | 3 | .0 | 0 | .75 | |
| 25 | .846 (164) | 25 | .77 | 37 | .662 (110) | 4 | .7 | |
| 1 | .34969 (281) | 1 | .271 | 1 | .2332 (61) | 0 | .88 | |
| 5 | .660 (45) | 4 | .97 | 1 | .885 (288) | 1 | .3 | |
| 2 | .577 (39) | 2 | .21 | 2 | .75 (52) | 3 | .0 | |
| 1 | .292 (38) | 1 | .11 | 1 | .92 (32) | 1 | .719 (109) | |
| 0 | .3009 (110) | 0 | .2645 | 0 | .50 | 0 | .792 (33) | |
| 2 | .00 | 2 | .00 | |||||
| 22 | .16 (106) | 21 | .65 | |||||
| 0 | .189 | 0 | .183 | |||||
| 10 | .06 | 8 | .80 | |||||
| 0 | .750 | 0 | .630 | |||||
| 0 | .320 | 0 | .272 | |||||
| 19 | .0 | 19 | .0 | |||||
| Isotopolog | |||
|---|---|---|---|
| HCS | 5 | ||
| 2ua | |||
| 0 | |||
| H2C34S | 5 | ||
| 4 | |||
| 3 | |||
| H2C33S | 6 | ||
| 5 | |||
| 4 |
| Parameter | H2COb | H2CSc | H2SiOd | H2SiSe | ||||
|---|---|---|---|---|---|---|---|---|
| 245551 | .4495 (40) | 274437 | .5932 (115) | 148946 | .49 (173) | 162498 | .0 (14) | |
| 36419 | .11528 (25) | 17175 | .745955 (196) | 17711 | .07958 (33) | 7844 | .48028 (22) | |
| 1207 | .4358721 (33) | 261 | .6240523 (165) | 483 | .74088 (50) | 93 | .23731 (28) | |
| 19 | .39136 (53) | 23 | .34378 (164) | 7 | .63 (87) | 9 | .811 | |
| 1 | .3211073 (93) | 0 | .5222938 (43) | 0 | .610532 (60) | 0 | .151376 (44) | |
| 70 | .32050 (50) | 19 | .01875 (39) | 16 | .1803 (94) | 3 | .92823 (27) | |
| 10 | .437877 (47) | 1 | .208429 (105) | 2 | .08116 (236) | 0 | .19581 (35) | |
| 2 | .501496 (33) | 0 | .1773270 (222) | 0 | .6712 (48) | 0 | .02938 (17) | |
| 4 | .027 (22) | 5 | .946 (35) | 1 | .0f | 1 | .6f | |
| 10 | .865 (79) | 28 | .155 (86) | 43 | .324 (297) | 18 | .8 (15) | |
| 7 | .465 (16) | 1 | .50409 (270) | 3 | .409 (65) | 0 | .246 (34) | |
| 3 | .54 (33) | 5 | .81 (32) | |||||
| 32 | .272 (58) | 3 | .018 (141) | |||||
| 47 | .942 (74) | 1 | .6472 (140) | |||||
| 15 | .966 (15) | 0 | .3619 (73) | |||||
| 0 | .610 (177) | 2 | .109 (206) | |||||
| 5 | .85 (19) | 21 | .36 (69) | |||||
| 0 | .367 (85) | 0 | .2032 (90) | |||||
| 105 | .7 (92) | 10 | .32 (81) | |||||
| 0 | .833 (87) | |||||||
| 0 | .358 (47) | |||||||
| 0 | .345(50) | |||||||
| 0 | .427(19) | |||||||
| 0 | .1520 (32) | |||||||
| 18 | .63 (180) | |||||||
| 3 | .33 | |||||||
| Species | (B3LYP) | (MP2) | (CCSD(T)) | (CCSD(T) | |||||||||||||
|---|---|---|---|---|---|---|---|---|---|---|---|---|---|---|---|---|---|
| H2CS | 291613 | .34 | 1671 | .810 | 1900 | .593 | 1958 | .684 | 843 | .435 | 0 | .608 | 294414 | .850 | |||
| 17698 | .994 | 63 | .975 | 68 | .066 | 74 | .002 | 1 | .294 | 0 | .608 | 17773 | .682 | ||||
| 16652 | .498 | 98 | .197 | 102 | .170 | 108 | .190 | 0 | .218 | 0 | .912 | 16761 | .817 | 0 | .000064 | ||
| H2C33S | 291612 | .9 | 1672 | .606 | 1901 | .179 | 1959 | .382 | 843 | .435 | 0 | .598 | 294415 | .07 | |||
| 17538 | .843 | 63 | .279 | 67 | .354 | 73 | .212 | 1 | .282 | 0 | .598 | 17612 | .739 | ||||
| 16510 | .639 | 96 | .945 | 100 | .900 | 106 | .845 | 0 | .216 | 0 | .897 | 16618 | .596 | 0 | .000049 | ||
| H2C34S | 291612 | .0 | 1673 | .333 | 1901 | .704 | 1960 | .038 | 843 | .435 | 0 | .588 | 294414 | .91 | |||
| 17388 | .498 | 62 | .627 | 66 | .686 | 72 | .472 | 1 | .271 | 0 | .588 | 17461 | .653 | ||||
| 16377 | .325 | 95 | .774 | 99 | .712 | 105 | .586 | 0 | .215 | 0 | .882 | 16484 | .009 | 0 | .000030 | ||
| H2C36S | 291609 | .7 | 1674 | .700 | 1902 | .681 | 1961 | .244 | 843 | .435 | 0 | .571 | 294413 | .75 | |||
| 17111 | .828 | 61 | .430 | 65 | .458 | 71 | .122 | 1 | .251 | 0 | .571 | 17183 | .630 | ||||
| 16131 | .646 | 93 | .630 | 97 | .537 | 103 | .282 | 0 | .211 | 0 | .857 | 16235 | .996 | 0 | .000019 | ||
| HCS | 291628 | .8 | 1657 | .739 | 1884 | .781 | 1943 | .937 | 843 | .435 | 0 | .567 | 294415 | .62 | |||
| 16998 | .786 | 59 | .621 | 63 | .806 | 69 | .345 | 1 | .243 | 0 | .567 | 17068 | .807 | ||||
| 16031 | .192 | 91 | .529 | 95 | .565 | 101 | .210 | 0 | .210 | 0 | .850 | 16133 | .462 | 0 | .000008 | ||
| HC34S | 291638 | . | 1658 | .041 | 1885 | .861 | 1944 | .755 | 843 | .435 | 0 | .548 | 294426 | . | |||
| 16685 | .867 | 57 | .814 | 61 | .982 | 67 | .761 | 1 | .220 | 0 | .548 | 16754 | .300 | ||||
| 15752 | .571 | 89 | .600 | 93 | .602 | 98 | .981 | 0 | .206 | 0 | .822 | 15852 | .580 | 0 | .000705 | ||
| HDCS | 202715 | .3 | 930 | .335 | 1041 | .110 | 1070 | .464 | 585 | .478 | 0 | .466 | 204370 | .79 | |||
| 16110 | .811 | 56 | .576 | 58 | .665 | 64 | .156 | 1 | .178 | 0 | .466 | 16175 | .679 | ||||
| 14891 | .548 | 88 | .063 | 90 | .525 | 95 | .721 | 0 | .195 | 0 | .699 | 14988 | .163 | 0 | .00255 | ||
| D2CS | 146399 | .0 | 645 | .743 | 736 | .128 | 751 | .566 | 422 | .765 | 0 | .369 | 147572 | .97 | |||
| 14904 | .267 | 50 | .835 | 51 | .155 | 56 | .344 | 1 | .089 | 0 | .369 | 14961 | .330 | ||||
| 13495 | .845 | 80 | .217 | 80 | .936 | 85 | .563 | 0 | .177 | 0 | .554 | 13582 | .139 | 0 | .00547 | ||
| Methodb | (CS) | r(CH) | (HCS) | |||
|---|---|---|---|---|---|---|
| B3LYP/TZ | 160 | .614 | 108 | .786 | 122 | .202 |
| B3LYP/QZ | 160 | .516 | 108 | .711 | 122 | .208 |
| B3LYP/awQZ | 160 | .506 | 108 | .716 | 122 | .198 |
| MP2/TZ | 160 | .991 | 108 | .627 | 121 | .881 |
| MP2/QZ | 160 | .670 | 108 | .533 | 121 | .825 |
| MP2/awCQZ | 160 | .622 | 108 | .550 | 121 | .794 |
| ae-MP2/awCQZ | 160 | .188 | 108 | .390 | 121 | .767 |
| CCSD(T)/TZ | 161 | .826 | 108 | .766 | 121 | .928 |
| CCSD(T)/QZ | 161 | .415 | 108 | .683 | 121 | .841 |
| ae-CCSD(T)/wCQZ | 160 | .890 | 108 | .531 | 121 | .855 |
| ae-CCSD(T)/wC5Z | 160 | .797 | 108 | .512 | 121 | .815 |
| CCSD(T)/QZ*c | 160 | .90 | 108 | .53 | 121 | .77 |
| dito, refinedd | 160 | .895 | 108 | .685 | 121 | .75 |
| e | 161 | .08 (9) | 109 | .25 (9) | 121 | .57 (3) |
| f | 161 | .077 (1) | 108 | .692 (3) | 121 | .74 (2) |
| f | 161 | .38 (4) | 109 | .62 (6) | 121 | .87 (5) |
| g | 161 | .57 (8) | 109 | .92 (21) | 121 | .33 (29) |
| g | 161 | .10 (8) | 108 | .56 (21) | ||
| 161 | .025 (30) | 109 | .246 (21) | 121 | .562 (12) | |
| (B3LYP) | 160 | .975 (2) | 108 | .526 (6) | 121 | .706 (5) |
| (MP2) | 160 | .934 (6) | 108 | .556 (15) | 121 | .759 (13) |
| (CCSD(T)) | 160 | .909 (1) | 108 | .531 (2) | 121 | .758 (2) |
| Frequency | Unc. | OC | Weight | Source | |||||||||
|---|---|---|---|---|---|---|---|---|---|---|---|---|---|
| 6 | 1 | 5 | 6 | 1 | 6 | 21230 | .15 | 0.05 | 0.01256 | Cox et al. (1982) | |||
| 7 | 1 | 6 | 7 | 1 | 7 | 28304 | .63 | 0.05 | 0.01393 | Cox et al. (1982) | |||
| 1 | 0 | 1 | 0 | 0 | 0 | 33765 | .80 | 0.05 | 0.05051 | Cox et al. (1982) | |||
| 8 | 1 | 7 | 8 | 1 | 8 | 36388 | .01 | 0.05 | 0.07933 | Cox et al. (1982) | |||
| 2 | 1 | 2 | 1 | 1 | 1 | 66517 | .88 | 0.10 | 0.02248 | Johnson et al. (1971) | |||
| 2 | 0 | 2 | 1 | 0 | 1 | 67528 | .15 | 0.10 | 0.11515 | Johnson et al. (1971) | |||
| 2 | 1 | 1 | 1 | 1 | 0 | 68539 | .94 | 0.16 | 0.23319 | Johnson et al. (1971) | |||
| 15 | 1 | 14 | 15 | 1 | 15 | 121120 | .1500 | 0.100 | 0.03361 | OSU | |||
| 4 | 1 | 4 | 3 | 1 | 3 | 133026 | .9097 | 0.050 | 0.01021 | OSU | |||
| 4 | 3 | 2 | 3 | 3 | 1 | 135027 | .8171 | 0.050 | 0.01347 | 0.5000 | OSU | ||
| 4 | 3 | 1 | 3 | 3 | 0 | 135027 | .8171 | 0.050 | 0.01347 | 0.5000 | OSU | ||
| 4 | 0 | 4 | 3 | 0 | 3 | 135030 | .6546 | 0.050 | 0.00998 | OSU | |||
| 41 | 6 | 36 | 40 | 6 | 35 | 1378757 | .4655 | 0.010 | 0.00721 | 0.5000 | Koeln | ||
| 41 | 6 | 35 | 40 | 6 | 34 | 1378757 | .4655 | 0.010 | 0.00721 | 0.5000 | Koeln | ||
| 41 | 4 | 38 | 40 | 4 | 37 | 1380675 | .2953 | 0.010 | 0.00481 | Koeln | |||
| 41 | 4 | 37 | 40 | 4 | 36 | 1380920 | .5593 | 0.010 | 0.00223 | Koeln | |||
| 41 | 3 | 39 | 40 | 3 | 38 | 1380944 | .1970 | 0.010 | 0.00340 | Koeln | |||
| 42 | 1 | 42 | 41 | 1 | 41 | 1385516 | .6458 | 0.010 | 0.02038 | Koeln | |||
Peer Reviews
No public reviews on file for this paper yet. If you reviewed it on a platform where reviews are public (OpenReview, ICLR, NeurIPS, ICML), you can paste yours below so the community can read it here.
Videos
No videos yet. Explain this paper in a talk, walkthrough, or lecture? Add one.
11institutetext: I. Physikalisches Institut, Universität zu Köln, Zülpicher Str. 77, 50937 Köln, Germany
11email: [email protected] 22institutetext: Department of Physics, The Ohio State University, Columbus, OH 43210-1107, USA
Laboratory spectroscopic study of isotopic thioformaldehyde, H2CS,
and determination of its equilibrium structure††thanks: Transition frequencies from this work as well as related data from earlier work are given for each isotopic species as supplementary material. Given are also quantum numbers, uncertainties, and residuals between measured frequencies and those calculated from the final sets of spectroscopic parameters. The data are available at CDS via anonymous ftp to cdsarc.u-strasbg.fr (130.79.128.5) or via http://cdsweb.u-strasbg.fr/cgi-bin/qcat?J/A+A/621/A143
Holger S. P. Müller 11
Atsuko Maeda 22
Sven Thorwirth 11
Frank Lewen 11
Stephan Schlemmer 11
Ivan R. Medvedev 22Current address: Department of Physics, Wright State University, Dayton, OH 45435 USA.Current address: Department of Physics, Wright State University, Dayton, OH 45435 USA.
Manfred Winnewisser 22
Frank C. De Lucia 22
Eric Herbst 22Current address: Departments of Chemistry and Astronomy, University of Virginia, Charlottesville, VA 22904, USA.Current address: Departments of Chemistry and Astronomy, University of Virginia, Charlottesville, VA 22904, USA.
(Received 26 October 2018 / Accepted 22 November 2018)
Abstract
*Context. *Thioformaldehyde is an abundant molecule in various regions of the interstellar medium. However, available laboratory data limit the accuracies of calculated transition frequencies in the submillimeter region, in particular for minor isotopic species.
*Aims. *We aim to determine spectroscopic parameters of isotopologs of H2CS that are accurate enough for predictions well into the submillimeter region.
*Methods. *We investigated the laboratory rotational spectra of numerous isotopic species in natural isotopic composition almost continuously between 110 and 377 GHz. Individual lines were studied for most species in two frequency regions between 566 and 930 GHz. Further data were obtained for the three most abundant species in the 12901390 GHz region.
*Results. *New or improved spectroscopic parameters were determined for seven isotopic species. Quantum-chemical calculations were carried out to evaluate the differences between ground state and equilibrium rotational parameters to derive semi-empirical equilibrium structural parameters.
Conclusions. The spectroscopic parameters are accurate enough for predictions well above 1 THz with the exception of HC34S where the predictions should be reliable to around 700 GHz.
Key Words.:
Molecular data – Methods: laboratory: molecular – Techniques: spectroscopic – Radio lines: ISM – ISM: molecules – Astrochemistry
1 Introduction
Thioformaldehyde, H2CS, was among the molecules detected early in space, namely in the giant high-mass starforming region Sagittarius B2 near the Galactic center (Sinclair et al. 1973). The molecule was also detected in dark clouds, such as TMC-1 and L134N (Irvine et al. 1989), and in the circumstellar envelope of the C-rich asymptotic giant branch (AGB) star CW Leonis, also known as IRC +10216 (Agúndez et al. 2008). Concerning solar system objects, H2CS was detected in the comet Hale Bopp (Woodney et al. 1997). Furthermore, it was detected in nearby galaxies, such as the Large Magellanic Cloud (Heikkilä et al. 1999) and NGC253 (Martín et al. 2005), and also in more distant galaxies, such as the foreground galaxy in the direction of the blazar PKS 1830211 (Muller et al. 2011). Several isotopic species were detected as well; H2C34S (Gardner et al. 1985), HCS (Cummins et al. 1986), HDCS (Minowa et al. 1997), and even D2CS (Marcelino et al. 2005); unlabeled atoms refer to 12C and 32S.
Spectroscopic identifications of thioformaldehyde were based on molecular parameters which were obtained to a large extent from laboratory rotational spectroscopy. The first results were reported by Johnson & Powell (1970) followed by additional measurements of H2CS and, to a much lesser extent, of H2C34S, HCS, and D2CS up to 70 GHz (Johnson et al. 1971). Beers et al. (1972) measured further transitions of H2CS up to 244 GHz. Cox et al. (1982) carried out microwave measurements of several minor thioformaldehyde isotopologs and determined dipole moments for H2CS and D2CS; a very accurate H2CS dipole moment was reported by Fabricant et al. (1977). Brown et al. (1987) investigated the 33S and 13C hyperfine structure (HFS) from microwave transitions. Minowa et al. (1997) determined HDCS transition frequencies from the millimeter to the lower submillimeter regions. Additional, though less accurate data for H2CS and H2C34S were obtained in a far-infrared study of thioformaldehyde (McNaughton & Bruget 1993) and from the AX electronic spectrum of H2CS (Clouthier et al. 1994). Further, quite accurate transition frequencies of HDCS and D2CS were obtained from radio-astronomical observations (Marcelino et al. 2005).
The need for higher frequency data was apparent in molecular line surveys of Orion KL carried out with the Caltech Submillimeter Observatory (CSO) on Mauna Kea, Hawaii covering 325360 GHz (Schilke et al. 1997) and 607725 GHz (Schilke et al. 2001), and those carried out with the Odin satellite covering 486492 GHz and 541577 GHz (Olofsson et al. 2007; Persson et al. 2007), the one carried out with the Herschel satellite covering 4801280 GHz and 14261907 GHz (Crockett et al. 2014), and the the Herschel molecular line survey of Sagittarius B2(N) (Neill et al. 2014). Moreover, the identification of H2C34S in the Protostellar Interferometric Line Survey (PILS) of IRAS 162932422 with the Atacama Large Millimeter/submillimeter Array (ALMA) between 329 and 363 GHz (Drozdovskaya et al. 2018) may have been hampered by insufficient accuracies of some of the rotational transitions.
The apparent lack of accuracy in the H2CS rest-frequencies in the higher frequency CSO survey (Schilke et al. 2001) and a specific request from a member of the Odin team to one of us (E.H.) initiated our study covering 110377 GHz, 566670 GHz, and 848930 GHz. An account on the H2CS data in the ground vibrational state has been given by Maeda et al. (2008). Later, we extended measurements to the 12901390 GHz region. Here, we report on the ground state rotational data of seven isotopic species, H2CS, H2C33S, H2C34S, H2C36S, HCS, HC34S, and HDCS obtained from samples in natural isotopic composition. The derived, often greatly improved, spectroscopic parameters permit predictions of accurate rest-frequencies well above 1 THz except for HC34S, where the experimental data are more limited. The rotational parameters of these isotopologs plus a set of redetermined values for D2CS combined with vibration-rotation parameters from quantum-chemical calculations were used to derive equilibrium structural parameters.
2 Laboratory spectroscopic details
We employed the Fast Scan Submillimeter-wave Spectroscopic Technique (FASSST) of The Ohio State University (OSU) to cover the 110377 GHz range with a small gap at 190200 GHz (Petkie et al. 1997; Medvedev et al. 2004). Additionally, we used two different spectrometer systems at the Universität zu Köln to record higher frequency transitions up to almost 1.4 THz (Winnewisser et al. 1994; Winnewisser 1995; Xu et al. 2012).
The FASSST system employs backward wave oscillators (BWOs) as sources; in the present study one that covered about 110190 GHz and two spanning the region of 200377 GHz. The frequency of each BWO was swept quickly so that a wide frequency range (90 GHz) can be measured in a short period and any voltage instability of the BWOs can be overcome. The frequency of the FASSST spectrum was calibrated with sulfur dioxide (SO2) rotational lines whose spectral frequencies are well known (Müller & Brünken 2005). A portion of the source radiation propagated through a Fabry-Perot cavity to produce an interference fringe spectrum with a free spectral range of 9.2 MHz. The frequencies of radiation between the calibration lines were interpolated with the fringe spectrum. In the calibration procedure, the dispersive effect of atmospheric water vapor in the Fabry-Perot cavity was taken into account (Maeda et al. 2006; Groner et al. 2007). Measurements were taken with scans that proceeded both upward and downward in frequency so as to record an average frequency. The results obtained from 100 upward and downward scans were accumulated for a better signal-to-noise ratio, increasing the integration time from 0.1 to 10 ms. The experimental uncertainty of this apparatus is around 50 kHz for an isolated, well-calibrated line.
We used phase-lock loop (PLL) systems in the Cologne spectrometers to obtain accurate frequencies. Two BWOs were used as sources to record lines in the 566670 and 848930 GHz regions. A portion of the radiation from the BWOs was mixed with an appropriate harmonic of a continuously tunable synthesizer in a Schottky diode multiplier mixer to produce the intermediate frequency (IF) signal. The IF-signal was phase-locked and phase-error provided by the PLL circuit were fed back to the power supply of the BWOs. The experimental uncertainties under normal absorption conditions can be as low as 5 kHz even around 1 THz (Belov et al. 1995; Müller et al. 2007).
A solid-state based spectrometer system was used to obtain transition frequencies between 1290 and 1390 GHz. A set of frequency multipliers (three doublers plus two triplers) were driven by a microwave synthesizer to cover these frequencies. Additional detail is given by Xu et al. (2012). Accuracies of 10 kHz can be achieved for strong, isolated lines (Müller et al. 2015; Müller & Lewen 2017).
Thioformaldehyde (H2CS) was produced by the pyrolysis of trimethylene sulfide [(CH2)3S; Sigma-Aldrich Co.], which was used as provided. The thermal decomposition of trimethylene sulfide yields mostly thioformaldehyde and ethylene, which has no permanent dipole moment, but also small amounts of by-products such as CS, H2S, and H2CCS. Laboratory setups for the pyrolysis were slightly different in the OSU and Cologne measurements. At OSU, trimethylene sulfide vapor was passed through a 2 cm diameter, 20 cm long piece of quartz tubing stuffed with quartz pieces and quartz cotton to enlarge the reaction surface. The quartz tubing was heated with a cylindrical furnace to 680*∘*C. The gas produced from the pyrolysis was introduced to a 6 m long aluminum cell at room temperature and pumped to a pressure of 0.41.5 mTorr (1 mTorr = 0.1333 Pa). The spectrum of trimethylene sulfide almost totally disappeared after the pyrolysis, at which time the spectrum of thioformaldehyde appeared. Spectral lines due to the by-products, CS, H2S, and H2CCS, were also observed, but with less intensity compared with thioformaldehyde.
A 3 m long glass absorption cell kept at room temperature was used for measurements in Cologne. A higher temperature of about 1300*∘*C was required in the pyrolysis zone in order to maximize the thioformaldehyde yield and to minimize absorptions of (CH2)3S because no quartz cotton was used in the quartz pyrolysis tube. The total pressure was around 13 Pa for weaker lines and around 0.010.1 Pa for stronger lines.
Liquid He-cooled InSb bolometers were used in both laboratories as detectors.
3 Quantum-chemical calculations
Hybrid density functional calculations of the B3LYP variant (Becke 1993; Lee et al. 1988) and Møller-Plesset second order perturbation theory (MP2) calculations (Møller & Plesset 1934) were carried out with the commercially available program Gaussian 09 (Frisch et al. 2013). We performed also coupled cluster calculations with singles and doubles excitations augmented by a perturbative correction for triple excitations, CCSD(T) (Raghavachari et al. 1989) with the 2005 Mainz-Austin-Budapest version of ACESII and its successor CFOUR111CFOUR, a quantum chemical program package written by J. F. Stanton, J. Gauss, M. E. Harding, P. G. Szalay et al. For the current version, see http://www.cfour.de. We employed correlation consistent basis sets cc-pVXZ (X = T, Q, 5) (Dunning 1989) for H and C and the cc-pV(X+d)Z basis sets for S (Dunning et al. 2001); diffuse basis functions were augmented for some calculations, denoted as aug-cc-pVXZ and aug-cc-pV(X+d)Z. We abbreviate these basis sets as XZ and aXZ, respectively. In addition, we employed weighted core-correlating basis functions in some cases, yielding the (aug-) cc-pwCVXZ basis sets (Peterson & Dunning 2002). These basis sets were abbreviated as wCXZ and awCXZ, respectively. All calculation were carried aut at the Regionales Rechenzentrum der Universität zu Köln (RRZK).
Equilibrium geometries were determined by analytic gradient techniques, harmonic force fields by analytic second derivatives, and anharmonic force fields by numerical differentiation of the analytically evaluated second derivatives of the energy. The main goal of these anharmonic force field calculations was to evaluate first order vibration-rotation parameters (Mills 1972), see also Sect. 6. Core electrons were kept frozen in MP2 and CCSD(T) calculations unless “ae” indicates that all electrons were correlated. We evaluated the hyperfine parameters of H2C33S using the awCQZ basis set (wCQZ for CCSD(T) calculation) at the equilibrium geometry calculated at the same level.
4 Spectroscopic properties of thioformaldehyde
Thioformaldehyde is an asymmetric rotor with , much closer to the symmetric limit of than the isovalent formaldehyde for which is 0.9610, see, for example, Müller & Lewen (2017). The H2CS dipole moment of 1.6491 D (Fabricant et al. 1977) is aligned with the inertial axis. The strong rotational transitions are therefore those with and , that is, the R-branch transitions. Transitions with and (Q-branch transitions) are also allowed as are transitions with . These transitions are not only much weaker than the strong R-branch transitions, but also relatively weaker than the equivalent transitions in H2CO because H2CS is closer to the symmetric prolate limit.
Isotopologs with two H or two D have symmetry whereas isotopologs with one H and one D have symmetry. Spin-statistics caused by the two equivalent H lead to ortho and para states with a 3 : 1 intensity ratio. The ortho states are described by being odd. The ortho to para ratio in D2CS is 2 : 1, and the ortho states are described by being even. No non-trivial spin-statistics exist in HDCS and related isotopologs.
Sulfur has four stable isotopes with mass numbers 32, 33, 34, and 36 and with terrestrial abundances of 95.0 %, 0.75 %, 4.2 %, and 0.015 %, respectively (Berglund & Wieser 2011). The respective abundances are 98.89 % and 1.11 % for 12C and 13C and 99.98 % and 0.015 % for H and D.
5 Spectroscopic results
We used Pickett’s SPCAT and SPFIT programs (Pickett 1991) to predict and fit rotational spectra of the various isotopic species of thioformaldehyde. Predictions were generated from the published data for the isotopic species H2CS, H2C34S, H2C33S, HCS, and HDCS (Johnson et al. 1971; Beers et al. 1972; Cox et al. 1982; Brown et al. 1987; McNaughton & Bruget 1993; Minowa et al. 1997). Higher order spectroscopic parameters of isotopic species with heavy atom substition were estimated from those of H2CS by scaling the parameters with appropriate powers of the ratios of , , and . Even though these estimates do not hold strictly, they are almost always better than constraining the parameters to zero and also mostly better than contraining the parameters to values directly taken from the main isotopic species, see, e.g., below or the examples of isotopic CH3CN (Müller et al. 2016) or H2CO (Müller & Lewen 2017). This scaling procedure is not recommended for H to D substitution especially in molecules with relatively few atoms, such as HDCS. The resulting spectroscopic line lists are or were available in the Cologne Database for Molecular Spectroscopy, CDMS222https://cdms.astro.uni-koeln.de/classic/entries/ (Endres et al. 2016) as version 1, mostly from February 2006. An updated entry (version 2) has been available for the H2CS main isotopic species since early 2008.
We carried out the rotational assignment for the FASSST spectra of thioformaldehyde with the Computer Aided Assignment of Asymmetric Rotor Spectra (CAAARS) program applying the Loomis-Wood procedure, with which the observed spectrum is visually compared with predicted line positions and intensities to make new assignments (Medvedev et al. 2005). The strong R-branch transitions of the abundant isotopic species H2CS, H2C34S, HCS, and H2C33S were found easily first for low values of (04) and later up to . The upper frequency of 377 GHz limited the quantum numbers to a maximum of for H2CS and for the other isotopologs because of the smaller values of . Several transitions of H2C33S displayed splitting caused by the electric nuclear quadrupole moment and the magnetic nuclear dipole moment of the nucleus of 33S. We could also make extensive assignments for the weaker Q-branch transitions with . These covered all and almost all of to 26 for H2CS and H2C34S, respectively; fewer lines were found for HCS and H2C33S. In the case of the main isotopic species, we could assign most of the even weaker Q-branch transitions with .
On the basis of these extensive assignments, we suspected that transitions of HDCS should be strong enough in natural isotopic composition to identify them in our FASSST spectra. Minowa et al. (1997) had reported transition frequencies from laboratory measurements up to 380 GHz. The resulting spectroscopic parameters were sufficiently accurate to identify HDCS transitions in our FASSST spectra. Even though the lines were weak, we could supplement the existing line list with R-branch transition frequencies not reported by Minowa et al. (1997) up to .
With the identification of HDCS in the FASSST spectra, it appeared plausible to search for transitions of HC34S and H2C36S because they have abundances similar to those of HDCS. We derived an structure (Rudolph 1991), see also Sect. 6, from the known rotational parameters because this structure model can provide good predictions of rotational parameters of isotopologs not yet studied, see, e.g., the example of cyclopropylgermane (Epple & Rudolph 1992) or sulfuryl chloride fluoride (Müller & Gerry 1994). We were able to make assignments of R-branch transition up to for both isotopic species, however, those for HC34S were only made in the process of writing this manuscript, and assignments extend only up to 362 GHz.
Most of the frequencies were assigned uncertainties of 50 kHz; 100 kHz were assigned to the weak Q-branch transition frequencies, to some of the weaker H2C33S lines, and to the stronger H2C36S lines. Uncertainties of 200 kHz were assigned to weaker lines of H2C36S.
Subsequently, improved predictions were used to search for individual transitions of H2CS, H2C34S, HCS, H2C33S, HDCS, and H2C36S in the regions 566670 and 848930 GHz using the Cologne Terahertz Spectrometer. Fig. 2 demonstrates the good signal-to-noise ratio achieved for HDCS. Later, we recorded transitions of H2CS, H2C34S, and HCS in the 12901390 GHz region. Fig. 3 demonstrates the para to ortho ratio for the main isotopic species. The Boltzmann peak of the room temperature rotational spectrum of H2CS is at 800 GHz. Therefore, we did not attempt any measurements for the rarer isotopic species at these high frequencies.
The quantum numbers of the strong -branch transitions reach and for H2CS; we recorded three Q-branch transitions up to and five or P-branch transitions () below 1 THz. In the case of H2C34S and HCS, , and , were reached. In addition, we recorded two Q-branch transitions with and 35 for H2C34S. Finally, , and , , and , were reached for H2C33S, H2C36S, and HDCS, respectively. Unfortunately, we did not attempt to search for transitions of HC34S in the (initial) absence of assignments in the FASSST spectra.
Uncertainties of 5 kHz were assigned to the best lines of almost all isotopic species below 1 THz, 10 kHz were assigned to the best lines of H2C36S and those above 1 THz. The largest uncertainties were around 50 kHz.
Our data set for the main isotopic species is very similar to that of our earlier account by Maeda et al. (2008). The main exception are 58 transitions corresponding to 42 frequencies because of unresolved asymmetry splitting at higher that were recorded between 1290 and 1390 GHz. We omitted the far-infrared transition frequencies from McNaughton & Bruget (1993) below 1390 GHz or 46.37 cm*-1* because of the lower accuracy of these data (3 MHz). Additional data beyond our transition frequencies are the ground state combination differences from the AX electronic spectrum of H2CS (Clouthier et al. 1994) and lower frequency rotational transitions frequencies (Fabricant et al. 1977; Johnson et al. 1971; Beers et al. 1972). Some transition frequencies for H2C34S and HCS were taken from Johnson et al. (1971) and from Cox et al. (1982); Brown et al. (1987) contributed data for H2C33S and for HCS, and Minowa et al. (1997) for HDCS. We determined also spectroscopic parameters for D2CS in particular for the structure determination even though we did not record any transitions of this rare isotopolog. We combined earlier laboratory data (Johnson et al. 1971; Cox et al. 1982) with more recent rest frequencies from radio astronomical observations (Marcelino et al. 2005).
The HFS components of the transition of H2C33S (Brown et al. 1987) displayed average residuals between measured and calculated frequencies of 28 kHz, much larger than the assigned uncertainties of 48 kHz and with considerable scatter. Therefore, we omitted the HFS components of this transition from the final fit.
The additional very acurate data for the main isotopic species from the 12901390 GHz region required two additional parameters, and , in the fit compared with our previous report (Maeda et al. 2008). The parameter values changed only very little for the most part with the exception of , which changed from mHz to mHz.
Sets of spectroscopic parameters were evaluated for H2C34S and HCS as described above. Parameters derived from the main isotopic species were fit starting from the lower order parameters. A parameter was considered to be kept floating if the resulting quality of the fit improved substantially and if the uncertainty of the parameter was much smaller than a fifth of the magnitude of the parameter. Generally, we searched for the parameter whose fitting improved the quality most among the parameters reasonable to be fit. This procedure was repeated until the quality of the fit did not improve considerably anymore.
We evaluated initial spectroscopic parameters of H2C33S, H2C36S, and HC34S in a similar manner; the main difference was that we considered not only parameters of H2CS, but also of H2C34S and HCS. Nuclear HFS parameters had to be included in the fit of H2C33S. The dominant contribution comes from the nuclear electric quadrupole coupling. There are only three parameters, , , and , because of the symmetry of the molecule; was derived from the other two because the sum of the three is zero. Nuclear magnetic spin-rotation coupling parameters needed to be included in the fit also. However, the values of and were poorly determined and were quite different from values obtained from quantum-chemical calculations. It turned out that is well determined whereas appears to be insufficiently constrained. Therefore, we constrained to the value from an MP2 calculation because the remaining two experimental parameters agreed well with the calculated ones. Distortion parameters of HDCS and D2CS that could not be evaluated experimentally were estimated from values taken from a quantum-chemical calculation (Martin et al. 1994) and considering deviations between these calculated equilibrium values and the determined experimental ground state values of these two isotopic species and those of H2CS.
The spectroscopic parameters of H2CS, H2C33S, H2C34S, and H2C36S are given in Table 1, except for the H2C33S hyperfine structure parameters which are presented in Table 2 in comparison to values from quantum-chemical calculations. The spectroscopic parameters of HCS, HC34S, HDCS, and D2CS are gathered in Table 3.
The experimental data have been reproduced within experimental uncertainties for all isotopic species. There is some scatter among partial data, e.g, previous rotational lines for a given isotopolog. Some partial data sets have been judged slightly conservatively.
The experimental transition frequencies with quantum numbers, uncertainties, and differences to the calculated frequencies in the final fits are available as supplementary material to this article. The line, parameter, and fit files along with auxiliary files are available in the data section of the CDMS.888https://cdms.astro.uni-koeln.de/classic/predictions/daten/H2CS/ Calculated and experimental transition frequencies for radio astronomical observations and other purposes are provided in the catalog section999website: https://cdms.astro.uni-koeln.de/classic/entries/, see also https://cdms.astro.uni-koeln.de/classic/ of the CDMS.
Since Cox et al. (1982) determined the D2CS dipole moment to be slightly larger than that of H2CS, we discuss changes of dipole moments upon isotopic substitution. The experimentally determined difference between H2CS and D2CS is only D, equivalent to an overestimation of the D2CS column density by about 1.3 %, which is negligible by astronomical standards. Fabricant et al. (1977) determined that the dipole moments of D2CO is 0.0154 D larger than that of H2CO whereas the one of D2CCO is only 0.0024 D larger than the one of H2CCO, suggesting that dipole moment differences upon deuteration decrease rapidly for increasingly larger molecules. Heavy atom substitution leads to much smaller differences. As may be expected, the dipole moment of HCO is only 0.0002 D larger than that of H2CO (Fabricant et al. 1977). Our ground state dipole moments, which we calculated at the B3LYP/QZ and MP2/QZ levels, yielded differences of similar magnitude upon heavy atom substitution. The difference in the case of D2CS was 0.0136 D and 0.0132 D after scaling the values with the ratio between calculated H2CS ground state dipole moment and the experimental value. These isotopic changes agree with the experimental one of Cox et al. (1982) within three times the uncertainty. Finally, we point out that the slight rotation of the inertial axis system in the case of HDCS leads to a minute -dipole moment component of 0.08 D. The strongest -type transitions are around three orders of magnitude weaker than the strongest -type transitions at similar frequencies. Only the uncertainties of the transitions (0.2 MHz) may be small enough to permit detection in astronomical spectra at least in theory. The uncertainties increase rapidly with increasing .
Astronomers will be interested to know the impact of the present data on the calculated line positions. Deviations between initial calculations of transition frequencies and the present ones increase usually strongly with and less strongly with . We show in Table 4 for three isotopic species and selected values of the values and the corresponding frequencies for which these deviations exceed 1 MHz. This corresponds to the line width of the protostar IRAS 162932422 source B around 300 GHz; e.g., Drozdovskaya et al. (2018). Dark clouds may exhibit even smaller line widths, whereas high-mass star-forming regions usually display larger line widths by factors of a few.
Noticing that initially calculated and present transition frequencies of H2C34S display differences of more than 1 MHz in the upper millimeter and lower submillimeter region for modest values of , we wondered if the findings of Drozdovskaya et al. (2018) were affected by these differences. The paper is based on the Protostellar Interferometric Line Survey (PILS) of the binary IRAS 162932422 carried out with the Atacama Large Millimeter/submillimeter Array (ALMA) in the 329.15362.90 GHz range (Jørgensen et al. 2016). The transitions of H2C34S are covered in that survey. The model by Drozdovskaya et al. (2018) shows that the pair of transitions are near the noise limit, but are blended by stronger transitions. Shifts of almost 1 MHz between initially and presently calculated rest frequencies do not change this enough (Drosdovskaya, private communication to H.S.P.M., 2018). All but one of the remaining five transitions with lower are clearly blended. Therefore, the finding by Drozdovskaya et al. (2018) that only an upper limit to the column density could be determined for H2C34S remains unaltered.
We were able to determine for all isotopic species and for some even although direct information on the purely -dependent parameters exists only for the main species through the rotational transitions and the ground state combination differences from Clouthier et al. (1994) and even though thioformaldehyde is so close to the symmetric prolate limit.
The experimental 33S hyperfine structure parameters in Table 2 agree well or quite well with those from quantum-chemical calculations. We note that the calculated values are equilibrium values whereas the experimental ones are values referring to the ground vibrational state. Consideration of vibrational effects may have some influence on the comparison, but their evaluation was beyond the aim of our study.
A comparison of spectroscopic parameters of the isovalent molecules formaldehyde, thioformaldehyde, silanone, and thiosilanone is given in Table 5. Interestingly, the quartic distortion parameters scale approximately with appropriate powers of , , and . This appears to apply also for some of the available sextic distortion parameters, but in many cases the relations are more complex.
6 Structural parameters of thioformaldehyde
The equilibrium structure is the best and easiest defined structure of a molecule. It requires to calculate equilibrium rotational parameter(s), for example, from the ground state rotational parameter(s) as follows
[TABLE]
where the are first order vibrational corrections, the are second order vibrational corrections, and so on. Equivalent formulations hold for and . In the case of a diatomic molecule, only information on one isotopic species is necessary, and only one rotational parameter and one vibrational correction of each order exist. Experimental data exist for a plethora of diatomic molecules, see, e.g., Huber & Herzberg (1979). is usually much larger than which in turn is much larger than ; the situation involving higher order corrections may be more complex.
The general -atomic asymmetric rotor molecule has three different rotational parameters , , and , first order vibrational corrections, second order vibrational corrections, and so on. Specifically, the number of first and second order corrections are three and six, respectively, for a triatomic molecule, and six and 21 for a tetratomic molecule such as H2CS. Experimental equilibrium structural parameters of polyatomic molecules with consideration of more than first order vibrational corrections are very rare, but more exist with consideration of first order vibrational corrections only. It is necessary to point out that is only to first order equal to . Moreover, data for more than one isotopic species are needed to determine all independent structural parameters unless the molecule is a symmetric triatomic of the type AB2, where atoms A and B do not need to be different.
An alternative, lately very common, approach is to calculate by quantum-chemical means to derive semi-empirical equilibrium rotational parameters from the experimental ground state values (Stanton et al. 1998). Second and higher order vibrational contributions are neglected. Numerous quantum-chemical programs are available to carry out such calculations; examples have been mentioned in Sect. 3.
We have used B3LYP, MP2, and CCSD(T) calculations with an adequately large basis set of quadruple zeta quality to evaluate the first order vibrational corrections for isotopologs of thioformaldehyde which have been summarized in Table 6 together with ground state values, two additional corrections described in greater detail below, the final semi-empirical equilibrium values at the CCSD(T) level, and the corresponding equilibrium inertia defect . The inertia defect is defined as . Among the three methods employed in the present study, CCSD(T) is considered to be by far the most accurate one under most circumstances whereas MP2 and B3LYP are usually less accurate by different degrees. Morgan et al. (2018) performed extensive calculations on the related formaldehyde molecule. The ae-CCSD(T) data obtained with a basis set of QZ quality are already quite close to experimental values, but larger basis sets or higher degrees of electron correlation modify the picture somewhat. All corrections together improve the agreement between quantum-chemical calculations and experimental results non-negligibly. Such calculations are, however, very demanding, and in many cases ae-CCSD(T) calculations with a basis set of QZ quality are a good compromise for small to moderately large molecules (Coriani et al. 2005).
The determined for thioformaldehyde differ considerably among the three methods for each isotopolog and each . We suspect that the second order vibrational corrections are smaller than the differences between the methods. If we assume that they decrease in magnitude in a similar way as the first order corrections are smaller than the ground state rotational parameters, then the second order corrections to should be around 10 MHz, and those to and should be less than 1 MHz.
Oka & Morino (1961) showed that the rotational Hamiltonian of a semirigid rotor contains two terms which cause the inertia defect to be non-zero when the ground state rotational parameters were corrected for the vibrational corrections , namely an electronic contribution and a centrifugal distortion contribution . The electronic contribution is calculated as , where the are components of the rotational -tensor and and are the masses of the electron and the proton, respectively (Oka & Morino 1961). We took the values of thioformaldehyde from the very accurate Zeeman measurements of Rock & Flygare (1972). The centrifugal distortion contribution is evaluated as and (Oka & Morino 1961). (; tbc) is a distortion parameter which was evaluated here from an empirical force field calculated using the program NCA (Christen 1978).
The inertia defect may be used an indication of the quality of the vibrational correction. The ground state value of the main isotopolog is 0.06139 amu Å2, quite small and positive as can be expected for a small and rigid molecule. The equilibrium value should ideally be zero. However, the first order vibrational corrections lead usually to negative values which are much smaller in magnitude than the ground state values. In the case of our B3LYP, MP2, and CCSD(T) calculations, the values are 0.00381, 0.00305, and 0.00406 amu Å2, respectively. Taking the electronic corrections into account, we obtain 0.00281, 0.00356, and 0.00255 amu Å2, respectively, and finally, after applying the centrifugal distortion correction, 0.00020, 0.00093, and 0.000064 amu Å2, respectively.
The equilibrium inertia defects in Table 6 show very small scatter very close to zero among five isotopic species, and slightly larger scatter for three others. Even though that larger scatter is still fairly small, it is worthwhile to look into potential sources for that finding. The smaller list of experimental lines could be an explanation for HC34S and for D2CS, but not likely for HDCS. The value of HC34S would be essentially zero if were increased by 121 MHz. This can be ruled out safely because ideally should not change upon substitution of one (or both) of the heavy atoms, and the HC34S value is only about 11 MHz larger than that of the main isotopolog albeit with an uncertainty of 16 MHz. A decrease of by 0.35 MHz would also lead to , but a corresponding change in the experimentally determined value of appears rather unlikely. We suspect that shortcomings in the CCDS(T) first order vibrational correction or the neglect of second order vibrational correction are mainly responsible for the somewhat larger scatter observed for three of the thioformaldehyde isotopologs, even more so, as the differences between the equilibrium inertia defects of H2CS and HC34S are about twice as large if the CCDS(T) vibrational corrections are replaced by the B3LYP or MP2 corrections.
We employed the RU111J program (Rudolph 1995) to derive semi-empirical equilibrium structural parameters as well as parameters. The latter model was proposed by Rudolph (1991). The difference between ground state and equilibrium moments of inertia can be expressed as , with , assuming that the are equal among the different isotopologs of a given molecule. According to Rudolph (1991), the parameters are equivalent with parameters (isotopic differences are fit to determine structural parameters) and with substitution parameters (isotopic differences between one reference isotopolog and one isotopolog in which one atom has been substituted are used to locate that atom). The advantage of considering the explicitely in the calculations are predictions of rotational parameters of isotopic species to be studied, see for example Epple & Rudolph (1992) and Müller & Gerry (1994). The resulting structural parameters are given in Table 7 together with earlier parameters, ground state average () parameters and an approximation of the equilibrium structure derived from parameters. The harmonic contributions to the ground state moments of inertia, obtained from a harmonic force field calculation, are subtracted off in the ground state average structure. The approximation of the equilibrium structure derived from parameters assumes that anharmonic contributions to a given bond in a molecule can be approximated from the anharmonicity of the respective diatomic molecule, and differences in and bond angles are neglected (Turner et al. 1981). Table 7 also contains structural parameters of thioformaldehyde from several present and selected earlier quantum-chemical calculations.
The semi-empirical strutures determined with first order vibrational corrections obtained with three different methods are quite similar, albeit with some of the differences outside the combined uncertainties. The semi-empirical structure obtained with the CCSD(T) corrections is very close to the purely quantum-chemically derived ae-CCSD(T)/wQZ structure, as is very often the case (Coriani et al. 2005), and is probably closest to a purely experimental equilibrium structure. The CS bond lengths derived from B3LYP or MP2 calculations with basis sets of QZ quality are all too short, especially the ae-MP2 value. The CH bond lengths are all slightly too long, and the HCS bond angles all too large. The corresponding MP2 quantities are closer to our semi-empirical values.
Our parameters agree within combined uncertainties with the parameters of Johnson et al. (1971), as is expected (Rudolph 1991), but less so with the values of Cox et al. (1982). However, these latter values are quite close to our values. The two sets of ground state average () parameters differ somewhat, but in both cases both bond lengths are longer than the equilibrium values, as is usually the case. The equilibrium bond lengths derived from one of the structures is in fairly good agreement with our values.
We recommend employment of first-order vibrational corrections obtained with the CCSD(T) method for semi-empirical structure determinations if high accuracy is desired. Less expensive methods may, however, be sufficient if accuracy requirements are less stringent.
7 Conclusion and outlook
We have obtained extensive sets of accurate transition frequencies for seven isotopic species of thioformaldehyde. They extend to beyond 900 GHz for H2C33S, for H2C36S, and for HDCS and even reach almost 1400 GHz in the cases of H2CS, H2C34S, and HCS. The line list of the very rare HC34S extends to about 360 GHz. The resulting accurate spectroscopic parameters not only permit prediction of the strong -branch transitions in the respective frequency range and up to slightly beyond those covered in the line lists, but also permit reliable to reasonable extrapolation up to about twice the upper experimental frequencies and probably up to covered in the line lists. Thus, accurate rest frequencies covering the entire present frequency range of ALMA are available for most thioformaldehyde isotopologs; in the case of HC34S, they cover all bands up to band 9. In addition, the 33S hyperfine structure of H2C33S has been reevaluated based on previous and present data.
We carried out quantum-chemical calculations to evaluate first order vibrational corrections to the ground state rotational parameters in order to approximate equilibrium rotational parameters which lead to semi-empirical structural parameters. Quantum-chemical calculations were also carried out to obtain structural parameters directly.
Additional observed rest frequencies include, for example, data for excited vibrational states of H2CS and H2C34S. We intend to report on these findings in a separate manuscript elsewhere in the near future.
Acknowledgements.
We acknowledge support by the Deutsche Forschungsgemeinschaft via the collaborative research centers SFB 494 (project E2) and SFB 956 (project B3) as well as the Gerätezentrum SCHL 341/15-1 (“Cologne Center for Terahertz Spectroscopy”). We are grateful to NASA for its support of the OSU program in laboratory astrophysics and the ARO for its support of the study of large molecules. HSPM thanks C. P. Endres and M. Koerber for support during some of the measurements in Köln. Our research benefited from NASA’s Astrophysics Data System (ADS).
Appendix A. Supplementary material
The reference list from the paper itself. Each links out to its DOI / PubMed record.
- 1Agúndez et al. (2008) Agúndez, M., Fonfría, J. P., Cernicharo, J., Pardo, J. R., & Guélin, M. 2008, A&A, 479, 493
- 2Bailleux et al. (1994) Bailleux, S., Bogey, M., Demuynck, C., Destombes, J.-L., & Walters, A. 1994, J. Chem. Phys., 101, 2729
- 3Becke (1993) Becke, A. D. 1993, J. Chem. Phys., 98, 5648
- 4Beers et al. (1972) Beers, Y., Klein, G. P., Kirchhoff, W. H., & Johnson, D. R. 1972, J. Mol. Spectrosc., 44, 553
- 5Belov et al. (1995) Belov, S. P., Lewen, F., Klaus, T., & Winnewisser, G. 1995, J. Mol. Spectrosc., 174, 606
- 6Berglund & Wieser (2011) Berglund, M., & Wieser, M. E. 2011, Pure Appl. Chem., 83, 397
- 7Brown et al. (1987) Brown, R. D., Godfrey, P. D., Mc Naughton, D., & Yamanouchi, K. 1987, Mol. Phys., 62, 1429
- 8Christen (1978) Christen, D. 1978, J. Mol. Struct., 48, 101