Efficient space virtualisation for Hoshen--Kopelman algorithm
M. Kotwica, P. Gronek, K. Malarz

TL;DR
This paper introduces an efficient space virtualisation technique for the Hoshen--Kopelman algorithm, enabling minimal parallel overhead and application to compute percolation thresholds in four-dimensional lattices with various neighbor configurations.
Contribution
The paper presents a novel space virtualisation method for the Hoshen--Kopelman algorithm, reducing communication costs and demonstrating its effectiveness in calculating percolation thresholds in complex 4D lattices.
Findings
Minimal parallel overhead observed during computations.
Accurate percolation thresholds obtained for various neighbor configurations.
Method applicable to high-dimensional lattice percolation problems.
Abstract
In this paper the efficient space virtualisation for Hoshen--Kopelman algorithm is presented. We observe minimal parallel overhead during computations, due to negligible communication costs. The proposed algorithm is applied for computation of random-site percolation thresholds for four dimensional simple cubic lattice with sites' neighbourhoods containing next-next-nearest neighbours (3NN). The obtained percolation thresholds are , , , , , , , where 2NN and NN stand for next-nearest neighbours and nearest neighbours, respectively.
Click any figure to enlarge with its caption.
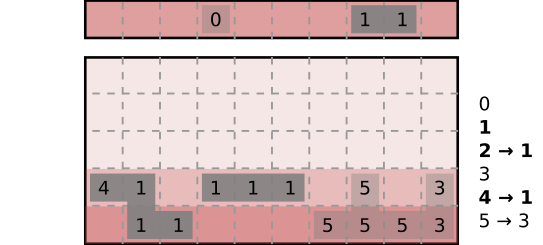 Figure 1
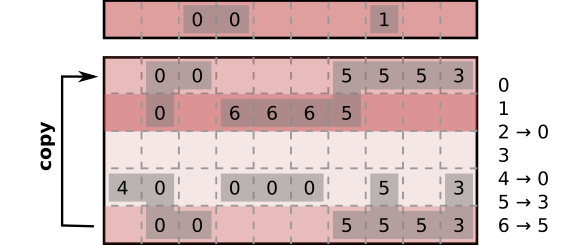 Figure 2
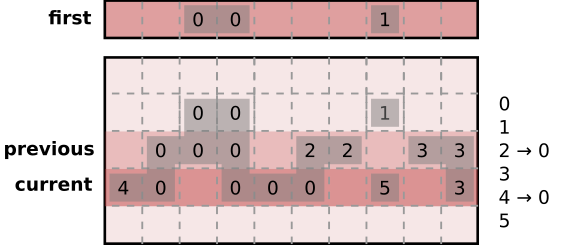 Figure 3
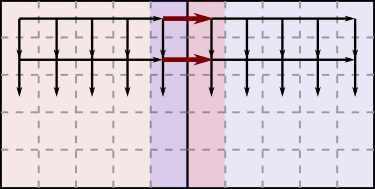 Figure 4
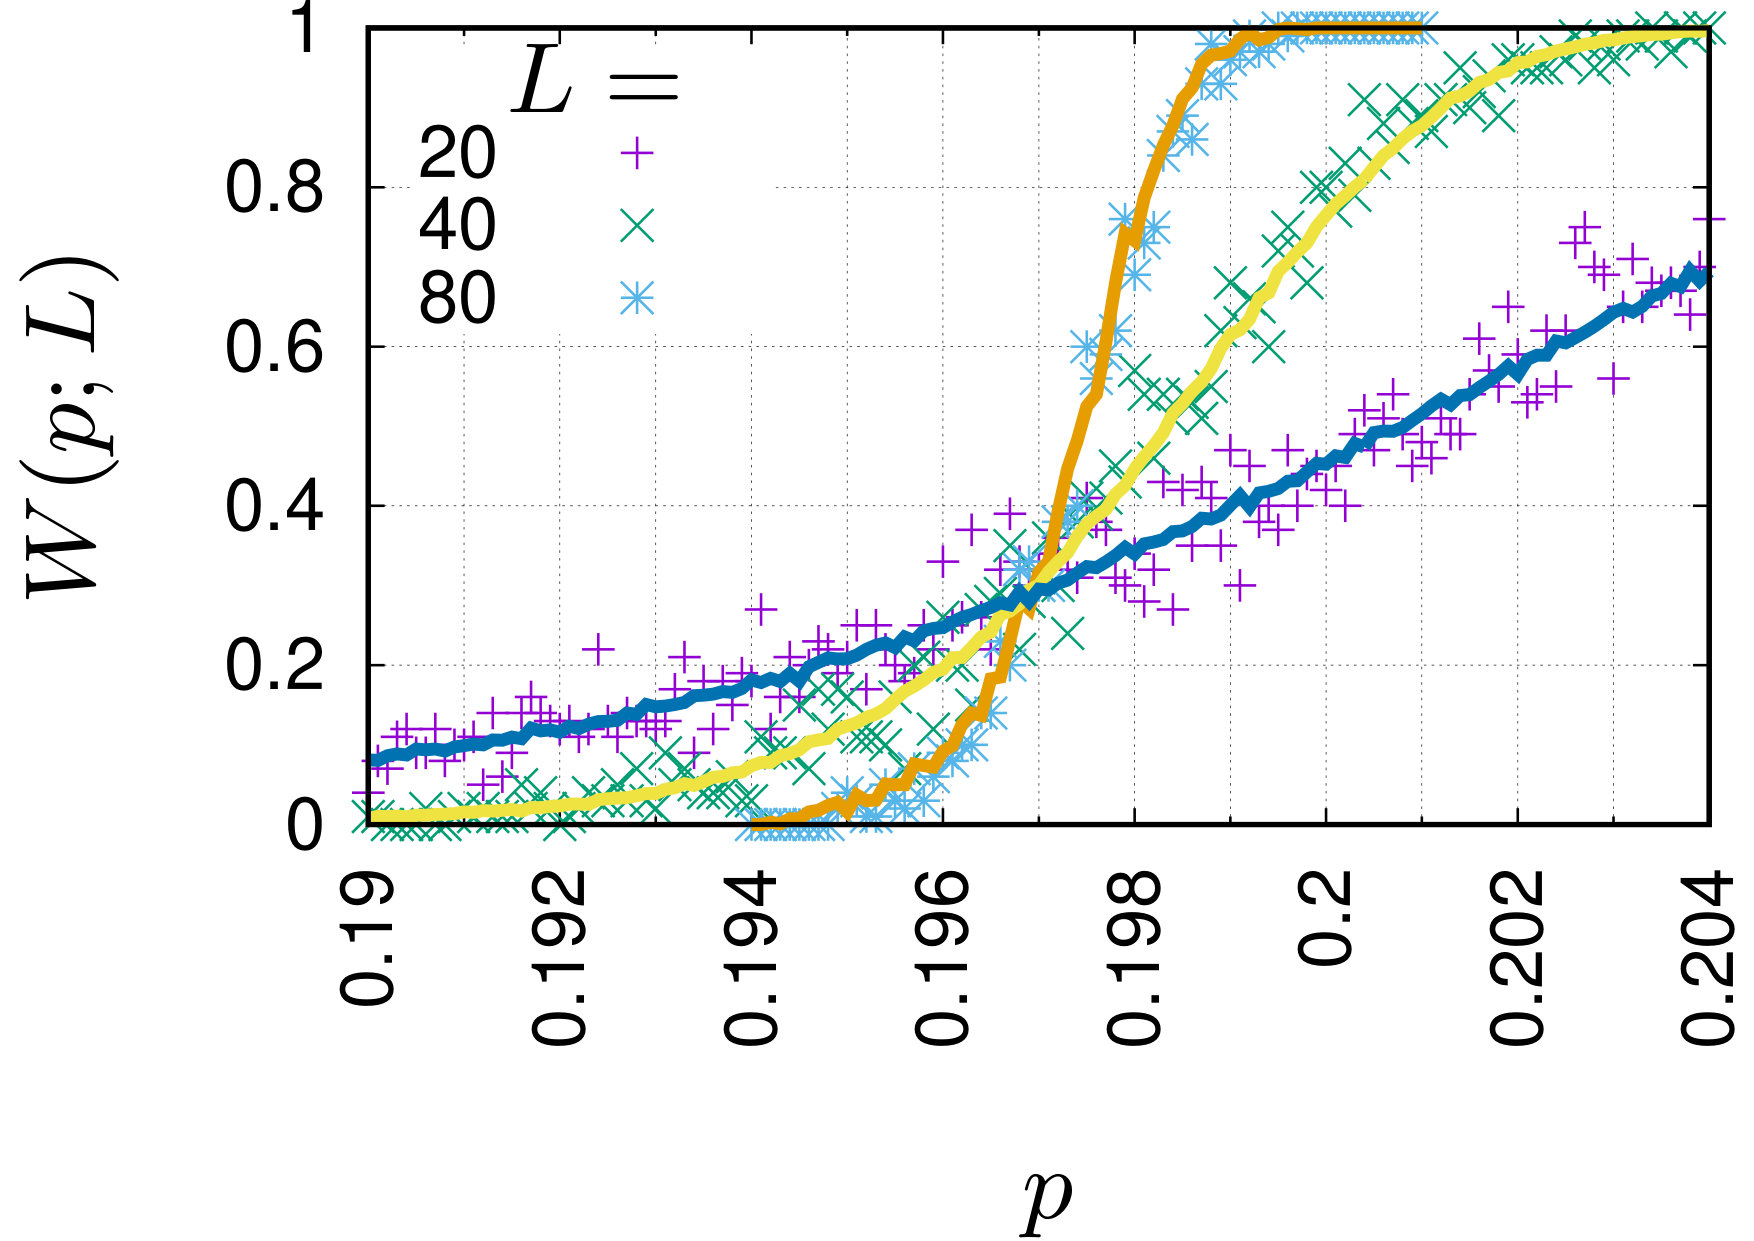 Figure 5
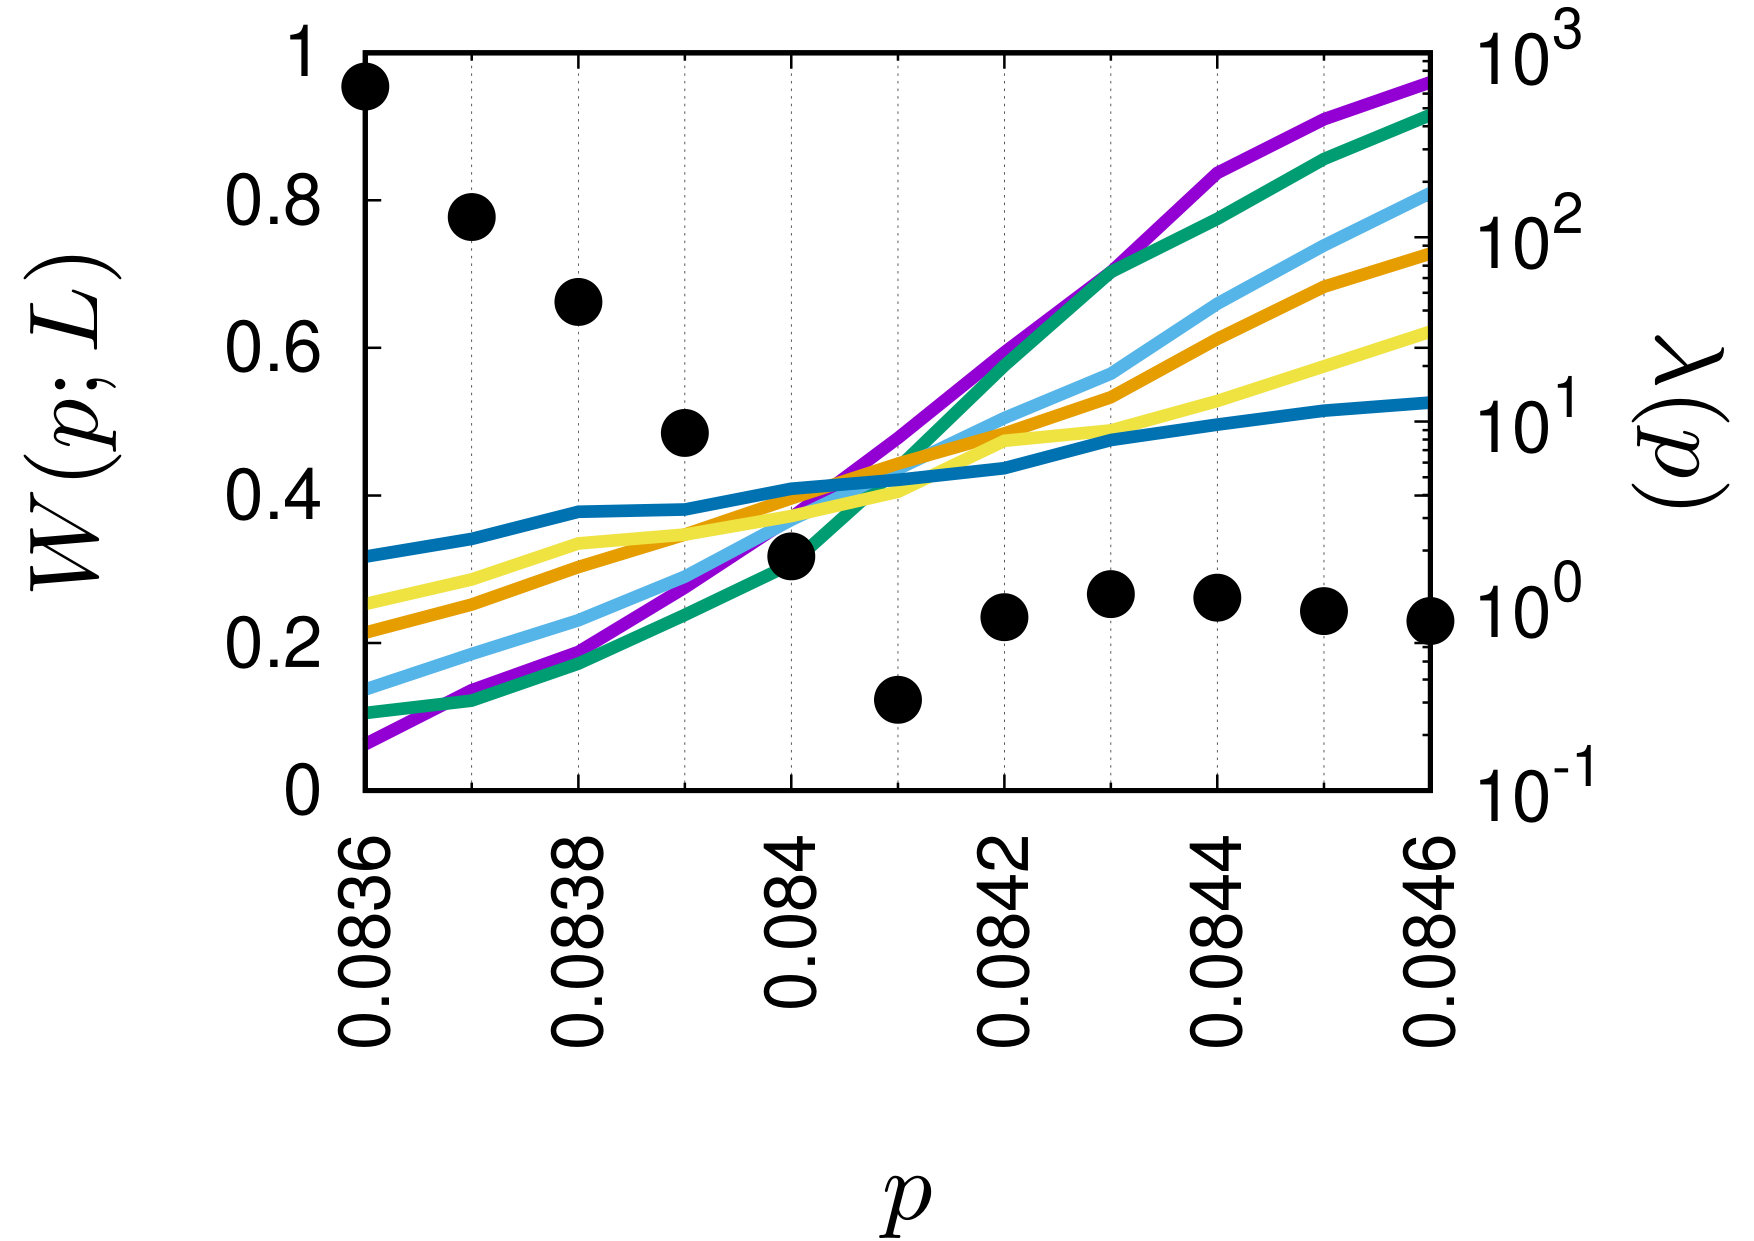 Figure 6
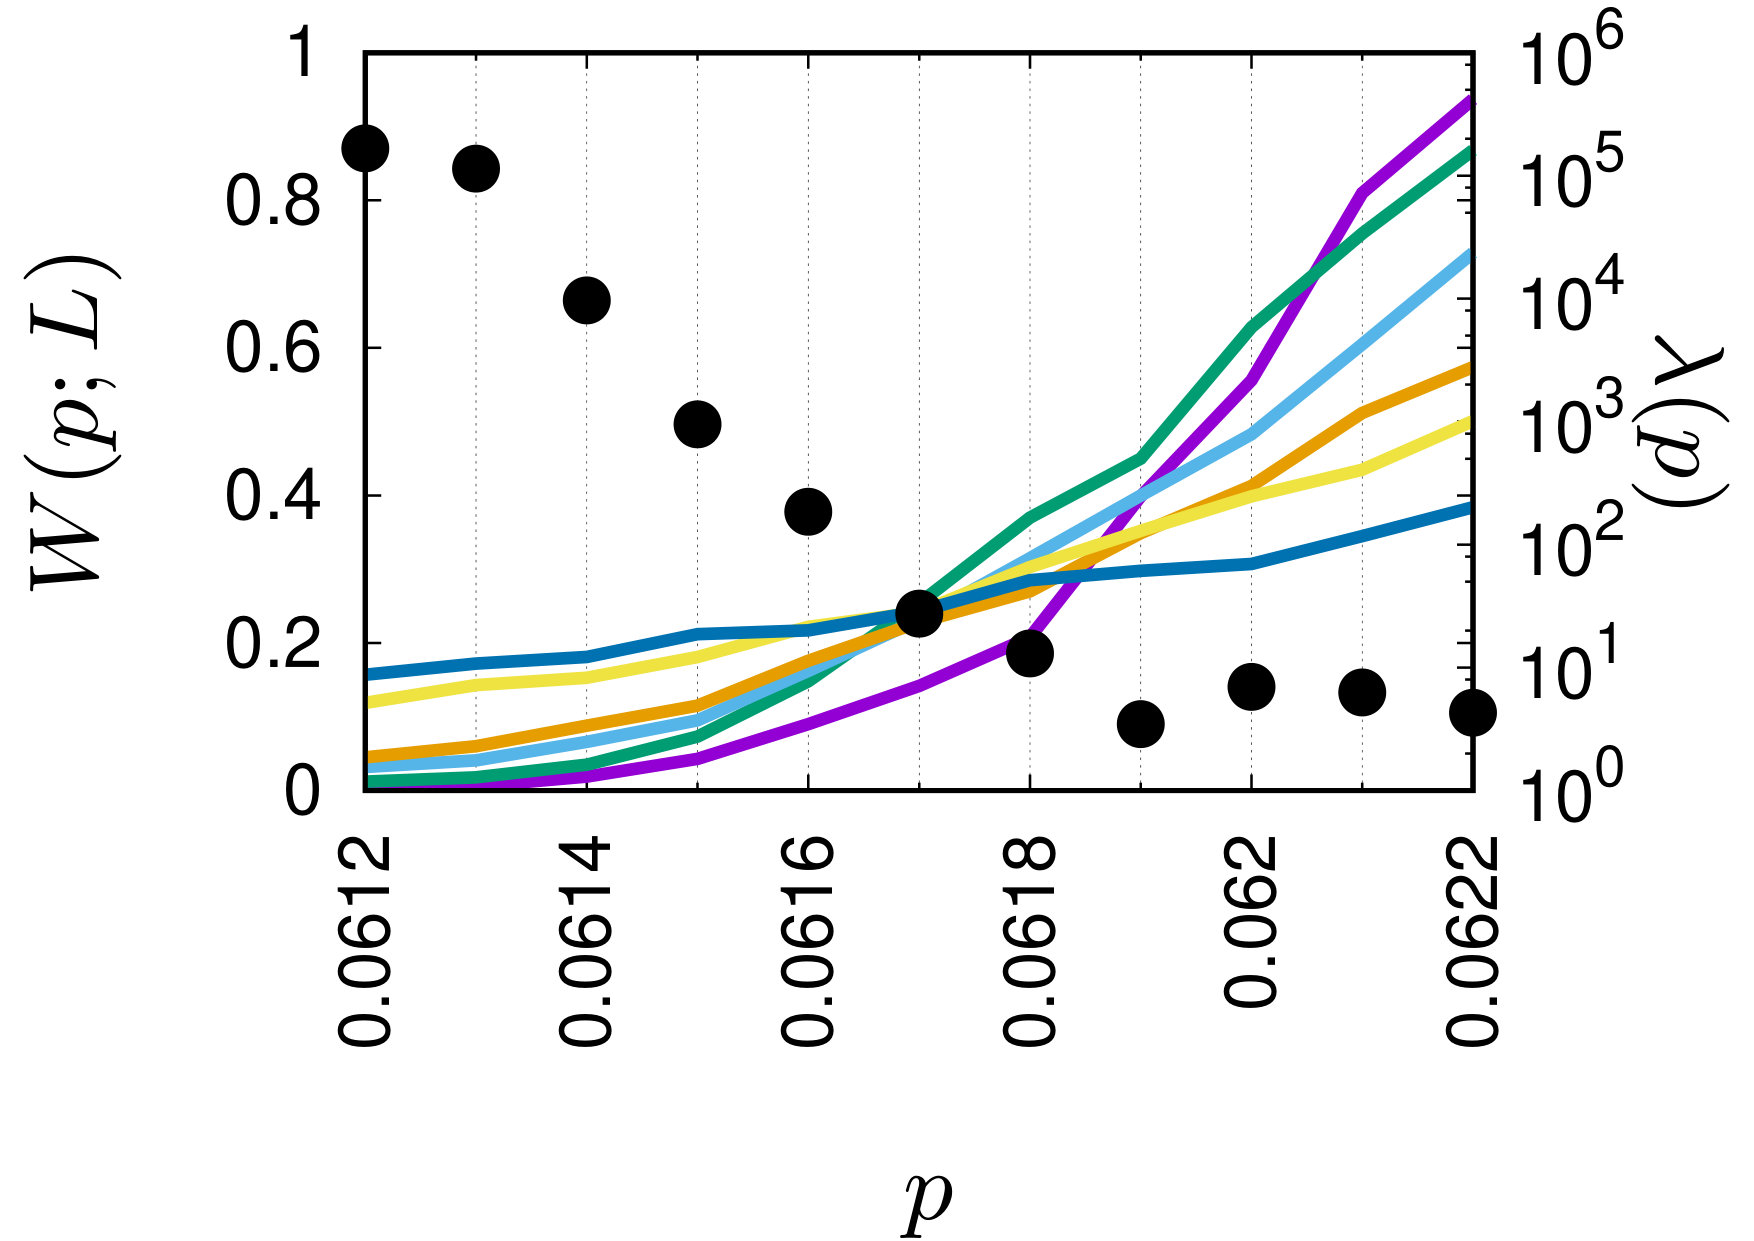 Figure 7
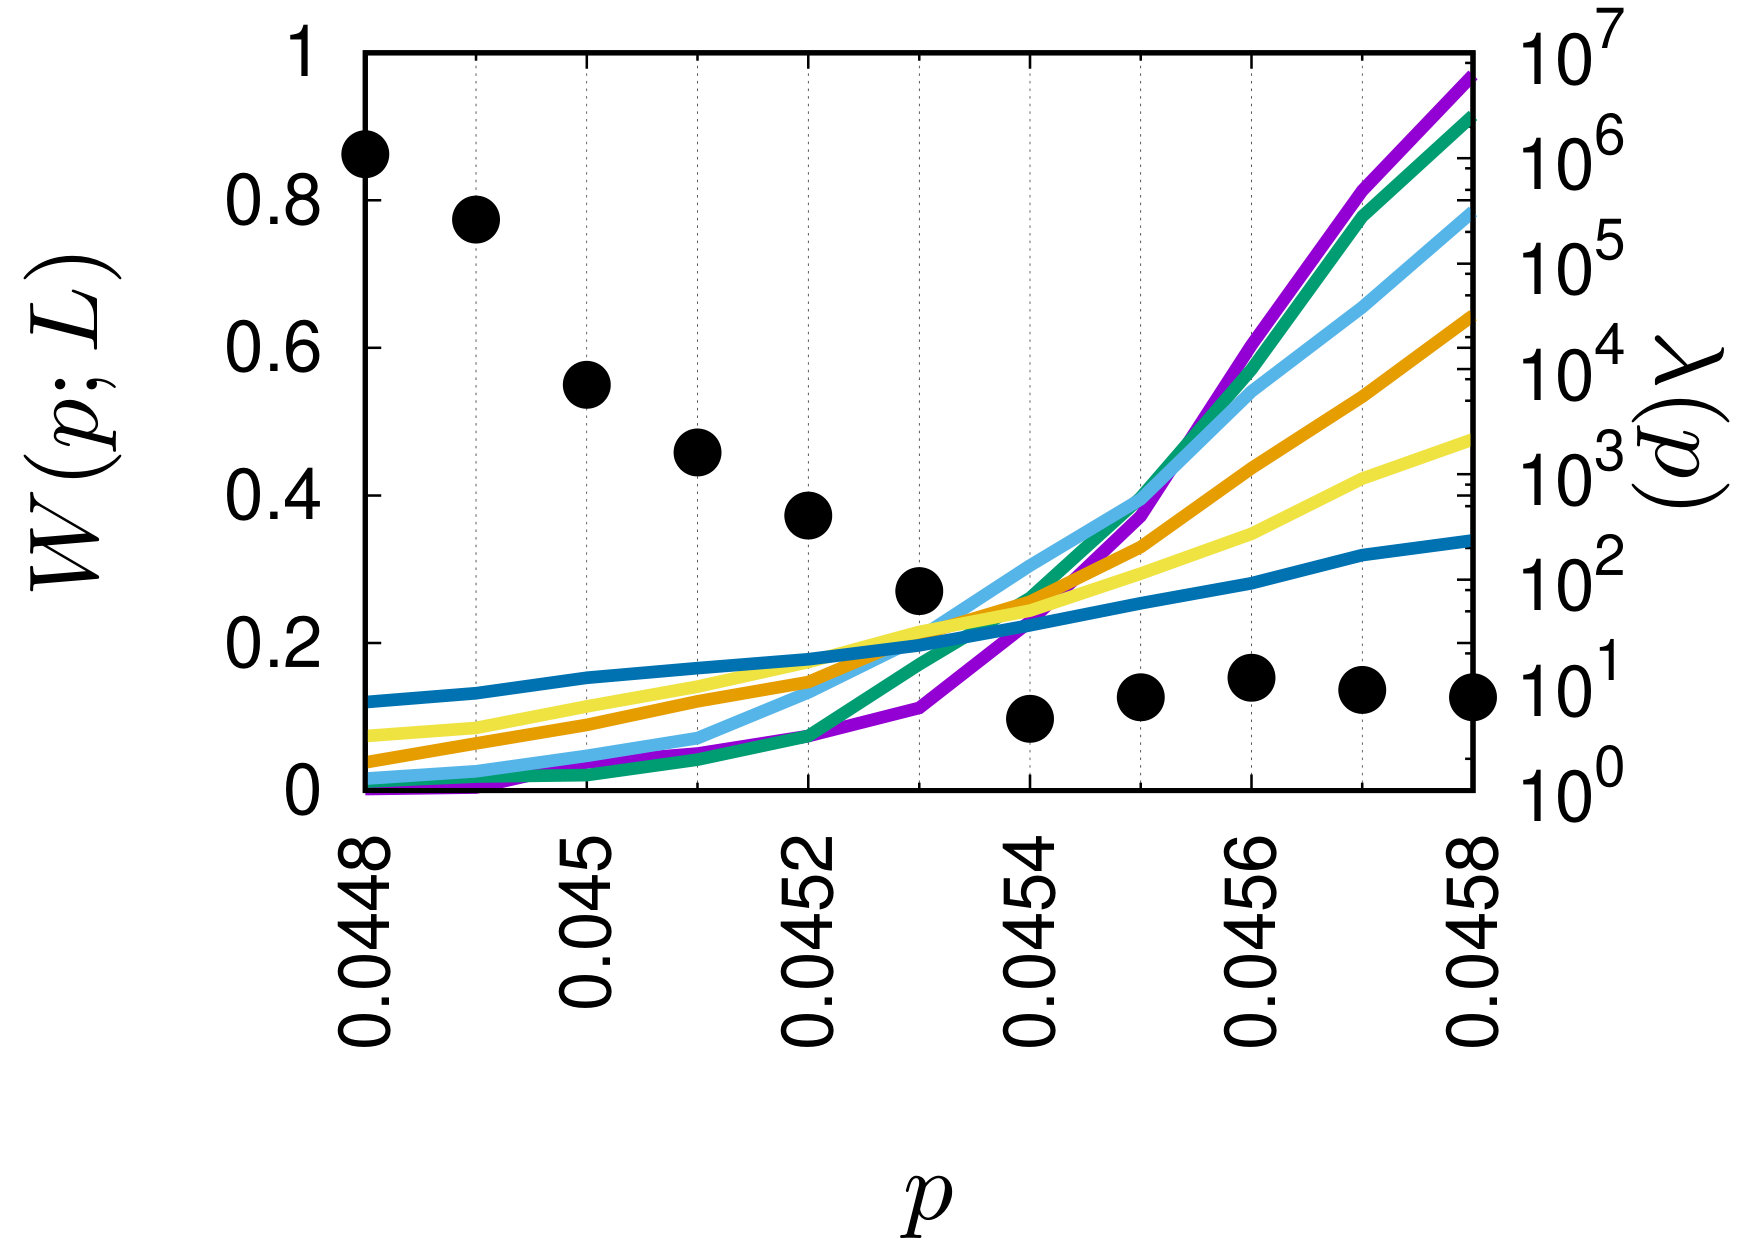 Figure 8
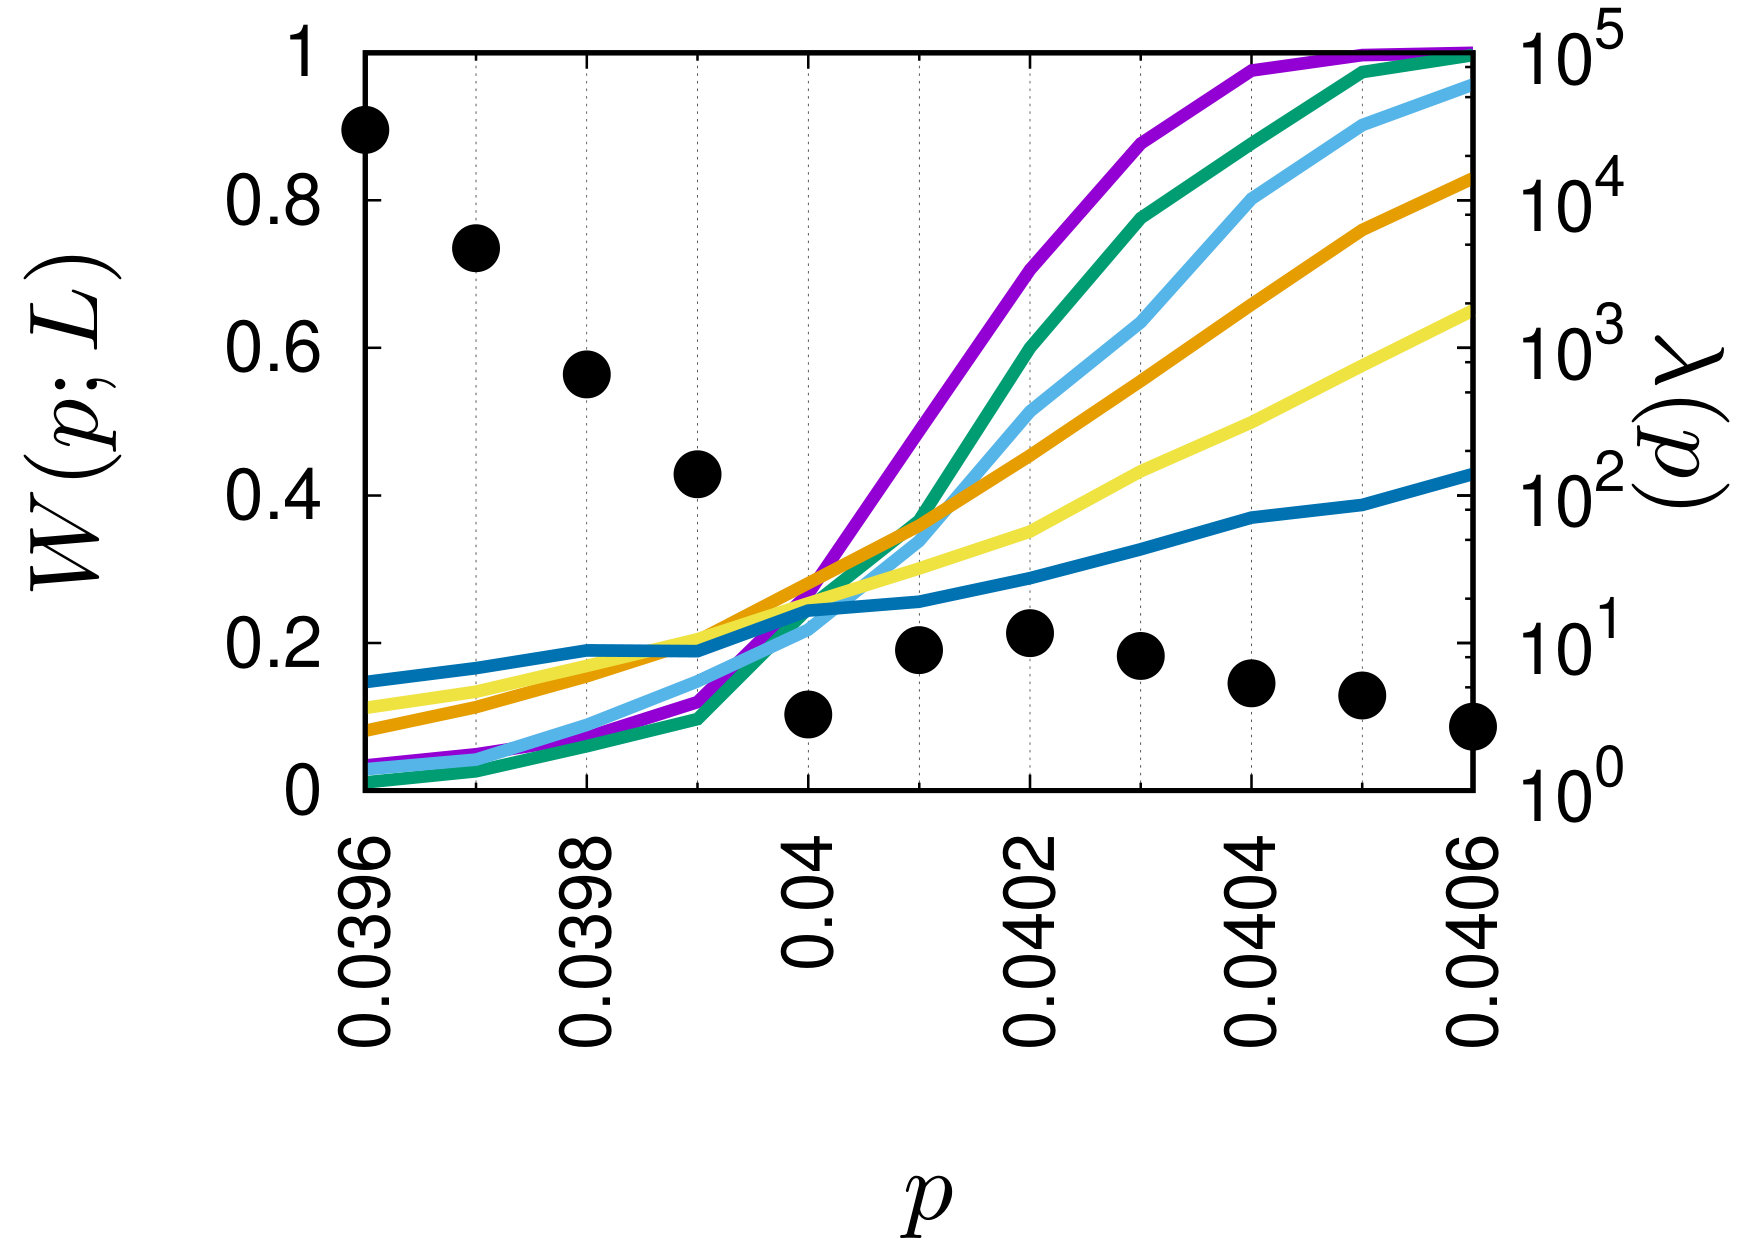 Figure 9
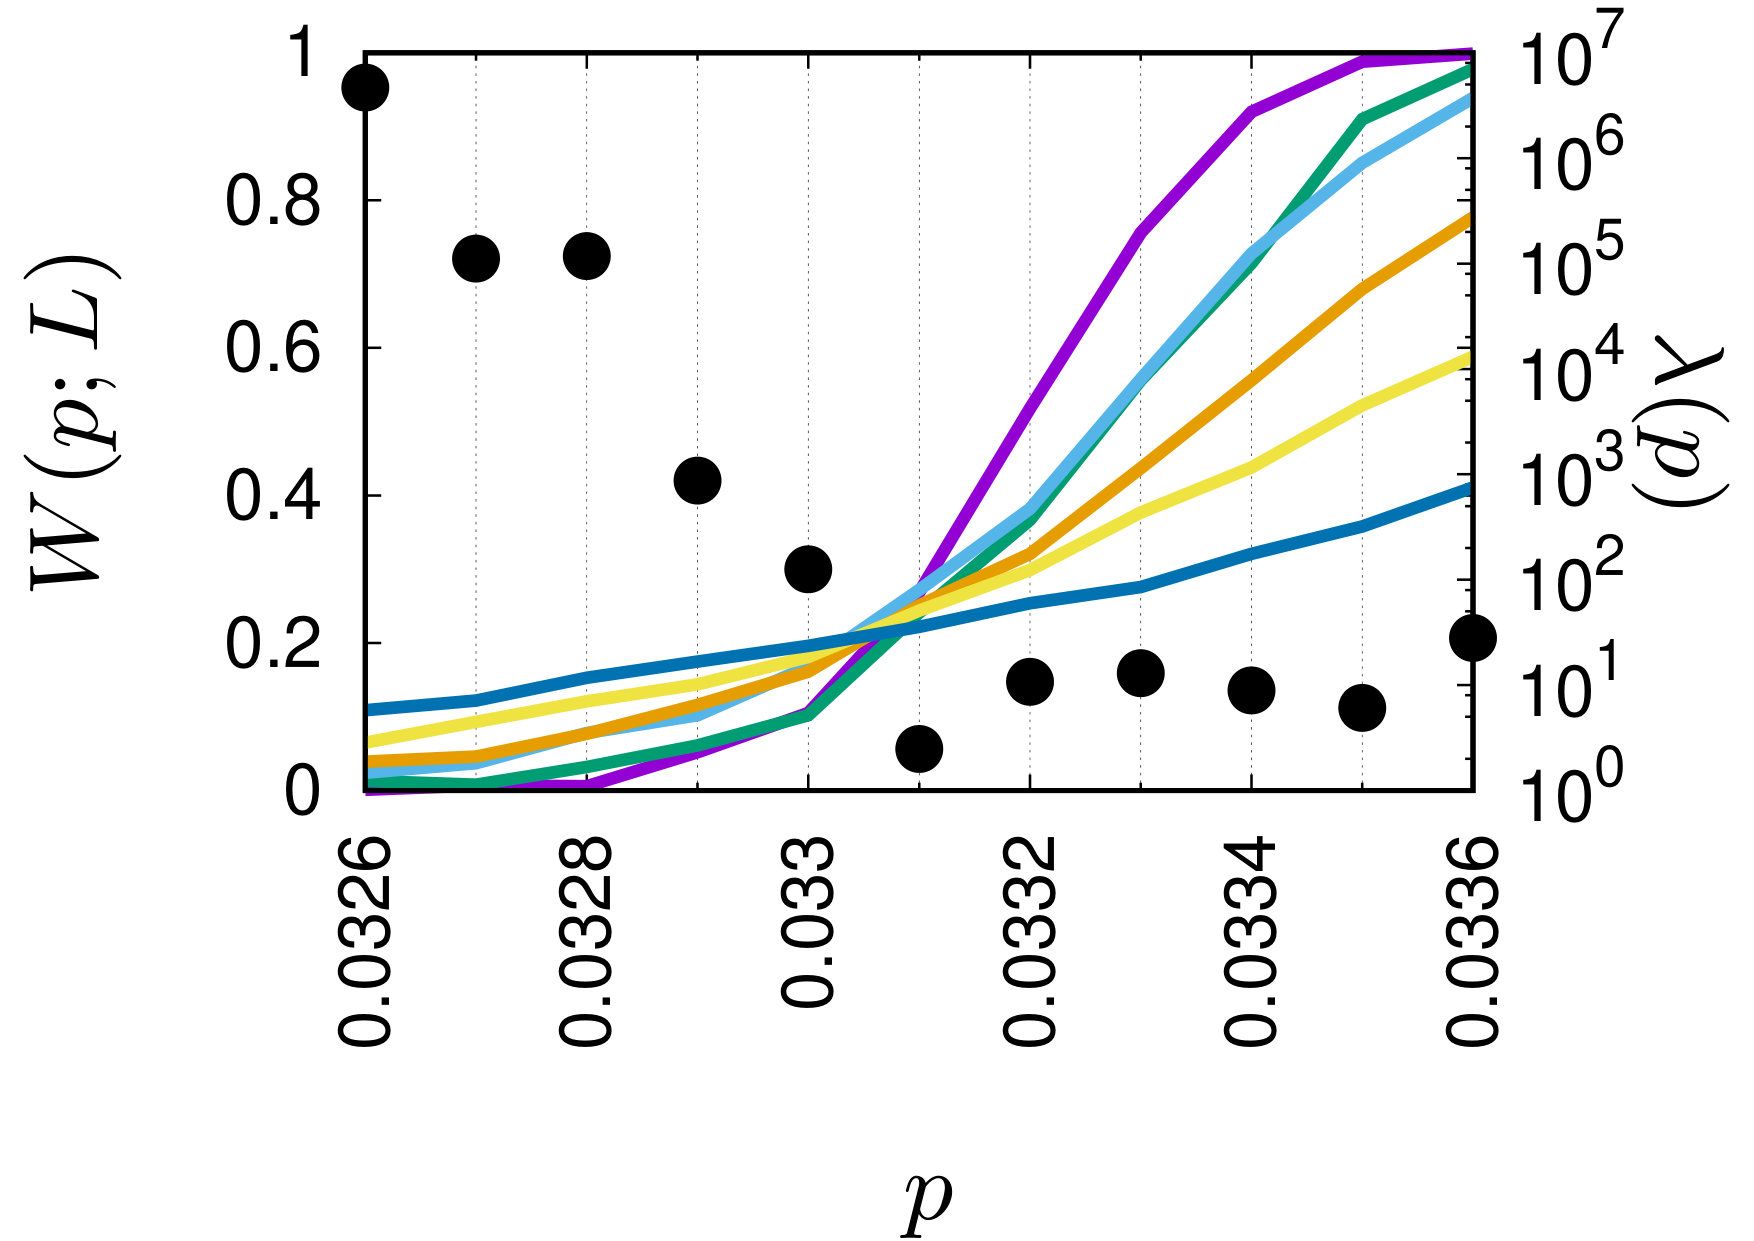 Figure 10
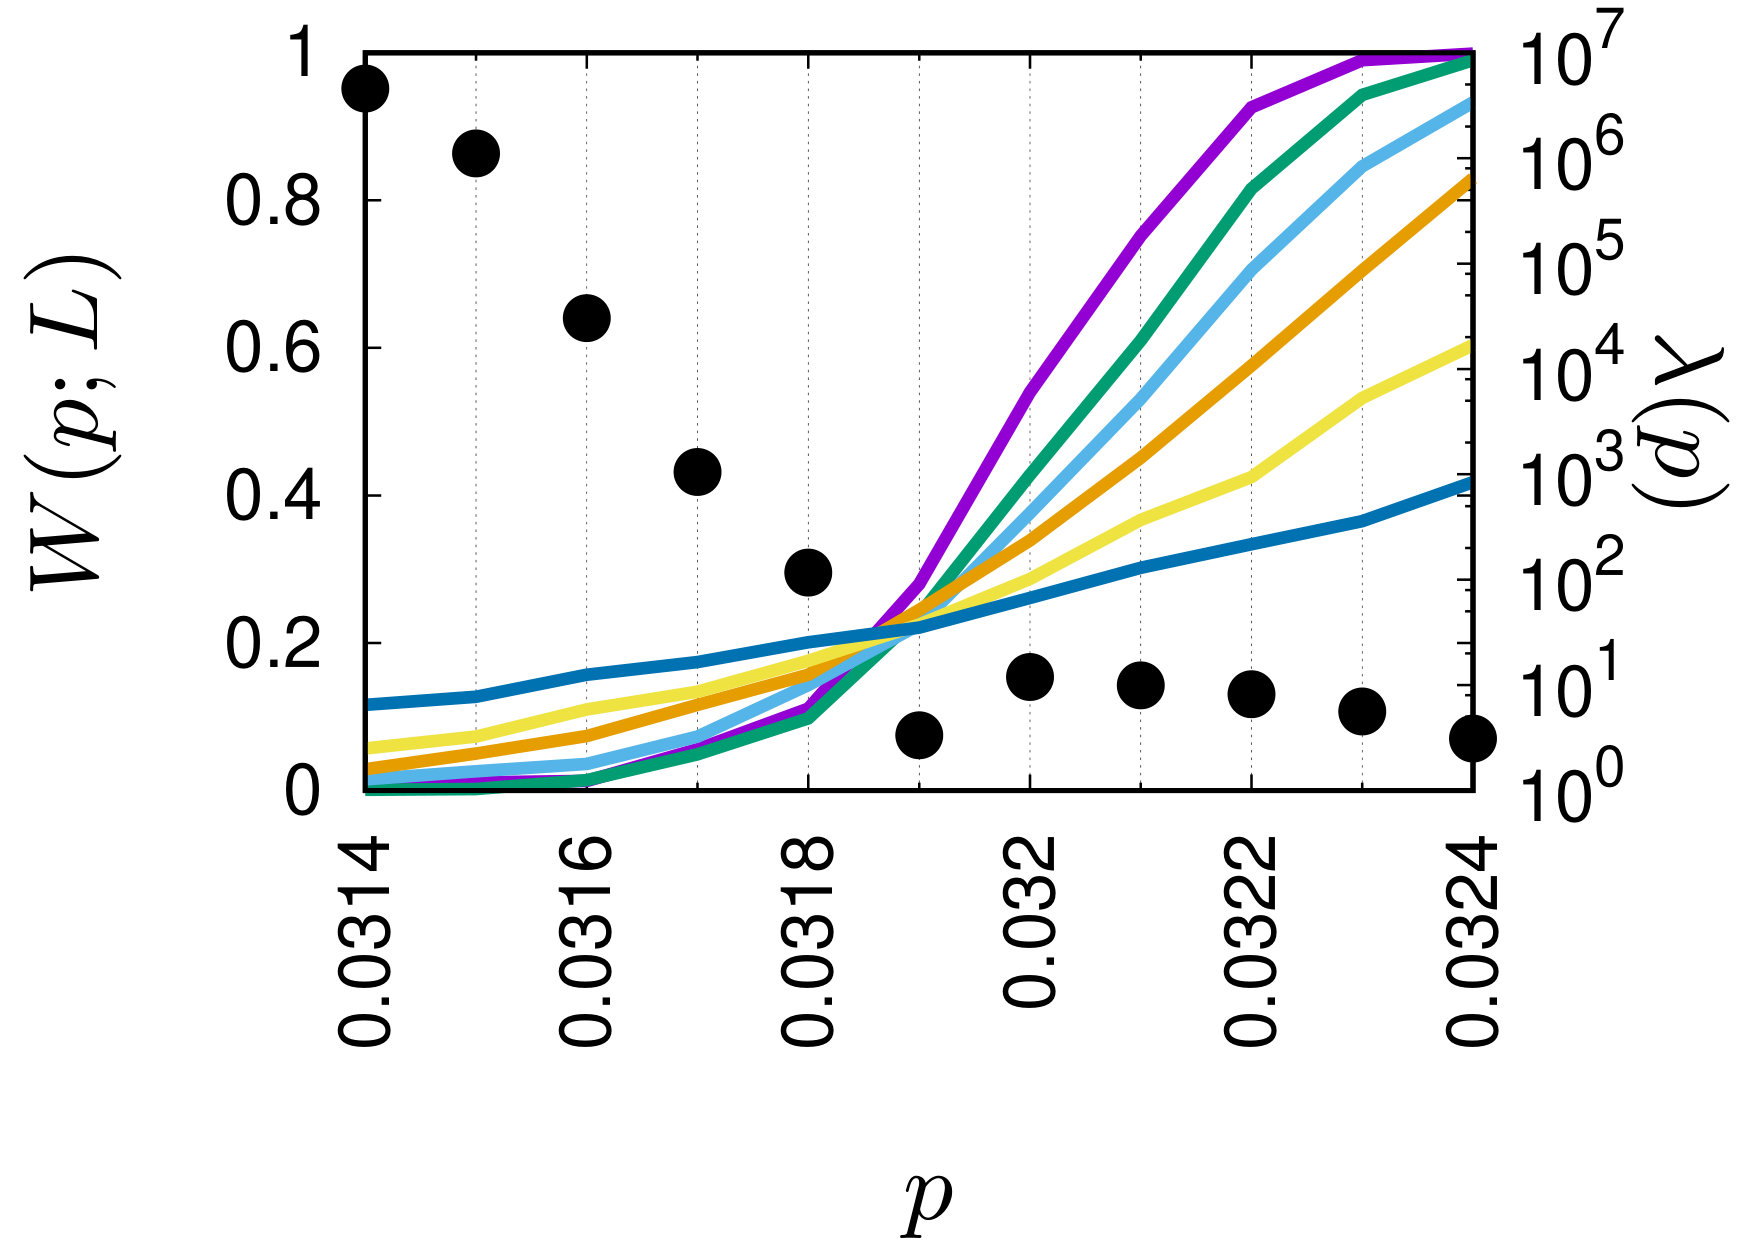 Figure 11
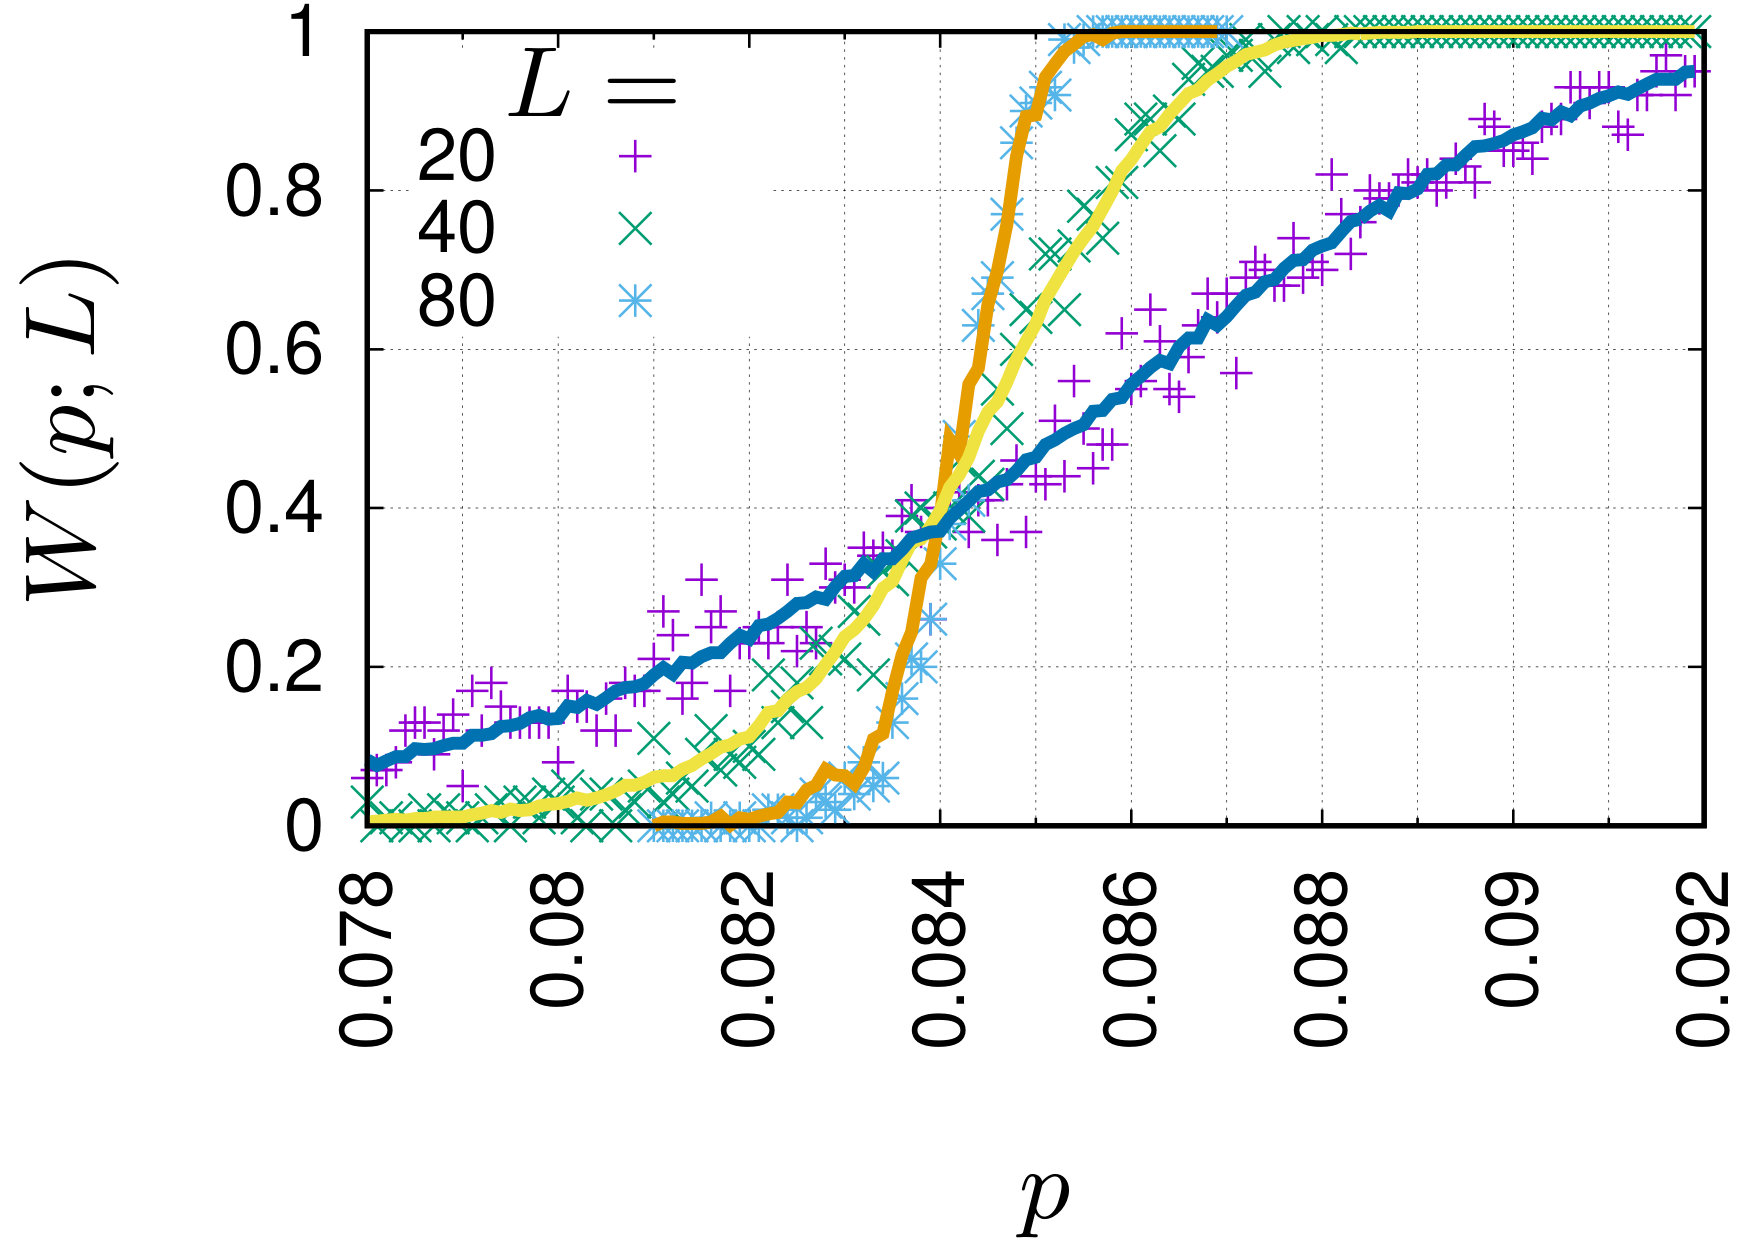 Figure 12
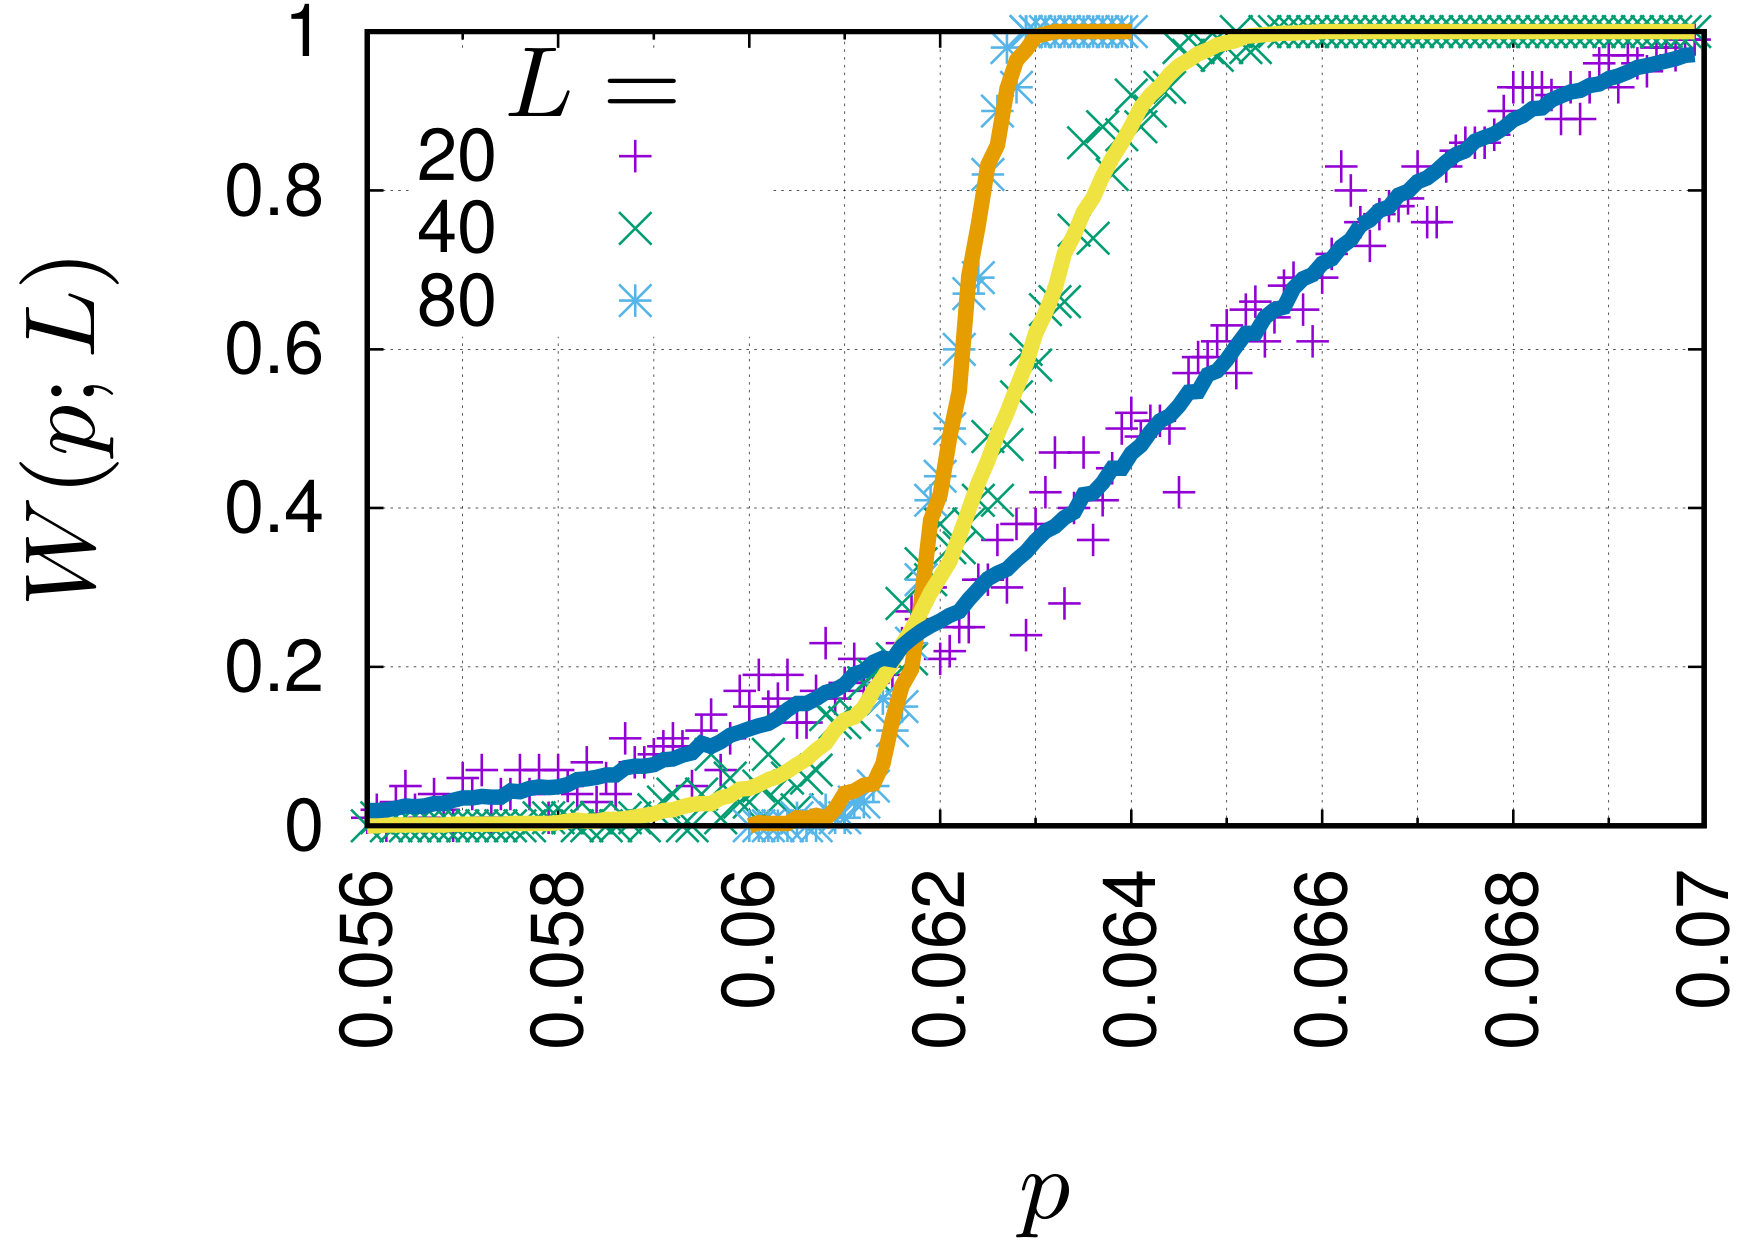 Figure 13
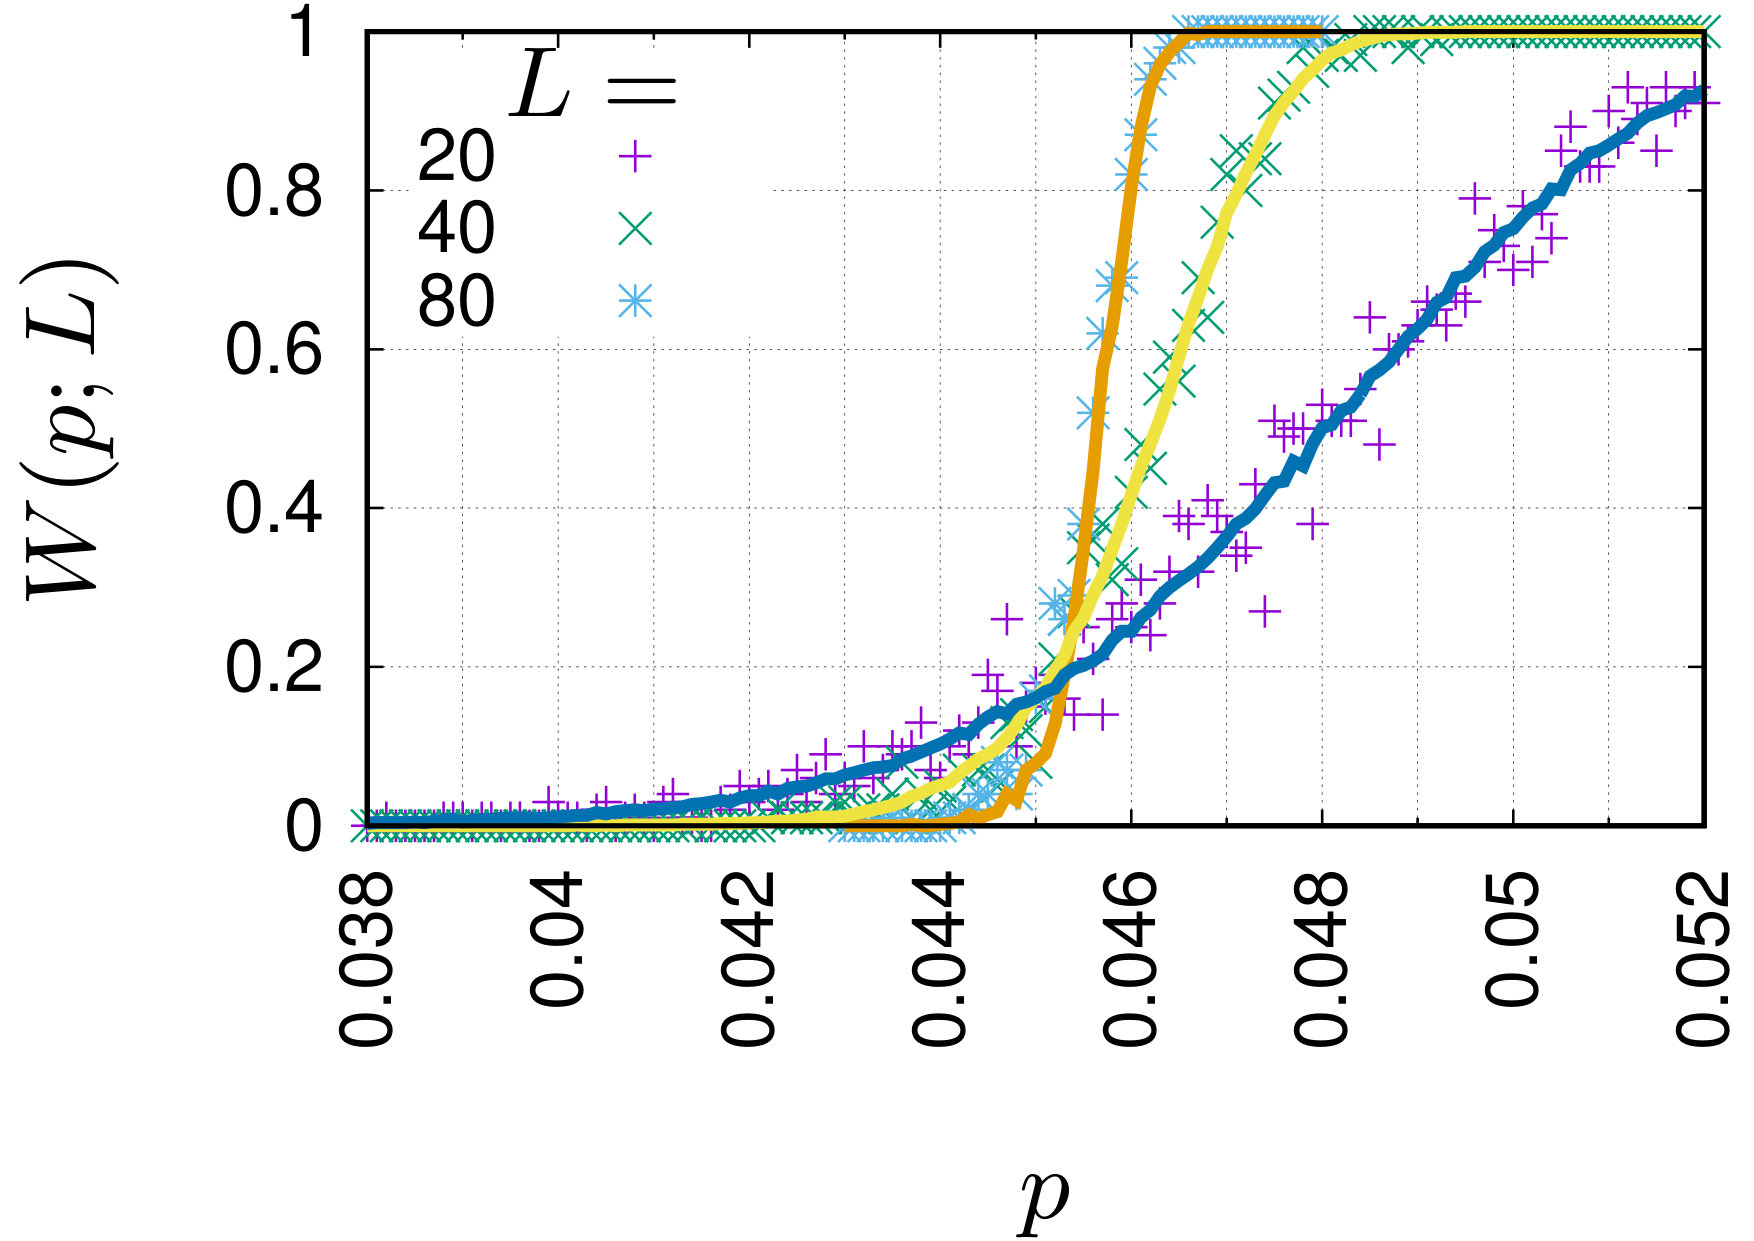 Figure 14
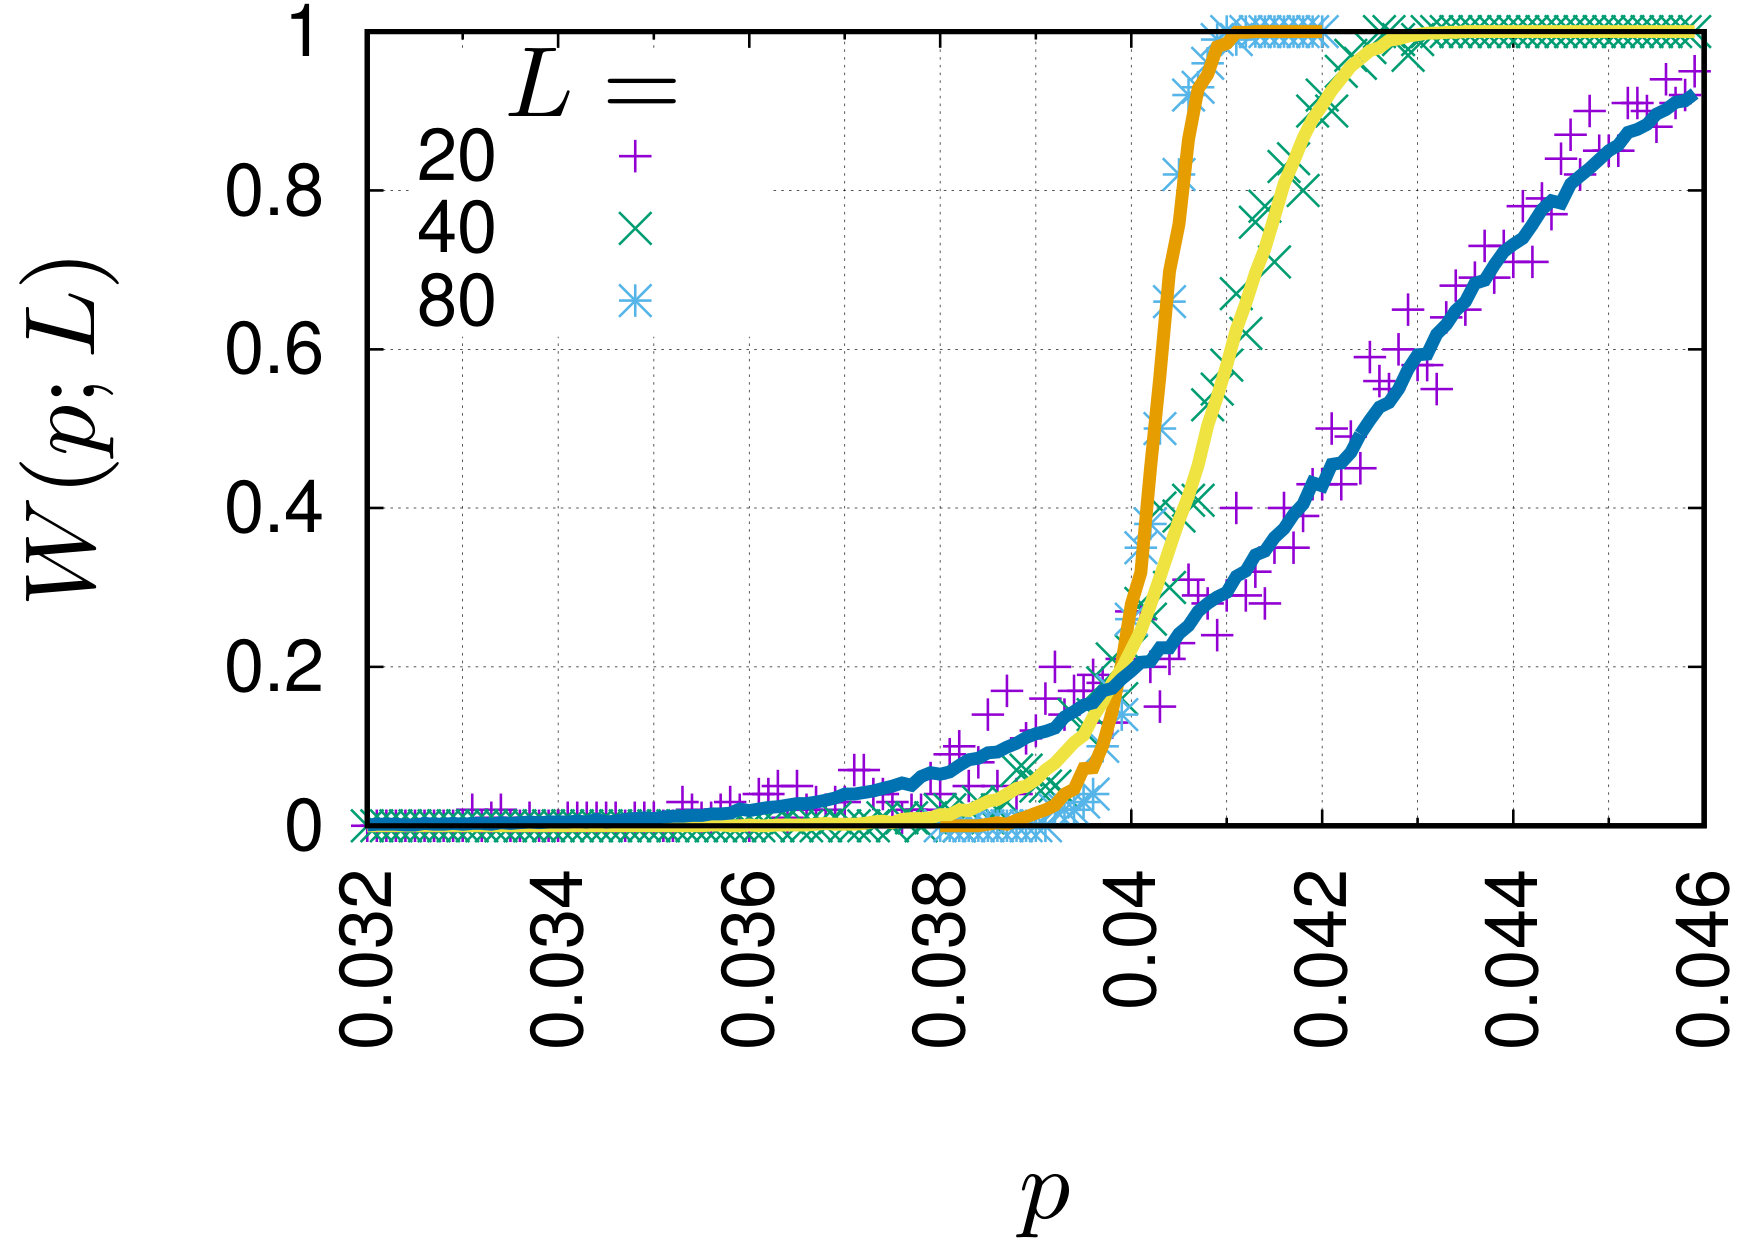 Figure 15
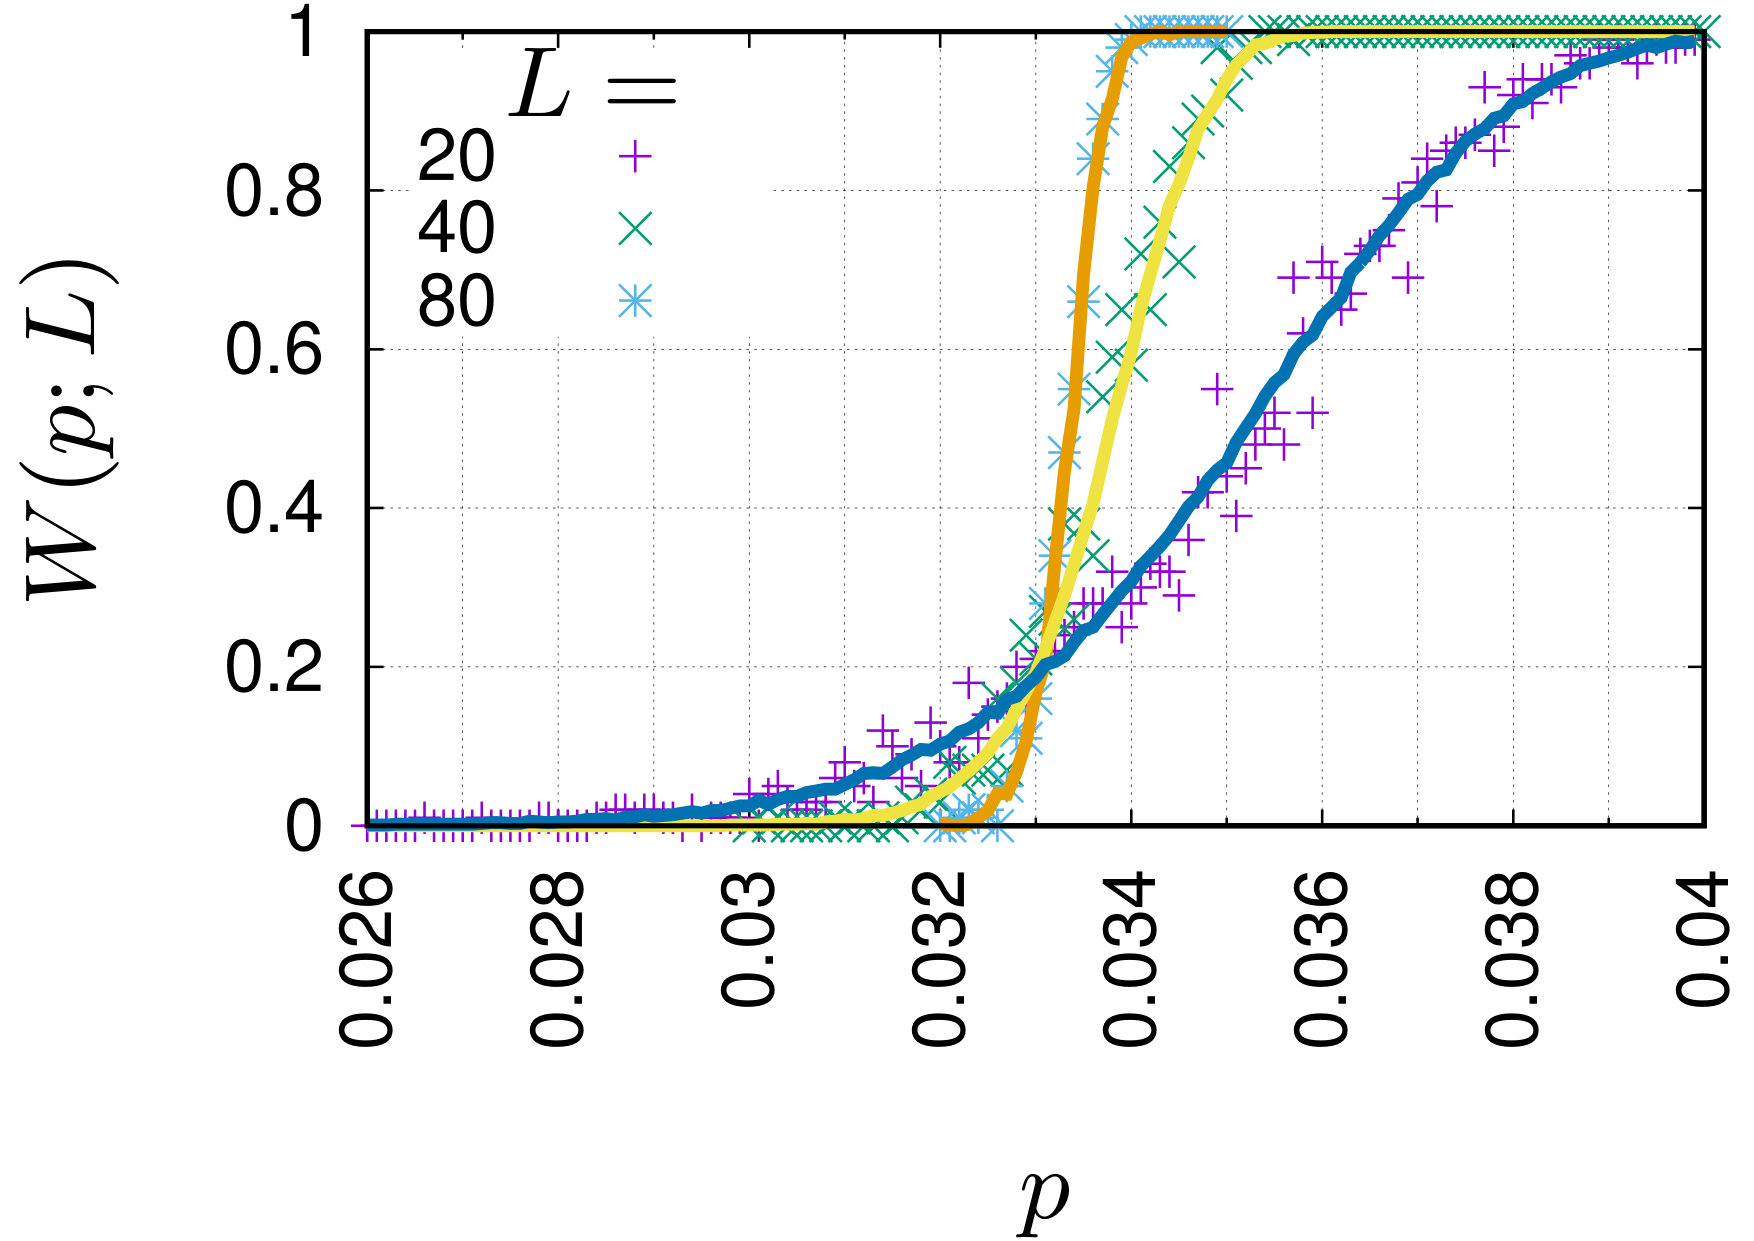 Figure 16
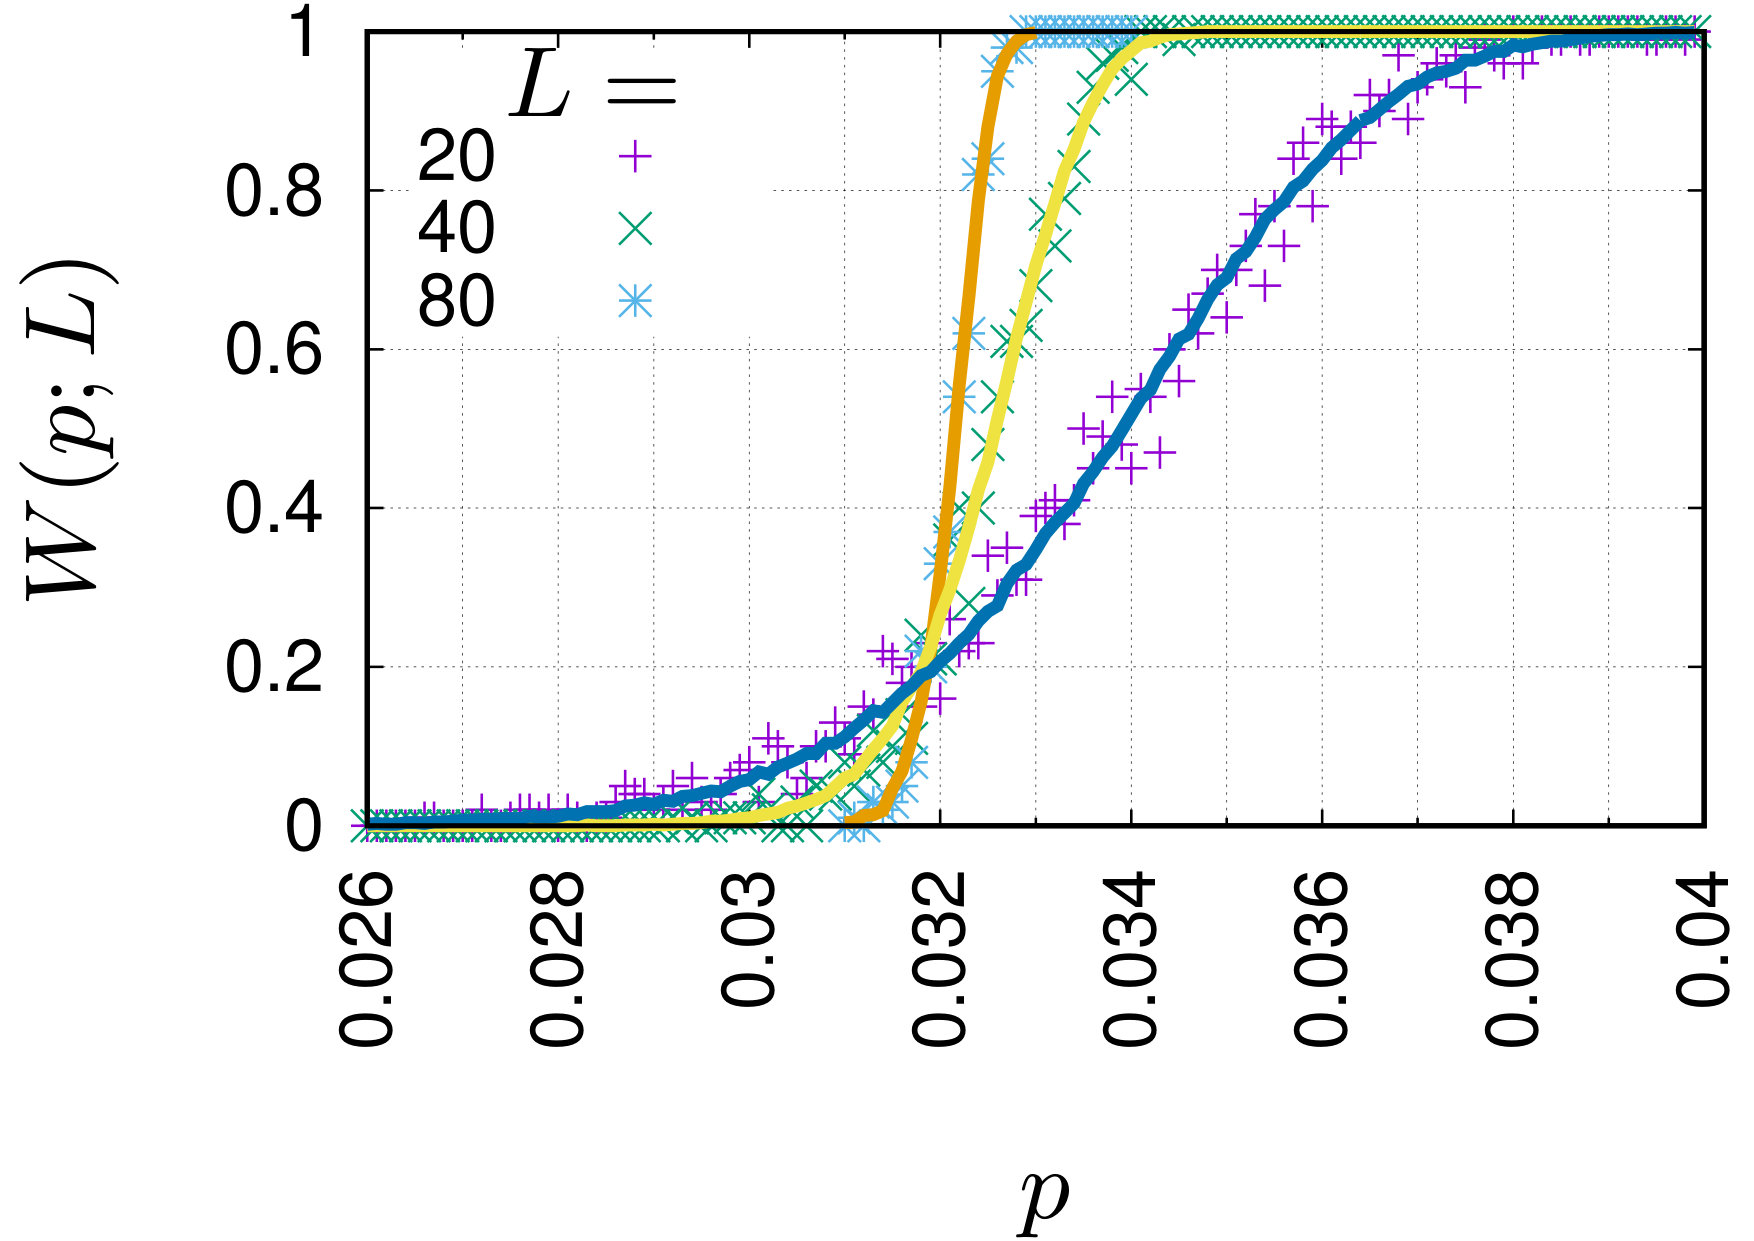 Figure 17
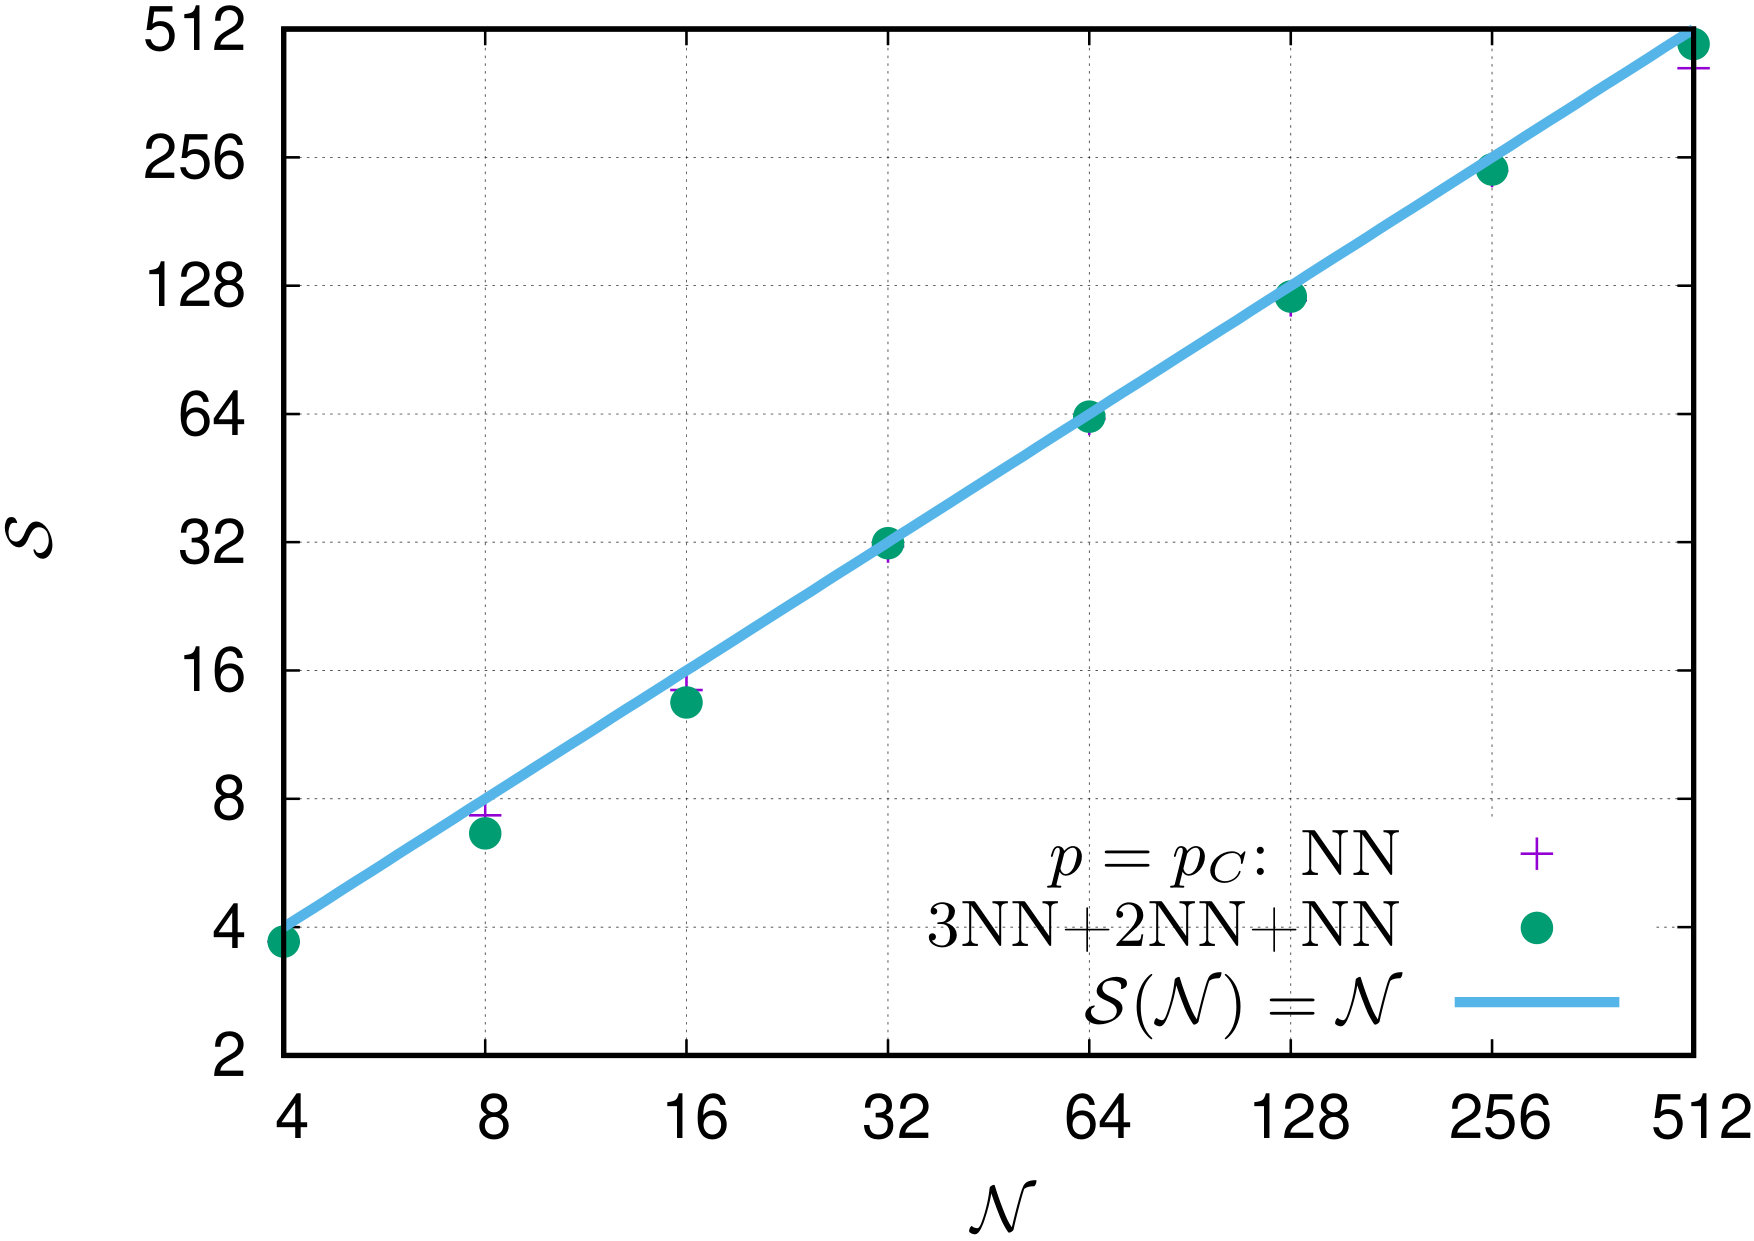 Figure 18
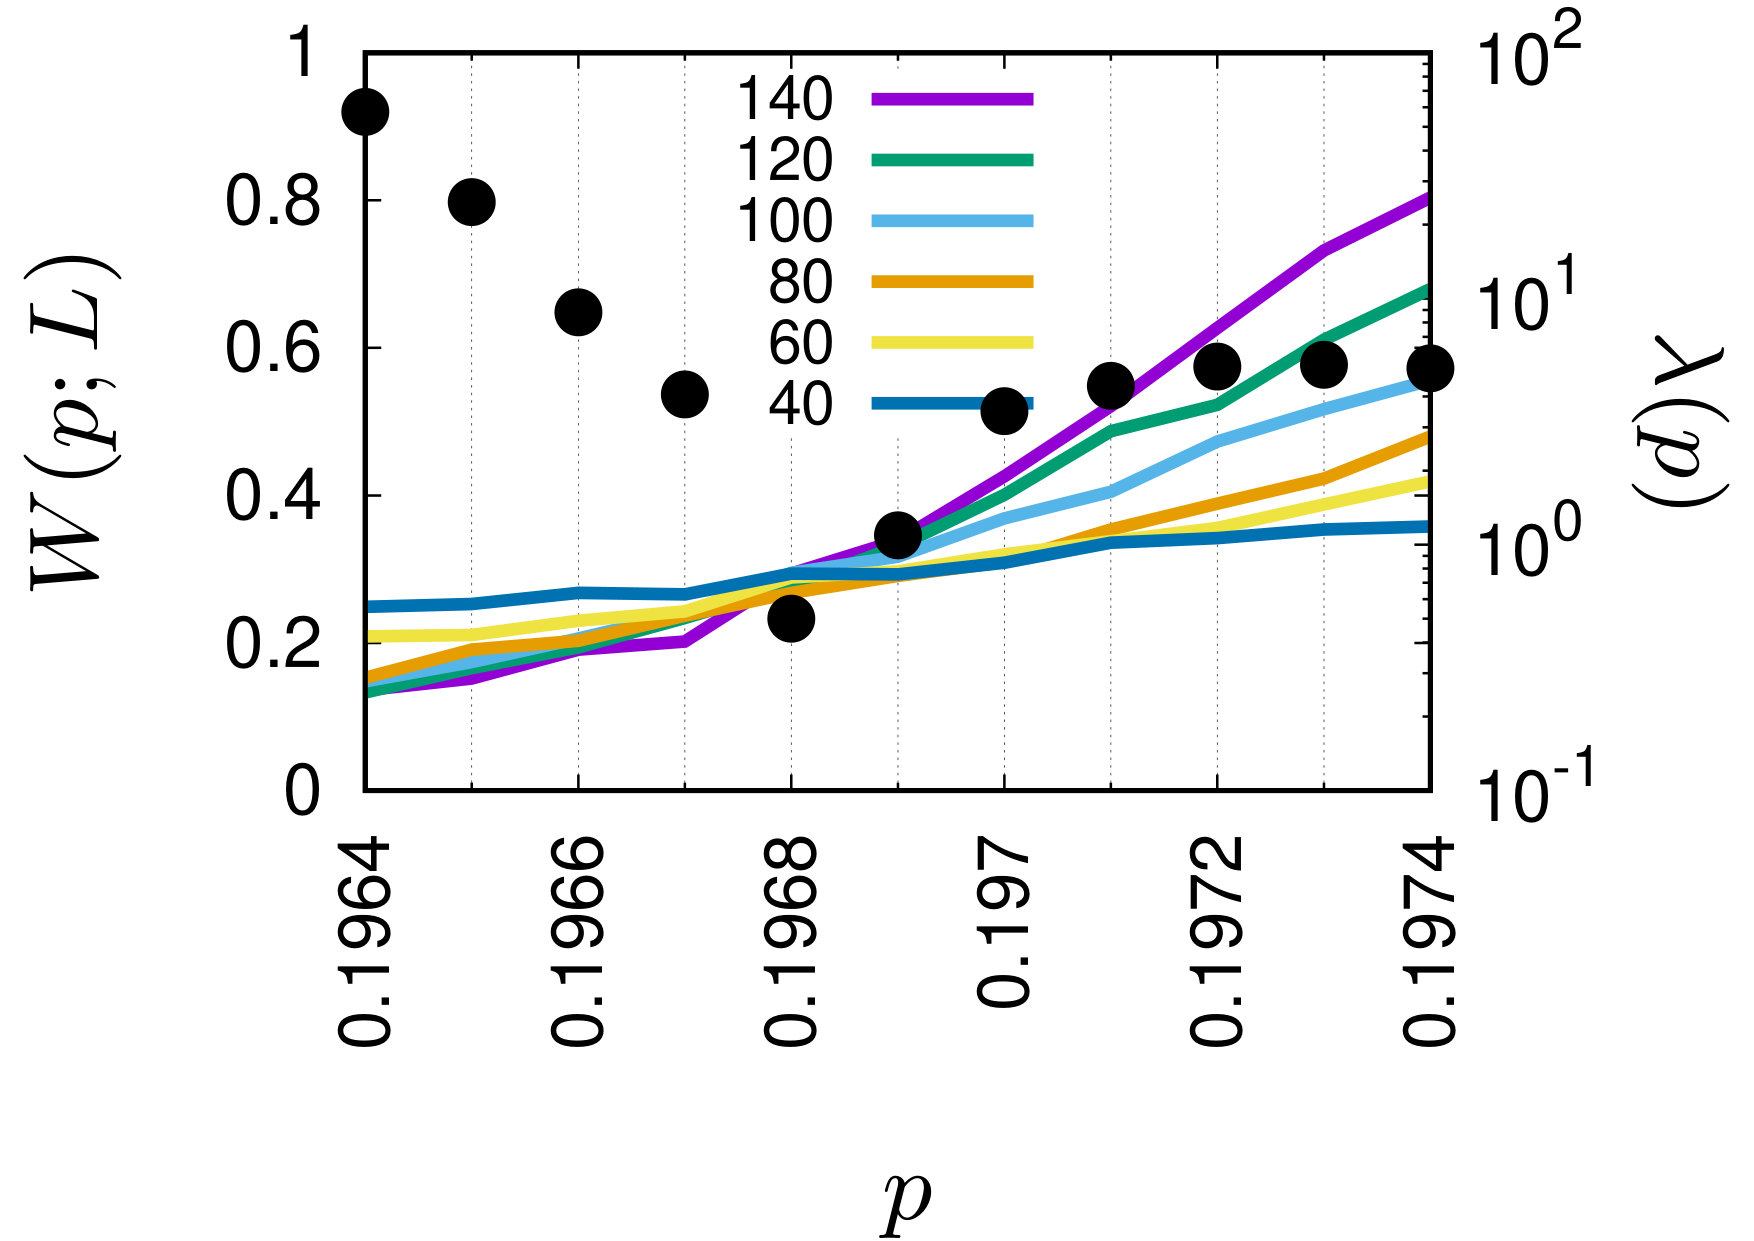 Figure 19
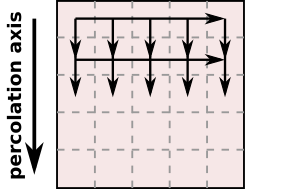 Figure 20
| neighbourhood | ||
|---|---|---|
| NN | 8 | |
| 2NN | 24 | |
| 2NN+NN | 32 | |
| 3NN | 32 | |
| 3NN+NN | 40 | |
| 3NN+2NN | 58 | |
| 3NN+2NN+NN | 64 |
Peer Reviews
No public reviews on file for this paper yet. If you reviewed it on a platform where reviews are public (OpenReview, ICLR, NeurIPS, ICML), you can paste yours below so the community can read it here.
Videos
No videos yet. Explain this paper in a talk, walkthrough, or lecture? Add one.
Efficient space virtualisation for Hoshen–Kopelman algorithm
M. Kotwica
P. Gronek
K. Malarz http://home.agh.edu.pl/malarz/ [email protected]
AGH University of Science and Technology, Faculty of Physics and Applied Computer Science, al. Mickiewicza 30, 30-059 Kraków, Poland
Abstract
In this paper the efficient space virtualisation for the Hoshen–Kopelman algorithm is presented. We observe minimal parallel overhead during computations, due to negligible communication costs. The proposed algorithm is applied for computation of random-site percolation thresholds for four dimensional simple cubic lattice with sites’ neighbourhoods containing next-next-nearest neighbours (3NN). The obtained percolation thresholds are , , , , , , , where 2NN and NN stand for next-nearest neighbours and nearest neighbours, respectively.
Complex neighbourhoods. Phase transition in finite-size systems. Applications of Monte Carlo methods in mathematical physics. Parallel computations. Message Passing Interface.
pacs:
64.60.ah,64.60.an,02.70.Uu,05.10.-a,89.70.Eg
I Introduction
Percolating systems Broadbent and Hammersley (1957); *Frisch1961; *Frisch1962; Stauffer and Aharony (1994); Bollobás and Riordan (2006); Kesten (1982); Sahimi (1994) are examples of system where purely geometrical phase transition may be observed (see Ref. Saberi (2015) for recent review). The majority of percolating systems which may be mapped to real-world problems deal with two- or three-dimensional space and ranges from condensed matter physics Clancy et al. (2014); *Silva2011; *Shearing2010; *Halperin2010 via rheology Mun et al. (2014); *Amiaz2011; *Bolandtaba2011; *Mourzenko2011 and forest fires Abades et al. (2014); *Camelo-Neto2011; *Guisoni2011; *Simeoni2011; *Kaczanowska2002 to immunology Silverberg et al. (2014); *Suzuki2011; *Lindquist2011; *Naumova2008; *Floyd2008 and quantum mechanics Chandrashekar (2014). However, computer simulations are conducted also for systems with non-physical dimensions (up to ) Stauffer and Ziff (2000); Paul et al. (2001); Grassberger (2003); Ballesteros et al. (1997); van der Marck (1998a); van der Marck (1998b).
In classical approach only the nearest neighbours (NN) of sites in -dimensional system are considered. However, complex neighbourhoods may have both, theoretical Balankin et al. (2018); Khatun et al. (2017) and practical Gratens et al. (2007); Bianconi (2013); Masin et al. (2013); Lang et al. (2016); Perets et al. (2017); Haji-Akbari et al. (2015) applications. These complex neighbourhoods may include not only NN but also next-nearest neighbours (2NN) and next-next-nearest neighbours (3NN).
One of the most crucial feature describing percolating systems is a percolation threshold . In principle, this value separates two phases in the system;
- •
if sites are occupied with probability the system behaves as ‘an insulator’,
- •
while for the system exhibit attributes of ‘a conductor’.
Namely, for the giant component containing most of occupied sites appear for the first time. The cluster of occupied sites spans from the one edge of the system to the other one (both being ()-dimensional hyper-planes). This allows for direct flow of material (or current) from one to the other edge of the systems. For this flow is even easier while for the gaps of unoccupied (empty) sites successfully prevent such flow 111The terminology of material flow between edges of the system comes from the original papers introducing the percolation term Broadbent and Hammersley (1957); *Frisch1961; *Frisch1962 in the subject of rheology..
Among so far investigated systems also four dimensional systems were considered Ballesteros et al. (1997); van der Marck (1998a); van der Marck (1998b); Paul et al. (2001); Grassberger (2003). The examples of percolation thresholds for four dimensional lattices and NN neighbours are presented in Tab. 1.
In this paper we
- •
propose an efficient space virtualisation for Hoshen–Kopelman algorithm Hoshen and Kopelman (1976) employed for occupied sites clusters labelling,
- •
estimate the percolation thresholds for a four dimensional simple cubic (SC) lattice with complex neighbourhoods, i.e. neighbourhoods containing various combinations of NN, 2NN and 3NN neighbours.
While the Hoshen–Kopelman method is good for many problems— for instance, the parallel version of the Hoshen–Kopelman algorithm has been successfully applied for lattice-Boltzmann simulations Frijters et al. (2015)—probably it is not the best method available to find the thresholds. One can even grow single clusters by a Leath type of algorithm Leath (1976), and find the threshold where the size distribution is power-law, as has been done in many works in three dimensions. For high-dimensional percolation, both Grassberger Grassberger (2003), and Mertens and Moore Mertens and Moore (2018) use a method where you do not even have a lattice, but make a list of the coordinates of all the sites that have been visited, and using computer-science type of structures (linked lists and trees, etc.) one can search if a site has already been visited in a short amount of time. Mertens and Moore Mertens and Moore (2017) have also recently proposed an intriguing method where they use basically invasion percolation (along with the various lists) to grow large clusters that self-organize to the critical point. Both groups have gone up to 13 dimensions using these methods.
II Methodology
To evaluate the percolation thresholds the finite-size scaling technique Fisher (1971); Privman (1990); Binder (1992); Landau and Binder (2005) has been applied. According to this theory the quantity characterising the system in the vicinity of critical point scales with the system linear size as
[TABLE]
where is a scaling function, is a scaling exponent and is a critical exponent associated with the correlation length Stauffer and Aharony (1994).
For the value of does not depend on the system linear size which allows for predicting the position of percolation threshold as curves plotted for various values of cross each other at . Moreover, for appropriate selection also the value of critical exponent the dependencies vs. collapse into a single curve independently on .
Such technique encounters however one serious problem. Namely, numerically deduced curves for various rather seldom cross each other in a single point, particularly when the number of independent simulations is not huge (see Fig. 1, where examples of dependencies for , 40, 80 and (symbols) and (lines) are presented).
The remedy for this troubles has been proposed by Bastas et al. Bastas et al. (2011, 2014) and even simplified in Ref. Malarz (2015). The methodology proposed in Ref. Malarz (2015) allows for estimation of percolation threshold also for relatively low sampling if the quantity is chosen smartly. Namely, as should be chosen quantity for which scaling exponent is equal to zero. One of such quantity is the wrapping probability
[TABLE]
describing fraction of percolating lattices among lattices constructed for occupied sites and fixed values of and , where is a geometrical space dimension and is a number of percolating lattices.
According to Refs. Bastas et al. (2011, 2014); Malarz (2015) instead of searching common crossing point of curves for various one may wish to minimise
[TABLE]
where
[TABLE]
The minimum of near ‘crossing points’ of curves plotted for various sizes yields the estimation of percolation threshold .
Such strategy allowed for estimation of percolation thresholds for simple cubic lattice () with complex neighbourhoods (i.e. containing up to next-next-next-nearest neighbours) with relatively low-sampling () Malarz (2015). Unfortunately, reaching similar accuracy as in Ref. Malarz (2015) for similar linear sizes of the system and for increased space dimension () requires increasing sampling by one order of magnitude (to ). This however makes the computations times extremely long. In order to overcome this trouble we propose efficient way of problem parallelisation.
III Computations
Several numerical techniques allow for clusters of connected sites identification Hoshen and Kopelman (1976); Leath (1976); Newman and Ziff (2001); Torin (2014). Here we apply the Hoshen–Kopelman algorithm Hoshen and Kopelman (1976), which allows for sites labelling in a such way, that occupied sites in the same cluster have assigned the same labels and different clusters have different labels associated with them.
The simulations were carried out on Prometheus pro , an Academic Computer Centre Cyfronet AGH-UST operated parallel supercomputer, based on Hewlett–Packard Apollo 8000 Gen9 technology. It consists of 5200 computing 2232 nodes, each with dual 12-core Xeon E5-2680v3 CPUs, interconnected by Infiniband FDR network and over 270 TB of storage space. It supports a wide range of parallel computing tools and applications, including MVAPICH2 MVA MPI implementation for C and Fortran compilers and provides 2.4 PFlops of computing performance, giving it 77th position on November 2017 edition of Supercomputer Top500 list TOP (2017).
III.1 Implementation
One of the problems encountered is high memory size complexity of , resulting from space being a hyper-cube growing in each direction. The memory limit on the machines the program was run did not allow . Several solutions were put in consideration, one of which was splitting single simulations’ calculations between nodes. In the classical version of the algorithm there are sequential dependencies both subsequent 3- slices perpendicular to the axis of percolation and across any given such slice (see Fig. 2(a)).
If speed is to be ignored, sequential dependencies could be simply distributed across the domains. Then a domain succeeding another one in any direction (e.g. blue one succeeding red one on Fig. 2(b)) should be sent information on the class of sites in the area of touch ( in size) as well as synchronise aliasing arrays. It could be done slice-wise or domain-wise. Slice-wise approach minimises aliasing desynchronisation while domain-wise concentrates communication.
Work between domains can be parallelised. If any domain finds a percolating cluster, it also percolates in the whole hyper-cube, if not, synchronisation of aliasing and both first and last slice cluster ID lists. It requires either totally rebuilding label array or costly label identity checks.
Because of the aforementioned costs and complications, another approach was chosen. Parallelization was only used to accelerate calculations (see Sec. IV.1) while the lack of memory problem was solved using space virtualisation.
III.1.1 Message Passing Interface
Message Passing Interface (MPI) Gropp et al. (2014a); *AdvancedMPI2014 is prevailing model of parallel computation on distributed memory systems, including dedicated massively parallel processing supercomputers and cluster systems. It is constructed as a library interface, to be integrated with computer programs written in Fortran or C languages. The main advantage of MPI is its portability and ease of use. Software vendors are presented with clearly defined set of routines that can be implement efficiently, with hardware support provided for specific computer architectures. Several well-tested open-source implementations are also available MPI . The development of MPI specification is maintained by MPI Forum MPI (2017), an academia and industry-based consortium, led by University of Tennessee, Knoxville, TN, USA.
III.1.2 Space virtualisation
Space virtualisation is possible due to the fact there are very limited information that need to be extracted from the hyper-cube, namely: does it contain at least one percolating cluster. However, any percolating cluster is also percolating for a 4- slice of any depth perpendicular to the percolation axis, including any cut of depth two. Indeed, clusterising any 3- slice across the percolation axis requires its immediately preceding slice to be fully available as well as clusterised (see Fig. 2(a)). It implies only three slices are essentially needed for calculations: the current one, the previous one and the first one, represented on Fig. 3(a)).
Any iteration over slice buffer introduces additional cost of copying the last slice as the next slice’s immediate predecessor. Due to that, minimal buffer of depth three is highly sub-optimal. For any buffer depth , the additional cost of a single iteration over buffer is and such iterations are needed, for the total cost of buffering being , which implies should be as big as possible.
In fact, buffering can even benefit performance in some cases as smaller chunk of memory may be possible to fit in cache along with label aliasing array. If so, the cost of copying can be more than compensated by massive reduction of number of memory accesses.
III.1.3 Parallelism
Because calculations are performed sequentially along the percolation axis, sequentially both over a slice and between slices, no asymptotic speed up is gain from that. However, for each state occupation probability , many simulations () are run for the results to be meaningful, which leads to the total cost of .
As the simulations are fully independent and only their results are to be combined, the program can be speed-up by utilising parallelism over tasks. The only communication needed is collecting the results (whenever a percolating cluster was found or not) at the end of calculations, which is close to . Theoretical cost is then , where is the number of computational nodes.
In practice it is unnecessary to map each task to a separate native process, which would require huge amounts of CPU cores (thousands to hundreds of thousands). However, each simulation has a similar execution time, which means no run-time work re-balancing is needed so MPI processes can be used with tasks distributed equally among them. Optimally, the number of processes should be a divisor of .
Utilising more than one process per node puts additional limit on memory, which implies reduction of virtualisation buffer depth. For nodes and -core architecture that is:
[TABLE]
This operation implies additional cost of roughly multiplying buffering costs times, while reducing all costs times due to multiplying the total number of tasks, which is a clear advantage. Because of that, every core is assigned a separate process.
Threading could be used within a single node but due to close to no communication between tasks, it would make the code more sophisticated with very little performance advantage (only reducing cost of communication).
IV Results
IV.1 Speed-up and efficiency
One of the most frequently used performance metric of parallel processing is speedup Wu (1999); Scott et al. (2005). Let be the execution time of the sequential algorithm and let be the execution of the parallel algorithm executed on processors, where is the size of the computational problem. A speed-up of parallel computation is defined as
[TABLE]
the ratio of the sequential execution time to the parallel execution time. One would like to achieve , so called perfect speed-up Amdahl (1967). In this case the problem size stays fixed but the number of processing elements are increased. This are referred to as strong scaling Scott et al. (2005). In general, it is harder to achieve good strong-scaling at larger process counts since the communication overhead for many/most algorithms increases in proportion to the number of processes used.
Another metric to measure the performance of a parallel algorithm is efficiency, , defined as
[TABLE]
Speedup and efficiency are therefore equivalent measures, differing only by the constant factor .
Fig. 4 demonstrates minimal parallel overhead observed during computations, due to negligible communication costs (see Sec. III.1.3).
IV.2 Percolation thresholds
In Fig. 5 we plot wrapping probabilities vs. occupation probability for various systems sizes ( and various complex neighbourhoods (which contain various neighbours from NN to 3NN+2NN+NN). In the same figure we also present the dependencies in semi-logarithmic scale. The local minimum of near the interception of for various indicates the percolation threshold obtained with Bastas et al. algorithm.
As we can see in Fig. 5 the true value of is hidden in the interval of the length of , where is the scanning step of occupation probability . With believe that true value of is homogeneously distributed in this interval we can estimate the uncertainty of the percolation threshold .
The estimated values of together with its uncertainties are collected in Tab. 2. The table shows also the coordination numbers of sites for every considered complex neighbourhoods ranging from NN to 3NN+2NN+NN.
Please note, that system with 2NN neighbours corresponds to 4- FCC lattice. The obtained threshold agrees within the error bars with earlier estimation mentioned in Tab. 1.
V Conclusions
In this paper the memory virtualization for the Hoshen–Kopelman Hoshen and Kopelman (1976) is presented. Due to minimal and constant cost of communication between processes the perfect speed-up () is observed.
The achieved speed-up allows for computation—in reasonable time—the wrapping probabilities (Eq. (2)) up to linear size of in dimensional space, i.e. for systems containg sites realized times.
The finite-size scaling technique (see Eq. (1) and Sec. II) combined with Bastas et al. technique Bastas et al. (2011, 2014); Malarz (2015) allows for estimation of percolation thresholds for simple cubic lattice in and for neighbourhoods ranging from NN to 3NN+2NN+NN with the accuracy .
The estimated values of together with its uncertainties are collected in Tab. 2. Our results enriches earlier studies regarding percolation thresholds for complex neighbourhoods on square Malarz and Galam (2005); *Galam2005b; *Majewski2007 or three-dimensional SC Kurzawski and Malarz (2012); Malarz (2015) lattices.
Acknowledgements.
This work was financed by PL-Grid infrastructure and partially supported by AGH-UST statutory tasks No. 11.11.220.01/2 within subsidy of the Ministry of Science and Higher Education.
Appendix A Program description
The program (Listing 1) was written in Fortran 95 Gehrke (1996) and compiled using Intel Fortran compiler ifort. It follows purely procedural paradigm while utilising some array-manipulation features.
The programs parameters are read from command line. All of them are integers and should be simply written one after another, as all of them are mandatory. They are the following:
- •
L — linear size of the problem,
- •
p_min — minimal occupation probability to be checked,
- •
p_max — maximal occupation probability to be checked,
- •
p_step — loop step over probabilities range,
- •
N_run — number of simulations for each value of .
All the parameters and dynamically allocated memory is the same through all the program, which loops through over the examined range of probability from p_min to p_max with step p_step. For any given , all processes run subsequent tasks in parallel to each other, only sending results to the main process (through MPI_sum) after finishing all the tasks for the given value of .
Sites are given labels according to Hoshen–Kopelman algorithm. There are two kinds of special labels: FILL_LABEL, having the lowest possible value, and EMPTY_LABEL, having the highest one. Each new casual label is given a successively increasing number. Thanks to that, reclassifying requires no filling checking (although aliasing still does) and checking for percolation is a simple comparison of labels after reclassification: any label with value less than the last label of the first slice is percolating (has_percolation function).
Hyper-cubic space is virtualised (see Sec. III.1) with merged filling and labelling (conditional at l. 173). Then if a new cluster is made (function is_new_cluster), the site is given a label represented by a successive integer number. If not, cluster surrounding the site are merged (subroutine merge_cluster). At the end of the buffer (l. 202-209), the last line is copied before the starting line and the process starts again until the virtual depth of L. The first slice is additionally stored separately (l. 191-199).
The program contains basic time measurement.
Appendix B Source files
The program uses main program (Listing 1), makefile (Listing 2) and batch file (Listing 3).
Makefile is a standard single-target building tool. It provides two commands: ‘build’ (or ‘all’) and ‘clean’. Four parameters can be changed:
- •
FC — Fortran compiler to be used,
- •
PAR_FC — Fortran parallel (MPI) compiler to be used,
- •
RM — cleaning operation,
- •
SRC — source file.
Batch file runs the executable as a new task on cluster. It contains both program’s run-time parameters and task parameters. Task parameters are the following:
- •
-J <name> — name of the task,
- •
-N <number> — number of nodes to run the task on,
- •
--ntasks-per-node=<number> — number of tasks per node, optimally the same as the number of cores on the given architecture,
- •
--time=HH:MM:SS — time limit for the task,
- •
-A <grant> — name of the computational grant,
- •
--output=<file> — file to which the output will be redirected,
- •
--error=<file> — file to which the error information will be redirected.
The reference list from the paper itself. Each links out to its DOI / PubMed record.
- 1Broadbent and Hammersley (1957) S. R. Broadbent and J. M. Hammersley, “Percolation processes,” Mathematical Proceedings of the Cambridge Philosophical Society 53 , 629–641 (1957) . · doi ↗
- 2Frisch et al. (1961) H. L. Frisch, E. Sonnenblick, V. A. Vyssotsky, and J. M. Hammersley, “Critical percolation probabilities (site problem),” Physical Review 124 , 1021–1022 (1961) . · doi ↗
- 3Frisch et al. (1962) H. L. Frisch, J. M. Hammersley, and D. J. A. Welsh, “Monte Carlo estimates of percolation probabilities for various lattices,” Physical Review 126 , 949–951 (1962) . · doi ↗
- 4Stauffer and Aharony (1994) D. Stauffer and A. Aharony, Introduction to Percolation Theory , 2nd ed. (Taylor and Francis, London, 1994).
- 5Bollobás and Riordan (2006) B. Bollobás and O. Riordan, Percolation (Cambridge UP, Cambridge, 2006).
- 6Kesten (1982) H. Kesten, Percolation Theory for Mathematicians (Brikhauser, Boston, 1982).
- 7Sahimi (1994) M. Sahimi, Applications of Percolation Theory (Taylor and Francis, London, 1994).
- 8Saberi (2015) A. A. Saberi, “Recent advances in percolation theory and its applications,” Physics Reports 578 , 1–32 (2015) . · doi ↗