Electrodynamics of ferroelectric films with negative capacitance
I.Luk'yanchuk, A. Sen\'e, V. Vinokour

TL;DR
This paper develops a comprehensive electrodynamic theory for ferroelectric ultra-thin films with periodic domain textures, revealing negative capacitance phenomena, resonance modes in the THz range, and implications for THz optics and metamaterials.
Contribution
It introduces a novel theoretical framework linking domain textures to negative capacitance and THz resonances in ferroelectric films, enabling new optical and metamaterial applications.
Findings
Identification of THz resonance modes of domain oscillations
Discovery of singular phase points related to negative capacitance
Potential for THz negative capacitance-based optical devices
Abstract
We construct a comprehensive theory of the electrodynamic response of ferroelectric ultra-thin films containing periodic domain textures (PDT) with 180{\deg} polarization-oriented domains. The focal point of the theory is the negative-capacitance phenomenon which naturally arises from the depolarization field induced by PDT. We derive frequency-dependent dielectric permittivity related to the PDT dynamics across the entire frequency range. We find the resonance mode of domain oscillations in the THz spectral band and the singular points in the phase of the reflected THz beam that are intimately related to the negative capacitance. Our findings provide a platform for the THz negative capacitance-based optics of ferroelectric films and for engineering the epsilon-near-zero plasmonic THz metamaterials.
Click any figure to enlarge with its caption.
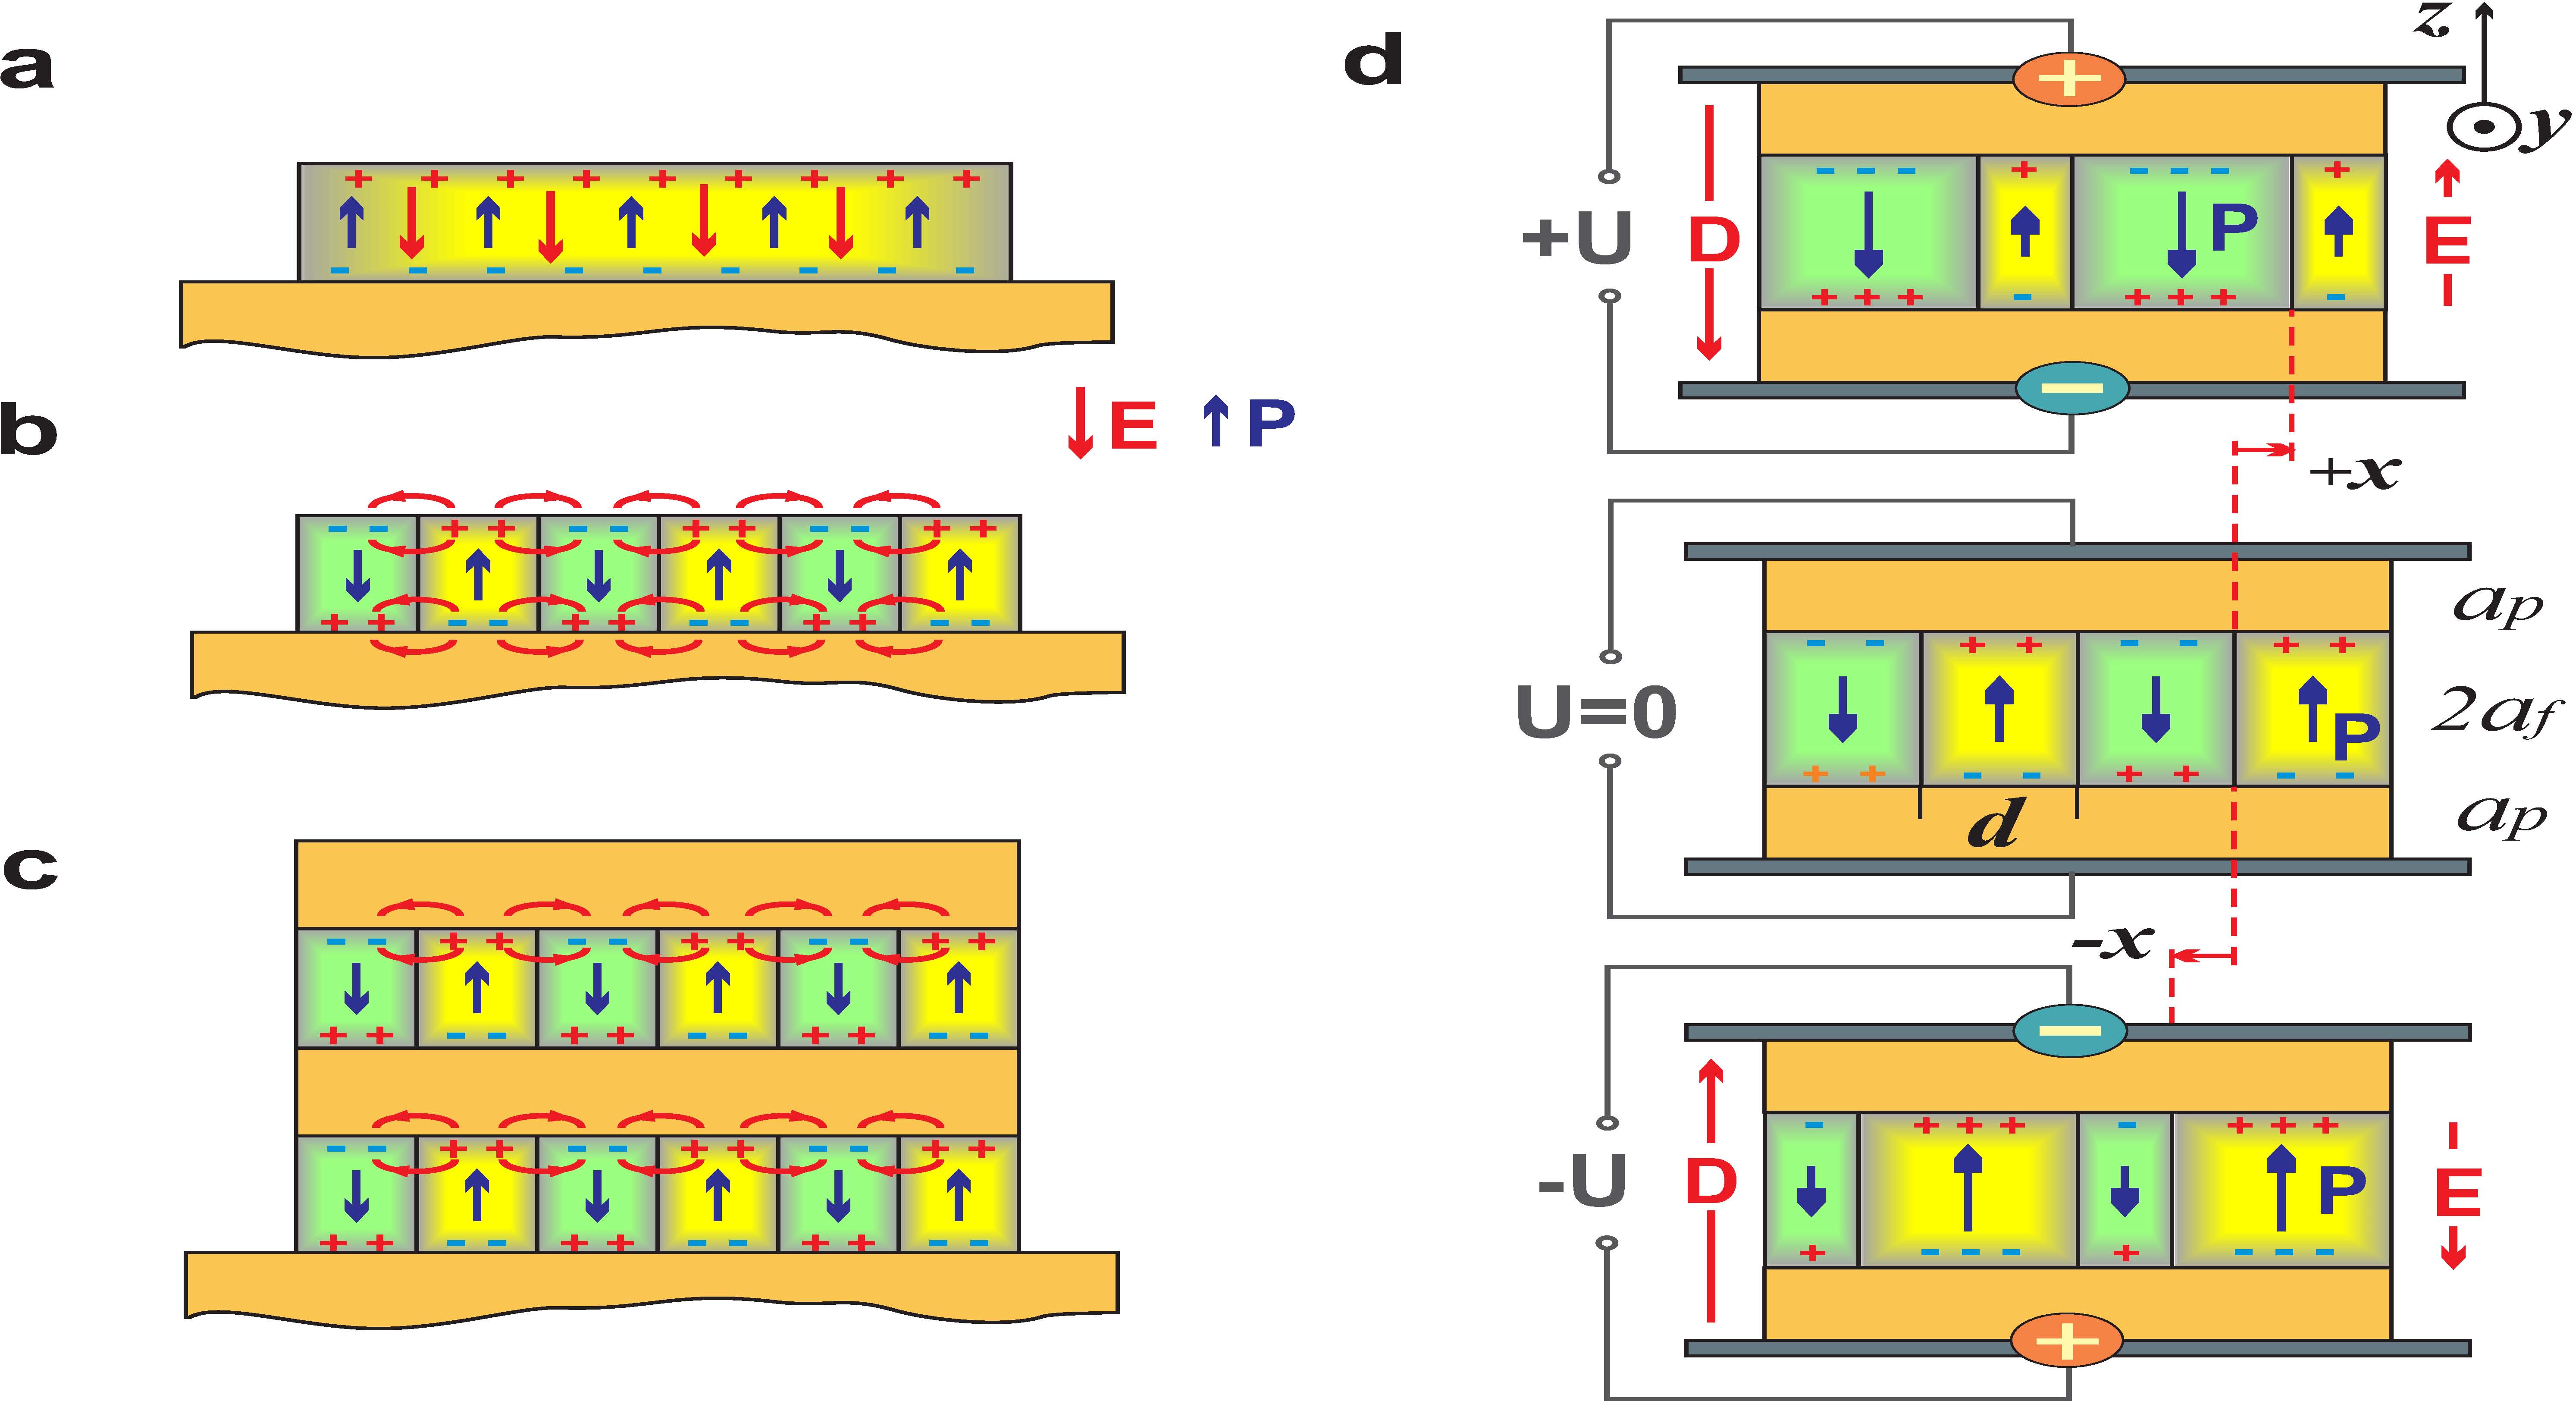 Figure 1
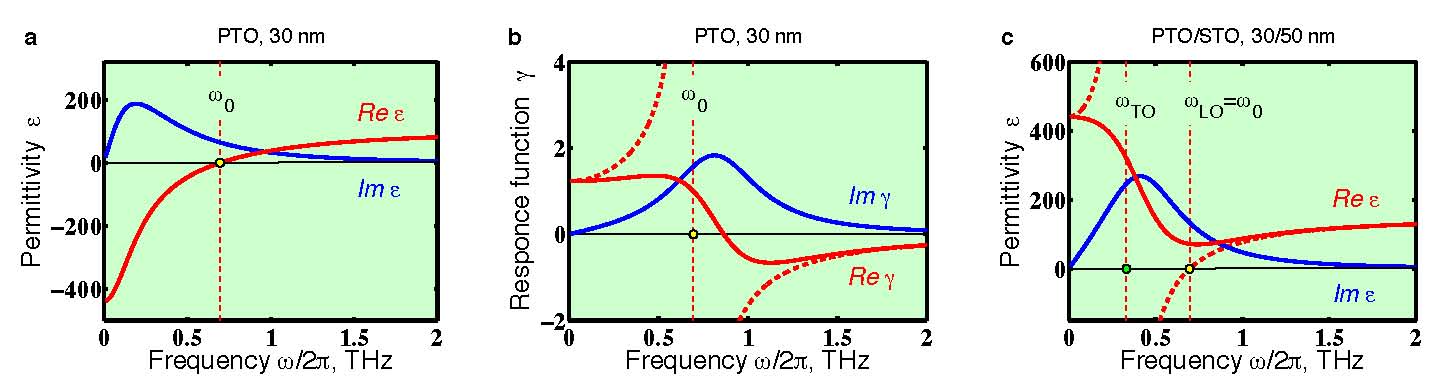 Figure 2
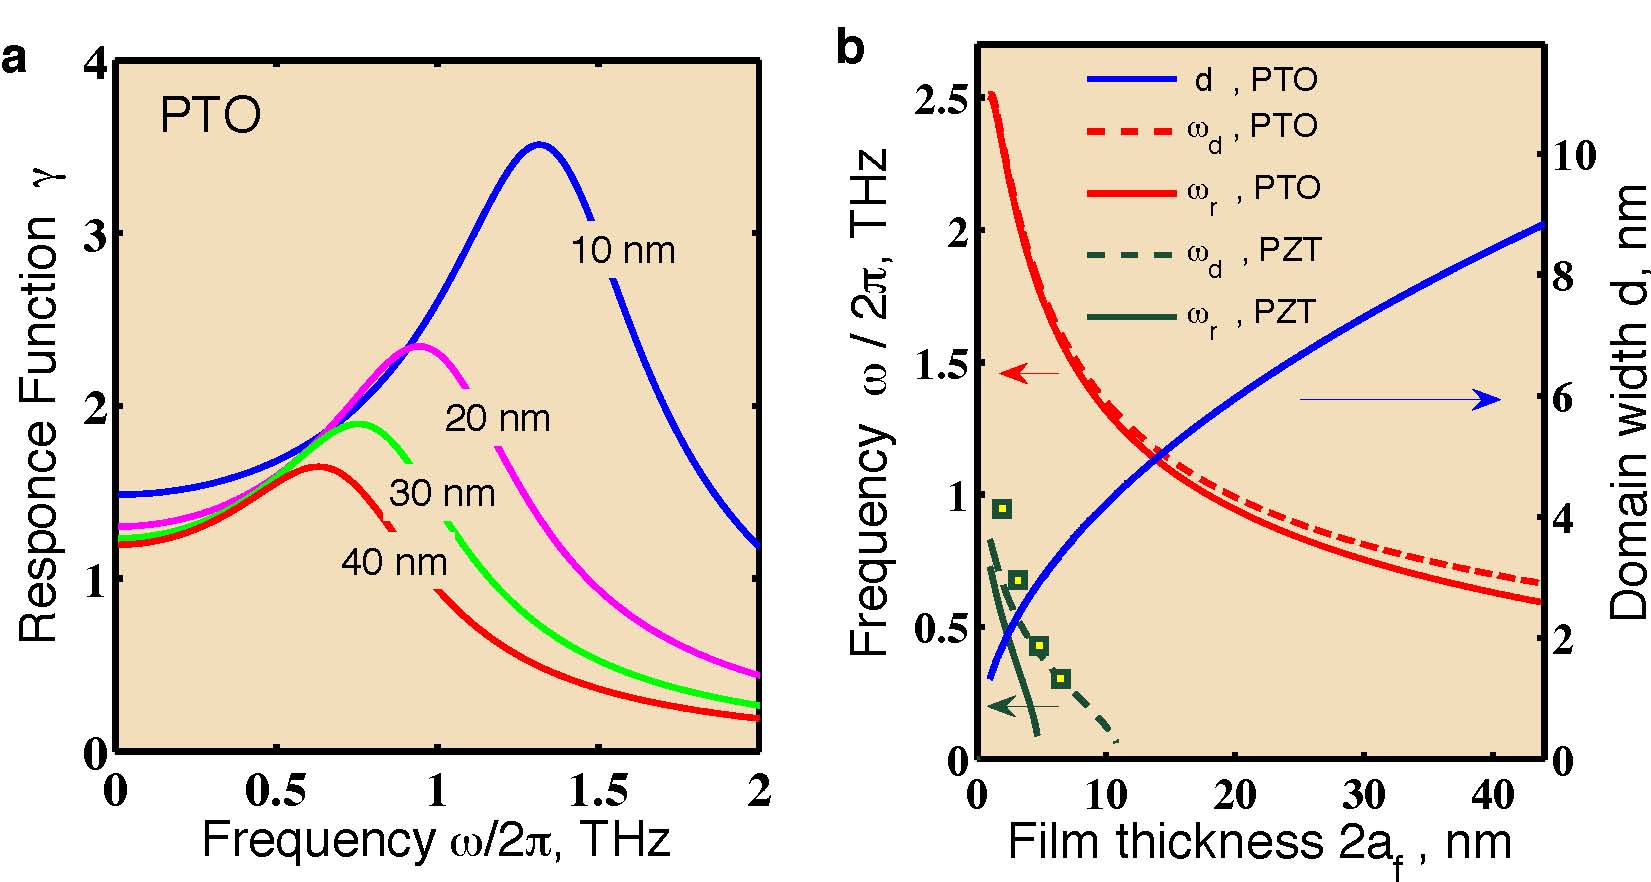 Figure 3
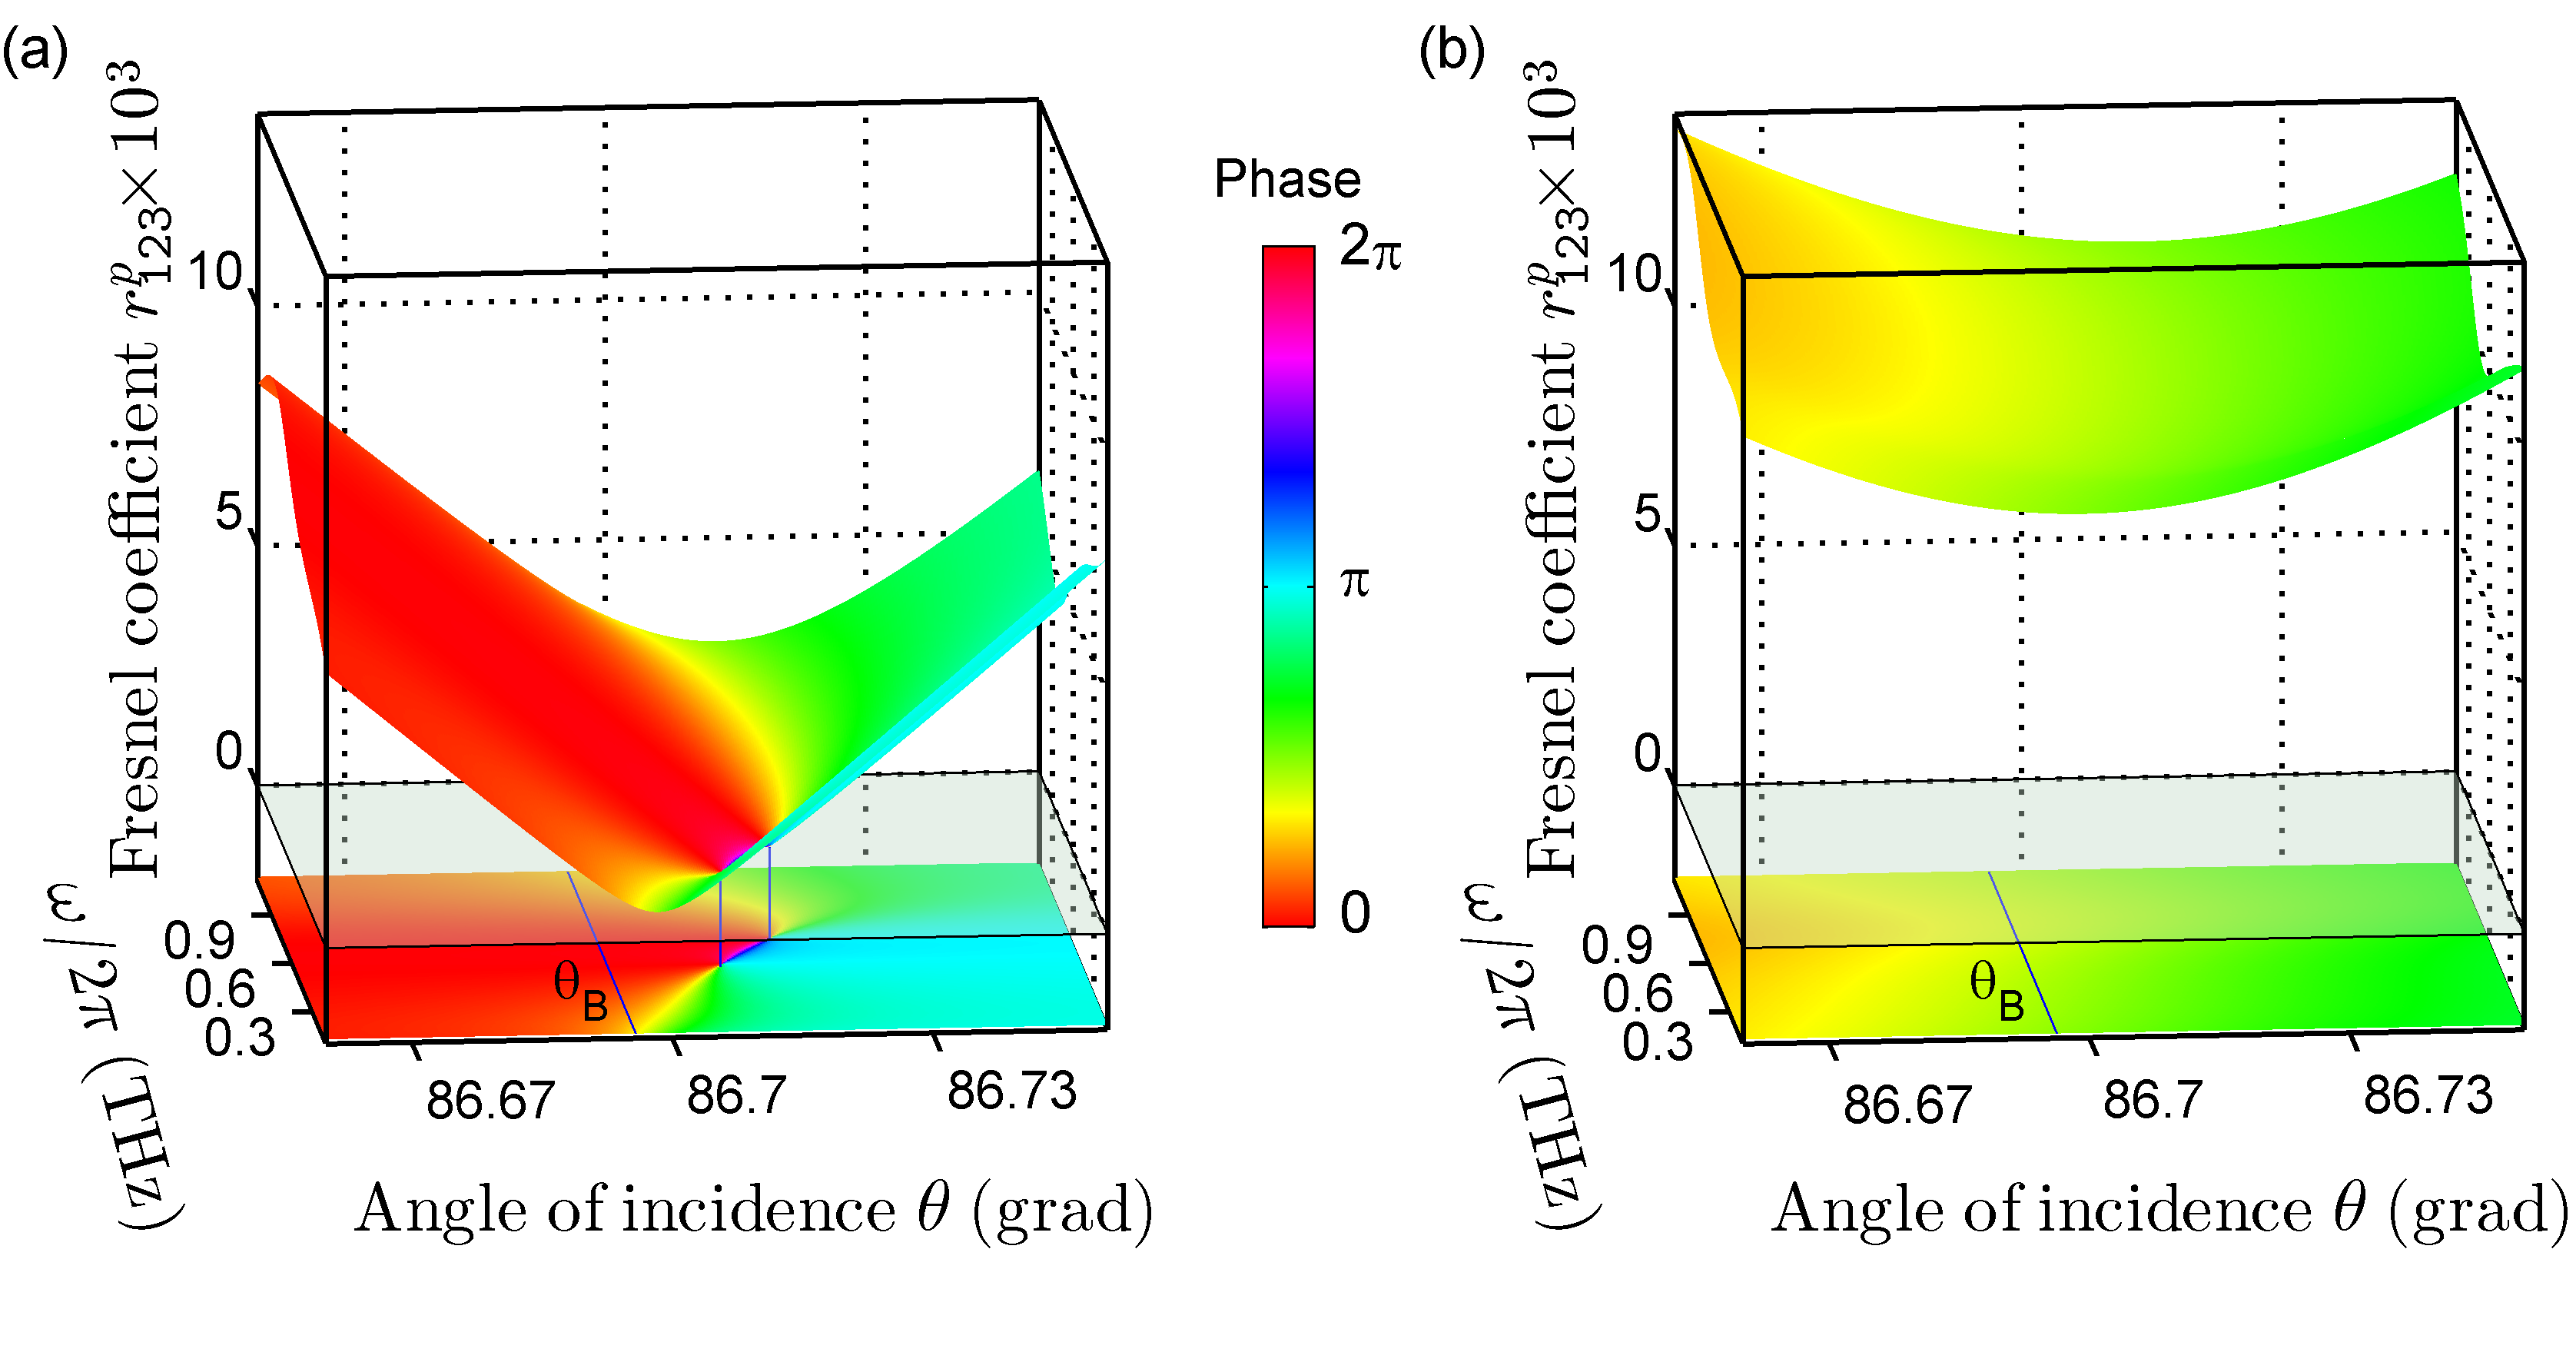 Figure 4
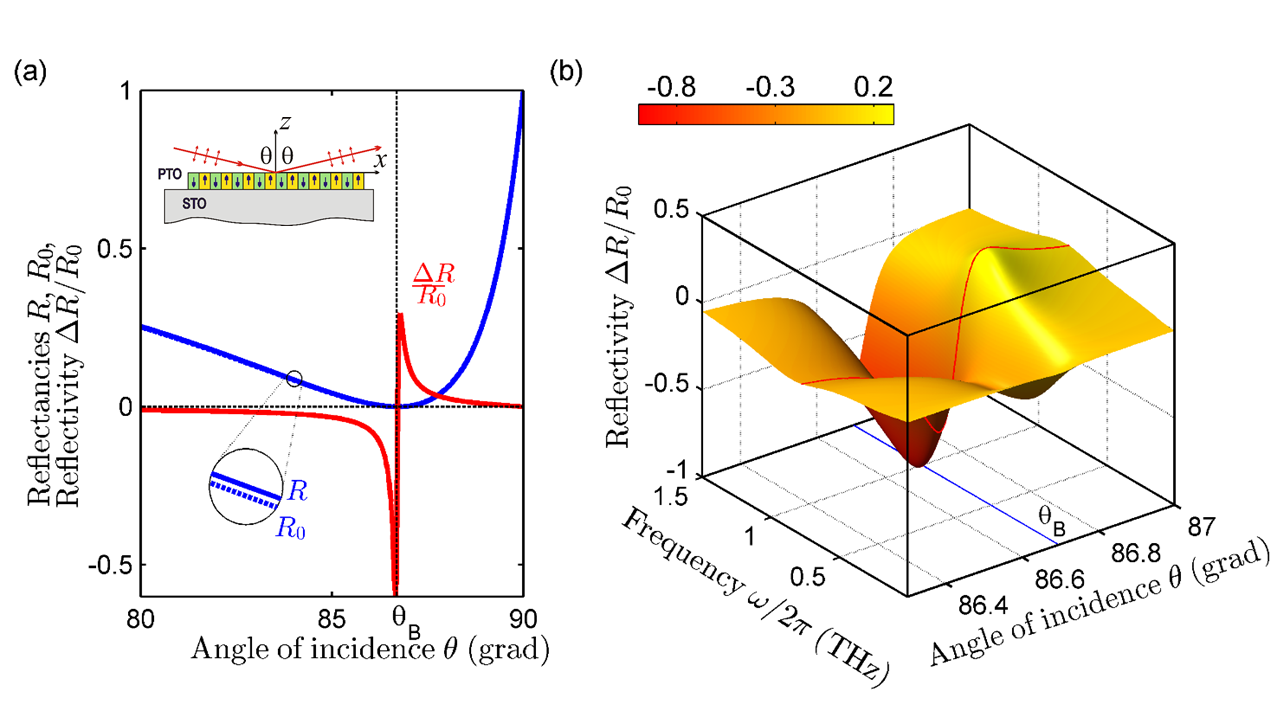 Figure 5
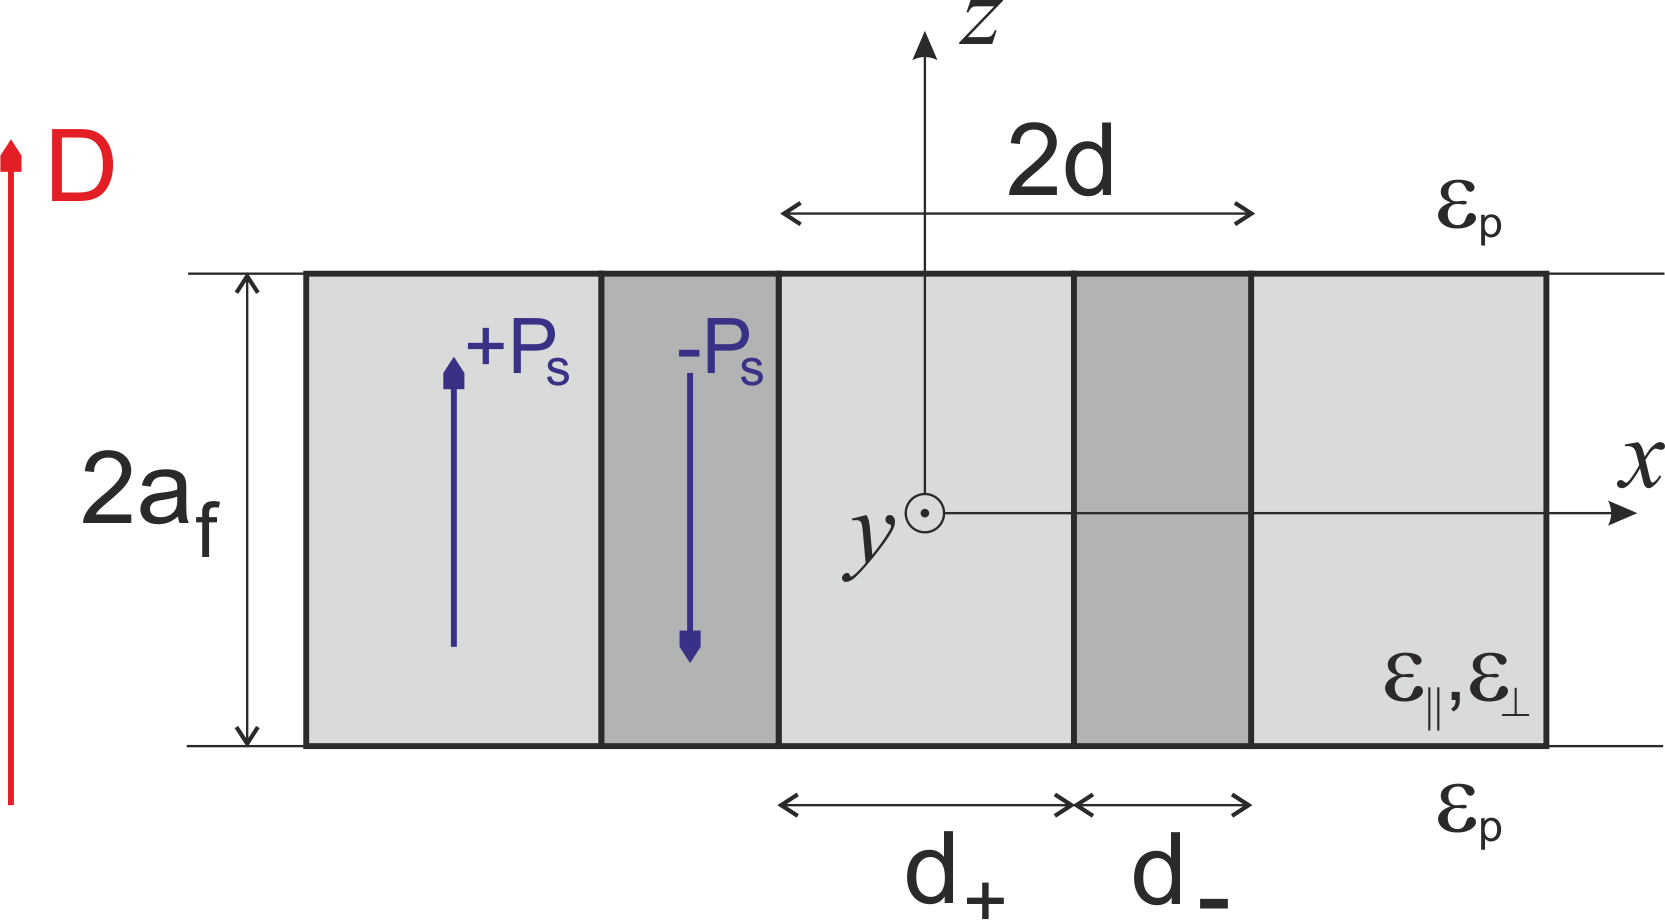 Figure 6
Peer Reviews
No public reviews on file for this paper yet. If you reviewed it on a platform where reviews are public (OpenReview, ICLR, NeurIPS, ICML), you can paste yours below so the community can read it here.
Videos
No videos yet. Explain this paper in a talk, walkthrough, or lecture? Add one.
Electrodynamics of ferroelectric films with negative capacitance
I. Luk’yanchuk
University of Picardie, Laboratory of Condensed Matter Physics, Amiens, 80039, France
Landau Institure for Theoretical Physics, Moscow, Russia
A. Sené
University of Picardie, Laboratory of Condensed Matter Physics, Amiens, 80039, France
V. M. Vinokur
Materials Science Division, Argonne National Laboratory, 9700 S. Cass Ave, Argonne, IL 60439, USA
Abstract
We construct a comprehensive theory of the electrodynamic response of ferroelectric ultra-thin films containing periodic domain textures (PDT) with polarization-oriented domains. The focal point of the theory is the negative-capacitance phenomenon which naturally arises from the depolarization field induced by PDT. We derive frequency-dependent dielectric permittivity related to the PDT dynamics across the entire frequency range. We find the resonance mode of domain oscillations in the THz spectral band and the singular points in the phase of the reflected THz beam that are intimately related to the negative capacitance. Our findings provide a platform for the THz negative capacitance-based optics of ferroelectric films and for engineering the epsilon-near-zero plasmonic THz metamaterials.
Introduction
Functional properties of ferroelectric films and superlattices are drastically different from those of the bulk materials. Extensive experimental Streiffer et al. (2002); Fong et al. (2004); Zubko et al. (2010, 2012); Hruszkewycz et al. (2013); Yadav et al. (2016) and theoretical Bratkovsky and Levanyuk (2000, 2001); Kornev et al. (2004); Stephanovich et al. (2005); De Guerville et al. (2005); Aguado-Puente and Junquera (2008); Luk’yanchuk et al. (2009) studies revealed new physics that emerges from the periodic domain textures (PDT) stabilized by the strains and the depolarization fields. One of the most striking features of the PDT is the manifest of the negative capacitance Zubko et al. (2016), the phenomenon that has been a subject of an intense recent attention Salahuddin and Datta (2008); Cano and Jiménez (2010); Zhirnov and Cavin (2008); Appleby et al. (2014); Khan et al. (2015); Catalan et al. (2015). The interest is motivated by both, its fundamental importance, and by its high potential for technological applications, in particular, as a platform for novel low-dissipation field-effect transistors.
Another facet of emergent functionalities of ferroelectric films arises due to the strain-tunability of their multiscale spontaneous polarization dynamics that provides a wide range of operational frequencies from a few kilohertz to tens terahertz ( ). The spectral band is covered by the relaxation dynamics of the domain walls (DWs) and polar clusters. The far-infrared spectral region of is governed by the soft-mode vibrations of the polar ions. Recent studies suggested that oscillations of domain walls (DW) in PDT occur in the frequency window of Zhang et al. (2011); Luk’yanchuk et al. (2014); Hlinka et al. (2017), i.e within the least studied frequency range, referred to as a THz gap.
Our work steps into the breach and demonstrates that the resonant behavior of oscillations of PDT is the collective effect similar to the standard plasmonic excitations in metals. We find that this effect is governed by the stiffness of depolarization field and is a consequence of the negative capacitance. We calculate the electrodynamic response of PDT and find the frequency dependence of the effective dielectric permittivity. We investigate the THz optics of the PDT structure and demonstrate the existence of the topologically protected phase-singular points of the absolute darkness in the Fresnel reflection coefficient. These points are a fingerprint of the negative capacitance phenomenon.
Formation of the PDT lowers the energy of the depolarization field induced by surface depolarization charges that appear at polarization termination points. Had the polarization maintained the same direction throughout a slab, see Fig. 1a, the electrostatic energy stored by the depolarization field would be proportional to the volume of the whole system hence huge. Splitting the system into the PDT implies that the surface depolarization charges form stripes of alternating signs. As a result, the depolarization field becomes restricted to the near-surface shell, see Fig. 1b, hence drastically diminishing the related electrostatic energy. Although predicted already in earlier works by Landau Landau and Lifshitz (1935, 2013) and Kittel Kittel (1946) in the context of ferromagnetic systems, the PDT in ferroelectric films has long been viewed as unlikely until the recent direct experimental evidences for equilibrium stripe domains in strained ferroelectric thin films of PbTiO3 (PTO) deposited on the SrTiO3 (STO) substrate Streiffer et al. (2002); Hruszkewycz et al. (2013) (as sketched in Fig. 1b) and in PTO/STO superlattices Zubko et al. (2010, 2012) (Fig. 1c). The observed PDT behaviors appeared to well follow the theoretical predictions Bratkovsky and Levanyuk (2000, 2001); Kornev et al. (2004); Stephanovich et al. (2005); De Guerville et al. (2005); Aguado-Puente and Junquera (2008); Luk’yanchuk et al. (2009). In particular, it was found that the mono-domain -oriented state in the unscreened films is always unstable with respect the PDT formation.
Imagine, however, that surfaces of the slab get short-circuited, for example, by the metallic electrodes. Then charges would acquire the capability of arbitrary sliding along the surfaces and flowing between the electrodes, thus compensating the depolarization field inside the ferroelectric. As a result, the depolarization energy is nullified, the domain walls would creep away, and the mono-domain state stabilizes. This tendency of a ferrolecric with the PDT to self-generating the charge at its surfaces can be expressed via attributing to the ferroelectric slab a negative capacitance. One should bear in mind, however, that in reality, the slab that is not linked to the electrodes, maintains the PDT since charges cannot propagate across the dielectric and the charge redistribution described above would not occur.
It is the overscreeing effect due to the depolarization field that lies in the origin of the negative capacitance. The component of the depolarization field penetrating the bulk of the ferroelectric slab from the surface is opposite to the applied field and exceeds it by the absolute value. As a result, the total field inside the slab is counter-directed to the induced polarization. Hence the dielectric permittivity is negative. Writing down the coupled PDT equations of motion and Maxwell equations, we derive the dynamic frequency-dependent dielectric permittivity of the ferroelectric films and superlattices containing PDT across the entire frequency range and find the corresponding resonance mode. We show that its emergence is intimately related to the low frequency negative dielectric permittivity.
Results
Negative capacitance
We start the description of the domain electrodynamics with the static limit, and show that PDT in response to the applied field develops the fascinating negative dielectric permittivity and, accordingly, the negative capacitance, , of the ferroelectric layer of surface area and thickness . We further demonstrate that the negative static of the PDT is a key element for striking arising of the resonance mode of DWs oscillations at THz frequencies.
The applied field is characterized by the induction that conserves all across the system, see Fig. 1d, and generates the net polarization of the ferroelectric layer, (the electrostatic fields in the ferroelectric slab with domains are macroscopically averaged). In our ferroelectric film the induction is related to the electric field through
[TABLE]
The contribution stems from the motion of the domain walls. In the absence of the motion, Eq. (1) reduces to standard electrostatic relation between the electric field and induction. The dielectric constant is the intrinsic permittivity of the ferroelectric material along the polarization direction. The term reflects the change in the overall polarization due to the displacement of the DWs altering thus the relative contribution from the “up” and “down” -oriented domains. This implies the imbalance of the related depolarization charges of the opposite sign leading to the nonzero average charge density . Thus the depolarization field penetrates the bulk of the slab and is directed opposite to the applied field . This field, together with the driving field which would have settled down if DWs were immobile, contributes to the total field, . Hence the sign of the system’s dielectric permittivity, which is defined as
[TABLE]
depends on the relative magnitude of the oppositely oriented and .
Making use of the relation (1), one obtains
[TABLE]
To derive , we have to know how the polarization related to the DW displacement depends on the applied field . The calculations presented in the Appendix result in
[TABLE]
where the first term stems from the positive intrinsic contribution of , whereas the second, the negative one, is generated by the depolarizing field , reflecting the effect of the moving DW. The depolarizing term outweights the intrinsic term, hence the negative dielectric permittivity settles, provided the film thickness, exceeds the domain width, . The equilibrium value of can be either taken from the experiment Streiffer et al. (2002); Zubko et al. (2012) or estimated by the Landau-Kittel square root law Landau and Lifshitz (1935); Kittel (1946); Landau and Lifshitz (2013) specifically adapted for ferroelectrics in Bratkovsky and Levanyuk (2000); De Guerville et al. (2005); Catalan et al. (2012),
[TABLE]
The resulting typical domain configuration for PTO films is shown in Fig. 1b. The DW thickness, , is about 1 nm Meyer and Vanderbilt (2002). In the above formulas , and the values of intrinsic permittivities along and across the polarization direction, , , and of paraelectric layer, , are specified below; in the experimental range . If the sandwiching paraelectric layers possess different permittivities, and , the effective parameter is defined by the relation . In particular, if the ferroelectric film is deposited on the metallic substrate so that and , one has . The polarization profile in this case can be obtained by the image method.
DW oscillations
To quantify the electromagnetic behavior of PDT, we derive the dynamic response function , defined by the relation , for the periodic structure of the domain stripes aligned along the -axis which forms in the ferroelectric layer. The polarization axis is perpendicular to the film plane, while the in-plane DW motion occurs along the -axis, the index indicates the Fourrier transforms of the respective quantities. We neglect the longitudinal DW fluctuations which can broad the resonance peak Brierley and Littlewood (2014).
In the harmonic oscillator approximation Sidorkin (2006) the driven dynamics of DWs is given by
[TABLE]
where is the coordinate of alternating DW displacements (Fig. 1d), the coefficients , and are calculated per unit of DW area, and is the pressure due to the induction-induced driving field forcing DW to move to flip the surrounding spontaneous polarization from to .
Equation (6) presumes that the DW is rigid and atomically narrow. However, in the tens-nanometer-thin films the DW broadens significantly due to depolarization effects in the large range of temperatures (yet the effective thickness of the DWs remains smaller then the distance between them as long and the model holds). The broadening is especially pronounced on approach to the film surface Luk’yanchuk et al. (2009) and upon the DW displacement the polarization reverses first at the surface and then propagates into the interior of the film Zhang et al. (2011). As a result of the DW broadening, the underlying pinning potential for the DW due to the periodic atomic structure gets essentially reduced and becomes relevant only at low temperatures.
The stiffness is of a purely electrostatic origin and, therefore, is not too sensitive to the explicit shape of DW. We calculate it as a coefficient at the restoring force that pushes the domain walls back in order to reduce the depolarization field, , arising upon the displacment of DW from the equilibrium. This field is induced by the extra depolarization surface charges, , appearing due to the spontaneous polarization excess, , and is directed antiparallel to . We evaluate the depolarization energy of the system as the electrostatic energy of the dielectric slab with permittivity and with surface charges as , where is the surface area. The corresponding energy per unit area of the displaced DW is . Relating it with the harmonic oscillator stiffness energy , we find
[TABLE]
The factor , calculated in the Appendix, makes the above qualitative consideration more precise, taking into account the non-uniform part of the depolarization field near the surface caused by the stepwise distribution of the depolarization surface charges. As follows from (7) in very thick samples, these corrections vanish and . In realistic cases that we considered here, namely, the PTO films with nm, it varies from 0.4 to 0.9.
The effective DW mass, , and the viscosity, , in Eq. (6) are related to the motion of the material-constituent polar ions during the displacement of the DWs Kittel (1951) and with the piezoelectric effect of the time-varying depolarization field Sidorkin (2006). The magnitude of was calculated in ab-initio simulations of DW dynamics in the sub-THz range Zhang et al. (2011). We propose an interpolation formula , which fits well the numerical result. Viscosity, , is expressed via damping factor of DW motion, . Since the consistent theory for is not available, we chose the one that appears in the measurements of the soft-mode relaxation of polar ions.
THZ resonance
In what follows we calculate the complex dynamic permittivity of PDT, . The resulting plots of the real, , and imaginary, {\Im}$$\varepsilon_{\mathrm{f}}(\omega), parts of the dispersion for 30 nm thick film of PTO are shown in Fig. 2a.
The reaction of the ferroelectric layer to the time-dependent applied field is characterized by the linear response function, . Solving Eq. (6) by Fourier transformation, we find:
[TABLE]
where the characteristic oscillation frequency is the usual with and related to the system parameters as discussed above. When deriving Eq. (8), we took into account that and .
Shown in Fig. 2b are the real and imaginary parts of for our sample exhibiting a characteristic Lorentzian-type form. The latter is a legacy of a singularity at , which would have been exhibited by a system without the dissipation, illustrated by the dashed lines. The emergence of the resonance response to the applied field is clearly demonstrated by the frequency dependencies of the absolute value of the response function, , for different film thicknesses, see Fig. 3a, and reaching its maximum at the resonance frequency . The dependence of upon the film thickness, , is shown in Fig. 3b. Shown by the blue line in the same panel is the Landau-Kittel dependence of the domain width, , on the film thickness given by Eq. (5) .
Equation (8) enables optimization of the materials parameters and the film thickness to make sure that falls within the desired THz frequency range. In particular, for the strained films of PTO with the high spontaneous polarization, , see Pertsev et al. (2003), relatively low permittivities , , soft mode damping factor () Hlinka et al. (2011) and defined as above, the resonance frequency decreases and spans the range from to when increases from to . We find the damping frequency, , of the attenuated oscillations of domains in PTO, , which is slightly larger then , see Fig. 3b. Remarkably, our formulas perfectly describe the results of ab-initio simulations of DWs oscillations in PZT free-standing ultrathin films Zhang et al. (2011). The calculated damping frequency, , is shown by the dashed line in the Fig. 3b, the symbols display the results of simulations. Here we used the following parameters for PZT: Pertsev et al. (2003), , () Buixaderas et al. (2010) and the same value for DW mass, . At the same time, the resonance frequency of PZT, , drops rapidly with the thickness and vanishes above 4 nm. The data in this paragraph are given for ceramic samples. The values for strained films can be slightly different.
Making use of the relation that follows directly from Eq. (1), we obtain the dynamic permittivity of a ferroelectric layer
[TABLE]
with . At small this yields the negative static permittivity described by Eq. (4). We plot the real, , and imaginary, {\Im}$$\varepsilon_{\mathrm{f}}(\omega), parts of complex dispersion, , calculated for 30 nm thick film of PTO in paraelectric environement, see Fig. 2a. At low frequencies remains negative. At high frequencies the oscilations of DWs freeze out, and therefore should become positive and equal to intrinsic permettivity, . At frequency , the real part of permittivity turns zero, . This behavior of PDT permittivity resembles that of a metal, having the negative real part of permittivity below the plasma frequency at which it becomes equal to zero. Accordingly, this will lead to the plasma resonance at in a PDT as a response to the driving field .
The discovered resonance mode gives rise to the Drude-Lorentz frequency response of a biased capacitor consisting of the ferroelectric layer (of thickness ) sandwiched between paraelectric buffer layers (of thickness and permittivity each). The same response appears in ferroelectric-paraelectric superlattice. The effective permittivity, calculated for the system of in-series capacitors, , results from the interplay of the positive, paralectric, and negative, ferroelectric, contributions and remains positive at small . Here and are the relative weights of the respective layers. That it is the paraelectric contribution that dominates the behavior of the effective permittivity at , is inherently related to the very emergence of the domains. Namely, it is related to the fact that the thickness of the paraelectric buffer, , is larger then the domain width, , and thus domain depolarization stray fields do not interact with electrodes Mokrỳ et al. (2004). The frequency dependence of the for PTO/STO system is shown in Fig. 2c. One sees (the detail of calculations are given further) that maintains a positive value for low frequencies and reflects the presence of the oscillatory mode at slightly less then . As before, the dashed line depicts the behavior of in the absence of dissipation. We thus introduce a new metamaterial operating in the THz frequency-range tunable by the variation of ratio .
Optics
The effective permittivity of a ferroelectric/paraelectric layered system is calculated as and can be conveniently written in a standard form:
[TABLE]
where the characteristic frequencies , are the analogues of the longitudinal and traversal oscillation frequencies in the polar mode spectroscopy. The former one, is the DW oscillation frequency, . The latter frequency can be obtained from the relation that is the analog of the Lyddane-Sachs-Teller relation. Here and . Equation (10) describes the dispersion curve in Fig. 2c. It clearly shows that the obtained PDT resonance mode freezes out when the frequency exceeds and what is left are the molecular vibrations including the polar soft mode oscillations.
The derived dispersion relation for the dielectric permittivity provides a foundation for the description of the THz optical properties of a ferroelectric film with PDT, in particular, for finding its complex refraction index, . This enables to devise an approach for inferring the resonance properties and negative permittivity effects from the optical measurements in the sub(THz) frequency band. Importantly, in the systems that we address, the typical thicknesses of the ferroelectric layer, and the PDT period, , are both less then the wavelength of THz radiation, for . Hence the THZ wave will interact with the system hosting the PDT as with an ultra-thin dielectric film endowed with the anisotropic dielectric permittivity, the latter having the in- and out of plane components and respectively.
Reflection
We consider the situation where the incident THz beam gets reflected from the dielectric substrate, STO, with dielectric permittivity in the sub-THz frequency range, passing twice through the PTO ferroelectric film with PDT. To ensure the interaction of the beam with the PDT polarization, the electric field of the light should be confined to the plane of incidence, hence the p-wave polarization geometry should be used. The experimental setup is shown in the inset in Fig. 4a. The calculated reflectance, , of such a system is shown in the main panel of Fig. 4a as function of the angle of incidence, , by the solid blue line. The plot illustrates a typical p-wave reflectance with the amplitude that nearly vanishes in the vicinity of the Brewster angle of the substrate, . For comparison, shown in Fig. 4a by the blue dashed line is also the net contribution of the substrate. Note that because of the very small thickness of the film, it is practically indistinguishable from the reflectance of the whole system. The difference between them, , is seen only under a magnification. Thus, to ensure the efficient filtering of the resonance PDT signal from the background substrate contribution, one has to focus instead on the relative variance of the signals difference, , usually referred to as to reflectively and used to detect the tiny molecular mono-layers adsorbed on the substrate Tolstoy et al. (2003), see Fig. 4.
An advantage of using the reflectivity is that the value of the substrate reflectance, , almost vanishes at and the use of the ratio unravels the net contribution of the ultra-thin film per se. Shown by the solid red line, the reflectivity of our system does experience the drastic variation of about unity and clearly displays the Lorentz-like spike in vicinity of . This spike is a fingerprint of the PDT resonance and can be used for its experimental identification. The complete qualitative behavior of the resonance feature is illuminated by the three-dimensional color plot of , as function of the frequency and the angle of incidence (Fig. 4b). The Lorentz-spike sharp behaviour gets smoothed upon the deviation from the resonance frequency.
The reflectancies and are calculated as a square of the magnitude of the corresponding Fresnel reflection coefficients, and . Here index refers to the beam polarization and indices 1, 2, and 3 correspond to the ordering of the media: the air, the film, and the substrate, respectively.
The Fresnel reflection coefficient of the substrate-deposited film is given by the expression Tolstoy et al. (2003)
[TABLE]
where
[TABLE]
are the generalized Fresnel reflection coefficients between two adjacent media and is the phase shift of the electromagnetic wave after a single pass through the film. The generalized indices of refraction, , are defined via the angle of incidence, , and dielectric permittivities of the media, , as
[TABLE]
While the refraction indices and represent the customary properties of the air, , and substrate, endowed with the isotropic permittivities, the targeted electrodynamic response of PDT with negative capacitance is encoded in the anisotropic refraction index that is deduced from Schopper (1952). The latter grasps both the transversal permittivity of the film, , and the effective longitudinal permittivity of PDS, .
The described approach identifies the PDT resonance behavior via detecting the characteristic Lorentz-like spike features in the angular and frequency dependencies of the reflectance. However, the developed theory of the electromagnetic response equips us with the extraordinary more advanced technique. Namely, the resonance point where changes the sign, is found, with the great precision from the phase map of the Fresnel coefficient . The latter (unlike the real-value reflectance , where the phase information is lost) is a complex quantity which is measured, for example, by the phase-resolved ellipsometry technique Marsik et al. (2016).
To develop a feasible protocol for observation of the frequency domain endowed with negative let us describe the dependence near the Brewster angle in the system with the ideally transparent substrate with . If the film were absent, the Fresnel coefficient would have been real and changed the sign upon passing zero at . Placing the film on the substrate, gives the contribution, albeit very small, that pulls into a complex plane, where the trajectory circumflexes the zero from the positive- to negative semi-axis acquiring the phase . Equations (11)-(14) offering a full description of the electromagnetic response show that the direction (clock- vs. anticlock-wise) of the phase rotation is determined by the sign of . The frequency at which changes the sign corresponds, therefore, to a particular point in the -plane where phase acquires a factor of when making a close loop around it, and the Fresnel coefficient, , vanishes. These zeros of the complex function, , where the intensity of the reflected light is zero are often called ‘points of absolute darkness’ Kravets et al. (2013). They are stable with respect to small variations of parameters hence topologically protected, and we refer to them as to topological darkness points.
Figure 5a displays the 3D color plot of the phase and amplitude of the Fresnel reflection coefficient, , of the PDT in the 30nm PTO film as a function of an incident angle and frequency for the case of transparent substrate with , derived from Eqs. (11)-(14). Two topological dark points resulting from the negative permittivity are clearly visible at the manifold depicting . The higher-frequency point A corresponds to the discussed above sign change of . The second, lower-frequency one, appears when . This manifestly illustrates the topological protection effect: the topological darkness points are not smoothed but merely shifted by dissipation. Figure 5b shows the the same phase plot for the PTO on a real substrate STO with . One sees that if the dissipation is sufficiently large, the darkness points merge and cease to exist, i.e. the sharp Brewster-angle singularities in the phase plot get smoothened.
The obtained results and recent measurements of the negative capacitance in PDT Zubko et al. (2016) open a new area of research in the field of the THz optics in ferroelectric materials. Exciting opportunities open in the area of the plasmonic epsilon-near-zero (ENZ) metamaterials having the unique property that the electromagnetic wave propagates with almost no phase advance. Although such materials have been made artificially in the microwave, visible and far-infrared spectral ranges Maas et al. (2013), the engineered ENZ structures in the THz spectral range have not been explored so far.
Acknowledgments
The work was supported by the U.S. Department of Energy, Office of Science, Materials Sciences and Engineering Division (VV) and European FP7-MC-ITN-NOTEDEV and H2020-MC-RISE-ENGIMA actions (IL).
APPENDIX
Calculations of the electrostatic properties of PDT in the applied field generalize the zero-field Landau-Kittel calculations of PDT given in the textbook Landau and Lifshitz (2013) in application to magnetic domains. The geometry of the system is shown in Fig. 6. The -axis is directed along the PDT texture, the -axis is parallel to the domains and the -axis is directed across the film. Since the polarization distribution does not change along the -axis, the problem is reduced to the 2D one in the -plane. In the external field the up- and down-oriented polarization domains have different widths, and , the field-induced polarization due to DW motion being expressed via the field dependence of the asymmetry factor as , with being the period of the structure. Following the relation (3) we express the dielectric permittivity of the PDT as:
[TABLE]
The linear dependence on is found by minimization of the electrostatic energy of the system, considering as variation parameter.
We start with the derivation of the spacial distribution of the electric fields inside the ferroelectric () and paraelectric () layers, , induced by the depolarization surface charges arising at the interfaces between - and - layers at . These charges, appearing due to termination of the alternating polarization in PDT, are conventionally presented as where the sign-alternating function, , is defined as if . The corresponding electrostatic potentials in the - and -layers satisfy the Laplace equations:
[TABLE]
The boundary conditions for the potential at the interfaces are fixed by the charges :
[TABLE]
System (16) with boundary conditions (17)** ** is solved by the Fourier-series expansion method, taking into account that
[TABLE]
with and
[TABLE]
After straightforward calculations we obtain:
[TABLE]
where is the average value of the potential at the upper/lower surface of the ferroelectric slab, and
[TABLE]
The electrostatic energy of the system can be calculated as the integral over the surfaces of the ferroelectric layer. The integration over reflects the self-consistent adiabatic charging of the surfaces, driven by the self-polarization of the system from the paraelectric state, until the state with the equilibrium spontaneous polarization, , is achieved inside domains.
Taking into account the dependicies given by (20) of and on we calculate the energy per unit length of PDT ( here the factor 2 is because of the two 2 sides of the slab):
[TABLE]
In the experimentally relevant limit , Eq. (APPENDIX) is simplified as:
[TABLE]
where
[TABLE]
Minimization of (23) with respect gives:
[TABLE]
Finally, making use (15) we obtain the dielectric permittivity of the PDT (4).
The DW displacements in PDT shown in Fig. 1d are given by . Equating the stiffness energy of the DW displacement, , to (23) (taken in harmonic approximation at and multiplying by , i.e. using the energy per a single DW), we obtain the expression for the stiffness coefficient, , (7).
Note that the expression (4) can also be derived from the formulas given in Bratkovsky and Levanyuk (2001) by expressing the ratio in Eq. (31) of Bratkovsky and Levanyuk (2001) via the ratio defined in their Eq. (25). The Landau-Kittel formula (5) for the domain width, , is obtained by minimization of energy with respect at . Here is the domain wall energy, calculated per unit length of PDT and is the surface energy of DW. The spatial distribution of the electric and polarization fields in the - and - slabs are found from (20) as: , , where . For the very thin films the field lines of form the closed loops, resembling the alternating vortex-antivortex patterns Yadav et al. (2016)
The reference list from the paper itself. Each links out to its DOI / PubMed record.
- 1Streiffer et al. (2002) S. K. Streiffer, J. Eastman, D. Fong, C. Thompson, A. Munkholm, M. R. Murty, O. Auciello, G. Bai, and G. Stephenson, Phys. Rev. Lett. 89 , 067601 (2002).
- 2Fong et al. (2004) D. D. Fong, G. B. Stephenson, S. K. Streiffer, J. A. Eastman, O. Auciello, P. H. Fuoss, and C. Thompson, Science 304 , 1650 (2004).
- 3Zubko et al. (2010) P. Zubko, N. Stucki, C. Lichtensteiger, and J.-M. Triscone, Phys. Rev. Lett. 104 , 187601 (2010).
- 4Zubko et al. (2012) P. Zubko, N. Jecklin, A. Torres-Pardo, P. Aguado-Puente, A. Gloter, C. Lichtensteiger, J. Junquera, O. Stéphan, and J.-M. Triscone, Nano Lett. 12 , 2846 (2012).
- 5Hruszkewycz et al. (2013) S. Hruszkewycz, M. Highland, M. Holt, D. Kim, C. Folkman, C. Thompson, A. Tripathi, G. Stephenson, S. Hong, and P. Fuoss, Phys. Rev. Lett. 110 , 177601 (2013).
- 6Yadav et al. (2016) A. Yadav, C. Nelson, S. Hsu, Z. Hong, J. Clarkson, C. Schlepütz, A. Damodaran, P. Shafer, E. Arenholz, L. Dedon, et al. , Nature 530 , 198 (2016).
- 7Bratkovsky and Levanyuk (2000) A. Bratkovsky and A. Levanyuk, Phys. Rev. Lett. 84 , 3177 (2000).
- 8Bratkovsky and Levanyuk (2001) A. Bratkovsky and A. Levanyuk, Phys. Rev. B 63 , 132103 (2001).