
TL;DR
This paper develops new algorithms to identify real algebraic varieties from finite samples, focusing on topology and algebraic geometry, and provides a Julia package for practical implementation.
Contribution
It introduces novel methods for learning algebraic varieties from samples, emphasizing topology and algebraic properties, with comprehensive testing and software release.
Findings
Algorithms successfully recover variety properties from samples
Methods effectively determine dimension and defining polynomials
Software implementation available in Julia package
Abstract
We seek to determine a real algebraic variety from a fixed finite subset of points. Existing methods are studied and new methods are developed. Our focus lies on aspects of topology and algebraic geometry, such as dimension and defining polynomials. All algorithms are tested on a range of datasets and made available in a Julia package.
Click any figure to enlarge with its caption.
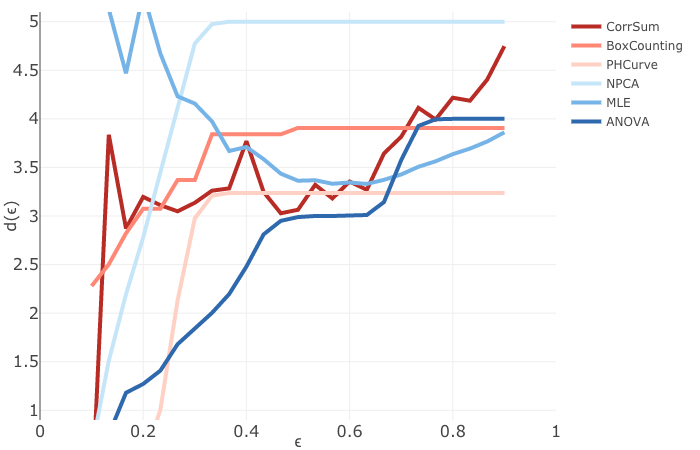 Figure 1
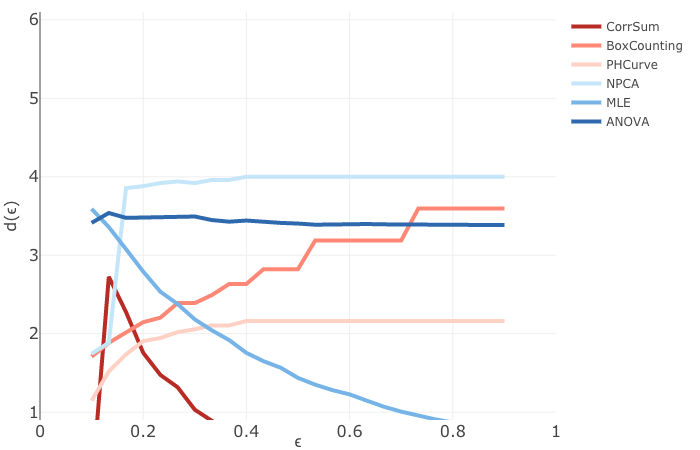 Figure 2
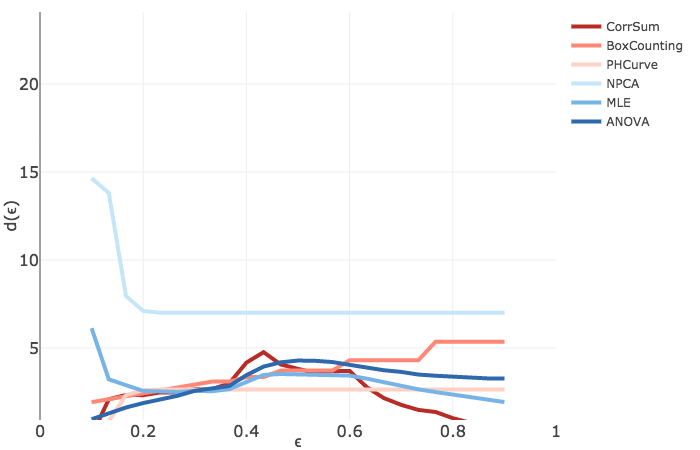 Figure 3
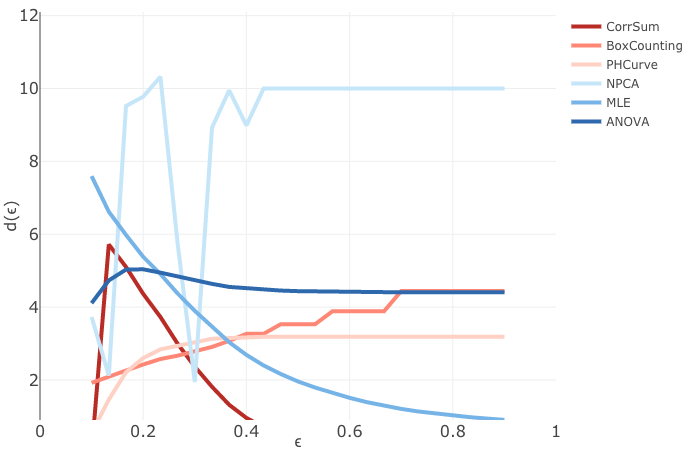 Figure 4
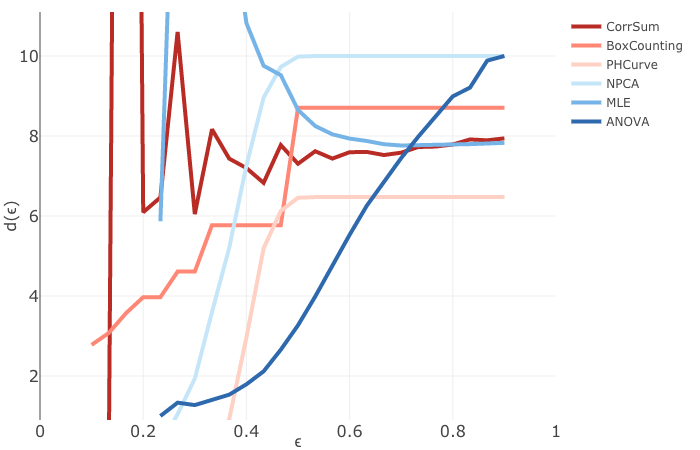 Figure 5
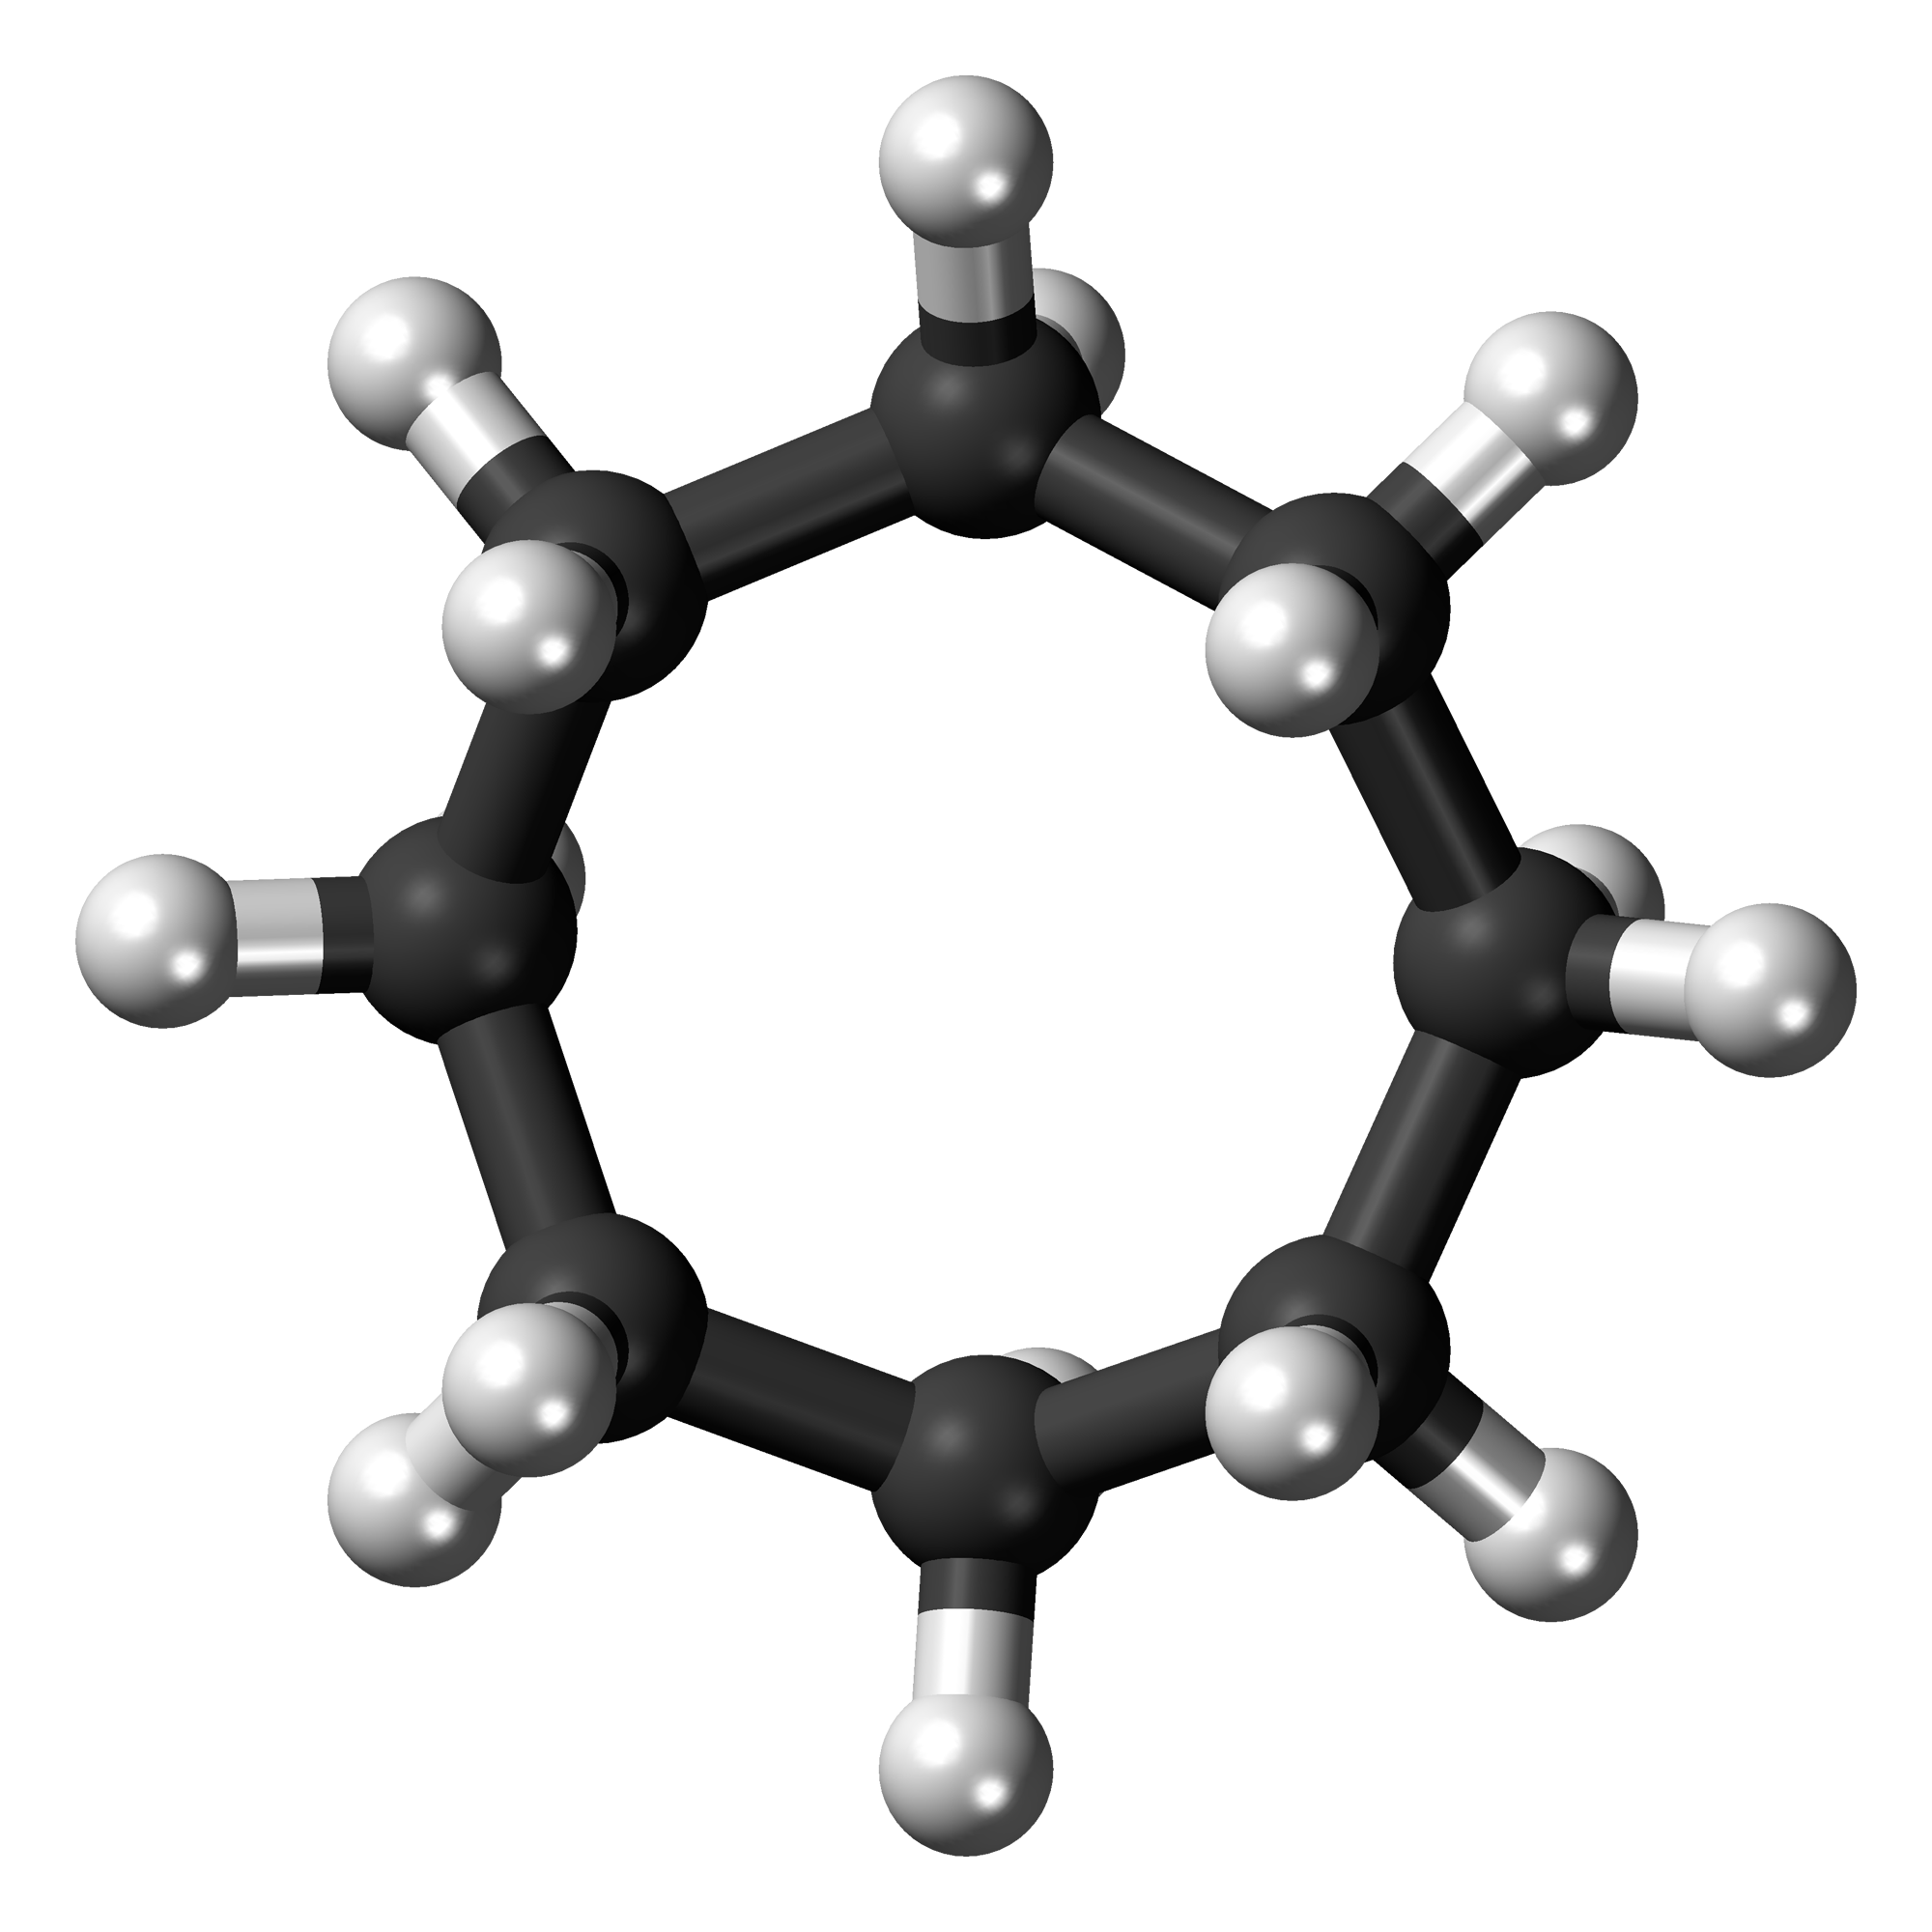 Figure 6
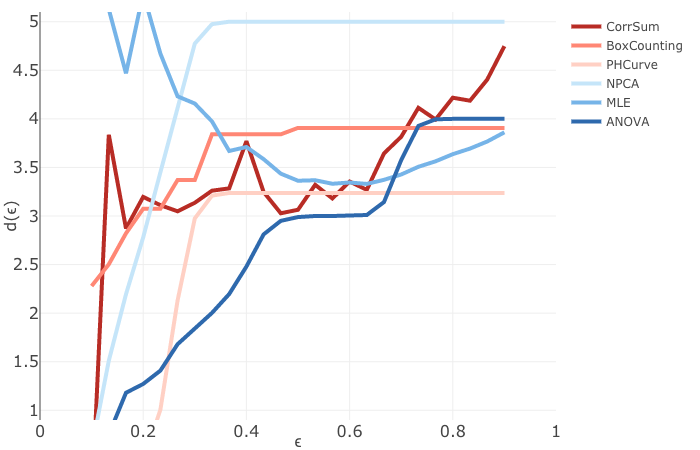 Figure 7
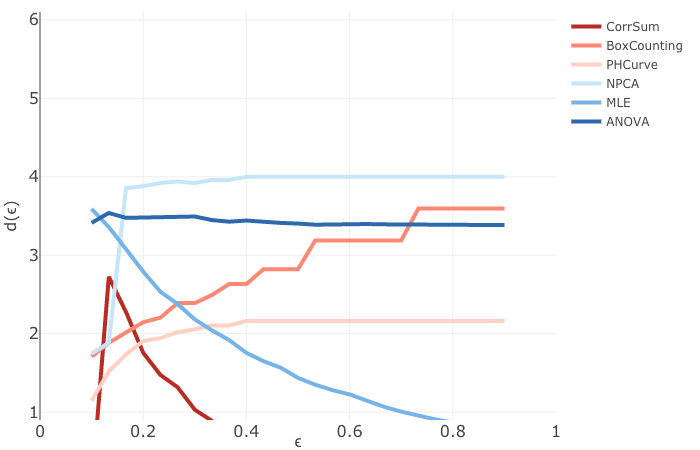 Figure 8
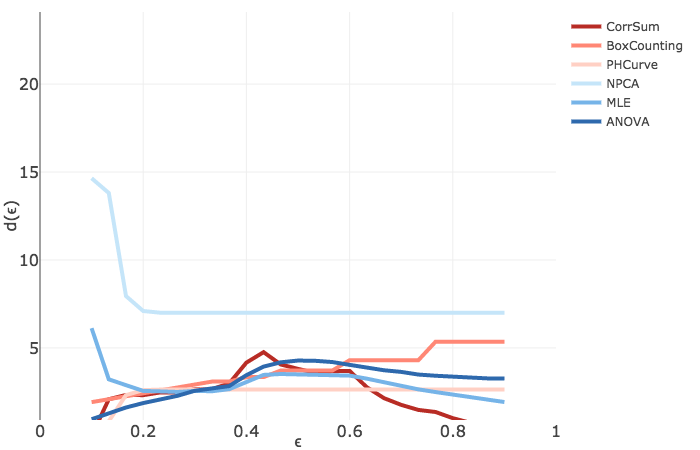 Figure 9
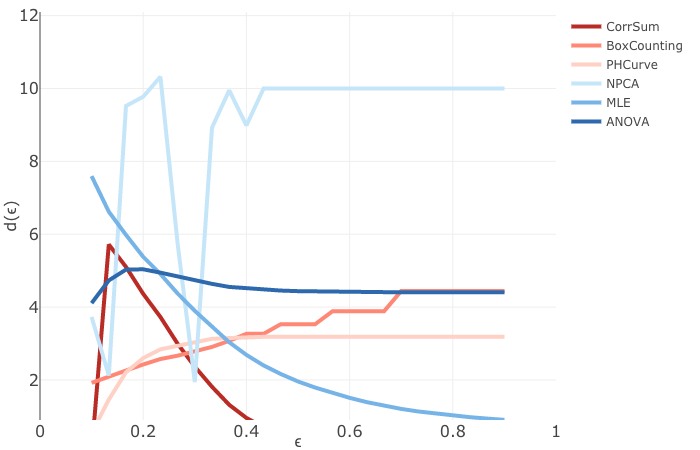 Figure 10
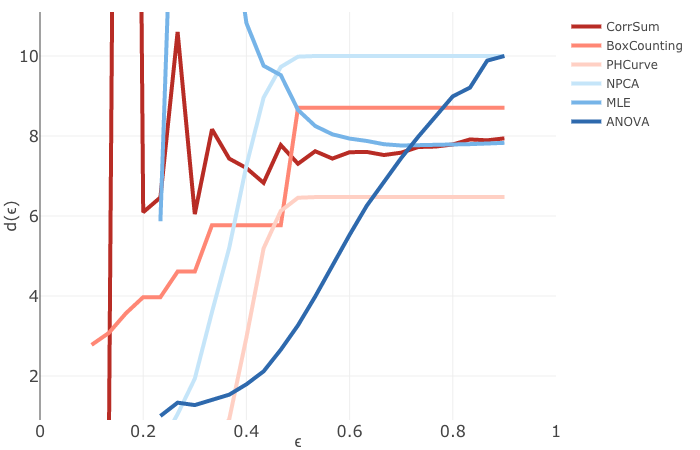 Figure 11
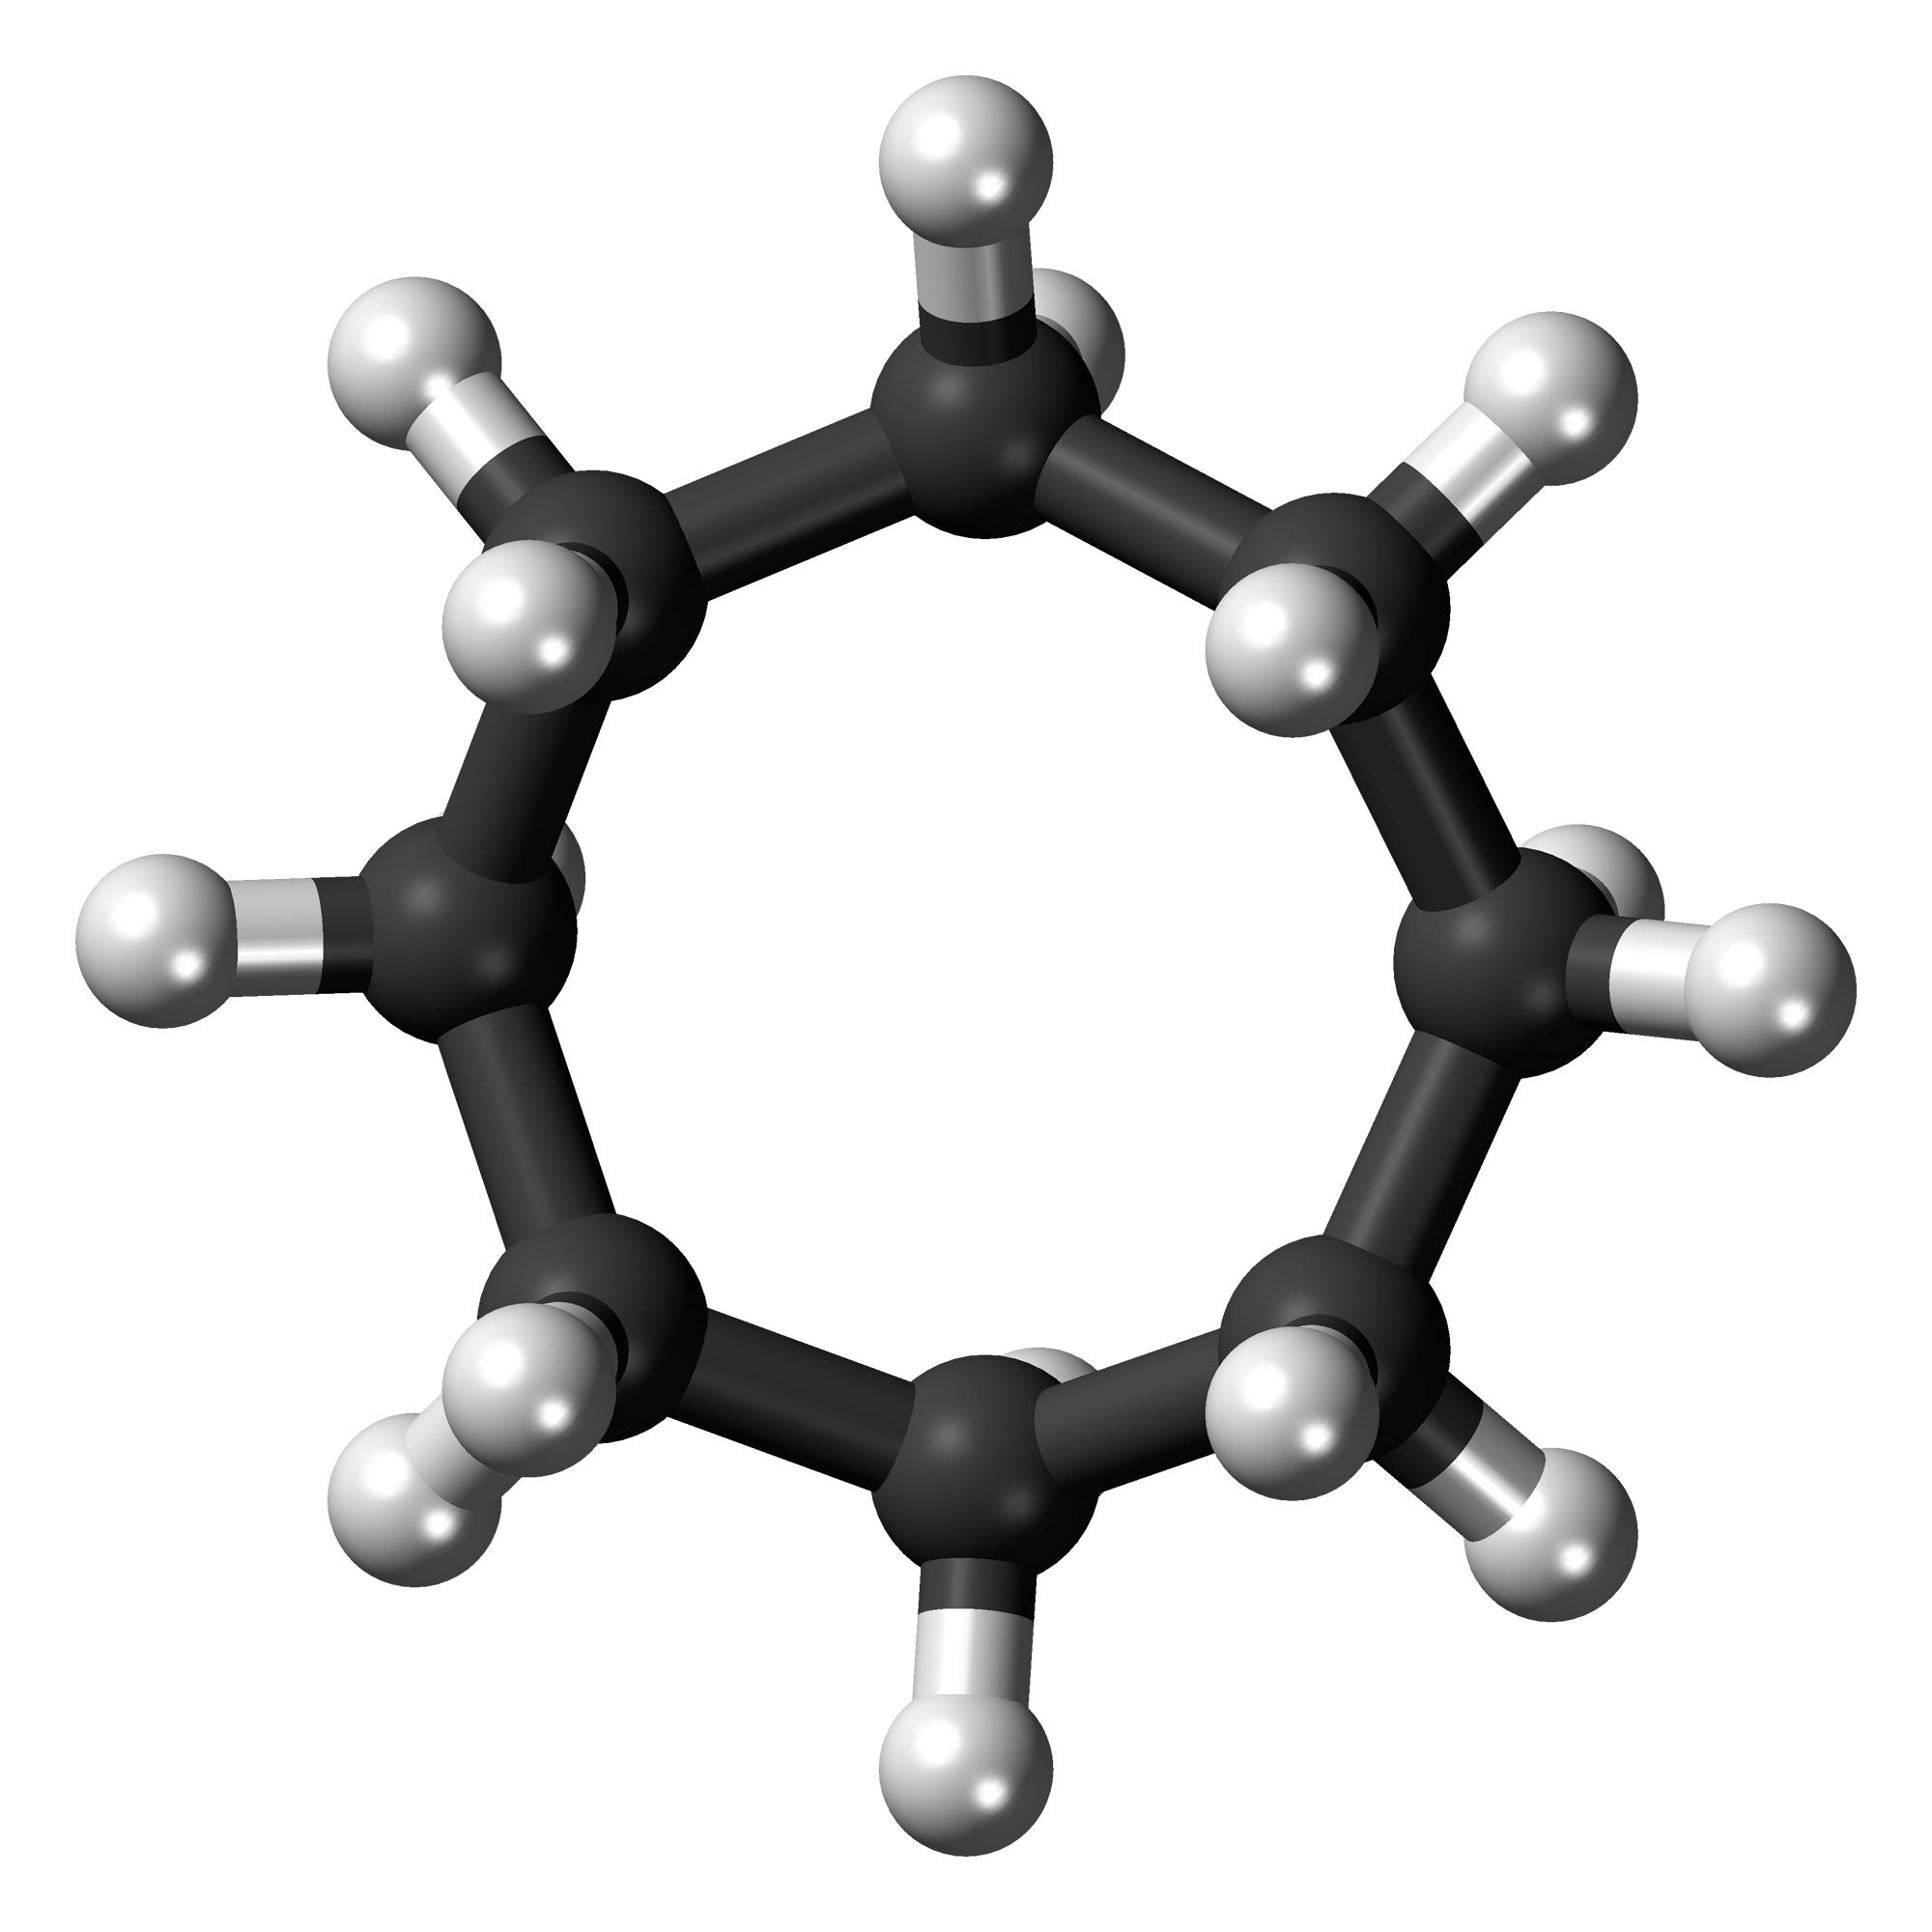 Figure 12
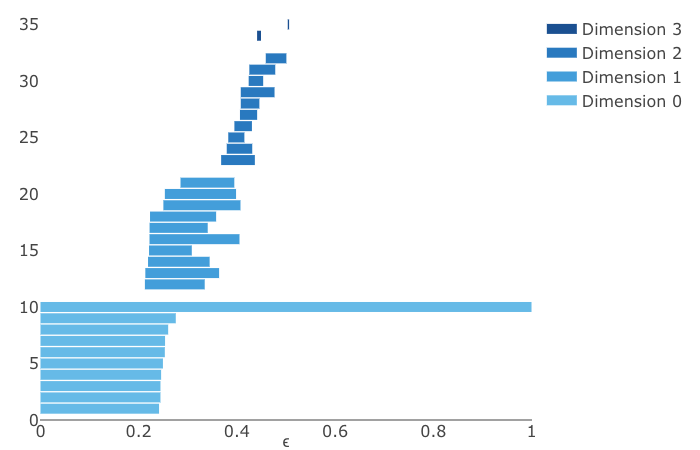 Figure 13
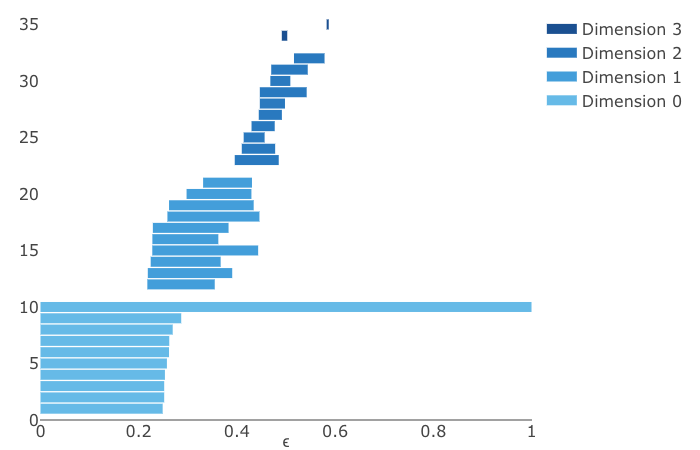 Figure 14
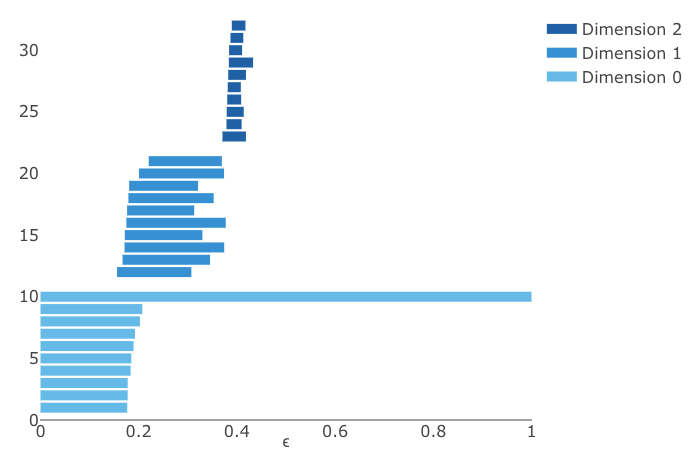 Figure 15
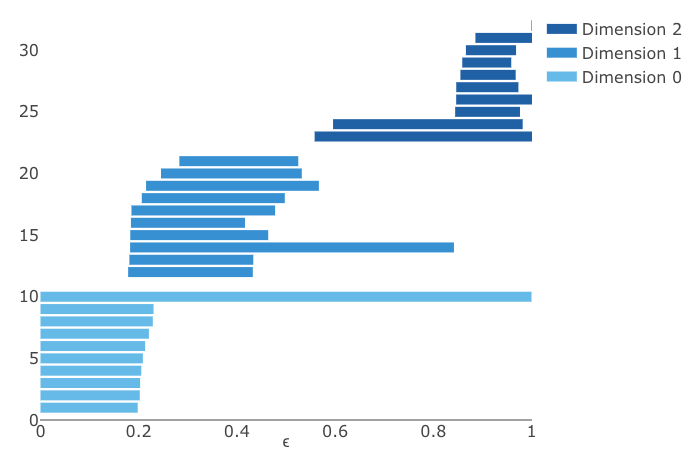 Figure 16
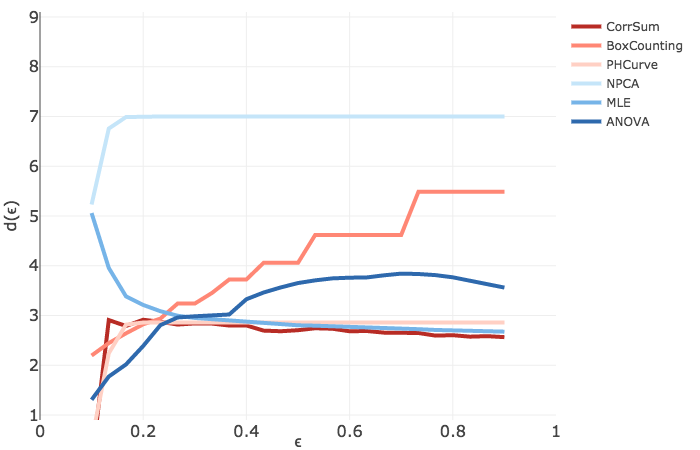 Figure 17
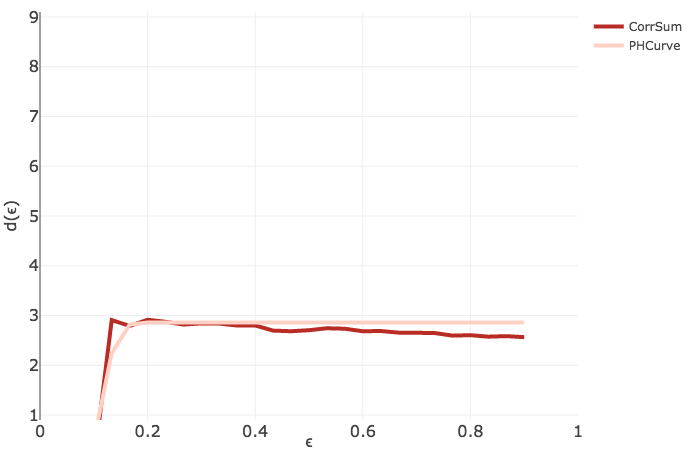 Figure 18
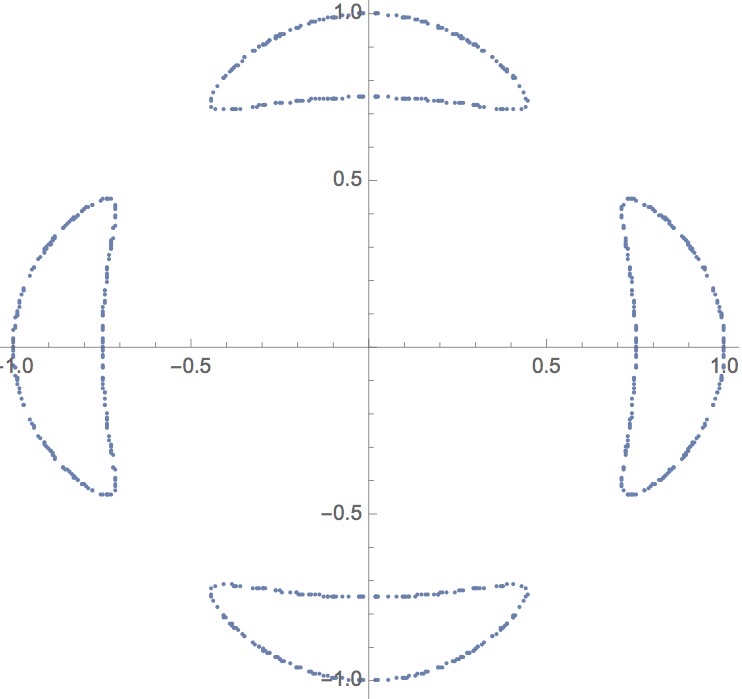 Figure 19
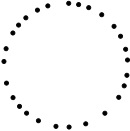 Figure 20
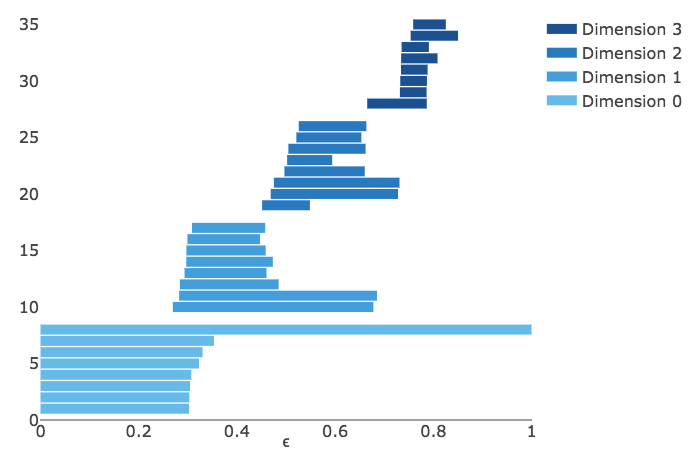 Figure 21
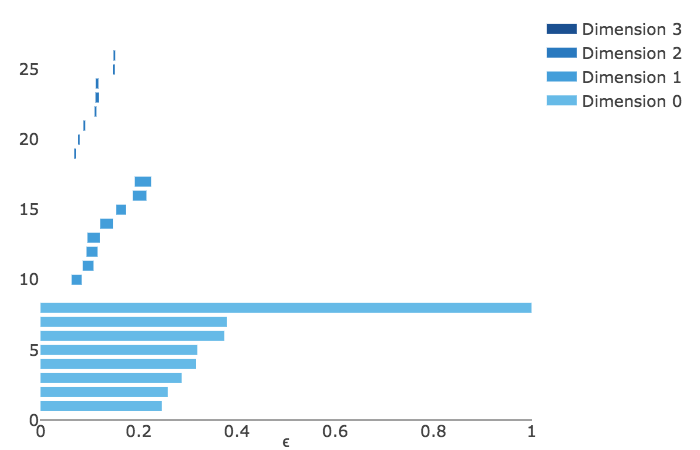 Figure 22
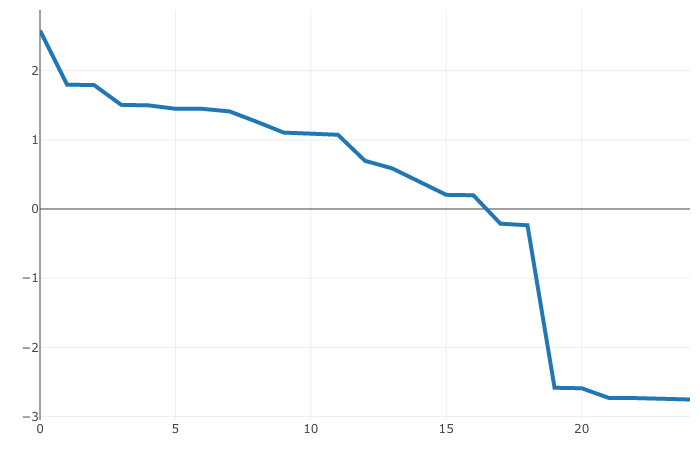 Figure 23
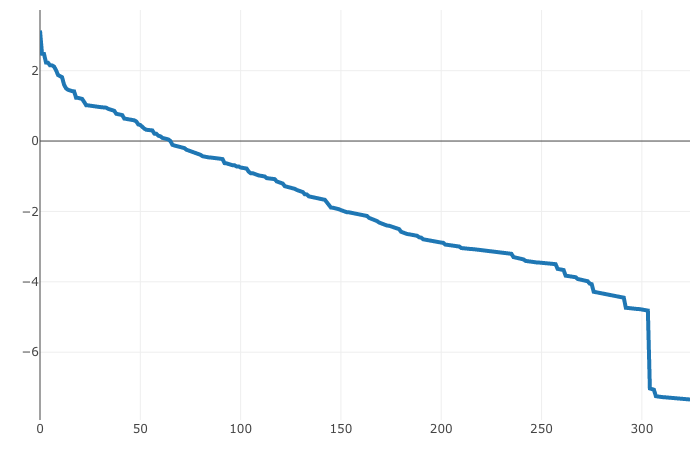 Figure 24
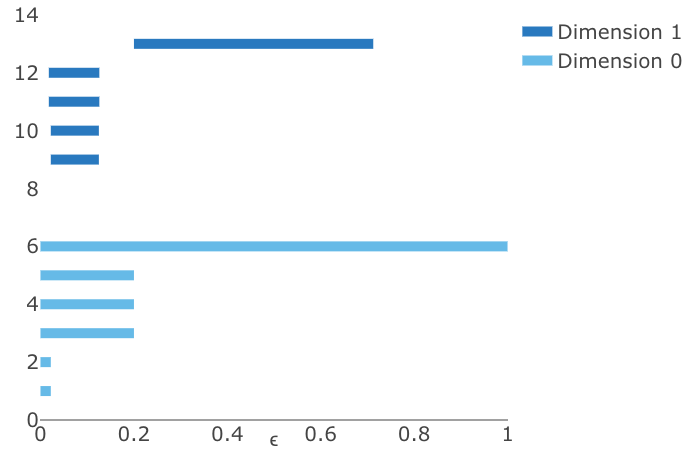 Figure 25
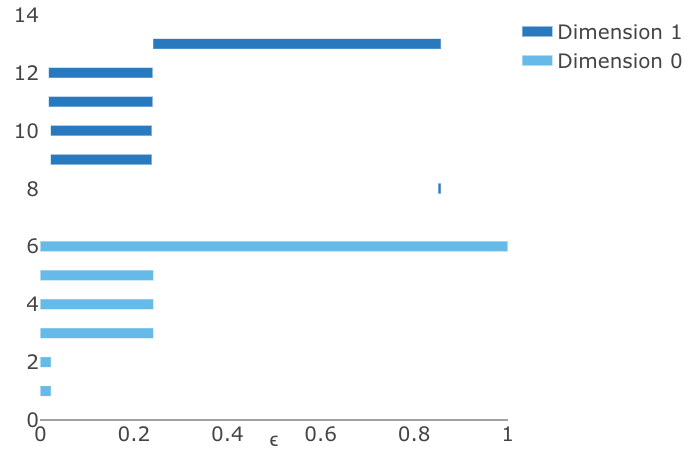 Figure 26
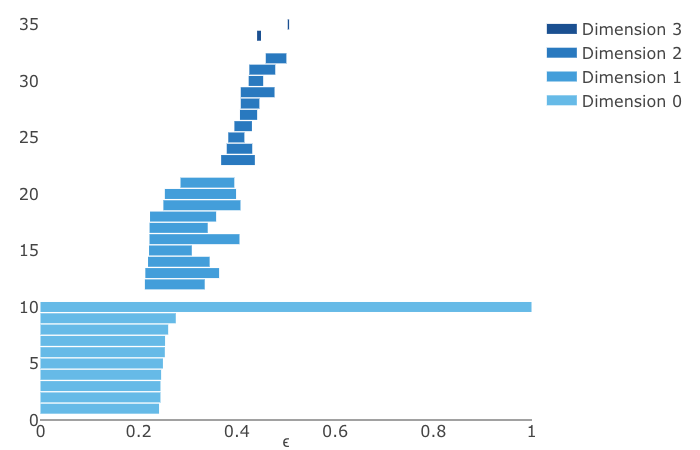 Figure 27
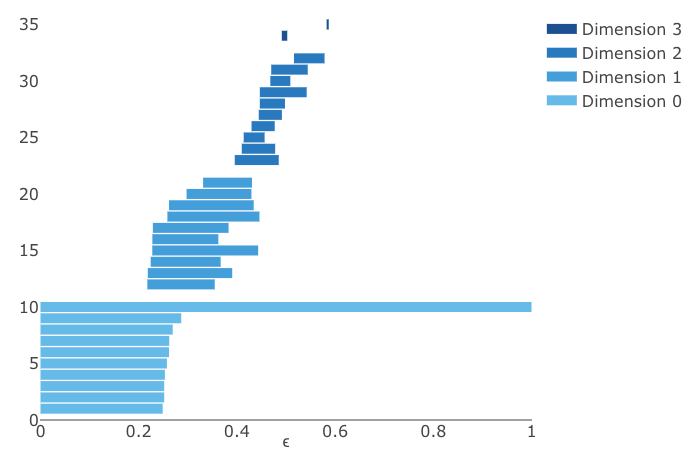 Figure 28
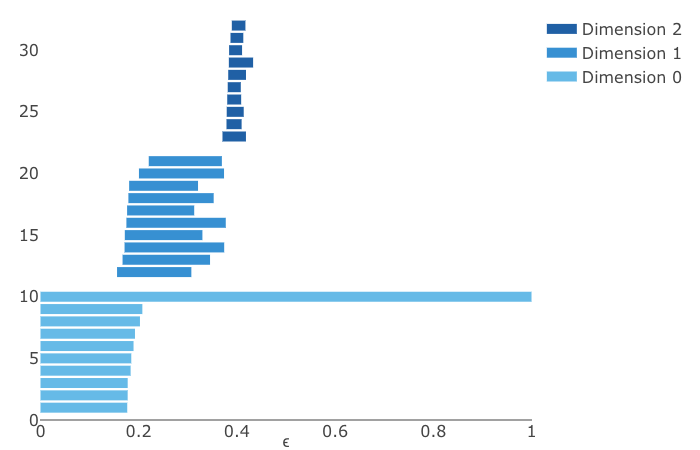 Figure 29
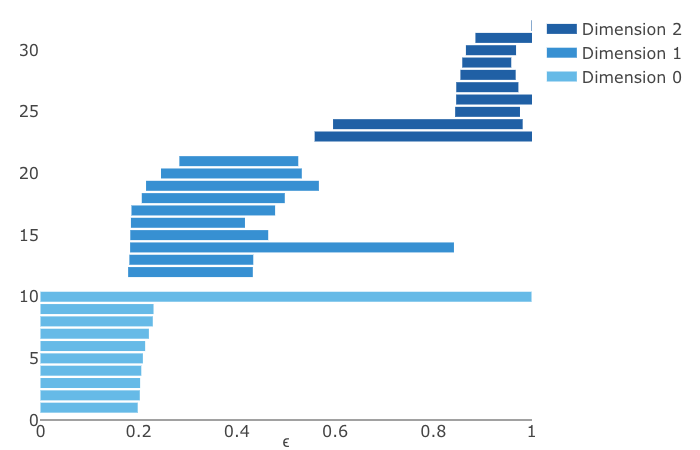 Figure 30
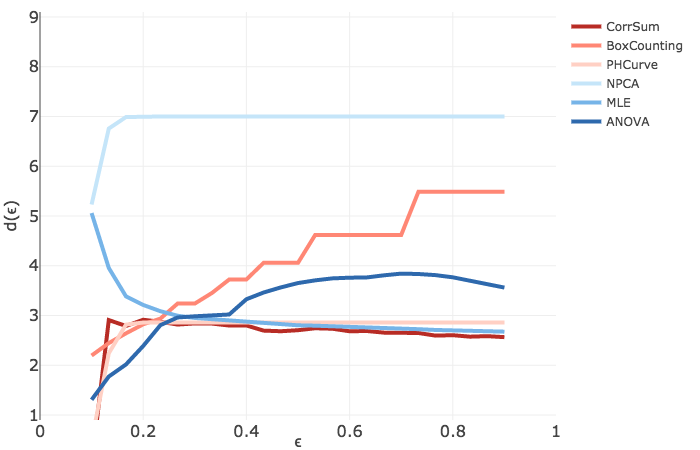 Figure 31
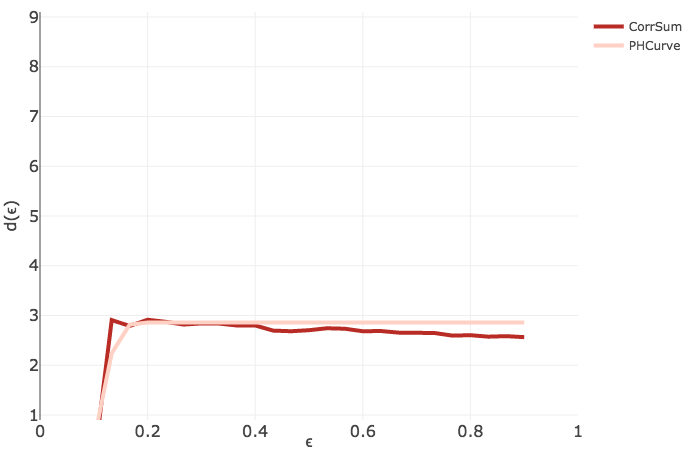 Figure 32
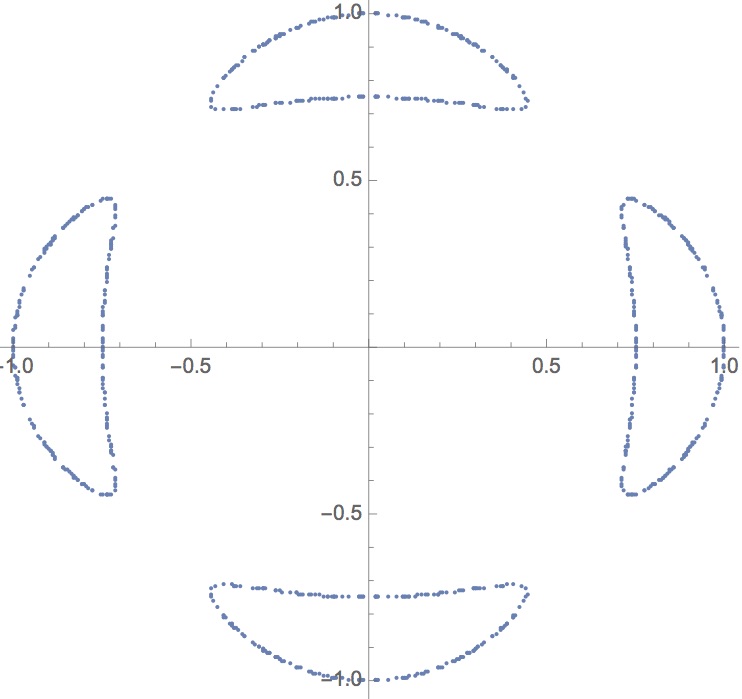 Figure 33
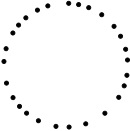 Figure 34
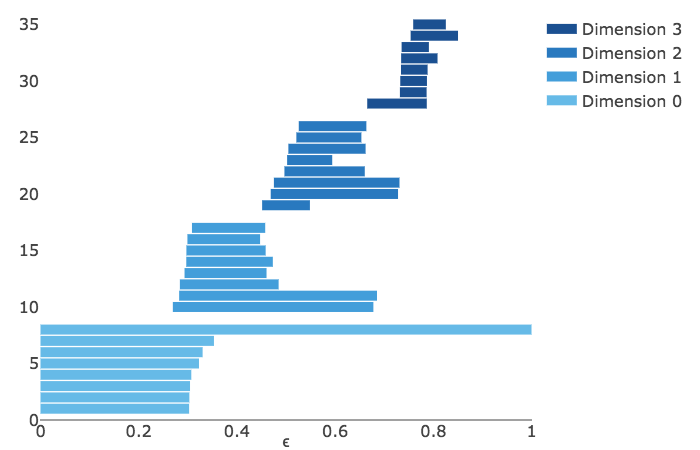 Figure 35
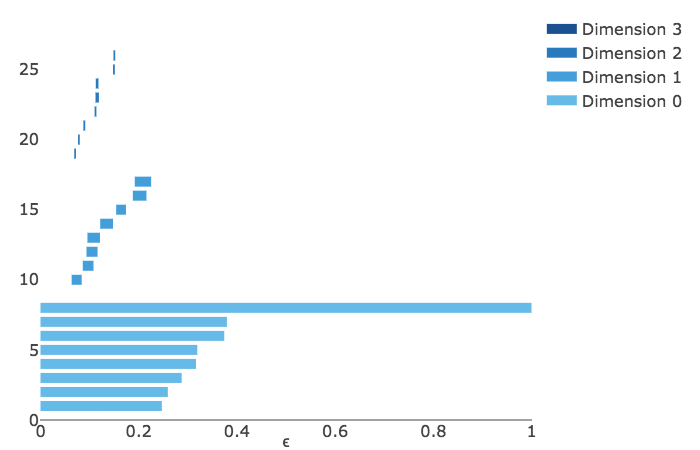 Figure 36
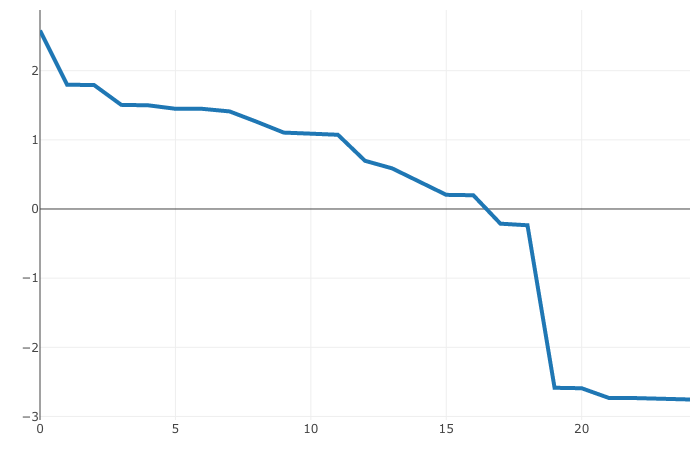 Figure 37
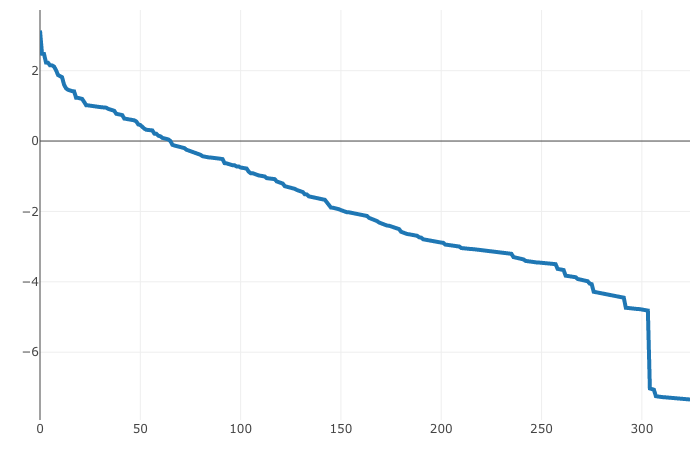 Figure 38
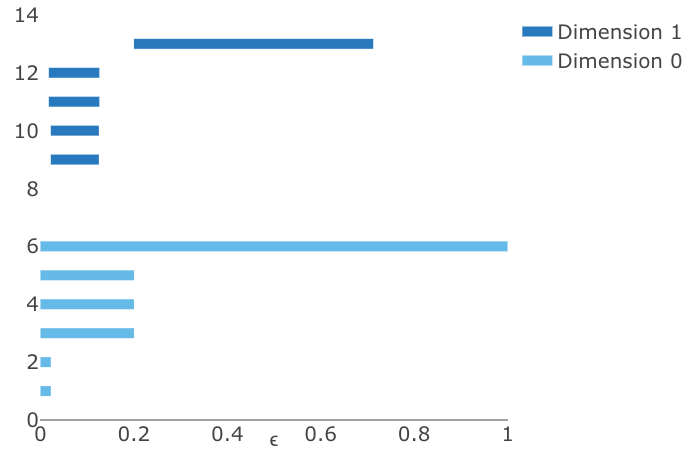 Figure 39
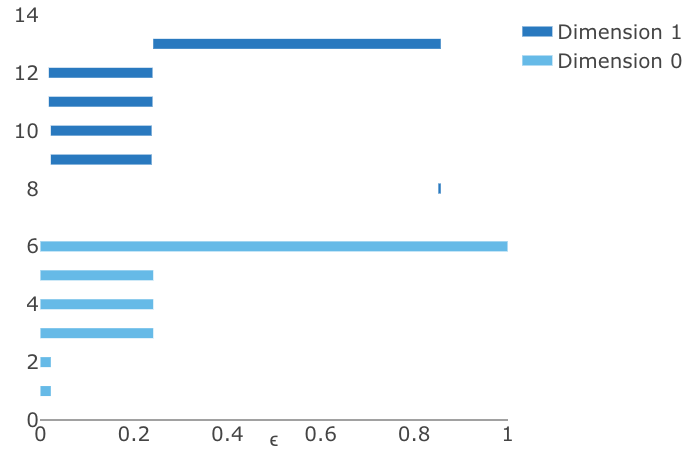 Figure 40
| QR | slightly less accurate and fast than SVD, yields some sparse basis vectors. |
| SVD | accurate, fast, but returns orthonormal and hence dense basis. |
| RREF | no accuracy guarantees, not as fast as the others, gives a sparse basis. |
Peer Reviews
No public reviews on file for this paper yet. If you reviewed it on a platform where reviews are public (OpenReview, ICLR, NeurIPS, ICML), you can paste yours below so the community can read it here.
Code & Models
Videos
No videos yet. Explain this paper in a talk, walkthrough, or lecture? Add one.
Learning Algebraic Varieties from Samples
Paul Breiding
Sara Kališnik
Bernd Sturmfels and Madeleine Weinstein
Abstract
We seek to determine a real algebraic variety from a fixed finite subset of points. Existing methods are studied and new methods are developed. Our focus lies on aspects of topology and algebraic geometry, such as dimension and defining polynomials. All algorithms are tested on a range of datasets and made available in a Julia package.
1 Introduction
This paper addresses a fundamental problem at the interface of data science and algebraic geometry. Given a sample of points from an unknown variety in , our task is to learn as much information about as possible. No assumptions on the variety , the sampling, or the distribution on are made. There can be noise due to rounding, so the points do not necessarily lie exactly on the variety from which they have been sampled. The variety is allowed to be singular or reducible. We also consider the case where lives in the projective space . We are interested in questions such as:
What is the dimension of ? 2. 2.
Which polynomials vanish on ? 3. 3.
What is the degree of ? 4. 4.
What are the irreducible components of ? 5. 5.
What are the homology groups of ?
Let us consider these five questions for the dataset with and shown in Figure 1. Here the answers are easy to see, but what to do if and no picture is available?
The dimension of the unknown variety is one. 2. 2.
The ideal of is generated by one polynomial of the form . 3. 3.
The degree of is two. A generic line meets in two (possibly complex) points. 4. 4.
The circle is irreducible because it admits a parametrization by rational functions. 5. 5.
The homology groups are and for .
There is a considerable body of literature on such questions in statistics and computer science. The general context is known as manifold learning. One often assumes that is smooth, i.e. a manifold, in order to apply local methods based on approximation by tangent spaces. Learning the true nature of the manifold is not a concern for most authors. Their principal aim is dimensionality reduction, and only serves in an auxiliary role. Manifolds act as a scaffolding to frame question 1. This makes sense when the parameters and are large. Nevertheless, the existing literature often draws its inspiration from figures in -space with many well-spaced sample points. For instance, the textbook by Lee and Verleysen [39] employs the “Swiss roll” and the “open box” for its running examples (cf. [39, §1.5]).
One notable exception is the work by Ma et al. [42]. Their Generalized Principal Component Analysis solves problems 1-4 under the assumption that is a finite union of linear subspaces. Question 5 falls under the umbrella of topological data analysis (TDA). Foundational work by Niyogi, Smale and Weinberger [47] concerns the number of samples needed to compute the homology groups of , provided is smooth and its reach is known.
The perspective of this paper is that of computational algebraic geometry. We care deeply about the unknown variety . Our motivation is the riddle: what is ? For instance, we may be given samples in , drawn secretly from the group of rotation matrices. Our goal is to learn the true dimension, which is three, to find the quadratic polynomials that vanish on , and to conclude with the guess that equals .
Our article is organized as follows. Section 2 presents basics of algebraic geometry from a data perspective. Building on [17], we explain some relevant concepts and offer a catalogue of varieties frequently seen in applications. This includes our three running examples: the Trott curve, the rotation group , and varieties of low rank matrices.
Section 3 addresses the problem of estimating the dimension of from the sample . We study nonlinear PCA, box counting dimension, persistent homology curve dimension, correlation dimension and the methods of Levina-Bickel [41] and Diaz-Quiroz-Velasco [23]. Each of these notions depends on a parameter between [math] and . This determines the scale from local to global at which we consider . Our empirical dimensions are functions of . We aggregate their graphs in the dimension diagram of , as seen in Figure 2.
Section 4 links algebraic geometry to topological data analysis. To learn homological information about from , one wishes to know the reach of the variety . This algebraic number is used to assess the quality of a sample [2, 47]. We propose a variant of persistent homology that incorporates information about the tangent spaces of at points in .
A key feature of our setting is the existence of polynomials that vanish on the model , extracted from polynomials that vanish on the sample . Linear polynomials are found by Principal Component Analysis (PCA). However, many relevant varieties are defined by quadratic or cubic equations. Section 5 concerns the computation of these polynomials.
Section 6 utilizes the polynomials found in Section 5. These cut out a variety that contains . We do not know whether holds, but we would like to test this and certify it, using both numerical and symbolic algorithms. The geography of inside is studied by computing dimension, degree, irreducible decomposition, real degree, and volume.
Section 7 introduces our software package LearningAlgebraicVarieties. This is written in Julia [7], and implements all algorithms described in this paper. It is available at
[TABLE]
To compute persistent homology, we use Henselman’s package Eirene [31]. For numerical algebraic geometry we use Bertini [6] and HomotopyContinuation.jl [10]. We conclude with a detailed case study for the dataset in [3, §6.3]. Here, consists of points in , representing conformations of the molecule cyclo-octane , shown in Figure 10.
Due to space limitations, many important aspects of learning varieties from samples are not addressed in this article. One is the issue of noise. Clearly, already the slightest noise in one of the points in Figure 1 will let no equation of the form vanish on . But some will almost vanish, and these are the equations we are looking for. Based on our experiments, the methods we present for answering questions 1-5 can handle data that is approximate to some extent. However, we leave a qualitative stability analysis for future work. We also assume that there are no outliers in our data. Another aspect of learning varieties is optimization. We might be interested in minimizing a polynomial function over the unknown variety by only looking at the samples in . This problem was studied by Cifuentes and Parrilo in [16], using the sum of squares (SOS) paradigm [9].
2 Varieties and Data
The mathematics of data science is concerned with finding low-dimensional needles in high-dimensional haystacks. The needle is the model which harbors the actual data, whereas the haystack is some ambient space. The paradigms of models are the -dimensional linear subspaces of , where is small and is large. Most of the points in are very far from any sample one might ever draw from , even in the presence of noise and outliers.
The data scientist seeks to learn the unknown model from the sample that is available. If is suspected to be a linear space, then she uses linear algebra. The first tool that comes to mind is Principal Component Analysis (PCA). Numerical algorithms for linear algebra are well-developed and fast. They are at the heart of scientific computing and its numerous applications. However, many models occurring in science and engineering are not linear spaces. Attempts to replace with a linear approximation are likely to fail.
This is the point where new mathematics comes in. Many branches of mathematics can help with the needles of data science. One can think of as a topological space, a differential manifold, a metric space, a Lie group, a hypergraph, a category, a semi-algebraic set, and lots of other things. All of these structures are useful in representing and analyzing models.
In this article we focus on the constraints that describe inside the ambient (or ). The paradigm says that these are linear equations, revealed numerically by feeding to PCA. But, if the constraints are not all linear, then we look for equations of higher degree.
2.1 Algebraic Geometry Basics
Our models are algebraic varieties over the field of real numbers. A variety is the set of common zeros of a system of polynomials in variables. A priori, a variety lives in Euclidean space . In many applications two points are identified if they agree up to scaling. In such cases, one replaces with the real projective space , whose points are lines through the origin in . The resulting model is a real projective variety, defined by homogeneous polynomials in unknowns. In this article, we use the term variety to mean any zero set of polynomials in or . The following three varieties serve as our running examples.
Example 2.1** (Trott Curve).**
The Trott curve is the plane curve of degree four defined by
[TABLE]
This curve is compact in and has four connected components (see Figure 3). The equation of the corresponding projective curve is obtained by homogenizing the polynomial (1). The curve is nonsingular. The Trott curve is quite special because all of its bitangent lines are all fully real. Plücker showed in 1839 that every plane quartic has complex bitangents, Zeuthen argued in 1873 that the number of real bitangents is , , or ; see [51, Table 1].
Example 2.2** (Rotation Matrices).**
The group consists of all -matrices with and . The last constraint translates into quadratic equations:
[TABLE]
These quadrics say that is an orthogonal matrix. Adding the cubic gives polynomials that define as a variety in . Their ideal is prime. In total, there are linearly independent quadrics in : the nine listed in (2), two from the diagonal of , and nine that express the right-hand rule for orientation, like .
Example 2.3** (Low Rank Matrices).**
Consider the set of -matrices of rank . This is the zero set of polynomials, namely the -minors. These equations are homogeneous of degree . Hence this variety lives naturally in the projective space .
A variety is irreducible if it is not a union of two proper subvarieties. The above varieties are irreducible. A sufficient condition for a variety to be irreducible is that it has a parametrization by rational functions. This holds in Example 2.3 where consists of the matrices where and have rows. It also holds for the rotation matrices
[TABLE]
However, smooth quartic curves in admit no such rational parametrization.
The two most basic invariants of a variety are its dimension and its degree. The former is the length of the longest proper chain of irreducible varieties . A general system of linear equations has a finite number of solutions on . That number is well-defined if we work over . It is the degree of , denoted . The Trott curve has dimension and degree . The group has dimension and degree . In Example 2.3, if and , then the projective variety has dimension and degree .
There are several alternative definitions of dimension and degree in algebraic geometry. For instance, they are read off from the Hilbert polynomial, which can be computed by way of Gröbner bases. We refer to Chapter 9, titled Dimension Theory, in the textbook [17].
A variety that admits a rational parametrization is called unirational. Smooth plane curves of degree are not unirational. However, the varieties that arise in applications are often unirational. The reason is that often models a generative process. This happens in statistics, where represents some kind of (conditional) independence structure. Examples include graphical models, hidden Markov models and phylogenetic models.
If is a unirational variety with given rational parametrization, then it is easy to create a finite subset of . One selects parameter values at random and plugs these into the parametrization. For instance, one creates rank one matrices by simply multiplying a random column vector with a random row vector. A naive approach to sampling from the rotation group is plugging four random real numbers into the parametrization (3). Another method for sampling from will be discussed in Section 7.
Given a dataset that comes from an applied context, it is reasonable to surmise that the underlying unknown variety admits a rational parametrization. However, from the vantage point of a pure geometer, such unirational varieties are rare. To sample from a general variety , we start from its defining equations, and we solve many linear equations on . The algebraic complexity of carrying this out is measured by . See Dufresne et al. [26] for recent work on sampling by way of numerical algebraic geometry.
Example 2.4**.**
One might sample from the Trott curve in Example 2.1 by intersecting it with a random line. Algebraically, one solves linear equation on the curve. That line intersects in points. Computing the intersection points can be done numerically, but also symbolically by using Cardano’s formula for the quartic. In either case, the coordinates computed by these methods may be complex numbers. Such points are simply discarded if real samples are desired. This can be a rather wasteful process.
At this point, optimization and real algebraic geometry enter the scene. Suppose that upper and lower bounds are known for the values of a linear function on . In that case, the equations to solve have the form , where is chosen between these bounds.
For the Trott curve, we might know that no real points exist unless . We choose at random between and , plug it into the equation (1), and then solve the resulting quartic in . The solutions thus obtained are likely to be real, thus giving us lots of real samples on the curve. Of course, for arbitrary real varieties, it is a hard problem to identify a priori constraints that play the role of . However, recent advances in polynomial optimization, notably in sum-of-squares programming [9], should be quite helpful.
At this point, let us recap and focus on a concrete instance of the riddles we seek to solve.
Example 2.5**.**
Let , and consider the following forty sample points in :
[TABLE]
Where do these samples come from? Do the zero entries or the sign patterns offer any clue?
To reveal the answer we label the coordinates as . The relations
[TABLE]
hold for all data points. Hence is the variety of -matrices of rank . Following Example 2.3, we view this as a projective variety in . In that ambient projective space, the determinantal variety is a manifold of dimension and degree . Note that is homeomorphic to , so we can write its homology groups using the Künneth formula.
In data analysis, proximity between sample points plays a crucial role. There are many ways to measure distances. In this paper we restrict ourselves to two metrics. For data in we use the Euclidean metric, which is induced by the standard inner product . For data in we use the Fubini-Study metric. Points and in are represented by their homogeneous coordinate vectors. The Fubini-Study distance from to is the angle between the lines spanned by representative vectors and in :
[TABLE]
This formula defines the unique Riemannian metric on that is orthogonally invariant.
2.2 A Variety of Varieties
In what follows we present some “model organisms” seen in applied algebraic geometry. Familiarity with a repertoire of interesting varieties is an essential prerequisite for those who are serious about learning algebraic structure from the datasets they might encounter.
Rank Constraints. Consider -matrices with linear entries having rank . We saw the case in Example 2.3. A rank variety is the set of all tensors of fixed size and rank that satisfy some linear constraints. The constraints often take the simple form that two entries are equal. This includes symmetric matrices, Hankel matrices, Toeplitz matrices, Sylvester matrices, etc. Many classes of structured matrices generalize naturally to tensors.
Example 2.6**.**
Let and identify with the space of skew-symmetric -matrices . These satisfy . Let be the variety of rank matrices in . A parametric representation is given by , so the are the -minors of a -matrix. The ideal of is generated by the * pfaffians* . These quadrics are also known as the Plücker relations, and is the Grassmannian of -dimensional linear subspaces in . The -secants of are represented by the variety of skew-symmetric matrices of rank . Its equations are the pfaffians of . We refer to [30, Lectures 6 and 9] for an introduction to these classical varieties.
Example 2.7**.**
The space of tensors has dimension . Suppose we sample from its subspace of symmetric tensors . This has dimension . We use the convention where is the number of indices in , is the number of indices , and is the number of indices . This identifies tensors with cubic polynomials , and hence with cubic surfaces in -space. Fix and take to be the variety of tensors of rank . The equations that define the tensor rank variety are the -minors of the Hankel matrix
[TABLE]
See Landsberg’s book [38] for an introduction to the geometry of tensors and their rank.
Example 2.8**.**
In distance geometry, one encodes finite metric spaces with points in the Schönberg matrix \,D\,=\,\bigl{(}d_{ip}+d_{jp}-d_{ij}\bigr{)}\, where is the squared distance between points and . The symmetric matrix is positive semidefinite if and only if the metric space is Euclidean, and its embedding dimension is the rank of . See [21, §6.2.1] for a textbook introduction and derivation of Schönberg’s esults. Hence the rank varieties of the Schönberg matrix encode the finite Euclidean metric spaces with points. A prominent dataset corresponding to the case and will be studied in Section 7.
Matrices and tensors with rank constraints are ubiquitous in data science. Make sure to search for such low rank structures when facing vectorized samples, as in Example 2.5.
Hypersurfaces. The most basic varieties are defined by just one polynomial. When given a sample , one might begin by asking for hypersurfaces that contain and that are especially nice, simple and informative. Here are some examples of special structures worth looking for.
Example 2.9**.**
For in Example 2.6, is the hypersurface of the -pfaffian:
[TABLE]
The monomials correspond to the matchings of the complete graph with six vertices.
Example 2.10**.**
The hyperdeterminant of format is a polynomial of degree four in unknowns, namely the entries of a -tensor . Its expansion equals
[TABLE]
This hypersurface is rational and it admits several nice parametrizations, useful for sampling points. For instance, up to scaling, we can take the eight principal minors of a symmetric -matrix, with as the -minor, for the -minors (i.e. diagonal entries), for the -minors, and for the -determinant.
Example 2.11**.**
Let , with coordinates for given by the off-diagonal entries of a symmetric -matrix . There is a unique quintic polynomial in these variables that vanishes on symmetric -matrices of rank . This polynomial, known as the pentad, plays a historical role in the statistical theory of factor analysis [25, Example 4.2.8]. It equals
[TABLE]
We can sample from the pentad using the parametrization for .
Example 2.12**.**
The determinant of the matrix in Example 2.8 equals the squared volume of the simplex spanned by points in . If then we get Heron’s formula for the area of a triangle in terms of its side lengths. The hypersurface in defined by this polynomial represents configurations of points in that are degenerate.
One problem with interesting hypersurfaces is that they often have a very high degree and it would be impossible to find that equation by our methods in Section 5. For instance, the Lüroth hypersurface [5] in the space of ternary quartics has degree , and the restricted Boltzmann machine [18] on four binary random variables has degree . These hypersurfaces are easy to sample from, but there is little hope to learn their equations from those samples.
Secret Linear Spaces. This refers to varieties that become linear spaces after a simple change of coordinates. Linear spaces are easy to recognize from samples using PCA.
Toric varieties become linear spaces after taking logarithms, so they can be learned by taking the coordinatewise logarithm of the sample points. Formally, a toric variety is the image of a monomial map. Equivalently, it is an irreducible variety defined by binomials.
Example 2.13**.**
Let and consider the following dataset in :
[TABLE]
Replace each of these forty vectors by its coordinate-wise logarithm. Applying PCA to the resulting vectors, we learn that our sample comes from a -dimensional subspace of . This is the row space of a -matrix whose columns are the vertices of a regular octahedron:
[TABLE]
Our original samples came from the toric variety associated with this matrix. This means each sample has the form , where are positive real numbers.
Toric varieties are important in applications. For instance, in statistics they correspond to exponential families for discrete random variables. Overlap with rank varieties arises for matrices and tensors of rank . Those smallest rank varieties are known in geometry as the Segre varieties (for arbitrary tensors) and the Veronese varieties (for symmetric tensors). These special varieties are toric, so they are represented by an integer matrix as above.
Example 2.14**.**
Let and take to be a sample of points of the form
[TABLE]
The corresponding variety is a reciprocal linear space ; see [37]. In projective geometry, such a variety arises as the image of a linear space under the classical Cremona transformation. From the sample we can learn the variety by replacing each data point by its coordinate-wise inverse. Applying PCA to these reciprocalized data, we learn that is a surface in , cut out by ten cubics like .
Algebraic Statistics and Computer Vision. Model selection is a standard task in statistics. The models considered in algebraic statistics [25] are typically semi-algebraic sets, and it is customary to identify them with their Zariski closures, which are algebraic varieties.
Example 2.15**.**
Bayesian networks are also known as directed graphical models. The corresponding varieties are parametrized by monomial maps from products of simplices. Here are the equations for a Bayesian network on binary random variables [25, Example 3.3.11]:
[TABLE]
The coordinates represent the probabilities of observing the states under this model.
Computational biology is an excellent source of statistical models with interesting geometric and combinatorial properties. These include hidden variable tree models for phylogenetics, and hidden Markov models for gene annotation and sequence alignment.
In the social sciences and economics, statistical models for permutations are widely used:
Example 2.16**.**
Let and consider the Plackett-Luce model for rankings of three items [53]. Each item has a model parameter , and we write for the probability of observing the permutation . The model is the surface in given by the parametrization
[TABLE]
The prime ideal of this model is generated by three quadrics and one cubic:
[TABLE]
When dealing with continuous distributions, we can represent certain statistical models as varieties in moment coordinates. This applies to Gaussians and their mixtures.
Example 2.17**.**
Consider the projective variety in given parametrically by and
[TABLE]
These are the moments of order of the mixture of two Gaussian random variables on the line. Here and are the means, and are the variances, and is the mixture parameter. It was shown in [4, Theorem 1] that this is a hypersurface of degree in . For we get the Gaussian moment surface which is defined by the -minors of the -matrix
[TABLE]
Example 2.18**.**
Let and fix the space of -matrices. An essential matrix is the product of a rotation matrix times a skew-symmetric matrix. In computer vision, these matrices represent the relative position of two calibrated cameras in -space. Their entries serve as invariant coordinates for pairs of such cameras. The variety of essential matrices is defined by ten cubics. These are known as the Démazure cubics [36, Example 2.2].
The article [36] studies camera models in the presence of distortion. For example, the model described in [36, Example 2.3] concerns essential matrices plus one focal length unknown. This is the codimension two variety defined by the -minors of the -matrix
[TABLE]
Learning such models is important for image reconstruction in computer vision.
3 Estimating the Dimension
The first question one asks about a variety is “What is the dimension?”. In what follows, we discuss methods for estimating from the finite sample , taken from . We present six dimension estimates. They are motivated and justified by geometric considerations. For a manifold, dimension is defined in terms of local charts. This is consistent with the notion of dimension in algebraic geometry [17, Chapter 9]. The dimension estimates in this section are based on alone. Later sections will address the computation of equations that vanish on . These can be employed to find upper bounds on ; see (23). In what follows, however, we do not have that information. All we are given is the input .
3.1 Dimension Diagrams
There is an extensive literature (see e.g. [13, 14]) on computing an intrinsic dimension of the sample from a manifold . The intrinsic dimension of is a positive real number that approximates the Hausdorff dimension of , a quantity that measures the local dimension of a space using the distances between nearby points. It is a priori not clear that the algebraic definition of agrees with the topological definition of Hausdorff dimension that is commonly used in manifold learning. However, this will be true under the following natural hypotheses. We assume that is a variety in or such that the set of real points is Zariski dense in each irreducible component of . If is irreducible, then its singular locus is a proper subvariety, so it has measure zero. The regular locus is a real manifold. Each connected component is a real manifold of dimension .
The definitions of intrinsic dimension can be grouped into two categories: local methods and global methods [14, 35]. Definitions involving information about sample neighborhoods fit into the local category, while those that use the whole dataset are called global.
Instead of making such a strict distinction between local and global, we introduce a parameter . The idea behind this is that should determine the range of information that is used to compute the dimension from the local scale () to the global scale ().
To be precise, for each of the dimension estimates, locality is determined by a notion of distance: the point sample is a finite metric space. In our context we restrict extrinsic metrics to the sample. For samples we work with the scaled Euclidean distance
[TABLE]
For samples taken in projective space we use the scaled Fubini-Study distance
[TABLE]
Two points and in are considered -close with respect to the parameter if or , respectively. Given we divide the sample into clusters , which are defined in terms of -closeness, and apply the methods to each cluster separately, thus obtaining dimension estimates whose definition of being local depends on . In particular, for we consider each sample point individually, while for we consider the whole sample. Intermediate values of interpolate between the two.
Many of the definitions of intrinsic dimension are consistent. This means that it is possible to compute a scale from for which the intrinsic dimension of each cluster converges to the dimension of if is sufficiently large and is sampled sufficiently densely. By contrast, our paradigm is that is fixed. For us, does not tend to infinity. Our standing assumption is that we are given one fixed sample . The goal is to compute a meaningful dimension from that fixed sample of points. For this reason, we cannot unreservedly employ results on appropriate parameters in our methods. The sample will almost never satisfy the assumptions that are needed. Our approach to circumvent this problem is to create a dimension diagram. Such diagrams are shown in Figures 2, 6, 8 and 11.
Definition 3.1**.**
Let be one of the subsequent dimension estimates. The dimension diagram of the sample is the graph of the function .
Remark 3.2**.**
The idea of using dimension diagrams is inspired by persistent homology. Our dimension diagrams and our persistent homology barcodes of Section 4 both use in the interval for the horizontal axis. This uniform scale for all samples makes comparisons across different datasets easier.
The true dimension of a variety is an integer. However, we defined the dimension diagram to be the graph of a function whose range is a subset of the real numbers. The reason is that the subsequent estimates do not return integers. A noninteger dimension can be meaningful mathematically, such as in the case of a fractal curve which fills space densely enough that its dimension could be considered closer to than . By plotting these diagrams, we hope to gain information about the true dimension of the variety from which was sampled.
One might be tempted to use the same dimension estimate for and , possibly via the Euclidean distance on an affine patch of . However, the Theorema Egregium by Gauss implies that any projection from to must distort lengths. Hence, because we gave the parameter a metric meaning, we must be careful and treat real Euclidean space and real projective space separately.
Each of the curves seen in Figure 2 is a dimension diagram. We used six different methods for estimating the dimension on a fixed sample of points. For the horizontal axis on the left we took the distance (6) in . For the diagram on the right we took (7) in .
3.2 Six dimension estimates
In this section, we introduce six dimension estimates. They are adapted from the existing literature. Figures 2, 6, 8 and 11 show dimension diagrams generated by our implementation. Judging from those figures, the estimators CorrSum, PHCurve, MLE and ANOVA all perform well on each of the examples. By contrast, NPCA and BoxCounting frequently overestimate the dimension. In general, we found it useful to allow for a “majority vote” for the dimension. That is, we choose as dimension estimate the number which is closest to most of the estimators for a significant (i.e. “persistent”) range of -values in .
NPCA Dimension. The gold standard of dimension estimation is PCA. Assuming that is a linear subspace of , we perform the following steps for the input . First, we record the mean . Let be the -matrix with rows . We compute , the singular values of . The PCA dimension is the number of above a certain threshold. For instance, this threshold could be the same as in the definition of the numerical rank in (21) below. Following [39, p. 30], another idea is to set the threshold as , where . In our experiments we found that this improved the dimension estimates. In some situations it is helpful to further divide each column of by its standard deviation. This approach is explained in [39, p. 26].
Using PCA on a local scale is known as Nonlinear Principal Component Analysis (NPCA). Here we partition the sample into clusters depending on . For each we apply the usual PCA and obtain the estimate . The idea behind this is that the manifold is approximately linear locally. We take the average of these local dimensions, weighted by the size of each cluster. The result is the nonlinear PCA dimension
[TABLE]
Data scientists have many clustering methods. For our study we use single linkage clustering. This works as follows. The clusters are the connected components in the graph with vertex set whose edges are the pairs of points having distance at most . We do this either in Euclidean space with metric (6), or in projective space with metric (7). In the latter case, the points come from the cone over the true variety . To make less scattered, we sample a random linear function and scale each data point such that . Then we use those affine coordinates for NPCA. We chose this procedure because NPCA detects linear spaces and the proposed scaling maps projective linear spaces to affine-linear spaces.
We next introduce the notions of box counting dimension, persistent homology curve dimension and correlation dimension. All three of these belong to the class of fractal-based methods, since they rest on the idea of using the fractal dimension as a proxy for .
Box Counting Dimension. Here is the geometric idea in . Consider a square of side length which we cover by miniature squares. We could cover it with squares of side length , or squares of side length , etc. What remains constant is the log ratio of the number of pieces over the magnification factor. For the square: . If only intersects out of smaller squares, then we estimate the dimension to be between and .
In we choose as a box the parallelopiped with lower vertex and upper vertex , where “min” and “max” are coordinatewise minimum and maximum. Thus the box is . For , the interval is divided into equally sized intervals, whose length depends on . A -dimensional object is expected to capture boxes. We determine the number of boxes that contain a point in . Then the box counting dimension estimate is
[TABLE]
How to define the function ? Since the number of small boxes is very large, we cannot iterate through all boxes. It is desirable to decide from a data point in which box it lies. To this end, we set , where . Then, for and we compute the largest such that . The numbers completely determine the box that contains the sample .
For the box counting dimension in real projective space, we represent the points in on an affine patch of . On this patch we do the same construction as above, the only exception being that “equally sized intervals” is measured in terms of scaled Fubini-Study distance (7).
Persistent Homology Curve Dimension. The underlying idea was proposed by the Pattern Analysis Lab at Colorado State University [50]. First we partition into clusters using single linkage clustering with . On each subsample we construct a minimal spanning tree. Suppose that the cluster has points. Let be the length of the -th longest edge in a minimal spanning tree for . For each we compute
[TABLE]
The persistent homology curve dimension estimate is the average of the local dimensions, weighted by the size of each cluster:
[TABLE]
In the clustering step we take the distance (6) if the variety is affine and (7) if it is projective.
Correlation Dimension. This is motivated as follows. Suppose that is uniformly distributed in the unit ball. For pairs , we have , where . We set , where is the indicator function. Since we expect the empirical distribution to be approximately , this suggests using as dimension estimate. In [39, §3.2.6] it is mentioned that a more practical estimate is obtained from by selecting some small and putting
[TABLE]
In practice, we compute the dimension estimates for a finite subset of parameters and put . The ball in defined by the scaled Fubini-Study distance (7) is a spherical cap of radius . Its volume relative to a cap of radius 1 is , which we approximate by \,\bigl{(}\frac{\sin(\epsilon)}{\sin(1)}\bigr{)}^{d}. Hence, the projective correlation dimension estimate is
[TABLE]
with the same as above and where is now computed using the Fubini-Study distance.
We next describe two more methods. They differ from the aforementioned in that they derive from estimating the dimension of the variety locally at a distinguished point .
MLE Dimension. Levina and Bickel [41] introduced a maximum likelihood estimator for the dimension of an unknown variety . Their estimate is derived for samples in Euclidean space . Let be the number of samples in that are within distance to . We write for the distance from to its -th nearest neighbor in . Note that . The Levina-Bickel formula around the point is
[TABLE]
This expression is derived from the hypothesis that obeys a Poisson process on the -neighborhood , in which is uniformly distributed. The formula (11) is obtained by solving the likelihood equations for this Poisson process.
In projective space, we model as a Poisson process on . However, instead of assuming that is uniformly distributed in that neighborhood, we assume that the orthogonal projection of onto the tangent space is uniformly distributed in the associated ball of radius . Then, we derive the formula
[TABLE]
where is the distance from to its -th nearest neighbor in measured for (7).
It is not clear how to choose from the given . We chose the following method. Fix the sample neighborhood . For each we evaluate the formula (11) for with distinguished point . With this, the MLE dimension estimate is
[TABLE]
ANOVA Dimension. Diaz, Quiroz and Velasco [23] derived an analysis of variance estimate for the dimension of . In their approach, the following expressions are important:
[TABLE]
The quantity is the variance of the random variable , defined as the angle between two uniformly chosen random points on the -sphere. We again fix , and we relabel so that are the points in with distance at most from . Let denote the angle between and . Then, the sample covariance of the is
[TABLE]
The analysis in [23] shows that, for small and sampled from a -dimensional manifold, the angles are approximately -distributed. Hence, is expected to be close to . The ANOVA dimension estimate of is the index such that is closest to :
[TABLE]
As for the MLE estimate, we average (14) over all being the distinguished point.
To transfer the definition to projective space, we revisit the idea behind the ANOVA estimate. For close to , the secant through and is approximately parallel to the tangent space of at . Hence, the unit vector is close to being in the tangent space . The sphere in has dimension and we know the variances of the random angles . To mimic this construction in we use the angles between geodesics meeting at . In our implementation, we orthogonally project to the tangent space and compute (13) using coordinates on that space.
We have defined all the mathematical ingredients inherent in our dimension diagrams. Figure 2 now makes sense. Our software and its applications will be discussed in Section 7.
4 Persistent Homology
This section connects algebraic geometry and topological data analysis. It concerns the computation and analysis of the persistent homology [15] of our sample . Persistent homology of contains information about the shape of the unknown variety from which originates.
4.1 Barcodes
Let us briefly review the idea. Given , we associate a simplicial complex with each value of a parameter . Just like in the case of the dimension diagrams in the previous section, determines the scale at which we consider from local () to global (). The complex at consists of only the vertices and at it is the full simplex on .
Persistent homology identifies and keeps track of the changes in the homology of those complexes as varies. The output is a barcode, i.e. a collection of intervals. Each interval in the barcode corresponds to a topological feature which appears at the value of a parameter given by the left hand endpoint of the interval and disappears at the value given by the right hand endpoint. These barcodes play the same role as a histogram does in summarizing the shape of the data, with long intervals corresponding to strong topological signals and short ones to noise. By plotting the intervals we obtain a barcode, such as the one in Figure 3.
The most straightforward way to associate a simplicial complex to at is by covering with open sets and then building the associated nerve complex. This is the simplicial complex with vertex set , where a subset of is a face if and only if . If all nonempty finite intersections of are contractible topological spaces, then the Nerve Lemma guarantees that the homology groups of agree with those of its nerve complex. When are -balls around the data points, i.e.
[TABLE]
the nerve complex is called the Čech complex at . Here and are the distances from (6) and (7), respectively. Theorem 4.2 gives a precise statement for a sufficient condition under which the Čech complex of built on yields the correct topology of . However, in practice the hypotheses of the theorem will rarely be satisfied.
Čech complexes are computationally demanding as they require storing simplices in different dimensions. For this reason, applied topologists prefer to work with the Vietoris-Rips complex, which is the flag simplicial complex determined by the edges of the Čech complex. This means that a subset is a face of the Vietoris-Rips complex if and only if for all . With the definition in (15), the balls and intersect if and only if their centers and are less than apart.
Consider the sample from the Trott curve in Figure 3. Following Example 2.4, we sampled by selecting random -coordinates between and , and solving for , or vice versa. The picture on the right shows the barcode. This was computed via the Vietoris-Rips complex. For dimensions [math] and the six longest bars are displayed. The sixth bar in dimension is so tiny that we cannot see it. In the range where lies between [math] and , we see four components. The barcode for dimension identifies four persisting features for between and . Each of these indicates an oval. Once these disappear, another loop appears. This corresponds to the fact that the four ovals are arranged to form a circle. So persistent homology picks up on both intrinsic and extrinsic topological features of the Trott curve.
The repertoire of algebraic geometry offers a fertile testing ground for practitioners of persistent homology. For many classes of algebraic varieties, both over and , one has a priori information about their topology. For instance, the determinantal variety in Example 2.5 is the -manifold . Using Henselman’s software Eirene for persistent homology [31], we computed barcodes for several samples drawn from varieties with known topology.
4.2 Tangent Spaces and Ellipsoids
We underscore the benefits of an algebro-geometric perspective by proposing a variant of persistent homology that performed well in the examples we tested. Suppose that, in addition to knowing as a finite metric space, we also have information on the tangent spaces of the unknown variety at the points . This will be the case after we have learned some polynomial equations for using the methods in Section 5. In such circumstances, we suggest replacing the -balls in (15) with ellipsoids that are aligned to the tangent spaces.
The motivation is that in a variety with a bottleneck, for example in the shape of a dog bone, the balls around points on the bottleneck may intersect for smaller than that which is necessary for the full cycle to appear. When is a manifold, we design a covering of that exploits the locally linear structure. Let . We take to be an ellipsoid around with principal axes of length in the tangent direction of at and principal axes of length in the normal direction. In this way, we allow ellipsoids to intersect with their neighbors and thus reveal the true homology of the variety before ellipsoids intersect with other ellipsoids across the medial axis. The parameter can be chosen by the user. We believe that should be proportional to the reach of . This metric invariant is defined in the next subsection.
In practice, we perform the following procedure. Let be a vector of polynomials that vanish on , derived from the sample as in Section 5. An estimator for the tangent space is the kernel of the Jacobian matrix of at . In symbols,
[TABLE]
Let denote the quadratic form on that takes value on and value on the orthogonal complement of in the sphere . Then, the specify the ellipsoids
[TABLE]
The role of the -ball enclosing the th sample point is now played by . These ellipsoids determine the covering of the given point cloud . From this covering we construct the associated Čech complex or Vietoris-Rips complex.
While using ellipsoids is appealing, it has practical drawbacks. Relating the smallest for which and intersect to is not easy. For this reason we implemented the following variant of ellipsoid-driven barcodes. We use the simplicial complex on where
[TABLE]
In (17) we weigh the distance between and by the arithmetic mean of the radii of the two ellipsoids and in the direction . If all quadratic forms were equal to , then the simplicial complex of (17) equals the Vietoris-Rips complex from (15).
Figure 4 compares the barcodes for the classical Vietoris-Rips complex with those obtained from ellipsoids. It seems promising to further develop variants of persistent homology that take some of the defining polynomial equations for into consideration.
4.3 Reaching the Reach
The Čech complex of a covering has the homology of the union of balls . But, can we give conditions on the sample under which a covering reveals the true homology of ? A result due to Niyogi, Smale and Weinberger (Theorem 4.2 below) offers an answer in some circumstances. These involve the concept of the reach, which is an important metric invariant of a variety . We here focus on varieties in the Euclidean space .
Definition 4.1**.**
The medial axis of is the set of all points such that the minimum distance from to is attained by two distinct points. The reach is the infimum of all distances from points on the variety to any point in its medial axis . In formulas: . If , we define .
Note that , if and only if is an affine-linear subspace. Otherwise, the reach is a non-negative real number. In particular, there exist varieties with . For instance, consider the union of two lines . All points in the diagonal have two closest points on . Hence, is a subset of the medial axis , and we conclude that . In general, any singular variety with an “edge” has zero reach.
To illustrate the concept of the reach, let be a smooth curve in the plane, and draw the normal line at each point of . The collection of these lines is the normal bundle. At a short distance from the curve, the normal bundle is a product: each point near has a unique closest point on , and lies on the normal line through . At a certain distance, however, some of the normal lines cross. If is a crossing point of minimal distance to , then has no unique closest point on . Instead, there are at least two points on that are closest to and the distance from to each of them is the reach . Aamari et al. [2] picture this by writing that “one can roll freely a ball of radius around ”.
Niyogi, Smale and Weinberger refer to as the “condition number of ”. Bürgisser et al. [12] relate to the condition number of a semialgebraic set. For the purposes of our survey it suffices to understand how the reach effects the quality of the covering . The following result is a simplified version of [47, Theorem 3.1], suitable for low dimensions. Note that Theorem 4.2 only covers those varieties that are smooth and compact.
Theorem 4.2** (Niyogi, Smale, Weinberger 2006).**
Let be a compact manifold of dimension , with reach and -dimensional Euclidean volume . Let be i.i.d. samples drawn from the uniform probability measure on . Fix and . For any desired , fix the sample size at
[TABLE]
With probability , the homology groups of the following set coincide with those of :
[TABLE]
A few remarks are in order. First of all, the theorem is stated using the Euclidean distance and not the scaled Euclidean distance (6). However, scaling the distance by a factor means scaling the volume by , so the definition of in the theorem is invariant under scaling. Moreover, the theorem has been rephrased in a manner that makes it easier to evaluate the right hand side of (18) in cases of interest. The assumption is not important: it ensures that the volume of the unit ball in can be bounded below by . Furthermore, in [47, Theorem 3.1], the tolerance can be any real number between [math] and , but then depends in a complicated manner on . For simplicity, we took .
Theorem 4.2 gives the asymptotics of a sample size that suffices to reveal all topological features of . For concrete parameter values it is less useful, though. For example, suppose that has dimension , reach , and volume . If we desire a 90% guarantee that has the same homology as , so , then must exceed . In addition to that, the theorem assumes that the sample was drawn from the uniform distribution on . But in practice one will rarely meet data that obeys such a distribution. In fact, drawing from the uniform distribution on a curved object is a non-trivial affair [22].
In spite of its theoretical nature, the Niyogi-Smale-Weinberger formula is useful in that it highlights the importance of the reach for analyzing point samples. Indeed, the dominant quantity in (18) is , and this grows to the power of in . It is therefore of interest to better understand and to develop tools for estimating it.
We found the following formula by Federer [28, Theorem 4.18] to be useful. It expresses the reach of a manifold in terms of points and their tangent spaces:
[TABLE]
This formula relies upon knowing the tangent spaces at each point of .
Suppose we are given the finite sample from . If some equations for are also known, then we can use the estimator for the tangent space that was derived in (16). From this we get the following formula for the empirical reach of our sample:
[TABLE]
A similar approach for estimating the reach was proposed by Aamari et al. [2, eqn. (6.1)].
4.4 Algebraicity of Persistent Homology
It is impossible to compute in the field of real numbers . Numerical computations employ floating point approximations. These are actually rational numbers. Computing in algebraic geometry has traditionally been centered around exact symbolic methods. In that context, computing with algebraic numbers makes sense as well. In this subsection we argue that, in the setting of this paper, most numerical quantities in persistent homology, like the barcodes and the reach, have an algebraic nature. Here we assume that the variety is defined over .
We discuss the work of Horobeţ and Weinstein in [33] which concerns metric properties of a given variety that are relevant for its true persistent homology. Here, the true persistent homology of , at parameter value , refers to the homology of the -neighborhood of . Intuitively, the true persistent homology of the Trott curve is the limit of barcodes as in Figure 3, where more and more points are taken, eventually filling up the entire curve.
An important player is the offset hypersurface . This is the algebraic boundary of the -neighborhood of . More precisely, for any positive value of , the offset hypersurface is the Zariski closure of the set of all points in whose distance to equals . If and is a plane curve, then the offset curve is drawn by tracing circles along .
Example 4.3**.**
In Figure 5 we examine a conic , shown in black. The light blue curve is its evolute. This is an astroid of degree . The evolute serves as the ED discriminant of , in the context seen in [24, Figure 3]. The blue curves in Figure 5 are the offset curves . These have degree and are smooth (over ) for small values of . However, for larger values of , the offset curves are singular. The transition point occurs at the cusp of the evolute.
It is shown in [33, Theorem 3.4] that the endpoints of bars in the true persistent homology of a variety occur at numbers that are algebraic over . The proof relies on results in real algebraic geometry that characterize the family of fibers in a map of semialgebraic sets.
Example 4.4**.**
The bars of the barcode in Figure 3 begin and end near the numbers
[TABLE]
These algebraic numbers delineate the true persistent homology of the Trott curve .
The reach of any real variety is also an algebraic number. This follows from Federer’s formula (19) which expresses as the optimal value of a polynomial optimization problem. In principle, the reach can be computed in exact arithmetic from the polynomials that define . It remains an open problem how to do this effectively in practice. Eklund’s recent work on bottlenecks [27] represents an important step towards a solution.
At present we do not know a good formula or a tight bound for the algebraic degrees of the barcode and the reach in terms of the invariants of the variety . Deriving such formulas will require a further development and careful analysis of the offset discriminant that was introduced in [33]. We hope to return to this topic in the near future, as it can play a fundamental link between topology and algebraic geometry in the context of data science.
5 Finding Equations
Every polynomial in the ideal of the unknown variety vanishes on the sample . The converse is not true, but it is reasonable to surmise that it holds among polynomials of low degree. The ideal of the finite set can be computed using