Encoding Mechano-Memories in Actin Networks
Sayantan Majumdar, Louis C. Foucard, Alex J. Levine, Margaret L., Gardel

TL;DR
This paper demonstrates that cross-linked F-actin networks can encode long-lasting mechanical memories through stress-dependent changes in filament order, showing potential for biological adaptation to mechanical stimuli.
Contribution
It introduces a novel mechano-memory mechanism in actin networks, linking mechanical history to nonlinear elastic response via filament nematic order changes.
Findings
Shear stress induces long-lived changes in mechanical response.
Memory can be erased by opposite-direction force application.
Mechanical adaptation correlates with stress-dependent filament order changes.
Abstract
Understanding the response of complex materials to external force is central to fields ranging from materials science to biology. Here, we describe a novel type of mechanical adaptation in cross-linked networks of F-actin, a ubuiquitous protein found in eukaryotic cells. We show that shear stress changes its nonlinear mechanical response even long after that stress is removed. The duration, magnitude and direction of forcing history all impact changes in mechanical response. The `memory' of the forcing history is long-lived, but can be erased by force application in the opposite direction. We further show that the observed mechanical adaptation is consistent with stress-dependent changes in the nematic order of the constituent filaments. Thus, this mechano-memory is a type of nonlinear hysteretic response in which an applied, "training" strain modifies the nonlinear elasticity. This…
Click any figure to enlarge with its caption.
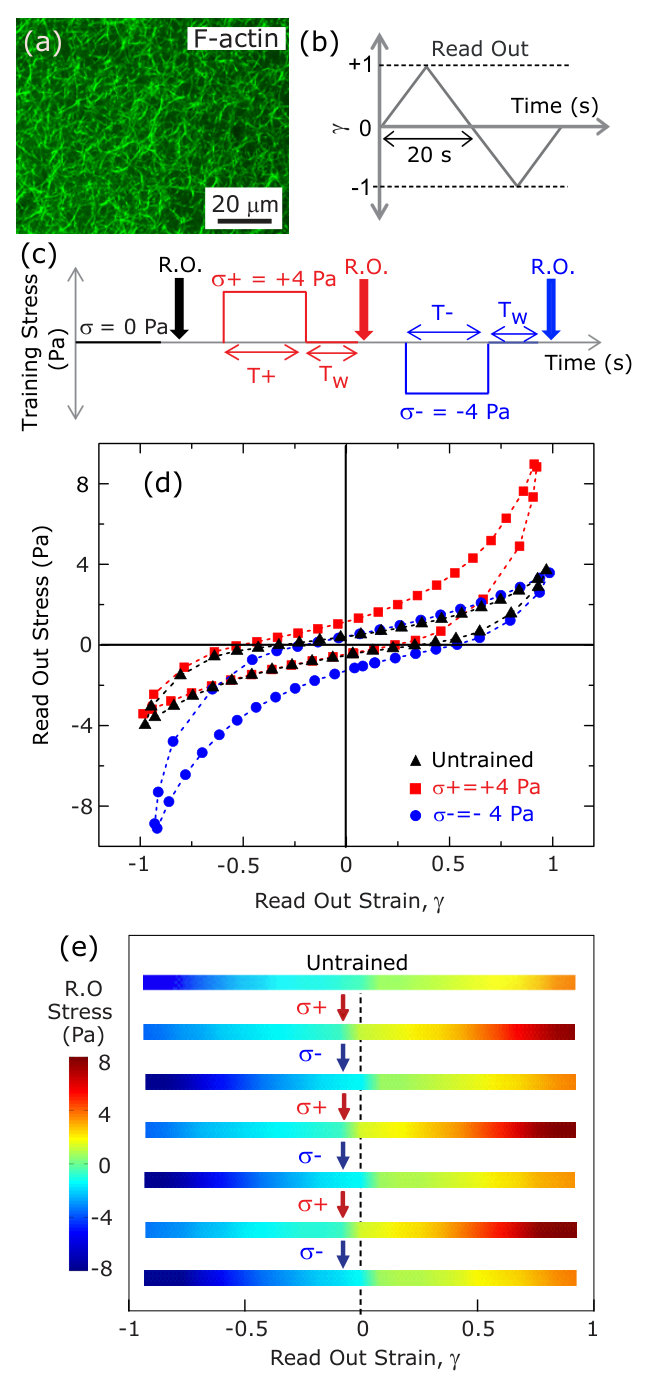 Figure 1
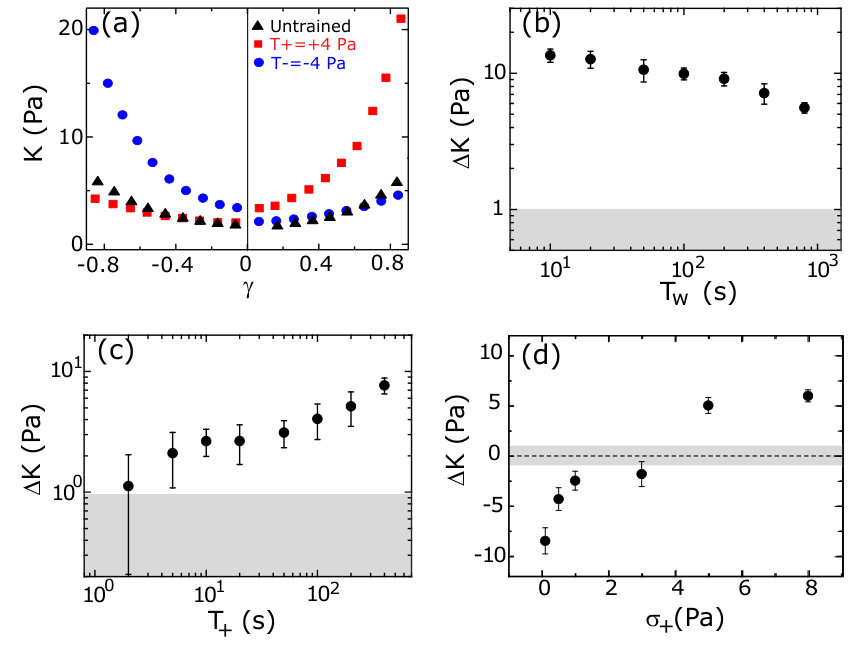 Figure 2
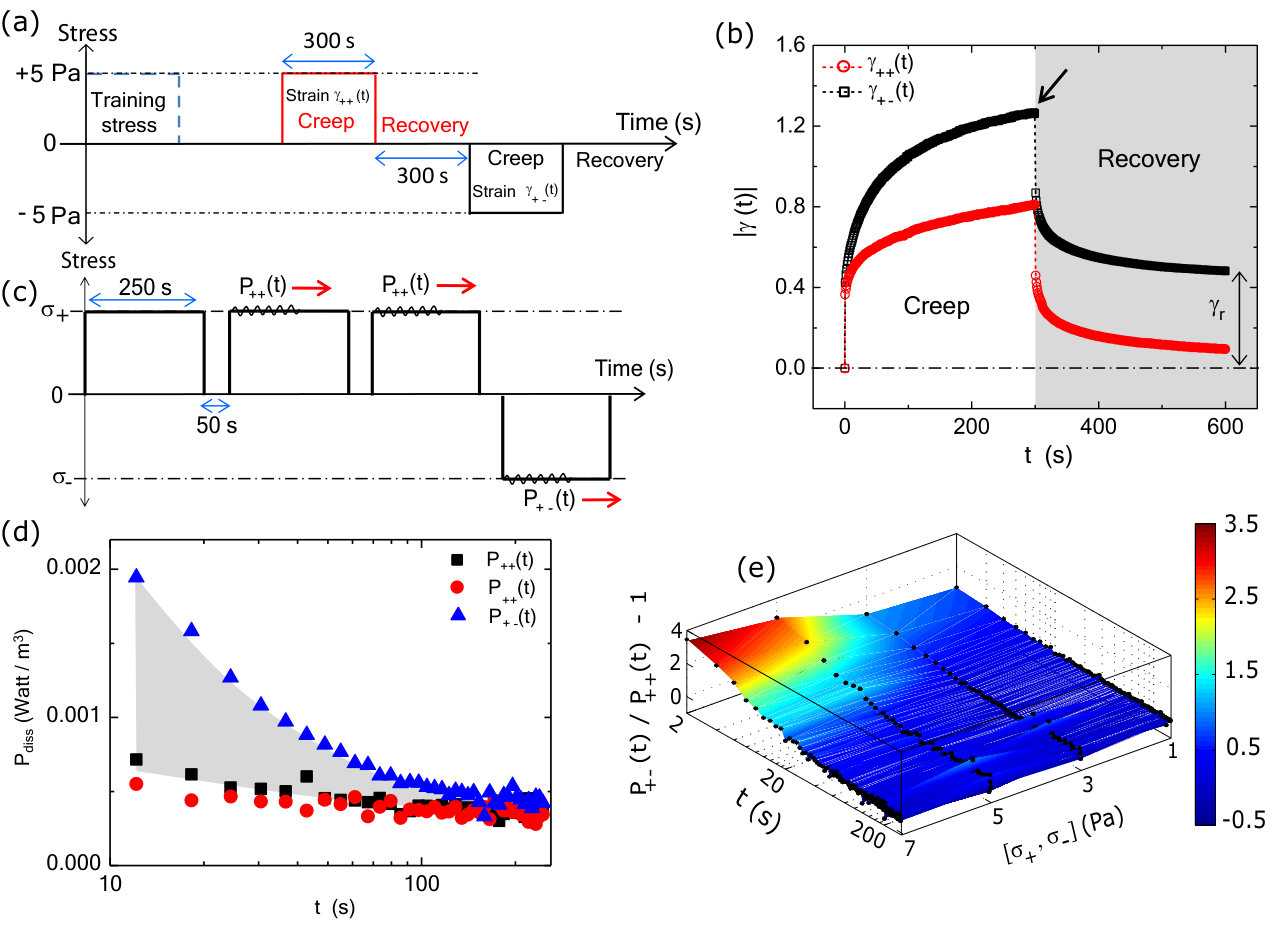 Figure 3
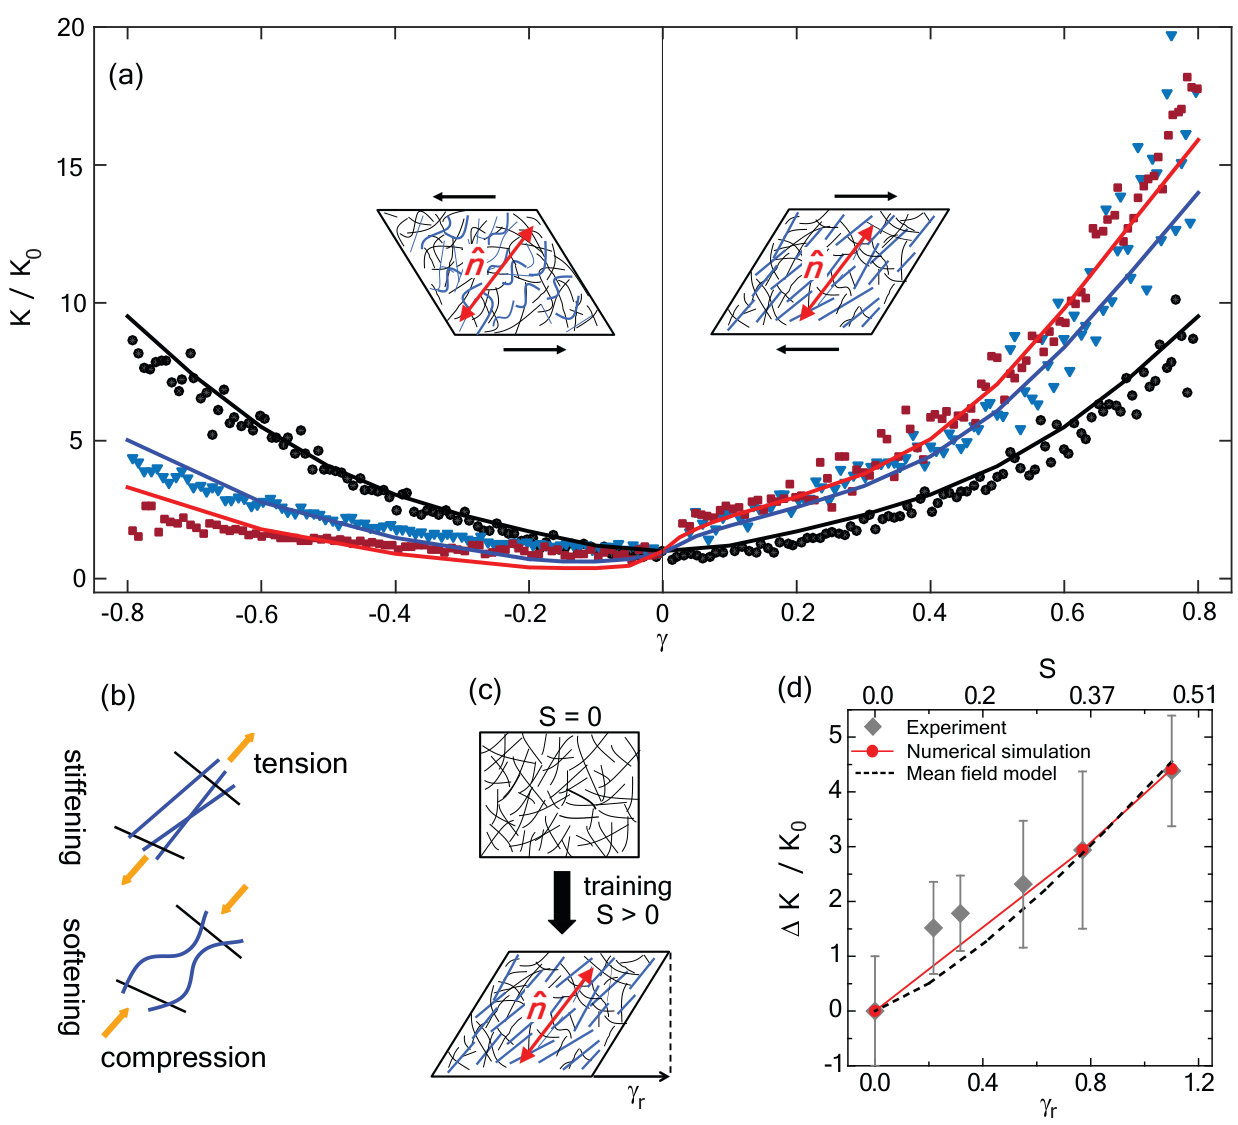 Figure 4
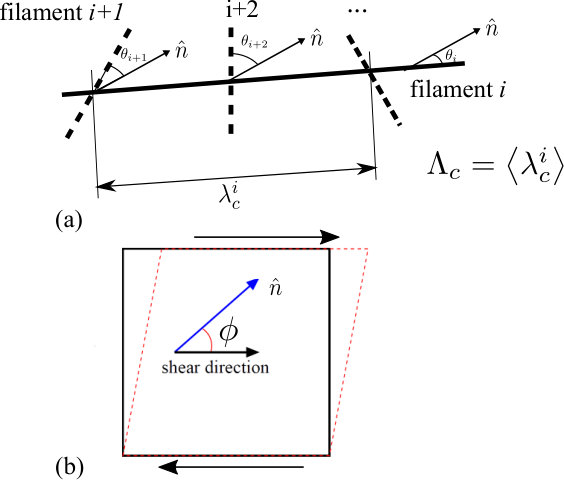 Figure 5
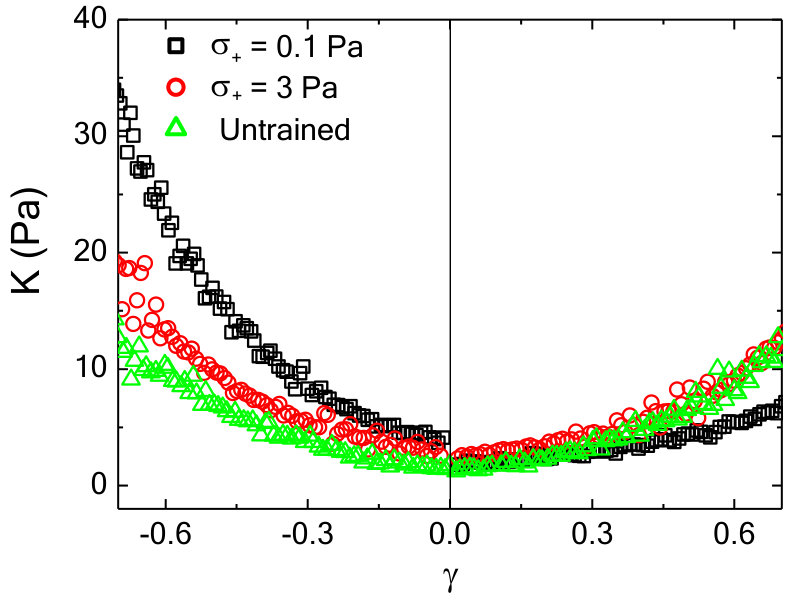 Figure 1
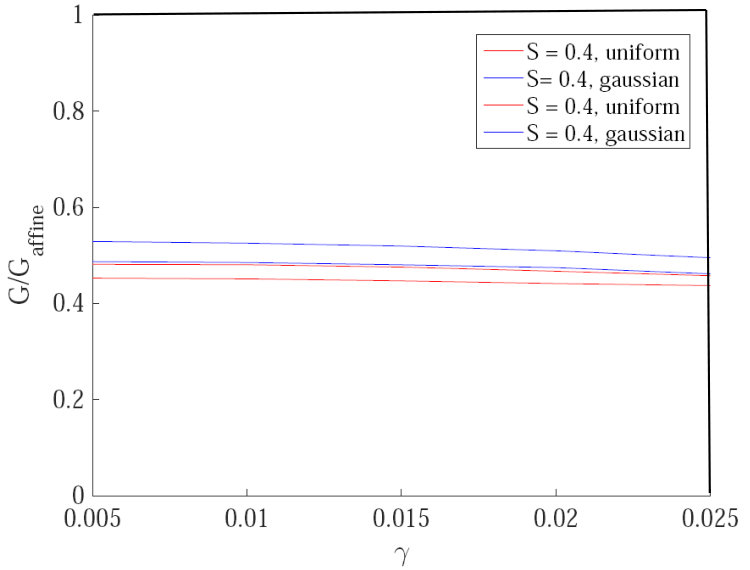 Figure 10
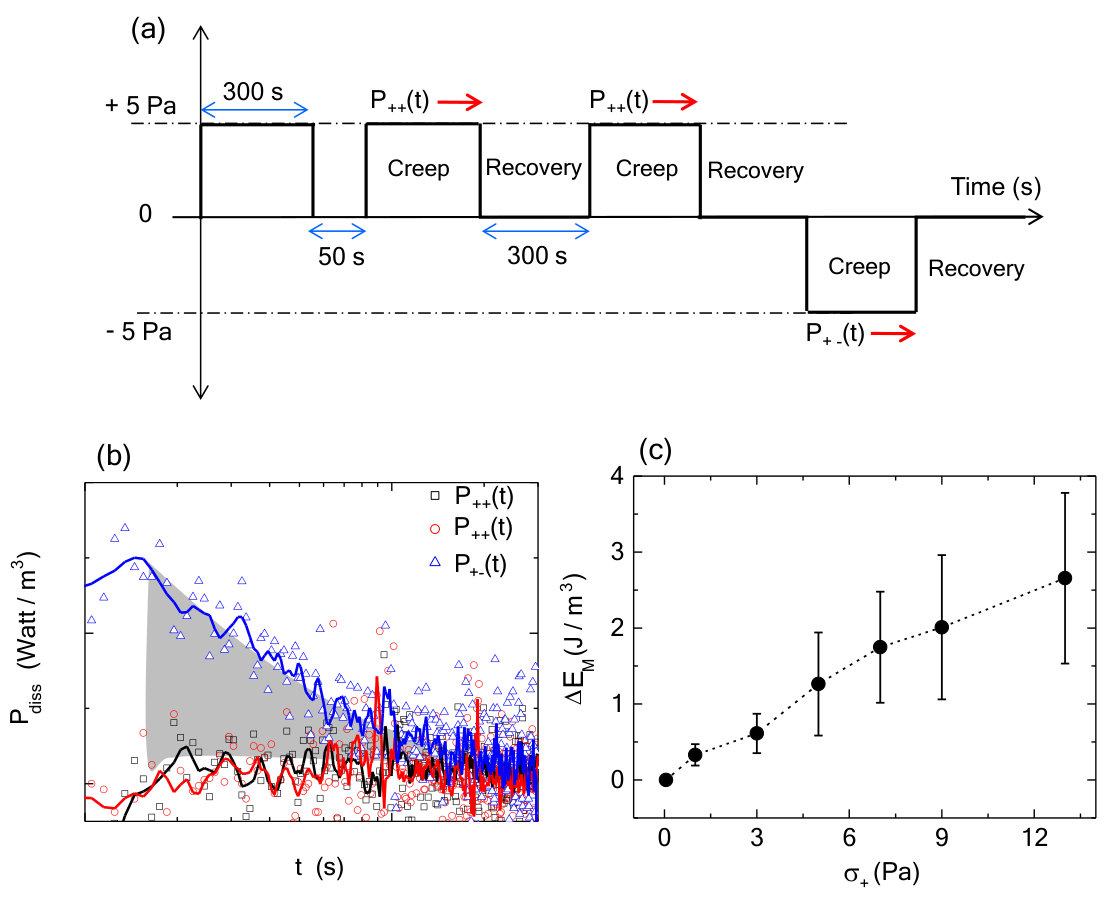 Figure 2
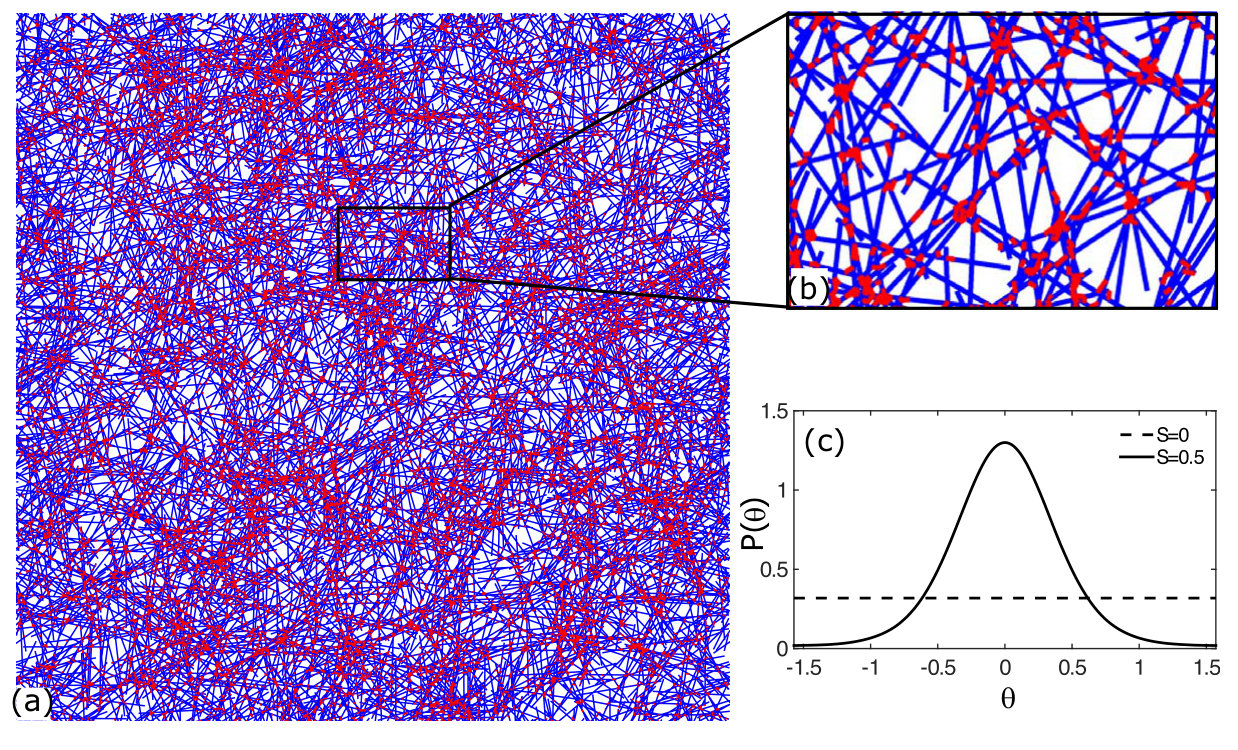 Figure 3
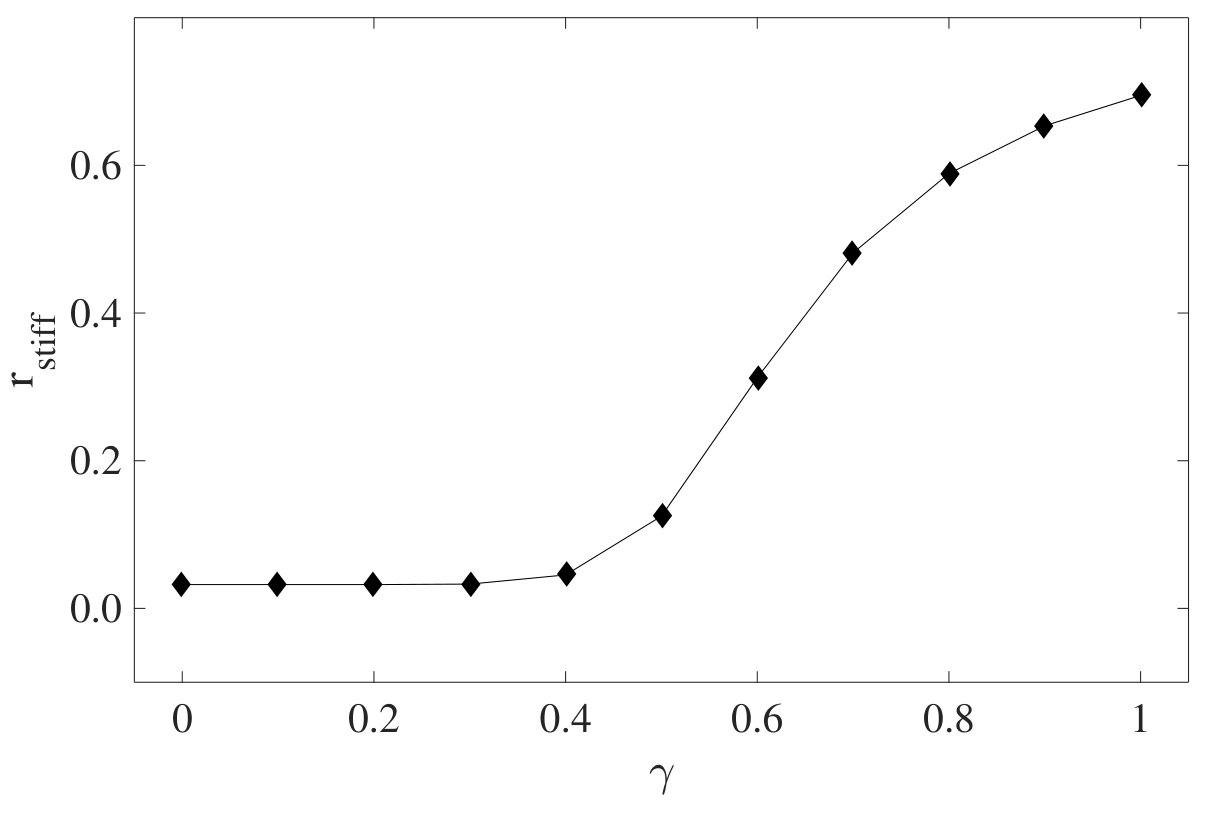 Figure 4
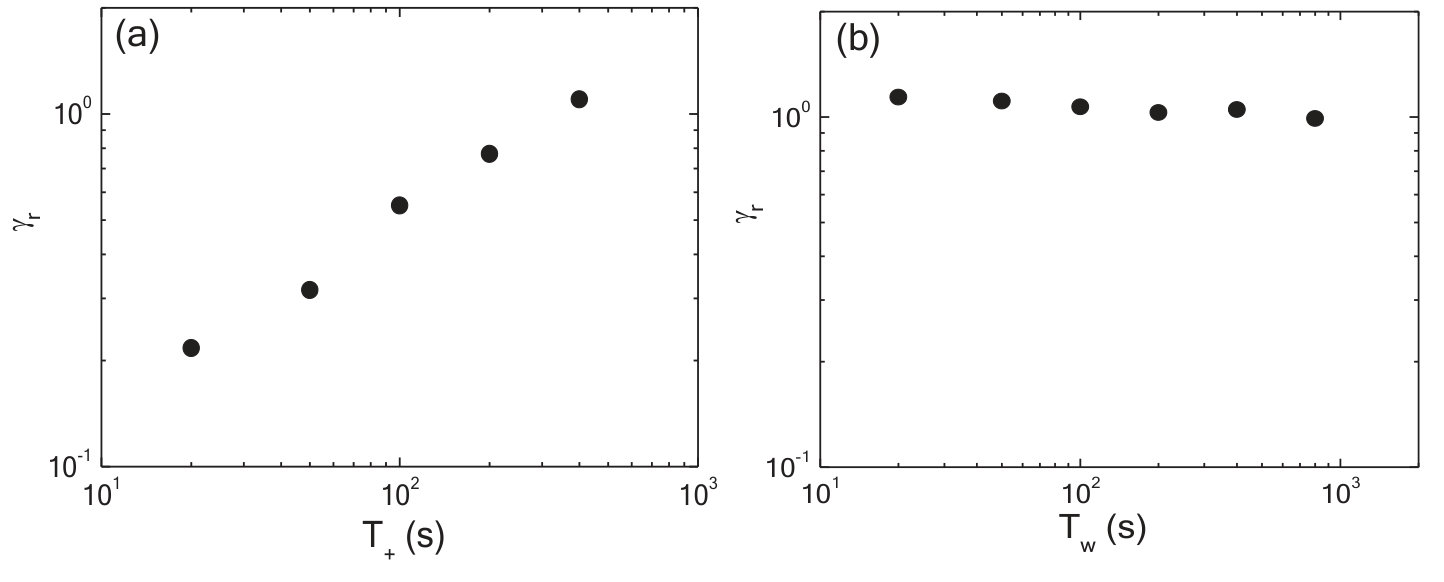 Figure 5
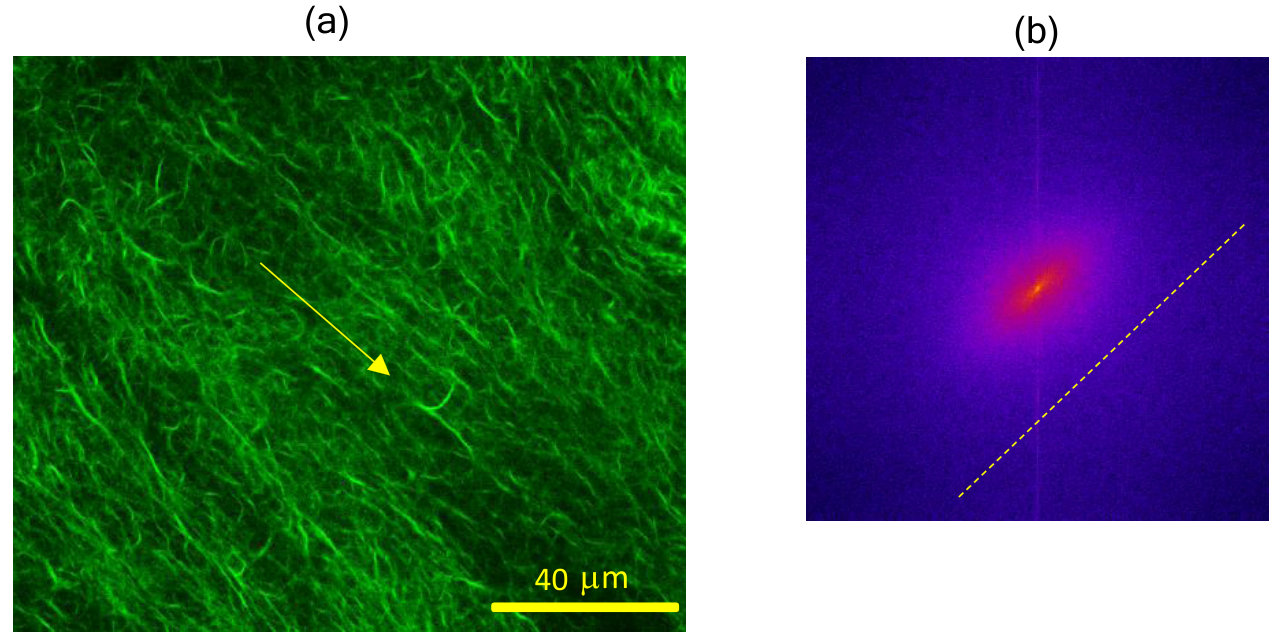 Figure 6
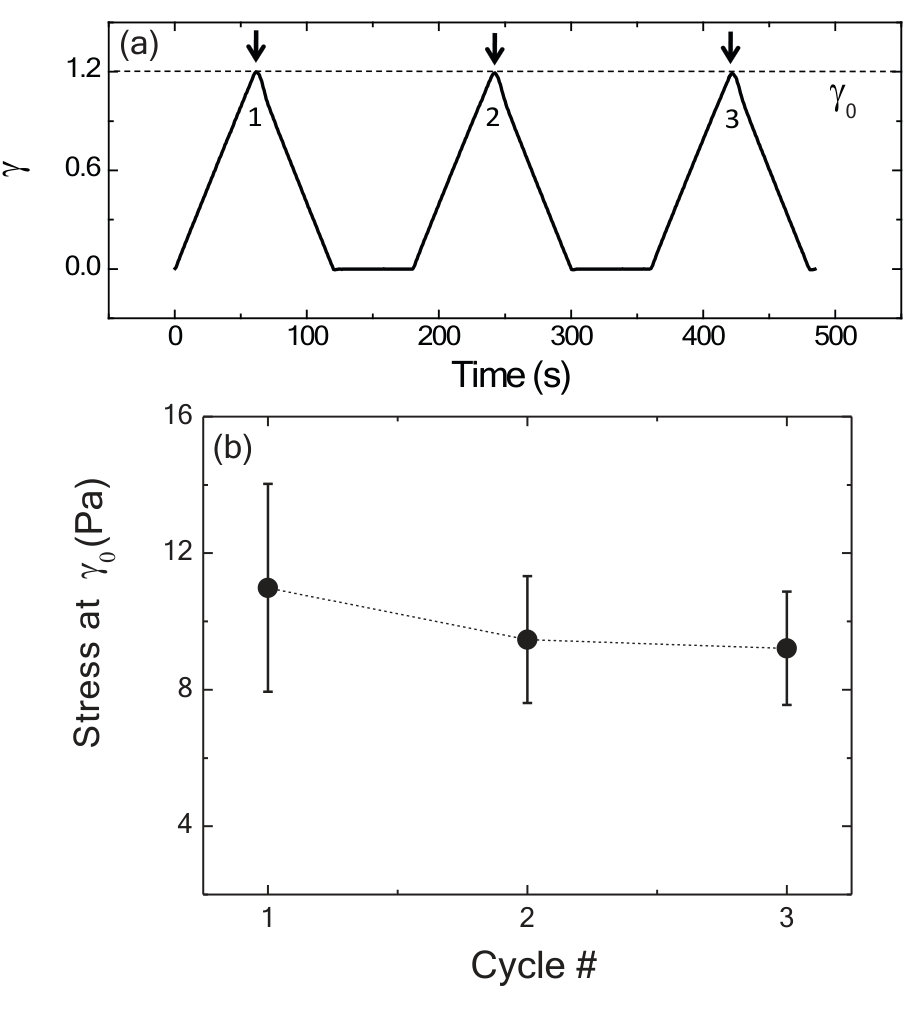 Figure 7
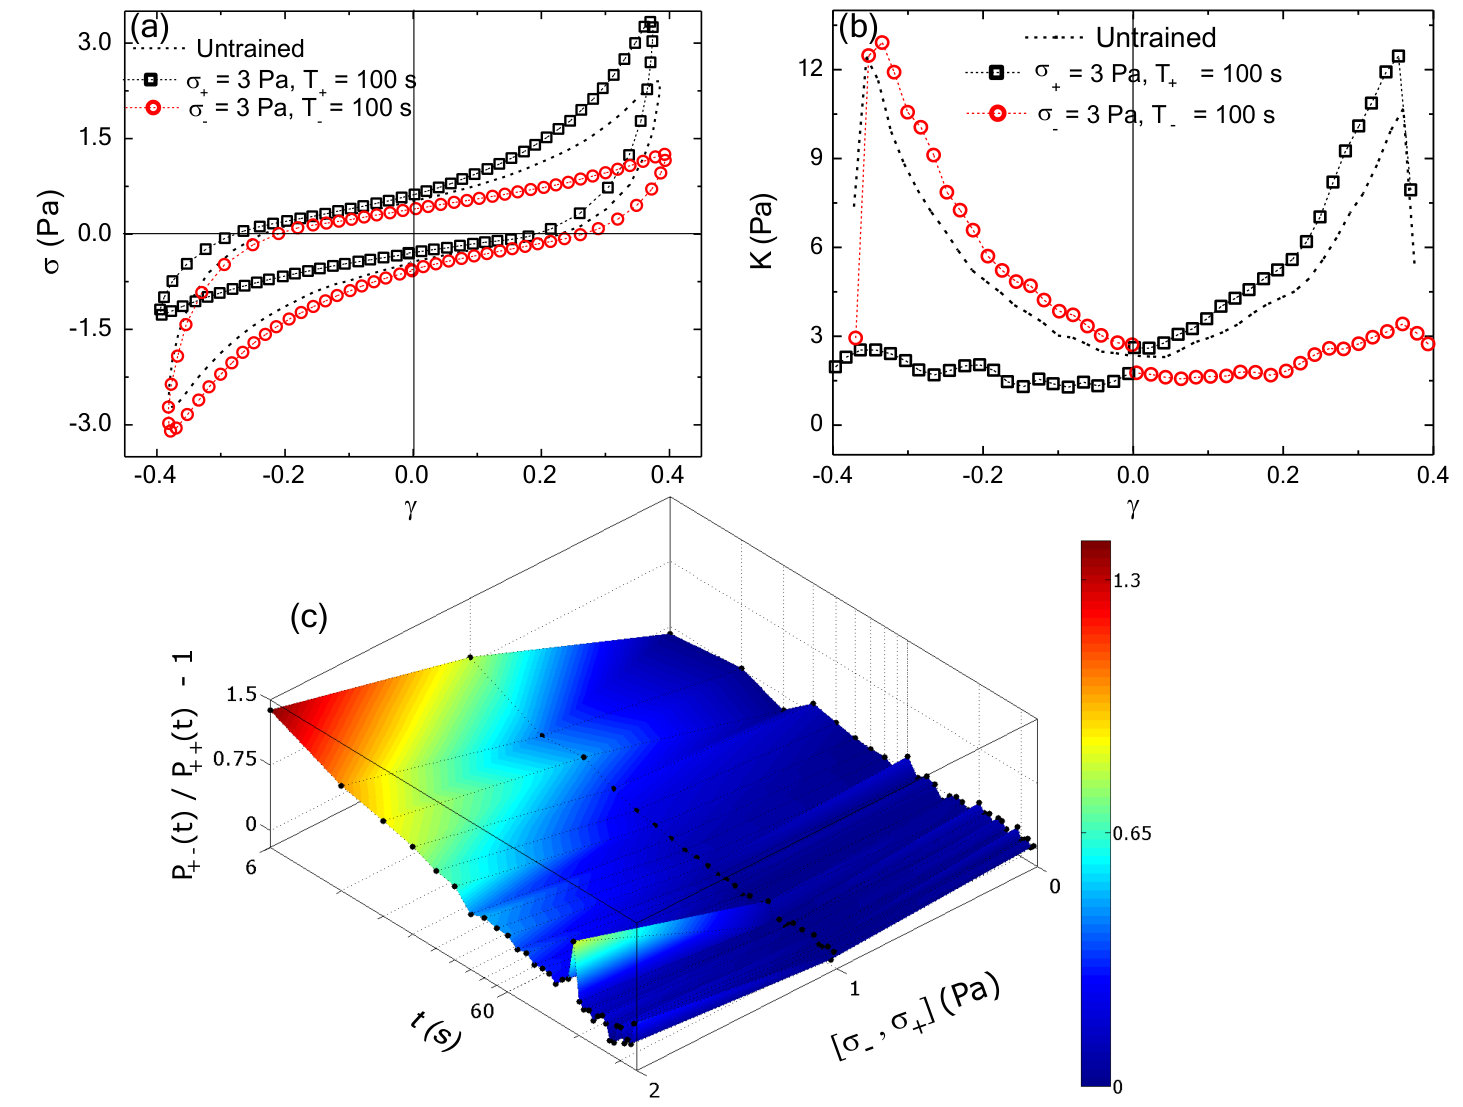 Figure 8
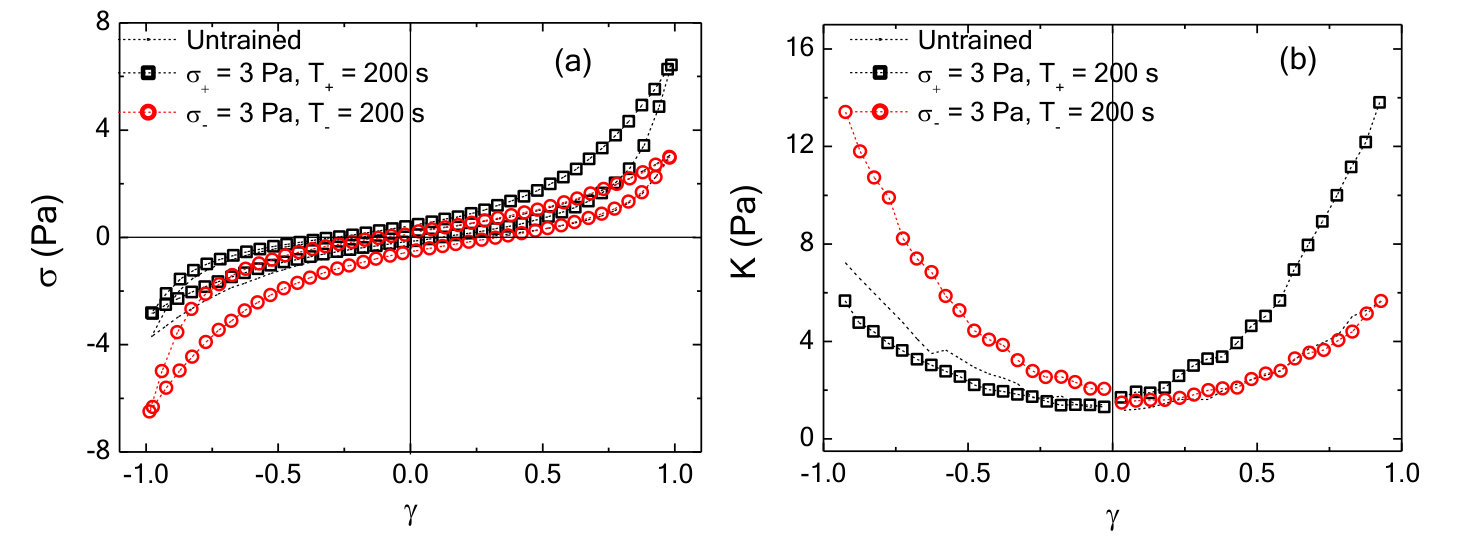 Figure 9
| Parameters | Symbol | magnitude | Ref. |
| (Geometrical) | |||
| F-actin length | 2 m | Viamontes et al., PRE, 2006 Viamontes et al. (2006) | |
| Average distance between cross-linking points | nm | ||
| Persitence length of filamin subunits | nm | Xu et al., Biophysical J., 2013 Xu et al. (2013) | |
| Nematic order | 0-1 | ||
| Finament density | 16 filaments / ( | ||
| (Mechanical) | |||
| F-actin bending mod. | 6.5 | Yanagida et al., Nature, 1984 | |
| F-actin 1d modulus | 17.1 nN | Kojima et al., PNAS, 1994 Kojima, Ishijima, and Yanagida (1994) | |
| F-actin Euler buckling force (L = 2 m) | 0.16 | Calculated using ‘L’ and ‘’ values |
Peer Reviews
No public reviews on file for this paper yet. If you reviewed it on a platform where reviews are public (OpenReview, ICLR, NeurIPS, ICML), you can paste yours below so the community can read it here.
Videos
No videos yet. Explain this paper in a talk, walkthrough, or lecture? Add one.
Taxonomy
TopicsCellular Mechanics and Interactions · Force Microscopy Techniques and Applications · Advanced Fluorescence Microscopy Techniques
Encoding Mechano-Memories in Actin Networks
Sayantan Majumdar
James Franck Institute, The University of Chicago, Chicago, Illinois 60637, USA.
Louis C. Foucard
Department of Chemistry & Biochemistry, UCLA, Los Angeles, USA
Alex J. Levine
Department of Chemistry & Biochemistry, UCLA, Los Angeles, USA
Department of Physics & Astronomy UCLA, Los Angeles, USA
Department of Biomathematics UCLA, Los Angeles, USA
Margaret L. Gardel
James Franck Institute, The University of Chicago, Chicago, Illinois 60637, USA.
Abstract
Understanding the response of complex materials to external force is central to fields ranging from materials science to biology. Here, we describe a novel type of mechanical adaptation in cross-linked networks of F-actin, a ubuiquitous protein found in eukaryotic cells. We show that shear stress changes its nonlinear mechanical response even long after that stress is removed. The duration, magnitude and direction of forcing history all impact changes in mechanical response. The ‘memory’ of the forcing history is long-lived, but can be erased by force application in the opposite direction. We further show that the observed mechanical adaptation is consistent with stress-dependent changes in the nematic order of the constituent filaments. Thus, this mechano-memory is a type of nonlinear hysteretic response in which an applied, “training” strain modifies the nonlinear elasticity. This demonstrates that F-actin networks can encode analog read-write mechano-memories, which can be used for adaptation to mechanical stimuli.
pacs:
Biological cells sense mechanical stimuli and use these cues to control their physiology Sperelakis (2012). Elucidating such mechanosensory mechanisms in living matter has implications for both cell biology and smart materials design Cui et al. (2015). While molecular-scale mechanotransduction mechanisms are well appreciated Iskratsch, Wolfenson, and Sheetz (2014); Wang, Butler, and Ingber (1993), how these are integrated to control mechanical response at cellular length scales is not well understood. Networks of the semi-flexible biopolymer actin are essential determinants of the mechanical behaviors of eukaryotic cells Blanchoin et al. (2014). Previous work has shown that the mechanical response of biopolymer networks can be regulated either transiently Gardel et al. (2004) or irreversibly Schmoller et al. (2010) by external force, necessitating mechanochemical feedbacks to enable long-lived and dynamic mechanical adaptation Bieling et al. (2016).
When actin is polymerized in the presence of cross-linking proteins, space-spanning networks are formed (Fig.1a). The mechanical response of actin networks is viscoelastic Tharmann, Claessens, and Bausch (2007); Müller et al. (2014); Foucard and Vernerey (2012) and highly nonlinear Storm et al. (2005). Typically, the strain stiffening of actin networks is reversible with no dependence on the history of applied stress Gardel et al. (2004). However, polymeric systems of both biological and synthetic origin can also demonstrate irreversible work hardening Schmoller et al. (2010) and other permanent rheological changes in response to applied stress Diani, Fayolle, and Gilormini (2009); Schmoller and Bausch (2013); Münster et al. (2013). The irreversibility of work hardening limits the potential for these materials to dynamically modify their mechanical properties or sense external force.
Here, we probe the rheology of a physiologically relevant network of actin filaments cross-linked with the protein filamin (FLN). FLN-crosslinked actin networks exhibit a dramatic strain stiffening Gardel et al. (2006); Kasza et al. (2007); Gardel et al. (2008). FLN cross-links are also highly dynamic, with an off rate of s*-1* Goldmann and Isenberg (1993) that results in a broad spectrum of stress relaxation Broedersz et al. (2010). We polymerize 24 M G-actin in the presence of 5% FLN within a parallel plate rheometer and probe the mechanical properties via a symmetric, triangular strain ‘read out’ (RO) pulse (Fig.1b). At low strain, a linear stress-strain relationship is observed but the stress increases nonlinearly at higher strains. The concavity in the stress-strain curve reflects the nonlinear strain stiffening; this behavior is symmetric for strains in the opposing direction due to the isotropic nature of the network (black triangles, Fig.1d). To explore how applied stress can alter this rheology, we apply a large constant stress in the positive direction ( = 4 Pa) for 250 s (Fig.1c). Upon removal of the stress, we wait for 50 s and read out the mechanical response by applying a RO pulse. Surprisingly, we observe a dramatic increase in the stress in the direction of the training with nominal reduction in stress in the opposite direction (Fig.1d, red squares); this indicates that the mechanical response is altered by the prior stress application. To explore the reversibility of this effect, we apply a constant stress of 4 Pa in the opposite direction () for 250 s. Remarkably, after the negative training pulse, an enhanced stiffening is observed at negative strains (Fig.1d, blue circles) and all evidence of the previous positive training pulse is erased. To underscore the reversibility of this training, we apply successive cycles of positive and negative training. In Fig.1e, the stress measured between each cycle is plotted as a function of strain over six training cycles. These data demonstrate the ability to form and erase mechanical memories with robust reversibility. Such ‘mechano-memory’ is a type of nonlinear hysteretic response in which applied ‘training’ strain modifies the nonlinear elastic response of the material to subsequent loading.
The nonlinear mechanical response can be characterized by plotting the differential shear modulus, , obtained by differentiating the Lissajous curves numerically along the increasing strain magnitude, as a function of strain . For an untrained sample, is symmetric around = 0 and shows stiffening observed at high strains in both the positive and negative direction (black triangles, Fig.2a). For positively or negatively trained samples, the symmetry in as a function of is clearly broken: is enhanced for 0 for a positively trained sample (red squares in Fig.2a), whereas, for a negatively trained sample the enhancement happens for 0 (blue circles in Fig.2a). The parameter , where and are the moduli measured at strain magnitude in the positive and negative directions, respectively, is used to quantify the strength of the memory formed (Methods). Due to the symmetry in the untrained sample, assignment of the direction of positive strain and stress is arbitrary. Once chosen, the sign convention is used consistently in all subsequent measurements for that sample.
To query whether the mechanomemory is long-lived, we vary the time (, Fig.1c) between removal of the training stress and the read out measurement. We find that, decreases weakly up to of nearly 1000 seconds (Fig.2b), indicating that the training pulses encode a semi-permanent memory into the network. To examine how the training parameters can be used to modify the strength of the mechanomemory, we vary the magnitude and duration of the training stress. The duration of training tunes , with monotonically increasing from 2 to 8 Pa as training time is increased from 10 to 400 s (Fig.2c). Likewise, the training stress magnitude also tunes (see Fig.S1). For a sample maximally trained in the negative direction ( = 5 Pa, = 250 s), -8 Pa. When a positive training pulse = 0.5 Pa is applied for = 100 s, increases to -5 Pa. When Pa, 0 (Fig.2d). After maximal training, it is possible to recover a mechanical response similar to an untrained sample with a suitable stress pulse in the opposing direction (Fig.S1).
To explore the effects of training stress, we study the time dependent changes in strain (i.e., creep) and recovery behavior. First, a training stress in the positive direction is applied for 300 s (Fig.3a). For a subsequent stress pulse in the same direction ( = 5 Pa, = 300 s), the resulting strain magnitude increases to 0.8. After the stress is removed, the residual strain at 300 s, or , is approximately 0 (Fig.3b). By contrast, when an identical stress pulse is applied in the direction opposite to the direction of training, the strain magnitude increases up to 1.2. After the stress is removed, = 0.4 (Fig.3b). This increased residual strain reflects a plastic-like shape deformation upon stress reversal.
The differences in the creep observed in response to different directions of applied stress indicate that the system is effectively more elastic in the training direction compared to the opposite direction. Another way to think about this is that there is more energy dissipated in a creep measurement that occurs after reversal of stress direction. We directly calculate the dissipated power from the creep measurements and observe an an enhanced dissipation when the the direction of stress is changed (Fig.S2). The area under the power dissipation curves for these two different loading directions gives an estimate of additional energy that gets dissipated in reorganizing the system. We observe an increase in energy dissipation as a function of applied stress (Fig.S2). Due to the noise in calculating energy dissipation directly from creep measurements, we use an alternate strategy (Methods) of superimposing a small, oscillatory stress during the creep measurement to probe power dissipation (Fig.3c). Using this alternate strategy, we also measure an enhanced dissipation when the system is loaded in the direction opposite to that of training direction (Fig.3d). We then calculate the dissipative power required to rewrite a memory of similar strength but different sign (i.e., from + to -) and normalize it by that dissipated in the absence of a new memory formation () (Methods). We find that the power dissipation increases dramatically for stresses 3 Pa and mostly contained within the first 100 s of stress application (Fig.3e). This underscores the stress- and time-dependent work done by the external mechanical stresses to dynamically alter the network mechanical response.
To elucidate the mechanism of mechanomemory, we compare the normalized differential modulus as a function of strain (Fig.4a) for networks trained ( = 4 Pa) for a duration of = 0 s (untrained, black circles), = 200 s (upside down triangles) and = 400 s (squares) with a simple two-dimensional finite-element simulation (lines). In the simulation 2 m long stiff filaments are cross linked by 100 nm long, flexible linkers to represent FLN (see Fig.S3). For the isotropic networks, the strain dependencies in the differential modulus arises primarily from non-linearities in the constitutive elements (e.g. cross-linkers and filaments) Marko and Siggia (1995).
Previous work has shown that small degree of filament alignment, or nematic order, leads to a dramatic change in the nonlinear elastic response Foucard et al. (2015); Missel et al. (2010). Specifically, when a network of rigidly cross linked semiflexible filaments is sheared so that the compression direction lies along the nematic director, softening is observed at strains of less than due to the buckling of the filaments under compression (Fig.4b, bottom schematic). When the same network is sheared in the opposite direction so that the same aligned filaments are now tensed, the system exhibits strain stiffening (Fig.4b, top schematic). These nonlinear elastic effects make the stiffness versus strain curve highly asymmetrical.
This collective nonlinearity, i.e. nonlinearity emerging from the interaction of many filament, is the dominant effect for small and moderate strains Foucard et al. (2015) (Fig.4a). At larger strains, the constitutive nonlinear stiffening of individual cross-linkers contributes as well Marko and Siggia (1995) (see Fig.S4). This leads to a strong strain stiffening of the network at larger values of , where the collective nonlinearity combines with the constitutive nonlinearity to produce additional asymmetric strain stiffening.
In order to compare our model to the experiment, we estimate the degree of nematic order produced by training. Here, we do not consider in the simulation the training and cross-linking dynamics. Rather, we rely on the observed post-training residual strain (Fig.3b, also see Fig.S5), which provides a direct measure of the change in the elastic reference state. Presuming an affine deformation, we then calculate the expected nematic order induced by filament reorientation by this shear (see Method). Using this simple, geometric model to infer the degree of nematic order , we numerically construct an equivalent semiflexible network for each observed and determine computationally.
The tangent modulus , normalized with respect to its value before training is shown for one untrained (black) network and two networks trained for 200s (blue) and 400s (red) as lines in Fig.4a. We find excellent agreement with the experimental data. We then plot as a function of residual strain (Fig.4d). The agreement between the observed and simulated mechanomemory development strongly suggests that the development of nematic order underlies the observed changes in elastic nonlinearities. Interestingly, we see evidence of such nematic order in the network under shear deformations (Fig.S6), which is qualitatively consistent with our model assumptions.
To further investigate the role of nematic order in the network and consequently the emergence of buckling in its nonlinear response, we build a mean field network model composed of linear elastic filaments with frozen nematic order , and incompliant cross-linkers. We account for filament buckling simply by neglecting the mechanical contribution from filaments under compressive loads exceeding their Euler criterion Timoshenko and Goodier (1986) (see Supplement). Figure 4d plots predicted by the mean-field model (dashed black line) agrees with both the simulation and experiment. Based on the mean field model, we suggest that proposed dependence of filament buckling on the degree nematic alignment in the gel serves as a minimal model of mechanomemory effects.
Our study demonstrates the reversible formation of mechanomemories in physiologically relevant cross-linked actin networks. Previous studies of strain-history dependence in the rheology of biopolymer networks observed irreversible effects attributed to permanent changes in network bundling Schmoller et al. (2010); Münster et al. (2013); Schmoller and Bausch (2013). Importantly, using the identical cyclic hardening protocol used in Schmoller et al. (2010), we do not observe work hardening (Fig.S7). This confirms the effect we describe here is distinct from irreversible work hardening observed in previous studies. Future work is needed to understand how training stress and duration as well as network composition can control the formation of either reversible or irreversible stress-dependent changes in the mechanical response.
The field-dependent hysteresis in mechanical response we describe is highly reminiscent of other hysteresis phenomena (e.g. magnetism). For instance, our data suggests that the stress-dependent changes in mechanical response arise from the formation of nonequilibrium, but long-lived domains of partial nematic order in the network that strongly modifies the nonlinear response of the network to strain. Care must be taken to distinguish such hysteresis from the ubiquitous rate-dependent hysteresis observed in viscoelastic materials. Our study demonstrates that that the stress-dependent changes in mechanical response can be understood solely in terms of the development of long-lived nematic order.
Previous work on nematic elastomers Pujolle-Robic and Noirez (2001); Kannan et al. (1993) and worm-like micelles Kadoma and van Egmond (1998) has demonstrated the importance of nematic order on mechanical response. Here, the ability to rewrite and erase memories comes from the fact that the lifetime of the nematic order is highly stress dependent. Networks of elastically nonlinear elements (e.g., filaments subject to softening under compression in response to buckling) that can structurally reorganize under load (develop nematic order) point to an avenue for the development of smart adaptive materials based on these cytoskeletal structures. There remain open questions regarding how mechanomemory depends on network density and composition. We have focused here on actin networks cross-linked with the flexible and dynamic cross-linker filamin. We observe qualitatively similar, but quantitatively distinct, behavior using the cross-linking protein -Actinin which is more rigid and shorter, but with similar binding kinetics (Fig.S8). This suggests that cross-linker properties may prove critical to controlling the details of the stress-dependent changes in nematic order. Moreover, understanding the role of network density and, specifically on the transition from non-affine to affine deformations Foucard et al. (2015); Head, Levine, and MacKintosh (2003); Wilhelm and Frey (2003) is also likely to be important. Exploring these properties in biopolymer networks will enable a more complete understanding of the control parameters to inform design of materials constructed from synthetic analogs.
Our study demonstrates the possibility to reversibly alter the mechanical response of network to enable one to write, read and erase mechanomemories. In fact, this system may have the potential to encode multiple memories Paulsen, Keim, and Nagel (2014) through the formation of multiple nematic domains with differing nematic directors, leading perhaps to new classes materials with a programmable and complex nonlinear elastic response. Finally, our results also suggest a mechanism of observed force adaptation in living cells and tissue Trepat et al. (2007).
Acknowledgements.
AJL gratefully acknowledges support for this work from NSF Grant No. CMMI-1300514. MLG acknowledges support from ARO MURI (W911NF-14-1-0403), NSF Grant MCB-1344203 and U. Chicago MRSEC (DMR-1420709). SM thanks U. Chicago MRSEC for support through a Kadanoff-Rice fellowship. We thank William S Klug, Eric Dufresne and Daniel Blair for very helpful discussions.
I References
Methods
Protein preparation
Monomeric actin (G-actin) was purified using protocol adapted from Ref.Spudich and Watt (1971) from rabbit skeletal muscle acetone powder (Pel Freeze Biologicals, Product code: 41008-3). Small aliquots of actin solution were drop frozen in liquid nitrogen, and stored at -80°C. For each experiment fresh aliquots of frozen actin were thawed and used. FLN was purified from chicken gizzard and aliquots were also stored at -80°C.
In-vitro network formation
10X actin polymerization-buffer (2 mM TrisHCl, 2 mM MgCl2, 100 mM KCl, 0.2 mM DTT, 0.2 mM CaCl2, 0.5 mM ATP, pH 7.5) was mixed with freshly thawed FLN. Freshly thawed G-actin was mixed with 1X Ca-G-buffer (2mM Tris-HCl, 0.2mM ATP, 0.5mM DDT, 1mM NaN2 and 0.1mM CaCl2, pH 8). 1X Ca-G-buffer containing G-actin and 10X actin polymerization buffer containing FLN were mixed gently for 10 s just before loading the sample to initiate the polymerization process of actin filaments in the rheometer sample chamber.
Bulk rheology
All rheological measurements were performed on a Bohlin Gemini HR Nano (Malvern Instruments) rheometer at a temperature of C, using a 40 mm diameter acrylic plate and 160 m gap. The acrylic plate has much lower moment of inertia compared to a similar metal plate and hence rheological measurements are more robust under fast direction switching of the plate rotation. We confirmed results were independent of plate geometry (Fig.S9). We also used a humidity chamber sealed with vacuum grease to reduce water evaporation from the sample during the rheology experiments and observed that the sample’s rheological properties were essentially unchanged for periods up to 4 hours after loading the sample in the rheometer. The mechanomemory effect described in this manuscript is a robust effect, observed 100% of the time in 35 independent samples.
After loading the sample, the build-up of linear elastic and viscous moduli was measured as a function of time at a fixed frequency = 0.5 Hz with a very small strain amplitude = 0.02 (ensuring linear response) to monitor the polymerization process indicated by the increase in magnitude of and with time. After approximately 1 hour, the moduli saturate indicating a fully polymerized starting state of cross-linked actin network. This state is the untrained state of the network. The tangent shear modulus is measured from the Lissajous plots (Fig.1d) by numerically calculating along the increasing strain magnitude under various training conditions. Memory is quantified by the asymmetry of tangent shear modulus in positive and negative direction at strain , i.e. - . The choice of this strain controls the absolute value of the strength of memory, but does not affect changes in memory due to training or our analysis. The biggest source of error in shear modulus (or ) comes from the noise due to differentiation of high resolution data (we get by differentiating the stress with respect to strain). Here, we first numerically fit a spline smoothing curve (averaged over 10 adjacent points). Then we take the difference of this smooth curve from the raw data. The standard deviation (SD) of such differences gives the error in . The error bars in are twice the standard deviations, since the uncertainty gets doubled when taking the difference.
To get the phase information, the complex tangent shear modulus was measured by superposing a small sinusoidal component of amplitude and angular frequency on a constant background stress with . Then we measured the amplitude of the sinusoidal strain at the same angular frequency and the phase difference between the sinusoidal stress and the strain. The magnitude of the tangent shear modulus is given by .
Under steady shear, gives the instantaneous injected power per unit volume. However, since the system is visco-elastic, some part of this injected energy is dissipated and some part is stored. When the training stress is switched off, the system can relax back partially using the stored energy. We can also get insight about the dissipation in the system by superposing a small amplitude sinusoidal component on top of the large D.C. stress component. By this method we can measure the phase difference between the applied sinusoidal stress and resulting sinusoidal strain. When we plot the sinusoidal strain vs sinusoidal stress over a complete cycle, we get a closed curve (Lissajous plot) that can be well approximated by an ellipse in our case. The area under the curve is proportional to the total dissipated energy over a complete cycle. Here, it should be clear that the dissipated energy will also depend on the amplitude and frequency of the applied sinusoidal signals. Thus, by this method we cannot estimate the absolute power dissipation. However, if we use the same amplitude and frequency of the input sinusoidal component, we can compare how the power dissipation occurs as a function of time during the creep behavior under D.C. stresses. The energy dissipated over a complete cycle is , leading to an average instantaneous power dissipation of . We define to be the average instantaneous power dissipation in the direction in a sample trained in the direction. Here and can assume only the values . Under steady shear, we calculate the injected power and subtract out the recoverable power at every instant to estimate the time dependent power dissipation (Fig.S2). However, to do this one has to assume that the injected power at the start up of creep response corresponds to the recoverable power at the start of recovery curve.
Confocal microscopy
20% molar ratio of labeled actin monomers (actin from rabbit skeletal muscle conjugated with Alexa fluorophore 568, Life Technologies Corp., product part no. A12374) was added to 80% G-actin and then the combination is mixed gently with 1X Ca-G-buffer. Ca-G-buffer con-taining both labeled and unlabeled G-actin and 10X actin polymerization buffer containing FLN were mixed gently for 10 s just before loading the sample into a home built glass chamber (thickness m) mounted on the sample stage of a laser scanning confocal micro-scope (Nikon) with a 60X water immersion objective. Z-stack images were recorded approximately after 1 hour of polymerization.
Model
We developed a mathematical model of the system as a two-dimensional network of semiflexible filaments with identical elastic properties and length . To construct the numerical network, each filament is placed at random in a box of area with an orientation picked from a distribution , where denotes the angle between the filament and the nematic director of the network.
Single filament and crosslink mechanics
Using classical Bernoulli-Euler beam theory, the mechanical properties of the filaments are characterized by the linear stretching and bending moduli, and respectively. The elastic length scale or bending length determines the relative contribution of the filament’s bending and stretching modes to the total energy. The thermal persistence length of the filaments is given by . The energy of a single filament can then be written as
[TABLE]
where we used an arclength parametrization of the filament with the position of the filament cross-section after deformation, and the rotation of the filament caused by that deformation.
We implement a mechanical model for the filamin cross links that is based on previous experimental measurements Xu et al. (2013). The filamin contour length is 100 nm, but is comprised of subunits of rest length 10 nm that unfold under force. Previous experimental results show that, during unfolding, the subunits follow a worm-like chain model Xu et al. (2013). In the simulation, the saw-tooth force-extension curve is reduced to two regimes, reflecting the regime of subsequent unfolding and the nonlinear stiffening observed during stretching of the last segment. This was adopted in order to reduce problems arising from numerical instability. For lengths below 150 nm, the 1d spring constant is . In the stiffening regime above , there is a linear increase in the spring constant of 10 pN/nm for further extension.
The geometry of the network is characterized by the scalar amplitude of the nematic order parameter , found from the width of the distribution :
[TABLE]
Our results are remarkably insensitive to the exact form of distribution of filament angles (Fig.S10).
We have been using the following distribution in our simulations:
[TABLE]
where the modified Bessel function of the first king of order 0. The parameter is tied to the nematic angle and is found numerically by solving .
Another geometric characteristic of the network is the mean distance between consecutive crosslinks along a given filament, , which is inversely proportional to the network density and depends on the nematic order parameter . This quantity is necessary to assess the propensity for buckling. Long spans between consecutive cross links buckle at a lower compressive stress than shorter ones. This quantity may be computed by considering a filament lying at an angle with respect to the nematic director. The probability of a second filament crossing at an angle with respect to the first is given by . In order to obtain the crossing probability independent of the relative angle , we need to integrate the above quantity over with a weight . Doing this gives:
[TABLE]
This quantity is simply the probability that a given filament oriented with angle to the nematic direction is crossed by a second filament with its direction chosen from the angular probability distribution and its position chosen randomly. We will again assume that our system contains a large number of filaments in a large area , so that is small; in this limit, the probability distribution for the number of crosslinks on a filament oriented with angle to the nematic direction can be approximated by the following Poisson distribution:
[TABLE]
where is the mean number of cross links on a filament oriented with angle , and is written:
[TABLE]
with the filament density. We then calculate the distance between the two most distance crosslinks on a filament and the average number of intervals between two crosslinks on a filament . These quantities are given by:
[TABLE]
Finally, the ratio of and yields the mean distance between crosslinks:
[TABLE]
where denotes the averaging operation over with weight .
Simulation details
We consider a system composed of semiflexible filaments connected together by cross links at points of intersection. The cross links are extensible nonlinear elastic elements as described above, but they supply no constraint torques, being free to rotate. The filaments are spatially discretized by placing nodes at each cross link, as well as at regular intervals between adjacent cross links, which ensures a sufficient level of spatial refinement for numerical convergence. Typically, networks are generated with filaments discretized into finite elements. The construction of each network is based on the two geometric parameters defined above: (a) the nematic order parameter and (b) the mean filament density . To build the network, we add filaments sequentially to the simulation box with typical dimensions of . We numerically evaluate the strain energy using the discretized version of equation (1):
[TABLE]
where and are respectively the current and original length of the segments, and is the average rest length of two adjacent segments forming an angle . The nematic order parameter is set by choosing the direction of the filaments from a Gaussian distribution with a width determined to give the desired nematic order parameter . The centers of the mass of the filaments remain uniformly distributed during the construction of all networks. We have explored the mechanics of networks constructed using other anisotropic orientational distributions of the filaments, and found only small changes in the collective mechanics of the networks when both the network density and nematic order parameter were held constant. See Fig.S10.
We use the Lees-Edward method Lees and Edwards (1972) to simulate the shearing deformation of the network with periodic boundary conditions, and the static equilibrium of the system is obtained by energy relaxation using a quasi-Newton minimization algorithm Byrd et al. (1994); Zhu et al. (1994).
From residual strain to nematic order
The residual strain measured after training implies a realignment of the filaments in the network. Assuming that the residual strain results from the affine deformation of a formerly isotropic network, we compute the nematic order parameter induced by training. Choosing an arbitrary filament from an isotropic 2D network of filaments (length ), we write its initial orientation as
[TABLE]
with the angle made by the filament with respect to the axis. We apply a simple shear along direction in the plane. Under this deformation the filament rotates make the angle with respect to the same axis, given by
[TABLE]
The new angle is thus
[TABLE]
Considering the ensemble of filament orientations given by the unit vectors in the isotropic network, we apply the mapping Eq. 19 to obtain the new (anisotropic) distribution of filament orientations after the shear deformation . From this distribution we directly compute the resulting nematic order parameter tensor by averaging over the initially isotropic distirbution of angles . Denoting this average by , we write the order parameter as:
[TABLE]
Finally, after diagonalization, we find the magnitude of the order parameter to be given by
[TABLE]
This provides an explicit expression for the nematic order as a function of the residual strain .
Mean field approach
We develop a mean field calculation of the shear modulus as a function of nematic order. We shear the network along the direction, where the nematic director makes an angle with respect to (Fig.M1b). We assume that filaments buckle only when under a compressive load larger than the Euler buckling load , which depends on the length of the filament segment between consecutive cross links and on the angle that that filament makes with the shearing direction. We further assume that one may neglect the (small) amount of elastic energy stored in filaments post-buckling.
Under these assumptions, a filament oriented making an angle with the -axis has an energy per unit length
[TABLE]
if not buckled. Based on the Euler buckling criterion, there is a wedge of width around the compression direction of the shear so that filament segments of length greater than oriented within this wedge will buckle. We wish to exclude such buckled filaments from the computation of the elastic energy stored in the network using Eq. 22. We replace this segment-length dependent quantity with an averaged excluded wedge angle, . This is determined self-consistently by setting the average filament segment length (averaged only over the wedge of half angle to be equal to the load-dependent critical length for Euler buckling . This results in a self-consistent integral equation to be solved for , and which depends on both the degree of nematic order and shear strain :
[TABLE]
where notes denotes the average over the wedge for a given degree of nematic order . This is solved numerically.
We then compute the total network energy by integrating Eq. 22 over the filament orientation and length Missel et al. (2010), excluding wedge of half angle surrounding the compression direction, oriented along = -45 degrees w.r.t. the shearing direction. The total energy of the network is
[TABLE]
Using the fact that for small shear, we write the tangent modulus as
[TABLE]
The mean-field value of computed using Eq. 25 is shown in Fig. 4d as a dashed black line. The mean-field model is consistent with both the simulation (red line and symbols) and the experiment (points).
The reference list from the paper itself. Each links out to its DOI / PubMed record.
- 1Sperelakis (2012) N. Sperelakis, Cell physiology source book: Essentials of membrane biophysics (Elsevier, 2012).
- 2Cui et al. (2015) J. Cui, D. Daniel, A. Grinthal, K. Lin, and J. Aizenberg, “Dynamic polymer systems with self-regulated secretion for the control of surface properties and material healing,” Nature materials 14 , 790–795 (2015).
- 3Iskratsch, Wolfenson, and Sheetz (2014) T. Iskratsch, H. Wolfenson, and M. P. Sheetz, “Appreciating force and shape, the rise of mechanotransduction in cell biology,” Nature Reviews Molecular Cell Biology (2014).
- 4Wang, Butler, and Ingber (1993) N. Wang, J. P. Butler, and D. E. Ingber, “Mechanotransduction across the cell surface and through the cytoskeleton,” Science 260 , 1124–1127 (1993).
- 5Blanchoin et al. (2014) L. Blanchoin, R. Boujemaa-Paterski, C. Sykes, and J. Plastino, “Actin dynamics, architecture, and mechanics in cell motility,” Physiological reviews 94 , 235–263 (2014).
- 6Gardel et al. (2004) M. Gardel, J. Shin, F. Mac Kintosh, L. Mahadevan, P. Matsudaira, and D. Weitz, “Elastic behavior of cross-linked and bundled actin networks,” Science 304 , 1301–1305 (2004).
- 7Schmoller et al. (2010) K. Schmoller, P. Fernandez, R. Arevalo, D. Blair, and A. Bausch, “Cyclic hardening in bundled actin networks,” Nature communications 1 , 134 (2010).
- 8Bieling et al. (2016) P. Bieling, J. Weichsel, R. Mc Gorty, P. Jreij, B. Huang, D. A. Fletcher, R. D. Mullins, et al. , “Force feedback controls motor activity and mechanical properties of self-assembling branched actin networks,” Cell 164 , 115–127 (2016).