Detecting stochastic inclusions in electrical impedance tomography
Andrea Barth, Bastian Harrach, Nuutti Hyv\"onen, Lauri Mustonen
TL;DR
This paper investigates detecting stochastic inclusions in electrical impedance tomography using the Factorization and Monotonicity Methods on mean Neumann-to-Dirichlet maps, demonstrating effectiveness with high-contrast anomalies through theoretical and numerical analysis.
Contribution
It extends existing methods to stochastic conductivities, showing that anomalies can be identified via mean maps under high contrast conditions.
Findings
Successful detection of stochastic inclusions using mean Neumann-to-Dirichlet maps.
Theoretical validation of methods for high-contrast anomalies.
Numerical examples in 2D confirm the approach's effectiveness.
Abstract
This work considers the inclusion detection problem of electrical impedance tomography with stochastic conductivities. It is shown that a conductivity anomaly with a random conductivity can be identified by applying the Factorization Method or the Monotonicity Method to the mean value of the corresponding Neumann-to-Dirichlet map provided that the anomaly has high enough contrast in the sense of expectation. The theoretical results are complemented by numerical examples in two spatial dimensions.
Click any figure to enlarge with its caption.
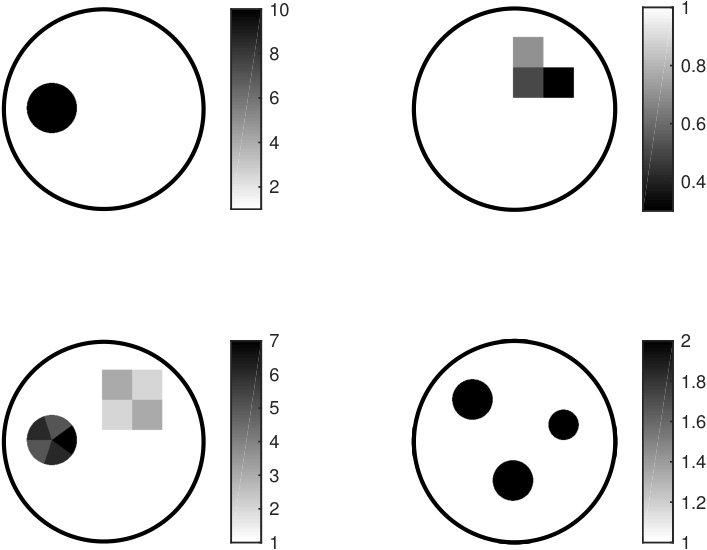 Figure 1
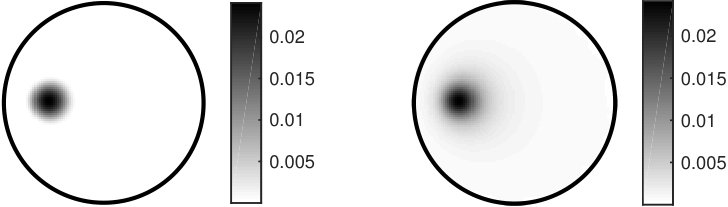 Figure 2
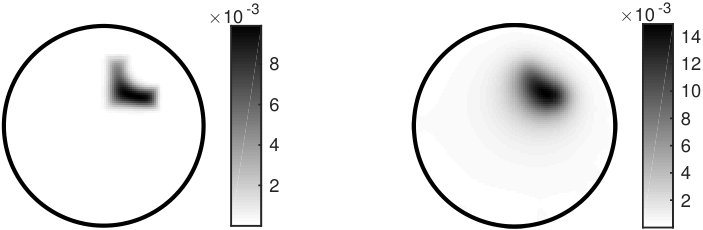 Figure 3
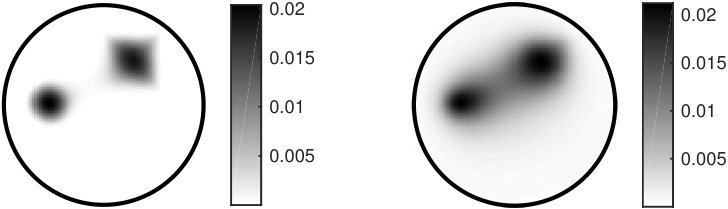 Figure 4
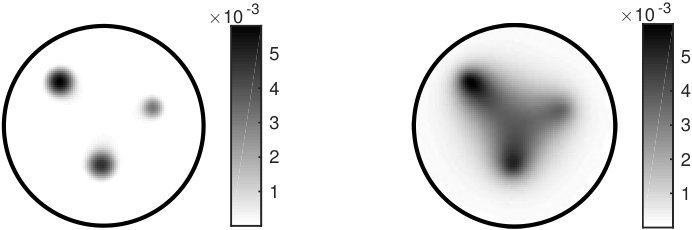 Figure 5
Peer Reviews
No public reviews on file for this paper yet. If you reviewed it on a platform where reviews are public (OpenReview, ICLR, NeurIPS, ICML), you can paste yours below so the community can read it here.
Videos
No videos yet. Explain this paper in a talk, walkthrough, or lecture? Add one.
Detecting stochastic inclusions in electrical impedance tomography
Andrea Barth222Department of Mathematics, University of Stuttgart, Stuttgart, Germany ([email protected]).
Bastian Harrach333Institute of Mathematics, Goethe University Frankfurt, Frankfurt, Germany ([email protected]). The work of BH was supported by the German Research Foundation (DFG) within the Cluster of Excellence in Simulation Technology (EXC 310/1) at the University of Stuttgart.
Nuutti Hyvönen444Aalto University, Department of Mathematics and Systems Analysis, P.O. Box 11100, FI-00076 Aalto, Finland ([email protected], [email protected]). The work of NH and LM was supported by the Academy of Finland (decision 267789).
and Lauri Mustonen44footnotemark: 4
Abstract
This work considers the inclusion detection problem of electrical impedance tomography with stochastic conductivities. It is shown that a conductivity anomaly with a random conductivity can be identified by applying the Factorization Method or the Monotonicity Method to the mean value of the corresponding Neumann-to-Dirichlet map provided that the anomaly has high enough contrast in the sense of expectation. The theoretical results are complemented by numerical examples in two spatial dimensions.
keywords:
Electrical impedance tomography, stochastic conductivity, inclusion detection, factorization method, monotonicity method
AMS:
Primary: 35R30, 35R60; Secondary: 35J25.
1 Introduction
Electrical impedance tomography (EIT) is an imaging modality for finding information about the internal conductivity of an examined physical body from boundary measurements of current and potential. The reconstruction task of EIT is nonlinear and highly illposed. EIT has potential applications in, e.g., medical imaging, geophysics, nondestructive testing of materials and monitoring of industrial processes. For general information on EIT, we refer to [1, 4, 5, 6, 11, 28, 41, 42, 51] and the references therein.
This work considers detection of stochastic inclusions by EIT. The conductivity inside the examined object is assumed to consist of a known deterministic background with embedded inclusions within which the conductivity is a random field. The inclusion shapes are deterministic. The available measurement is assumed to be the expected value of the corresponding Neumann-to-Dirichlet boundary operator, i.e., the expectation of the idealized current-to-voltage map. We demonstrate that the Factorization Method and the Monotonicity Method can be utilized to reconstruct the supports of the stochastic inhomogeneities essentially in the same way as in the deterministic case if the inhomogeneities exhibit high enough conductivity contrast in the sense of expectation. Detecting inclusions with random conductivities from expected boundary measurements can be regarded an interesting problem setting from a mere mathematical standpoint, but it also has potential applications: consider, e.g., temporally averaged boundary measurements corresponding to an inhomogeneity whose conductivity varies in time (e.g., a cancerous lesion subject to blood flow).
To the best of our knowledge, this is the first work that considers reconstructing properties of a random conductivity from the expectation of the boundary measurements. With that being said, it should be mentioned that for inverse scattering in the half-plane it has been shown that a single realization of the backscatter data at all frequencies uniquely defines the principal symbol of the covariance operator for a random scattering potential or a Robin parameter in the boundary condition [27, 38]. Moreover, time reversal related inverse scattering techniques have been used extensively for the detection of inclusions embedded in random media; see, e.g., [2, 3, 7] and the references therein.
The Factorization Method was originally introduced in the framework of inverse obstacle scattering by Kirsch [35], and it was subsequently carried over to EIT by Brühl and Hanke [8, 9]. The Factorization Method has attracted a considerable amount of attention in the scientific community over the past twenty years; in the context of EIT we refer the reader to [10, 13, 14, 15, 16, 17, 18, 20, 22, 24, 29, 31, 36, 40, 44, 45, 46] and the overview articles [19, 21, 37] for more information on the developments since the seminal article of Kirsch. The Monotonicity Method [25] is a more recent inclusion detection technique that can be considered natural for EIT as it takes explicitly advantage of the coercivity of the underlying conductivity equation. In particular, unlike the Factorization Method, a variant of the Monotonicity Method can handle indefinite inclusions, i.e., it stays functional even if some parts of the inhomogeneities are more and some other parts less conductive than the background. Monotonicity-based methods were first formulated and numerically tested by Tamburrino and Rubinacci [49, 50]. Their rigorous justification is given in [25] based on the theory of localized potentials [15].
For simplicity, we employ the idealized continuum model for EIT, that is, we unrealistically assume to be able to drive any square-integrable current density into the object of interest and to measure the resulting potential everywhere on the boundary. Consult [30] for analysis of the relationship between the continuum model and the complete electrode model, which is the most accurate model for real-world EIT measurements [12, 48]. Observe also that the Factorization Method has, in fact, been demonstrated to function also for realistic electrode measurements [10, 24, 40], and that the monotonicity method allows to characterize the achievable resolution in realistic measurement settings [26].
This text is organized as follows. In Section 2, we introduce the stochastic Neumann-to-Dirichlet boundary map corresponding to a random conductivity field and examine how the fundamental monotonicity results for the related quadratic forms are carried over from the deterministic case. Subsequently, Section 3 formulates and proves the theorems that demonstrate the functionality of the Factorization and Monotonicity Methods for detecting stochastic inclusions. The two-dimensional numerical examples for the Factorization Method are presented in Section 4; the stochastic measurement data are simulated by applying the stochastic finite element method (cf., e.g., [47]) to the conductivity equation with a random coefficient.
2 The setting and monotonicity results
In this section, we first review certain monotonicity properties of the deterministic Neumann-to-Dirichlet map associated with the conductivity equation. These inequalities are subsequently interpreted from the viewpoint of stochastic conductivities.
2.1 The deterministic Neumann-to-Dirichlet operator
Let , be a bounded domain with a smooth boundary and outer unit normal vector . The subset of -functions with positive essential infima is denoted by . Moreover, and are defined to be the subspaces of - and -functions, respectively, with vanishing integral means over , i.e.,
[TABLE]
In the context of EIT, describes the imaging subject. A deterministic conductivity inside the subject is modeled by a function
[TABLE]
such that . The deterministic nonlinear forward operator of EIT is defined by
[TABLE]
where
[TABLE]
and solves
[TABLE]
The bilinear form associated with is
[TABLE]
It is well-known that is continuous and for each , the linear operator is self-adjoint and compact.
A useful tool in studying is the following monotonicity result from Ikehata, Kang, Seo, and Sheen [33, 34]. It has frequently been used in deterministic inclusion detection, cf., e.g., [21, 22, 23, 25, 32, 36].
Lemma 1**.**
Let . Then, for all ,
[TABLE]
with solving (1).
Proof.
A short proof can be found, e.g., in [25, Lemma 3.1]. ∎
For two bounded self-adjoint operators we write
[TABLE]
if the inequality holds in the sense of quadratic forms, i.e., if
[TABLE]
With this convention, Lemma 1 yields that for all ,
[TABLE]
which is why we call Lemma 1 a monotonicity estimate.
2.2 The stochastic Neumann-to-Dirichlet operator
We model stochastic objects by treating the conductivity as a random field
[TABLE]
where is a probability space. By pointwise concatenation
[TABLE]
the Neumann-to-Dirichlet operator becomes random as well.
To be able to rigorously introduce moments (such as expectation or variance), we recall the definition of the Lebesgue–Bochner space :
Definition 2**.**
Given a Banach space , a function
[TABLE]
is called strongly measurable if it is measurable (with respect to and the Borel algebra on ) and essentially separably valued. The space , is the set of (equivalence classes with respect to almost everywhere equality of) strongly measurable functions satisfying
[TABLE]
For , is defined as the subset of those for which almost surely.
The following lemma shows that the expected value of the Neumann-to-Dirichlet operator is well defined if both the conductivity and its reciprocal, the resistivity , have well defined expectations.
Lemma 3**.**
Let .
Then and the following expectations are well defined:
[TABLE]
Furthermore, is self-adjoint and compact.
Proof.
The fact that and are well defined and belong to follows directly from the assumption . Furthermore, is measurable since it is a concatenation of a measurable and a continuous function. Since continuous images of separable sets are separable, the same argument shows that is also strongly measurable.
To show that has a finite expectation, we fix the constant deterministic conductivity , and employ the monotonicity lemma 1 and (2). It follows that for almost all ,
[TABLE]
Since , this implies that .
The self-adjointness and compactness of follow as in the deterministic case. ∎
Our stochastic framework covers an anomaly of deterministic size with a random conductivity value but not an anomaly with random size. We will demonstrate this in the following example.
Example 4**.**
We consider a domain with homogeneous unit background conductivity and an embedded anomaly.
- (a)
First assume that the anomaly consists of finitely many, mutually disjoint pixels, where the conductivity has a constant, uniformly distributed, stochastic value. To be more precise,
[TABLE]
*where is the characteristic function of the *th pixel and
[TABLE]
are mutually independent, uniformly distributed random variables. Hence, each has a probability density function given by . We then have, using the linearity of the expectation operator and the disjointness of the pixels
[TABLE] 2. (b)
Now assume that the domain is the unit disk that contains a circular anomaly with stochastic radius, say,
[TABLE]
where is uniformly distributed and is the characteristic function of a disk with radius centered at the origin. Then for such that , it holds that
[TABLE]
which shows that cannot be essentially separably valued.
By replacing in Lemma 1 by a random conductivity and taking expectations, we immediately obtain the following stochastic monotonicity estimate.
Corollary 5**.**
Consider a deterministic conductivity and a stochastic conductivity , i.e., and . Then, for all ,
[TABLE]
where solves (1). In particular, by choosing in turns and , it follows that
[TABLE]
3 Detecting stochastic inclusions
We consider a domain that has known deterministic background properties but contains an anomaly with random conductivity. For simplicity, we derive our results only for the case of a homogeneous unit background conductivity and assume that is an open set for which has a connected complement. Following the line of reasoning in [21, 25], it should be straightforward to generalize the results for (known and deterministic) piecewise analytic background conductivities and a more general subset . In the rest of this section, solves (1) for the considered background conductivity and a current density that should be clear from the context.
In the deterministic case, rigorous noniterative inclusion detection methods such as the Factorization Method or the Monotonicity Method are known to correctly recover the shape of an unknown anomaly whenever there exists such that the conductivity in the anomaly is either
[TABLE]
As noted above, here we consider a domain containing a stochastic anomaly , that is,
[TABLE]
where is a random field with . It is tempting to try to detect from the stochastic boundary measurements by applying the deterministic Factorization or Monotonicity Method to the expected value of the stochastic Neumann-to-Dirichlet boundary operator. We will show that these methods indeed correctly recover the anomaly if there exists such that, almost everywhere in , either
[TABLE]
Note that, by Jensen’s inequality, , meaning that (a) also implies that . Analogously, (b) implies that .
We start with the Factorization Method.
Theorem 6** (Factorization Method).**
Assume that there exists such that one of the two conditions in (5) is valid. Then for any nonvanishing dipole moment and every point , it holds that
[TABLE]
where , , is the unique solution of
[TABLE]
i.e., the potential created by a dipole at corresponding to the moment , the unit conductivity and vanishing current density on .
Proof.
In our current setting, the monotonicity result of Corollary 5 reads
[TABLE]
for all . In case (a), we have , and thus for all ,
[TABLE]
In case (b), we use to obtain
[TABLE]
for all . The assertion now follows from the previous two estimates by the same arguments as in the proof of the deterministic Factorization Method in [21, Theorem 5]. ∎
Then it is the turn of the Monotonicity Method.
Theorem 7** (Monotonicity Method).**
- (a)
For every constant such that almost everywhere on , and for every open ball ,
[TABLE] 2. (b)
For every such that almost everywhere on , and for every open ball ,
[TABLE]
Proof.
We prove the two cases separately.
- (a)
If , then , and we obtain from (3) and (4) that
[TABLE]
Now, let . We will show that . Since (3) proves that shrinking enlarges , we may assume without loss of generality that . Using the monotonicity result in Corollary 5, we obtain that
[TABLE]
for all . Using a localized potential with large energy on and small energy on (see [15, 25]), it follows that there exists satisfying
[TABLE]
so that . 2. (b)
If , then , and we obtain from (3) and (4) that
[TABLE]
Now, let . To show that , we can again assume without loss of generality that . Employing Corollary 5 with , we obtain this time around that
[TABLE]
for all . As in case (a), we can use a localized potential with large energy on and small energy on to conclude that there exists satisfying
[TABLE]
so that .
This completes the proof. ∎
Theorem 7 provides an explicit characterization of the anomaly: If a suitable threshold value is available, one can test whether any given open ball is enclosed by (assuming infinite measurement/numerical precision). The following theorem is essential in the numerical implementation of the Monotonicity Method. It demonstrates that, as in the deterministic case, the monotonicity test can be performed using the linearized Neumann-to-Dirichlet map, which considerably reduces the computational cost as one does not need to simulate a new nonlinear Neumann-to-Dirichlet operator for testing each new ball and threshold value. To get set, we define for a ball via its quadratic form
[TABLE]
where once again is the reference potential corresponding to the unit background conductivity and the current density .
Theorem 8** (Linearized Monotonicity Method).**
- (a)
If there exists such that almost everywhere on , then for every open ball and for every ,
[TABLE] 2. (b)
If there exists such that almost everywhere on , then for every open ball and for every ,
[TABLE]
Proof.
- (a)
For every and , it follows from [25, Theorem 4.3] that
[TABLE]
Hence, theorem 7 shows that
[TABLE]
The converse results from a similar combination of monotonicity and localized potentials arguments as above. 2. (b)
The claim follows as in part (a) by using [25, Remark 4.5].
∎
Remark 9**.**
In the next section we will numerically test the methods on the setting described in example 4(a) where the considered anomalies consist of a finite number of subregions, or pixels whose (constant) conductivity levels are mutually independent uniformly distributed random variables. However, it should be noted that our theoretic results hold for general conductivity distributions, as long as and (5) is fulfilled. In particular, this includes log-normal distributed conductivities.
4 Numerical examples
This section presents the numerical examples on the detection of stochastic inclusions from the mean of the Neumann-to-Dirichlet operator. We concentrate on the Factorization Method since it has thus far been more widely studied within the inverse problems community, making the comparison of our results to those achievable in the deterministic framework more straightforward. However, there is no reason to expect that the Monotonicity Method would perform any worse.
4.1 Simulation of data
Let us first discuss how the expectation of the Neumann-to-Dirichlet operator can be approximated for the numerical experiments that follow. The idea is to compute the expected boundary voltages separately for a (finite) number of boundary currents .
Once the distribution of the conductivity is given, the expectations can be obtained by Monte Carlo simulation, i.e., by sampling from the distribution and solving a deterministic problem (1) for each realization. Another approach, which we employ here, is known as the stochastic finite element method (SFEM). We briefly sketch the main idea of SFEM under the assumption that , which will be the case in all our examples considered below. The forward problem describing EIT with a stochastic conductivity is to find that solves
[TABLE]
-almost surely for a given current density , which is equivalent to the standard variational formulation
[TABLE]
-almost surely. This is in turn equivalent to the extended variational formulation of finding such that
[TABLE]
for all . The key idea of the stochastic finite element method is to approximate statistical properties, such as moments, of the solution to (6) by applying the Galerkin method to the extended variational formulation (7). Hence, we choose finite dimensional subspaces and and determine the function that solves (7) for all .
As we use a standard piecewise linear finite element space. In all our examples below, the probability space can be parametrized by a finite number of independent random variables , . Accordingly, we choose to be the space of all -variate polynomials with total degree less than or equal to ; the corresponding basis functions are chosen to be orthonormal, i.e., suitably scaled multivariate Legendre polynomials in our setting. Take note that the dimension of is
[TABLE]
For more general conductivities one can consider, e.g., truncated Karhunen–Loève expansions of the random conductivity field in question.
Both the Factorization and the Monotonicity Method require only the difference operator as the input. Instead of approximating as described above in order to calculate the expectation of and then subtracting the deterministic Neumann-to-Dirichlet map corresponding to the unit conductivity, a numerically more stable method is to directly compute the expectation . This can be done by considering the boundary value problem satisfied by the difference potential (cf., e.g., [16, Section 3])
[TABLE]
where is the solution to (1) with background conductivity .
Our numerical experiments are conducted in the unit disk , for which the most natural -normalized boundary currents are the Fourier basis functions
[TABLE]
for some and with denoting the angular coordinate. For these current densities, the gradient of the background solution can be presented in a closed form, which can be used explicitly on the right hand side of the variational formulation of (8). Using a stochastic finite element method as explained above, we solve (8) for all current patterns in (9), and then expand the expectation value of the correspondingly approximated difference boundary data in the basis (9) by using FFT. This results in an approximate representation of with respect to the Fourier basis (9).
The considered inclusion geometries are illustrated in Figure 1. In each case, the anomalies consist of a finite number of subregions, or pixels whose (constant) conductivity levels are mutually independent uniformly distributed random variables. Thus, the random conductivity can be written as
[TABLE]
where is the indicator function of the th pixel. The number of pixels varies between one and nine depending on the configuration.
In all numerical tests we use third order stochastic basis polynomials, i.e., we choose , and the deterministic FEM meshes are such that the dimension of is approximately . The resulting SFEM system matrices are very sparse [43]. The number of employed Fourier basis functions is in all tests.
In addition to considering the unperturbed simulated measurement matrix that contains only numerical errors, we also test the Factorization Method after adding noise to . More precisely, we generate a random matrix with uniformly distributed elements in the interval and replace by its noisy version
[TABLE]
where denotes the spectral norm. This is the same noise model as in [16] for the deterministic Factorization Method.
4.2 Factorization Method
Recall that Theorem 6 provides a binary test for deciding whether a point is inside the anomaly or not: Assuming that (5) holds for some , then for any ,
[TABLE]
To numerically implement this test, we follow [16]. The boundary potential belongs to if and only if it satisfies the so-called Picard criterion, which compares the decay of the scalar projections of on the eigenfunctions of the compact and self-adjoint operator to the decay of the corresponding eigenvalues. The leading idea is to write an approximate version of the Picard criterion by using the singular values and vectors of in place of the eigensystem of . We refer to [39] for a proof that this approach can be formulated as a regularization strategy.
Let us introduce a singular value decomposition for the discretized boundary operator , that is,
[TABLE]
with nonnegative singular values , which are sorted in decreasing order, and orthonormal bases . Denoting by the Fourier coefficients of , we introduce an indicator function
[TABLE]
where should be chosen so that is the first singular value below the expected measurement/numerical error. Note that the formation of is trivial because the functional form of is known explicitly when is the unit disk (cf., e.g., [9]). It is to be expected that takes larger values inside than outside the anomaly (cf., e.g., [16]), meaning that plotting should provide information on the whereabouts of . In our numerical tests, we plot the indicator function on an equidistant grid that is chosen independently of the finite element meshes used for solving the forward problems. The employed dipole moments are for and the indicator function used in reconstructions is actually the sum of the indicator functions corresponding to those three dipole moments. For all noiseless experiments, we use the maximal spectral cut-off index . (We remind the reader that the Factorization Method is not designed to produce information about the conductivity of the inhomogeneity. In other words, only the ‘support’ of the indicator function is relevant.)
Test 1. Our first and simplest test case considers one disk-shaped inclusion, as depicted in the top left image of Figure 1. We choose so that all realizations of the stochastic inclusion significantly differ from the unit background conductivity. In this case, , which obviously satisfies part (a) of (5). Figure 2 shows the indicator function for both noiseless and noisy () Neumann-to-Dirichlet data; according to a visual inspection, the support of the indicator function matches well with the inclusion in both cases. This is not a big surprise: All possible realizations of the random conductivity satisfy the requirements of the deterministic Factorization Method, and thus one would expect reconstructions that are comparable to those in the deterministic setting (cf., e.g., [16]).
Test 2. The second experiment considers the nonconvex inclusion in the top right image of Figure 1. The expected conductivity values of the three pixels constituting the anomaly are now strictly less than the unit background. More precisely, the pixelwise values vary according to , and ; see (10). Note that the condition (b) of (5) is satisfied, even though one of the three pixels can have either positive or negative contrast. The reconstructions produced by the Factorization Method are presented in Figure 3. Even without noise, the nonconvex edge of the inclusion is clearly smoothened, but otherwise the noiseless reconstruction is accurate. In the noisy case, the indicator function () contains practically no information on the nonconvexity of the inclusion, but the size and the location of the anomaly are still reproduced accurately.
Test 3. In the third example, we have two separate inclusions and altogether nine random variables as shown in the bottom left image of Figure 1. The conductivity intervals have width of six units for the pixels in the disk and width of three units for those in the square. All realizations of the discoidal inclusion are thus more conductive than the background, while the conductivity contrasts of some pixels in the square anomaly may be either positive or negative. The condition (a) of (5) is anyway satisfied: for the disk, and for the square. The reconstruction from noiseless data in Figure 4 accurately indicates the shapes and sizes of the two inclusions. With noisy data, the reconstruction () tends to produce one large inclusion instead of two smaller ones. The Factorization Method has been observed to exhibit similar bridging behavior also in the deterministic setting (see, e.g., [16]).
Test 4. Finally, we test the Factorization Method for three well separated disk-like inclusions, each characterized by a uniformly distributed conductivity in the interval ; see the bottom right image of Figure 1. Note that the condition (a) of (5) is satisfied as , although each realization of the anomaly can have positive, negative or indefinite contrast compared to the unit background. Once again, the noiseless reconstruction in Figure 5 is very accurate, but measurement noise deteriorates the representation of the inclusion boundaries in the plot of the indicator function ().
5 Concluding remarks
We have shown that an application of the Factorization Method or the Monotonicity Method to the mean value of the Neumann-to-Dirichlet boundary map characterizes stochastic anomalies, i.e., inclusions with random conductivities but fixed shapes, assuming that the contrast of the anomalies is high enough in the sense of expectation. This theoretical result was complemented by two-dimensional numerical examples demonstrating the functionality of the Factorization Method in this stochastic setting.
The reference list from the paper itself. Each links out to its DOI / PubMed record.
- 1[1] A. Adler, R. Gaburro, and W. Lionheart. Electrical impedance tomography. In Handbook of Mathematical Methods in Imaging , pages 599–654. Springer, 2011.
- 2[2] G. Bal and O. Pinaud. Time-reversal-based detection in random media. Inverse Problems , 21:1593–1619, 2005.
- 3[3] G. Bal and L. Ryzhik. Time reversal and refocusing in random media. SIAM J. Appl. Math. , 63:1475–1498, 2003.
- 4[4] R. Bayford. Bioimpedance tomography (electrical impedance tomography). Annu. Rev. Biomed. Eng. , 8:63–91, 2006.
- 5[5] L. Borcea. Electrical impedance tomography. Inverse problems , 18:R 99–R 136, 2002.
- 6[6] L. Borcea. Addendum to ‘Electrical impedance tomography’. Inverse Problems , 19(4):997–998, 2003.
- 7[7] L. Borcea, G. Papanicolaou, C. Tsogka, and J. Berryman. Imaging and time reversal in random media. Inverse Problems , 18:1247–1279, 2002.
- 8[8] M. Brühl. Explicit characterization of inclusions in electrical impedance tomography. SIAM Journal on Mathematical Analysis , 32:1327–1341, 2001.