Hierarchical Change Point Detection on Dynamic Networks
Yu Wang, Aniket Chakrabarti, David Sivakoff, Srinivasan Parthasarathy

TL;DR
This paper introduces a generic framework for change point detection in dynamic networks with community structures, capable of identifying local and global changes efficiently and accurately, with significant speed improvements.
Contribution
It presents a novel, flexible framework that unifies various change point detection algorithms for dynamic networks, distinguishing local and global changes effectively.
Findings
Accurately detects change points in synthetic and real networks.
Achieves up to 800X speedup over existing methods.
Effectively distinguishes between local and global network changes.
Abstract
This paper studies change point detection on networks with community structures. It proposes a framework that can detect both local and global changes in networks efficiently. Importantly, it can clearly distinguish the two types of changes. The framework design is generic and as such several state-of-the-art change point detection algorithms can fit in this design. Experiments on both synthetic and real-world networks show that this framework can accurately detect changes while achieving up to 800X speedup.
Click any figure to enlarge with its caption.
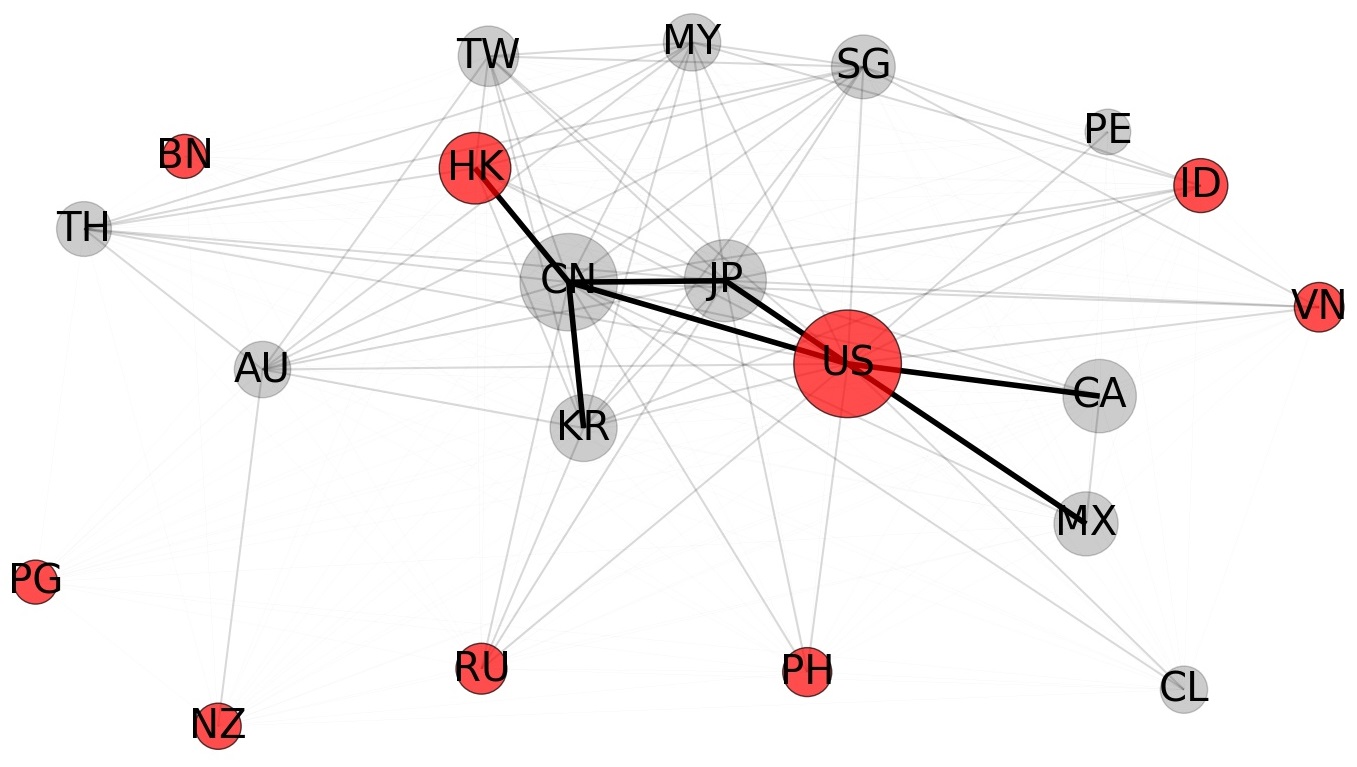 Figure 1
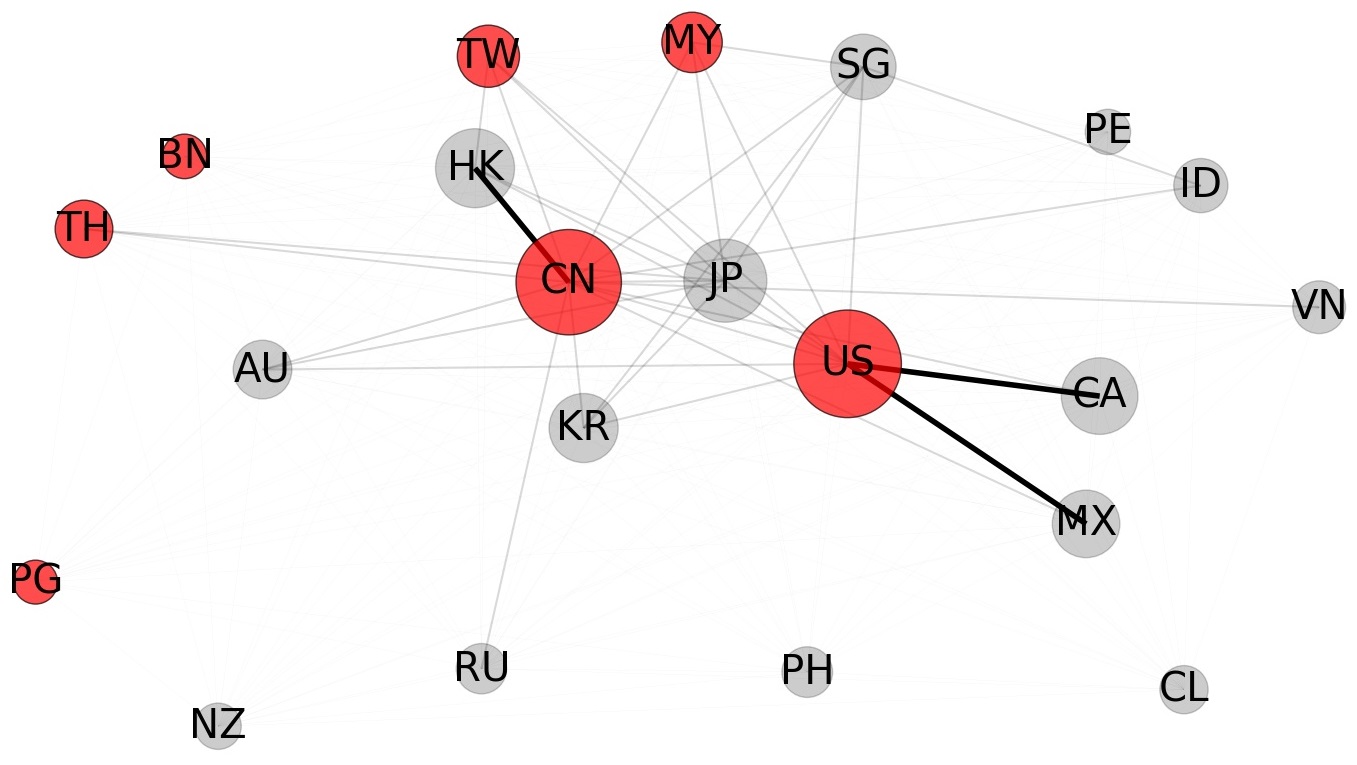 Figure 2
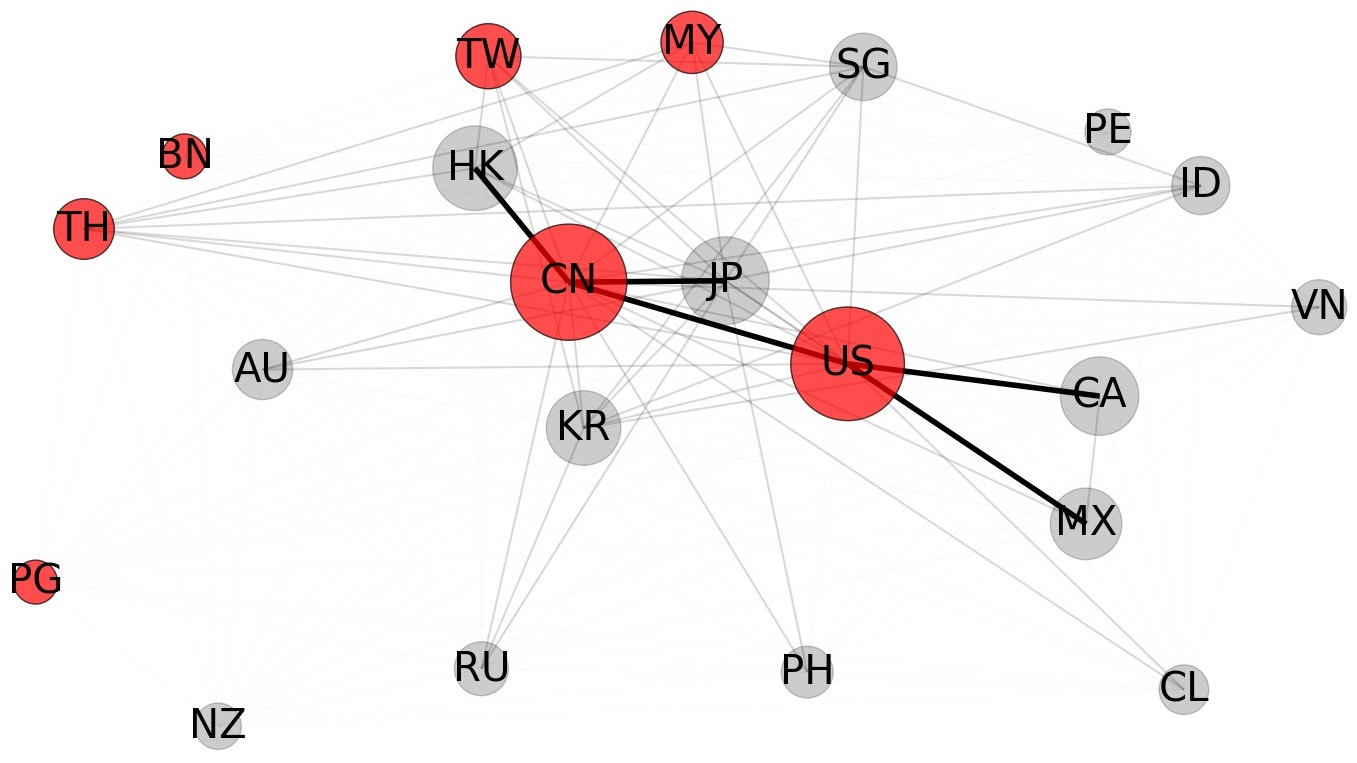 Figure 3
 Figure 4
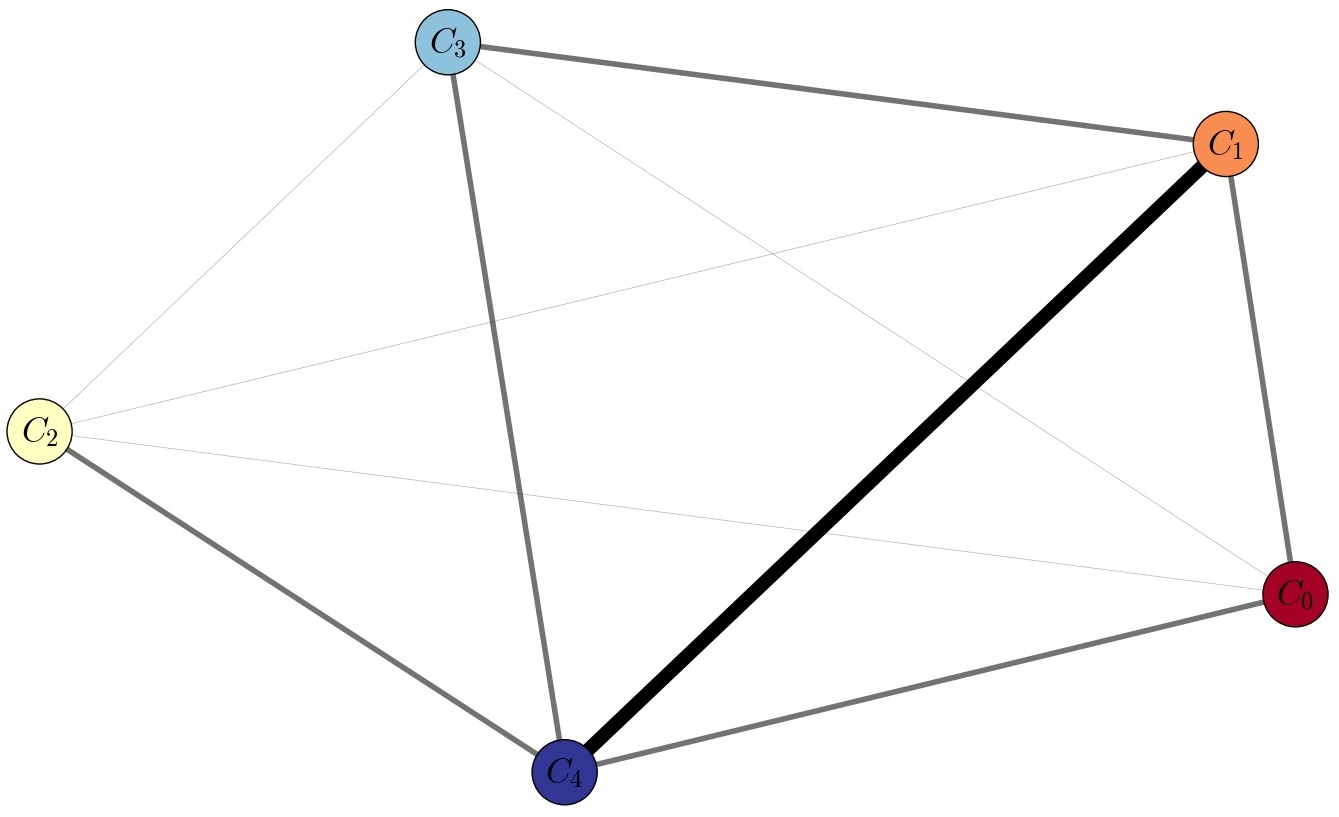 Figure 5
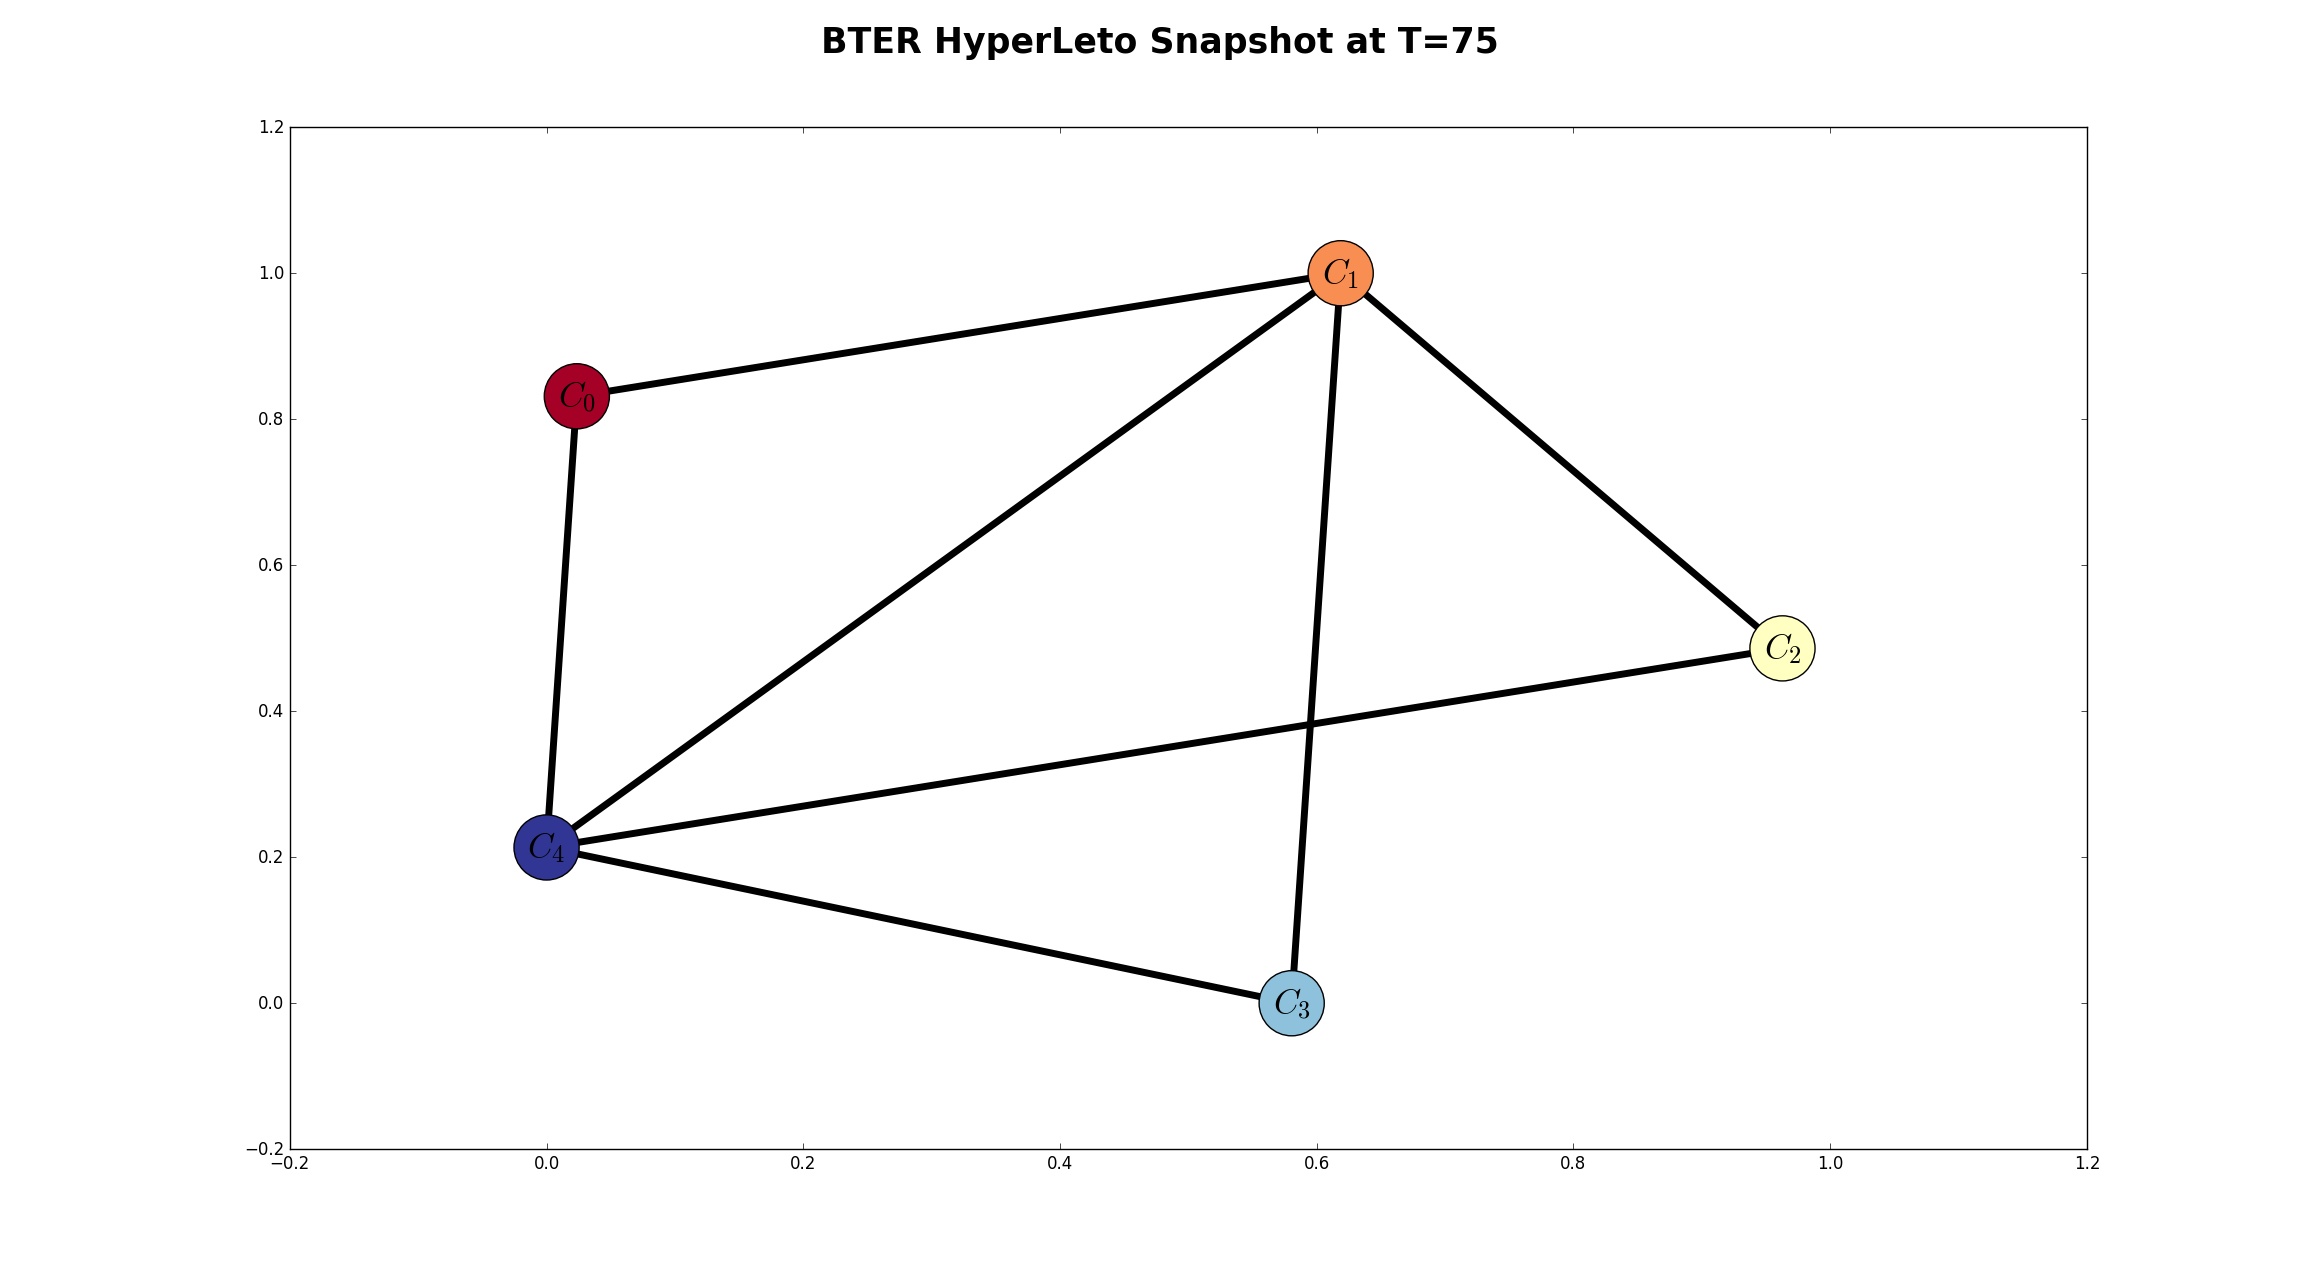 Figure 6
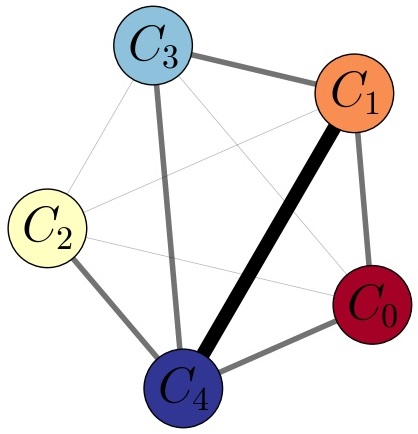 Figure 7
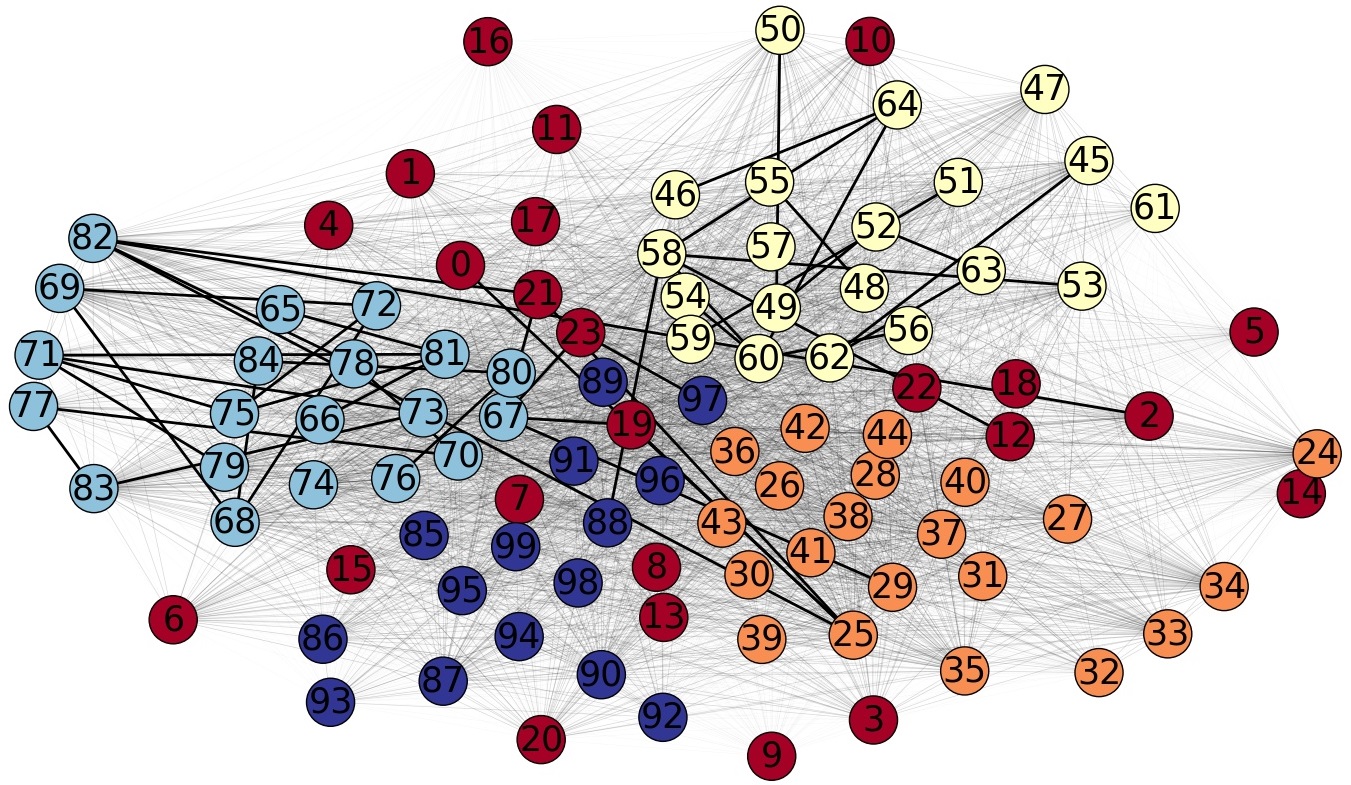 Figure 8
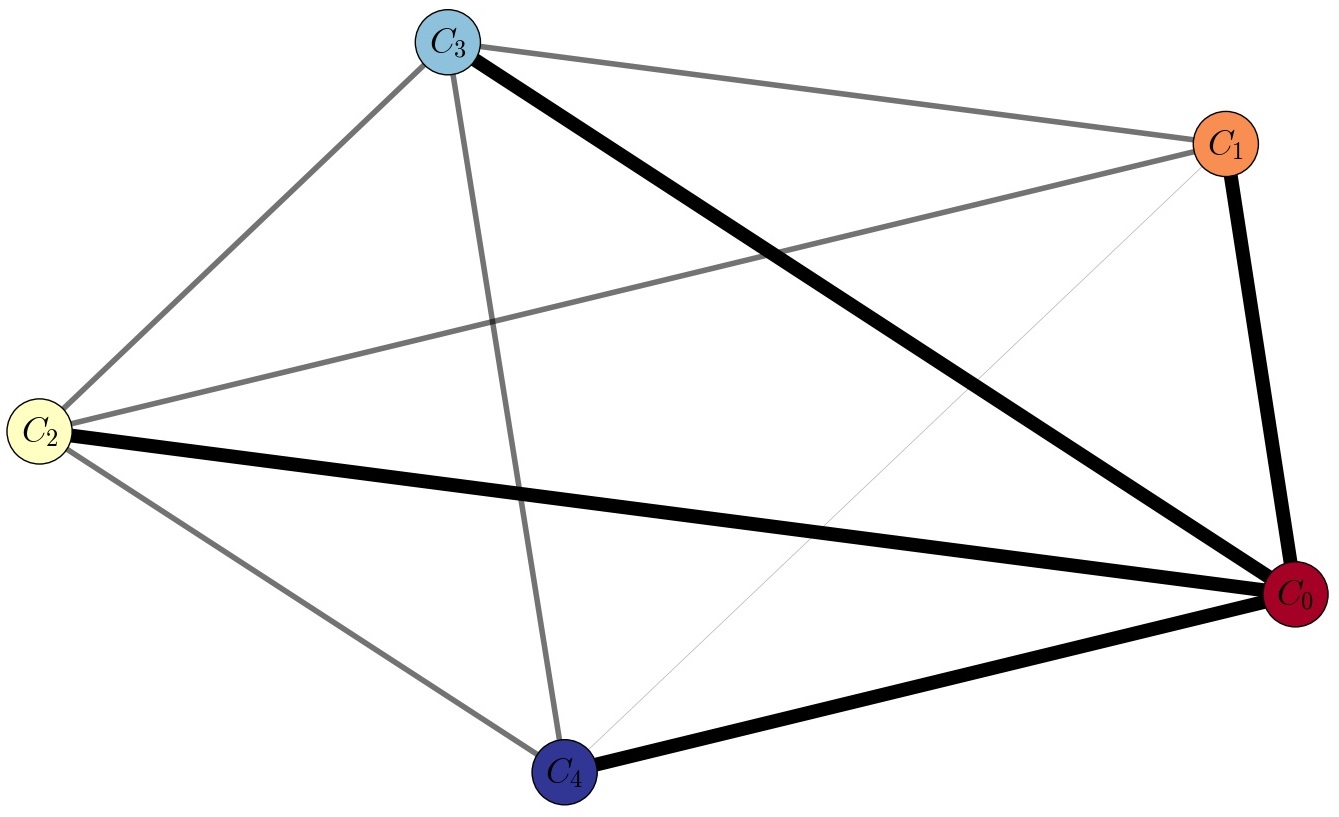 Figure 9
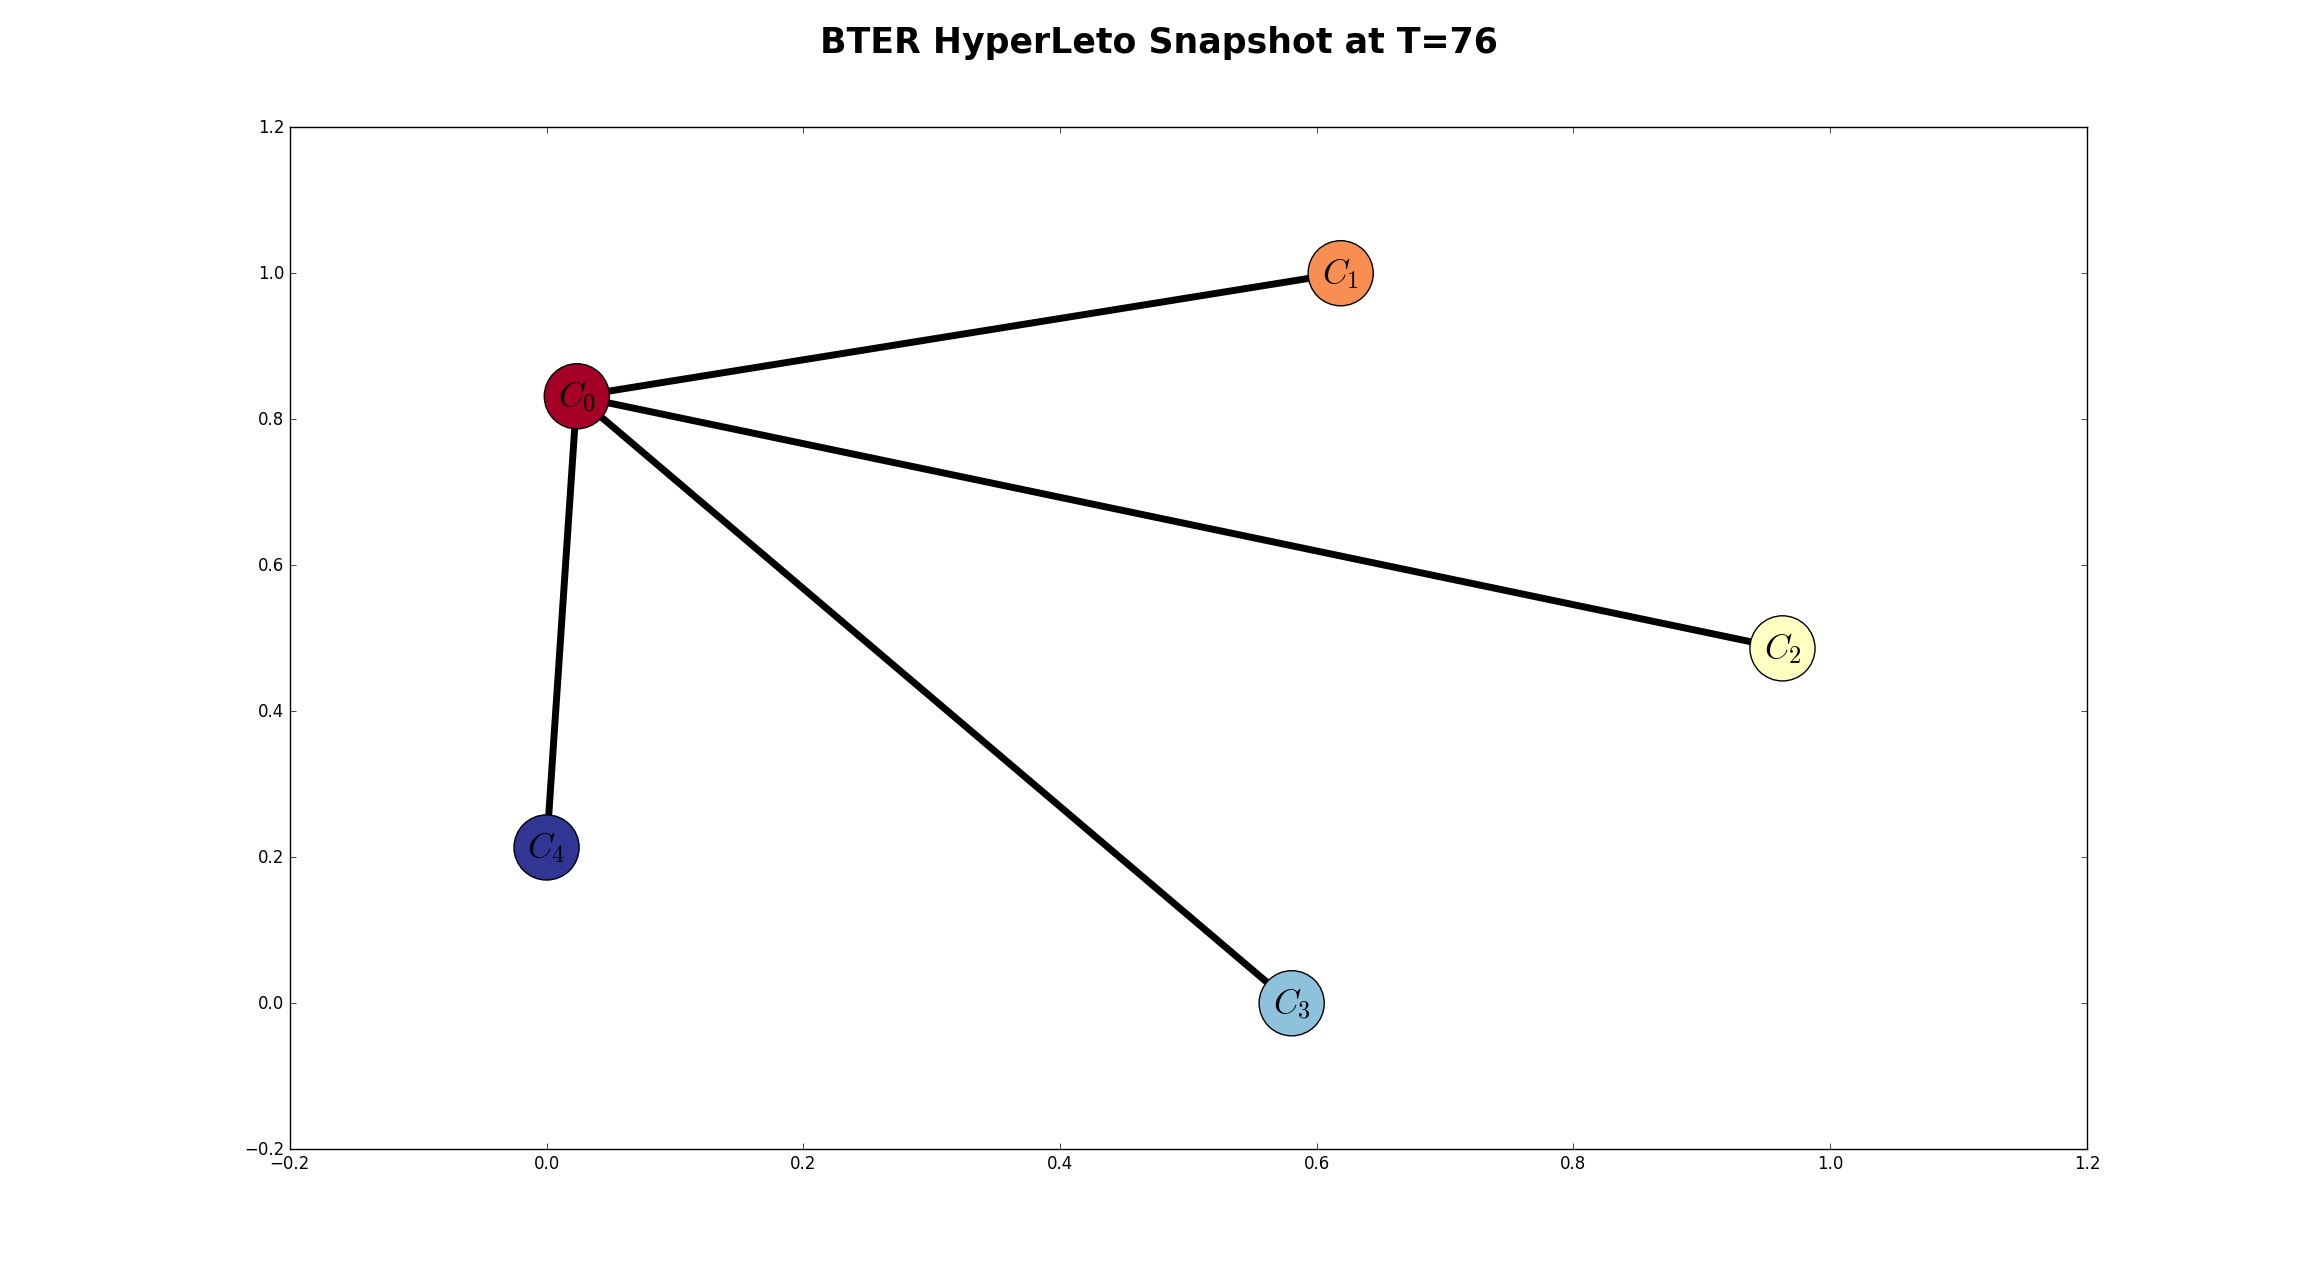 Figure 10
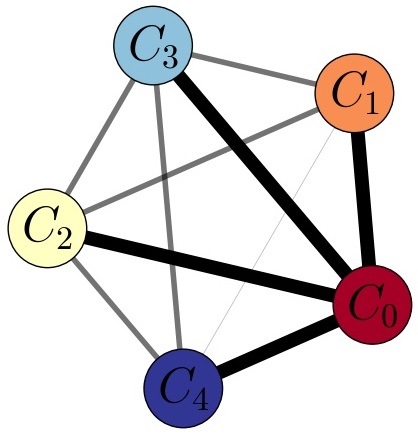 Figure 11
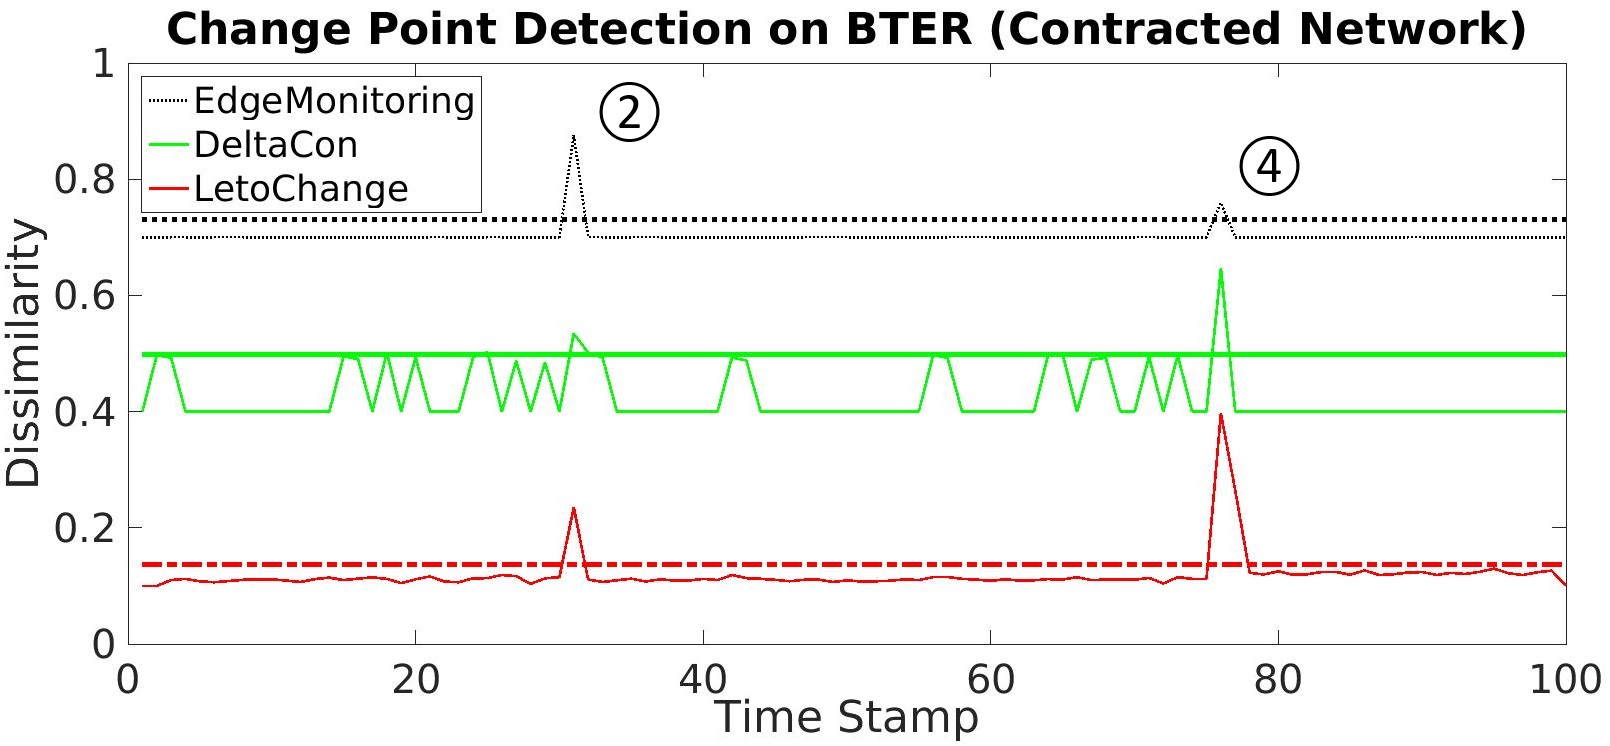 Figure 12
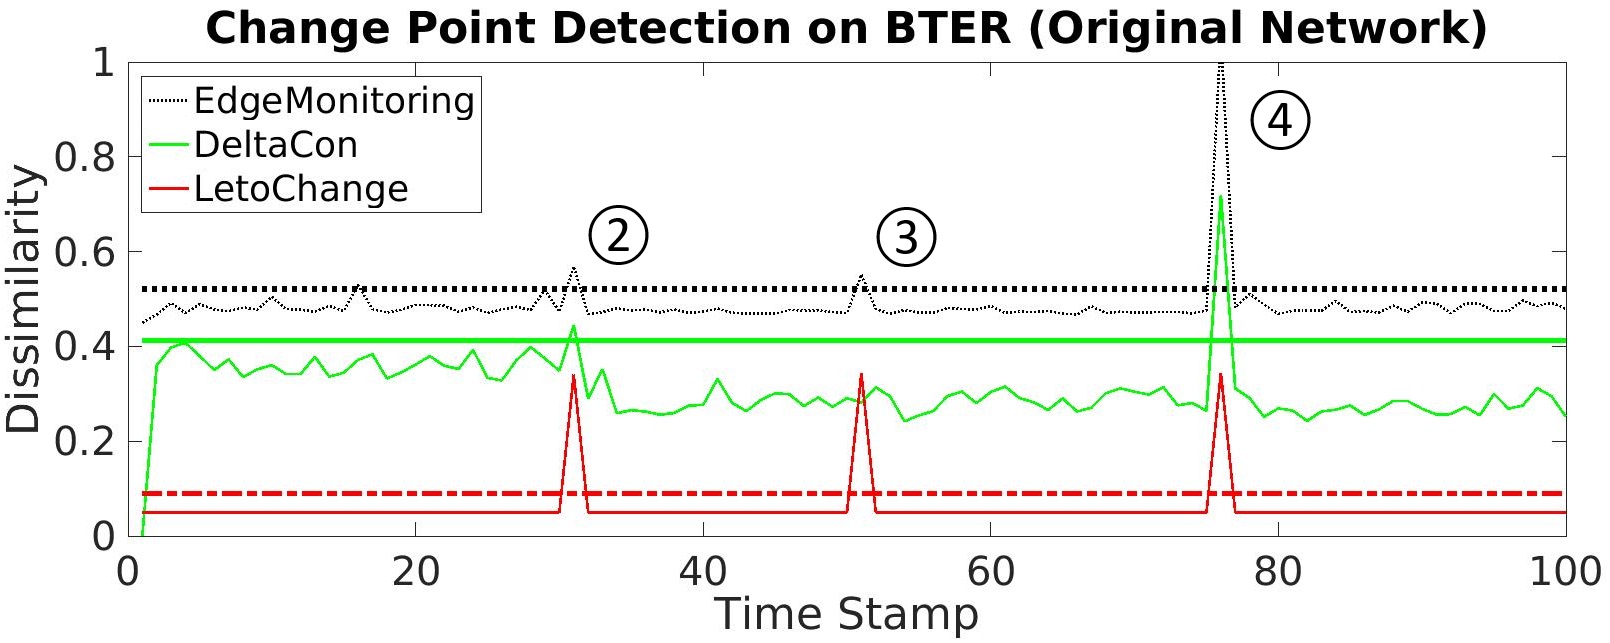 Figure 13
 Figure 14
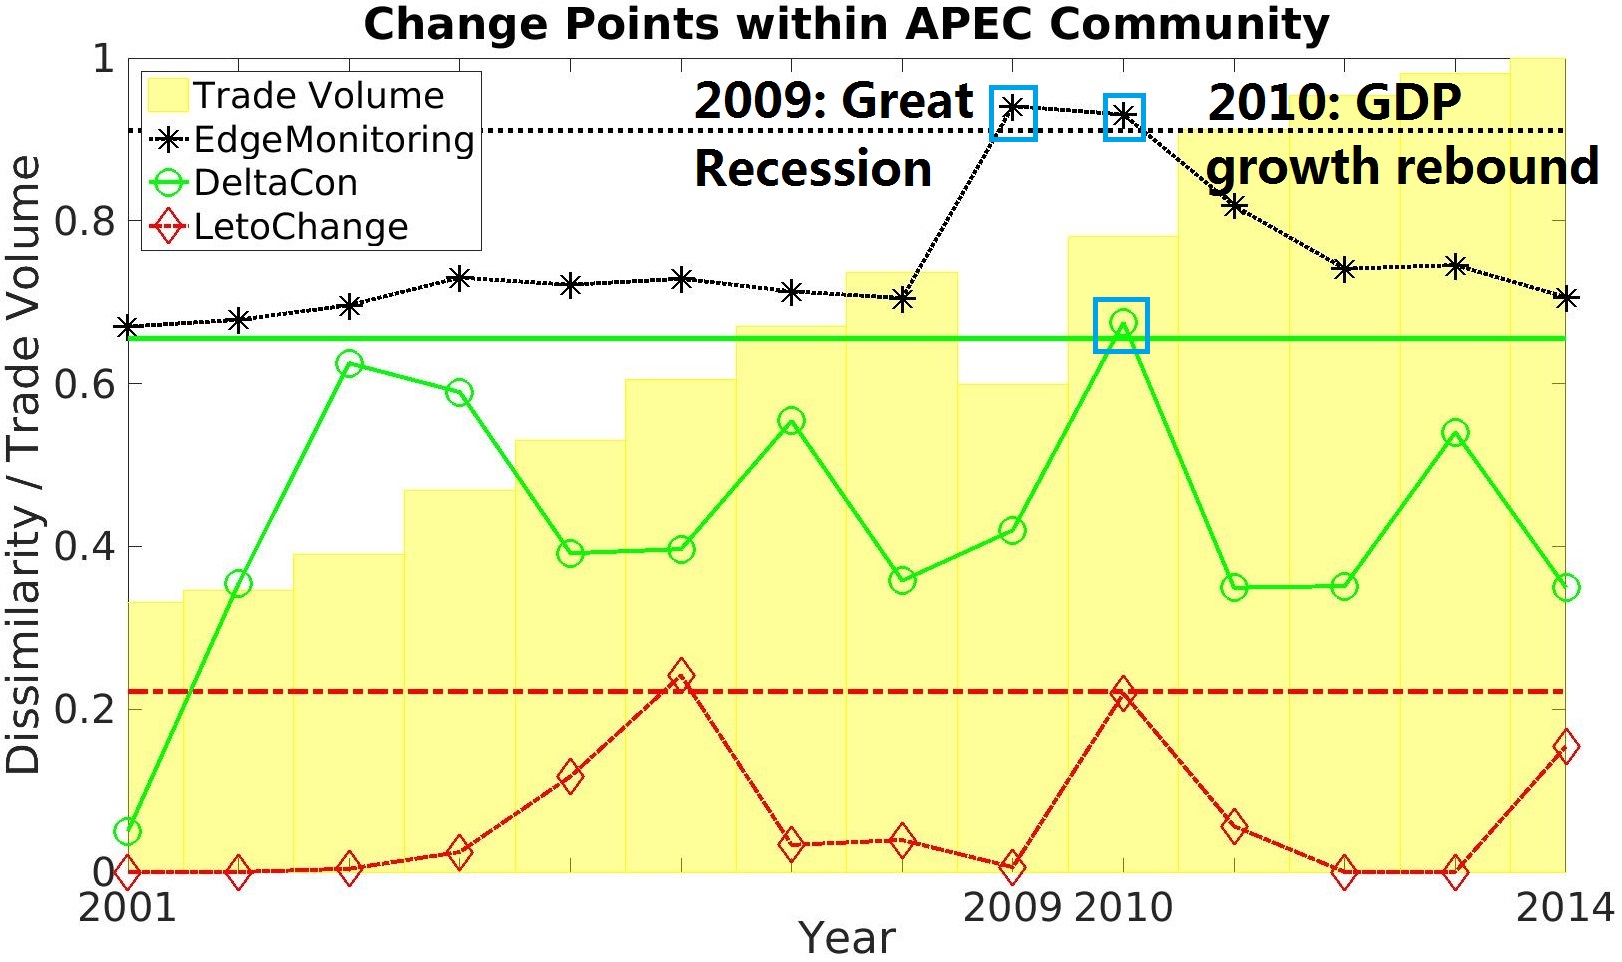 Figure 15
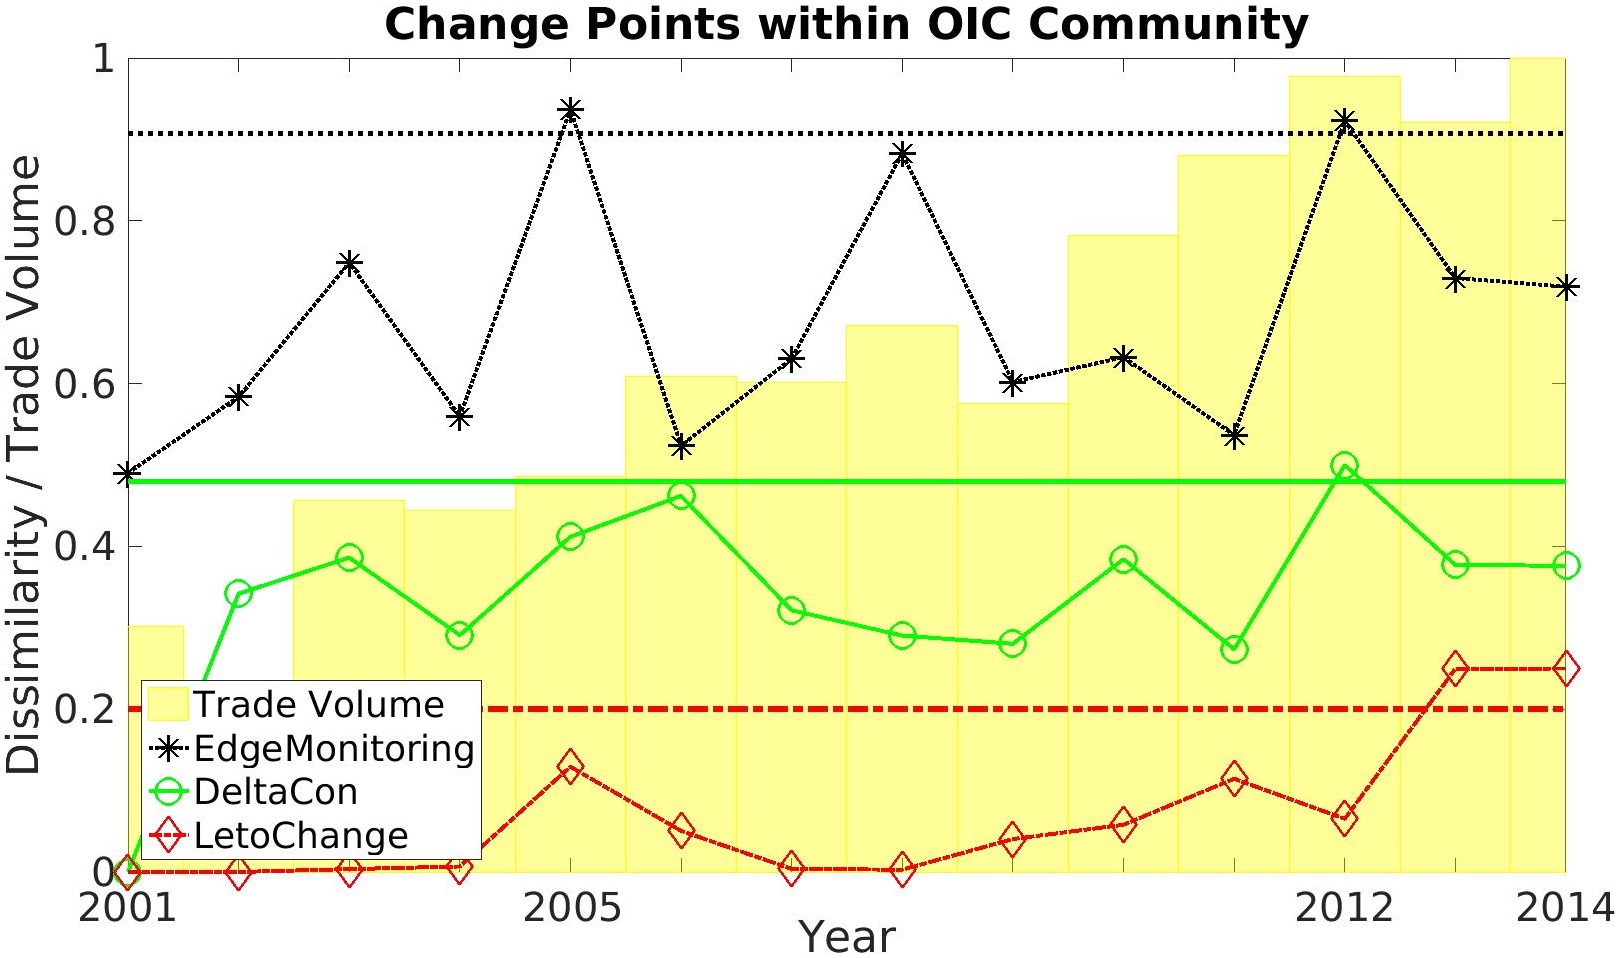 Figure 16
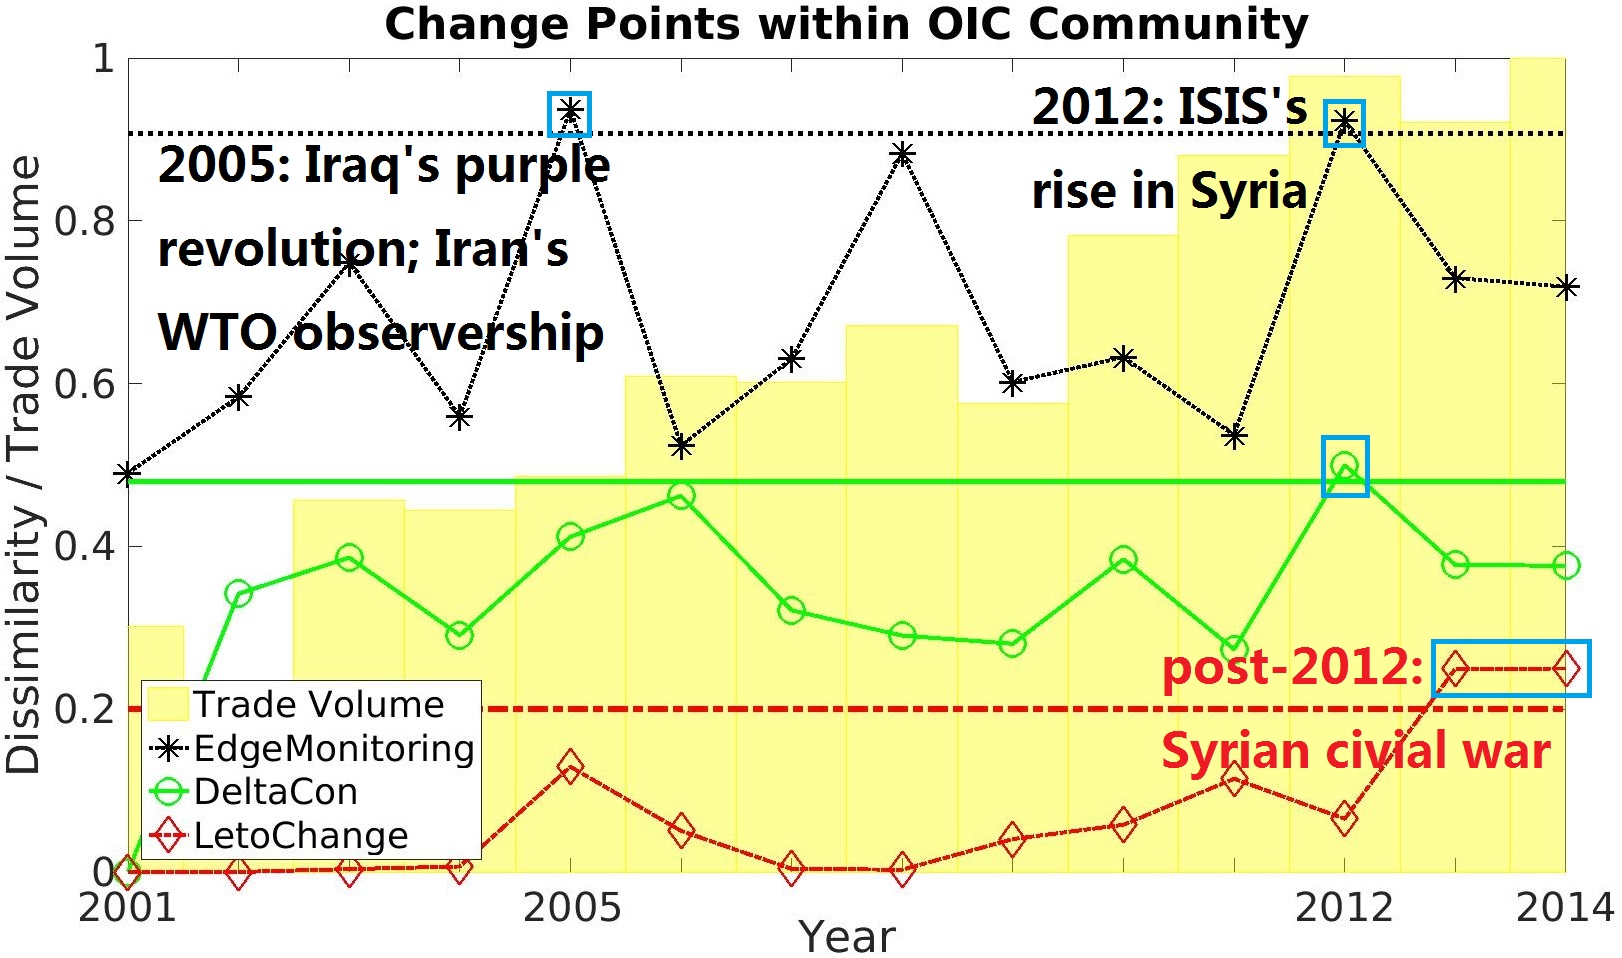 Figure 17
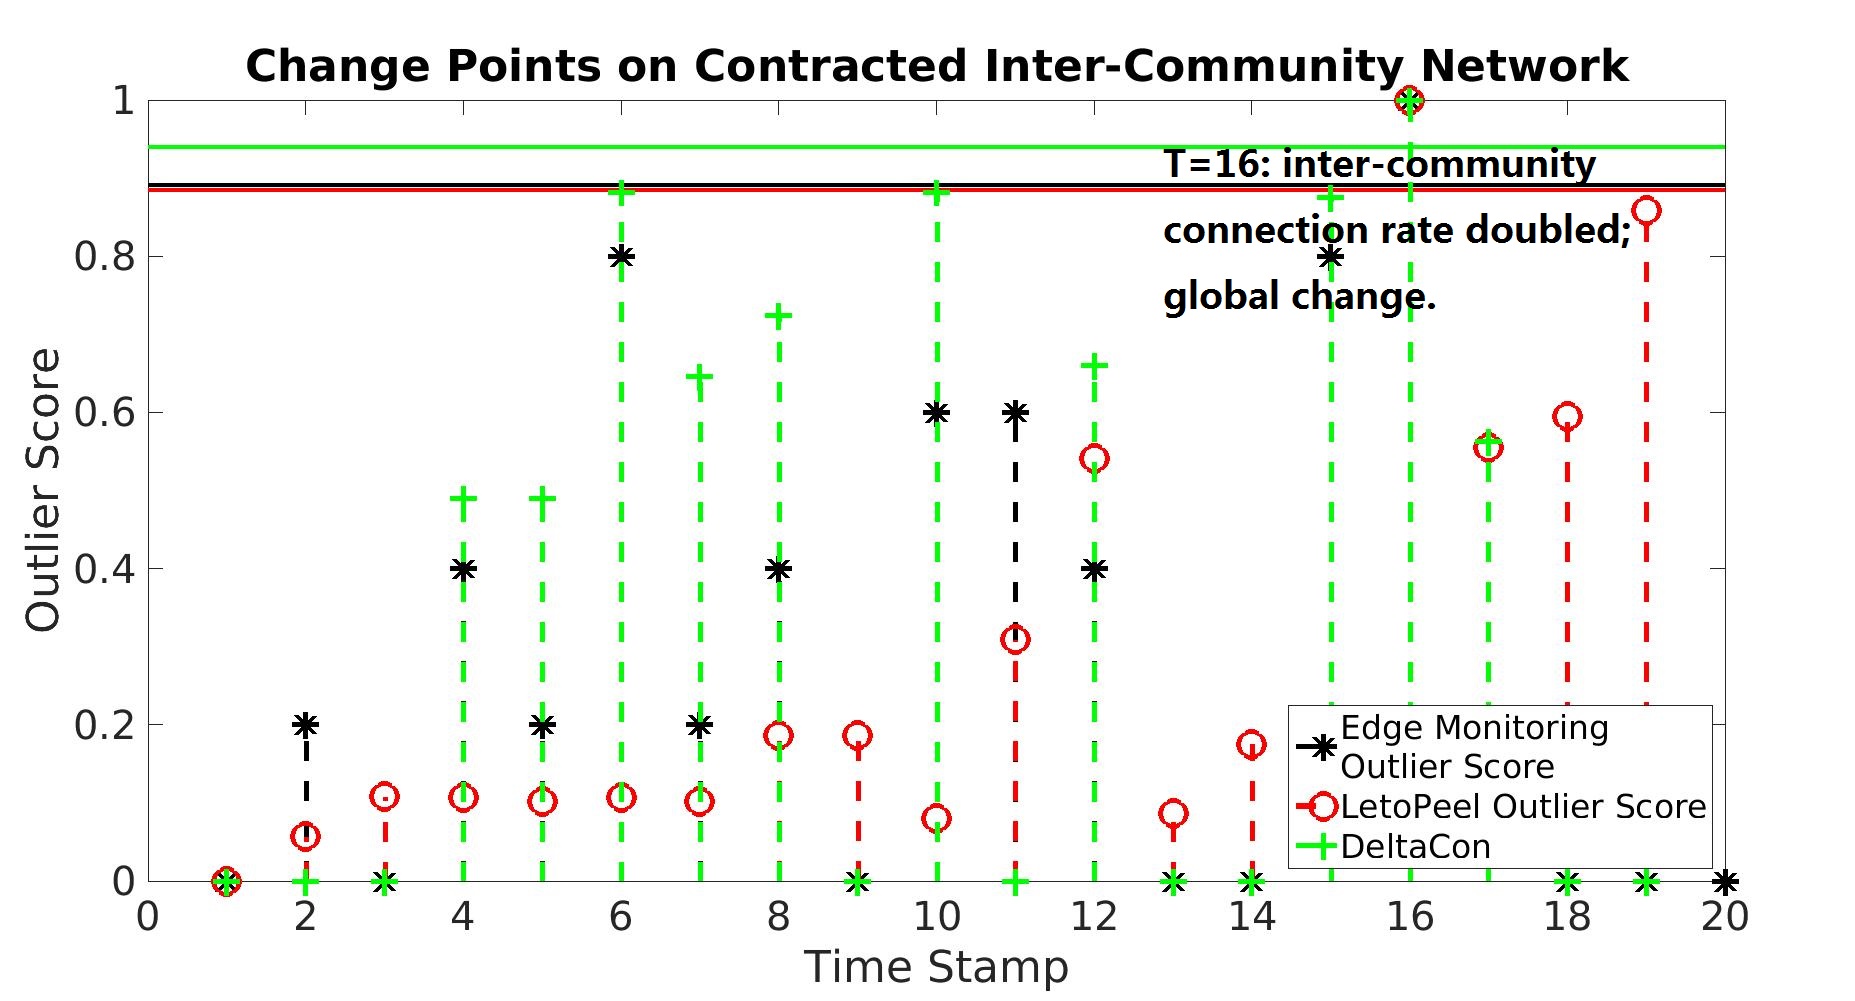 Figure 18
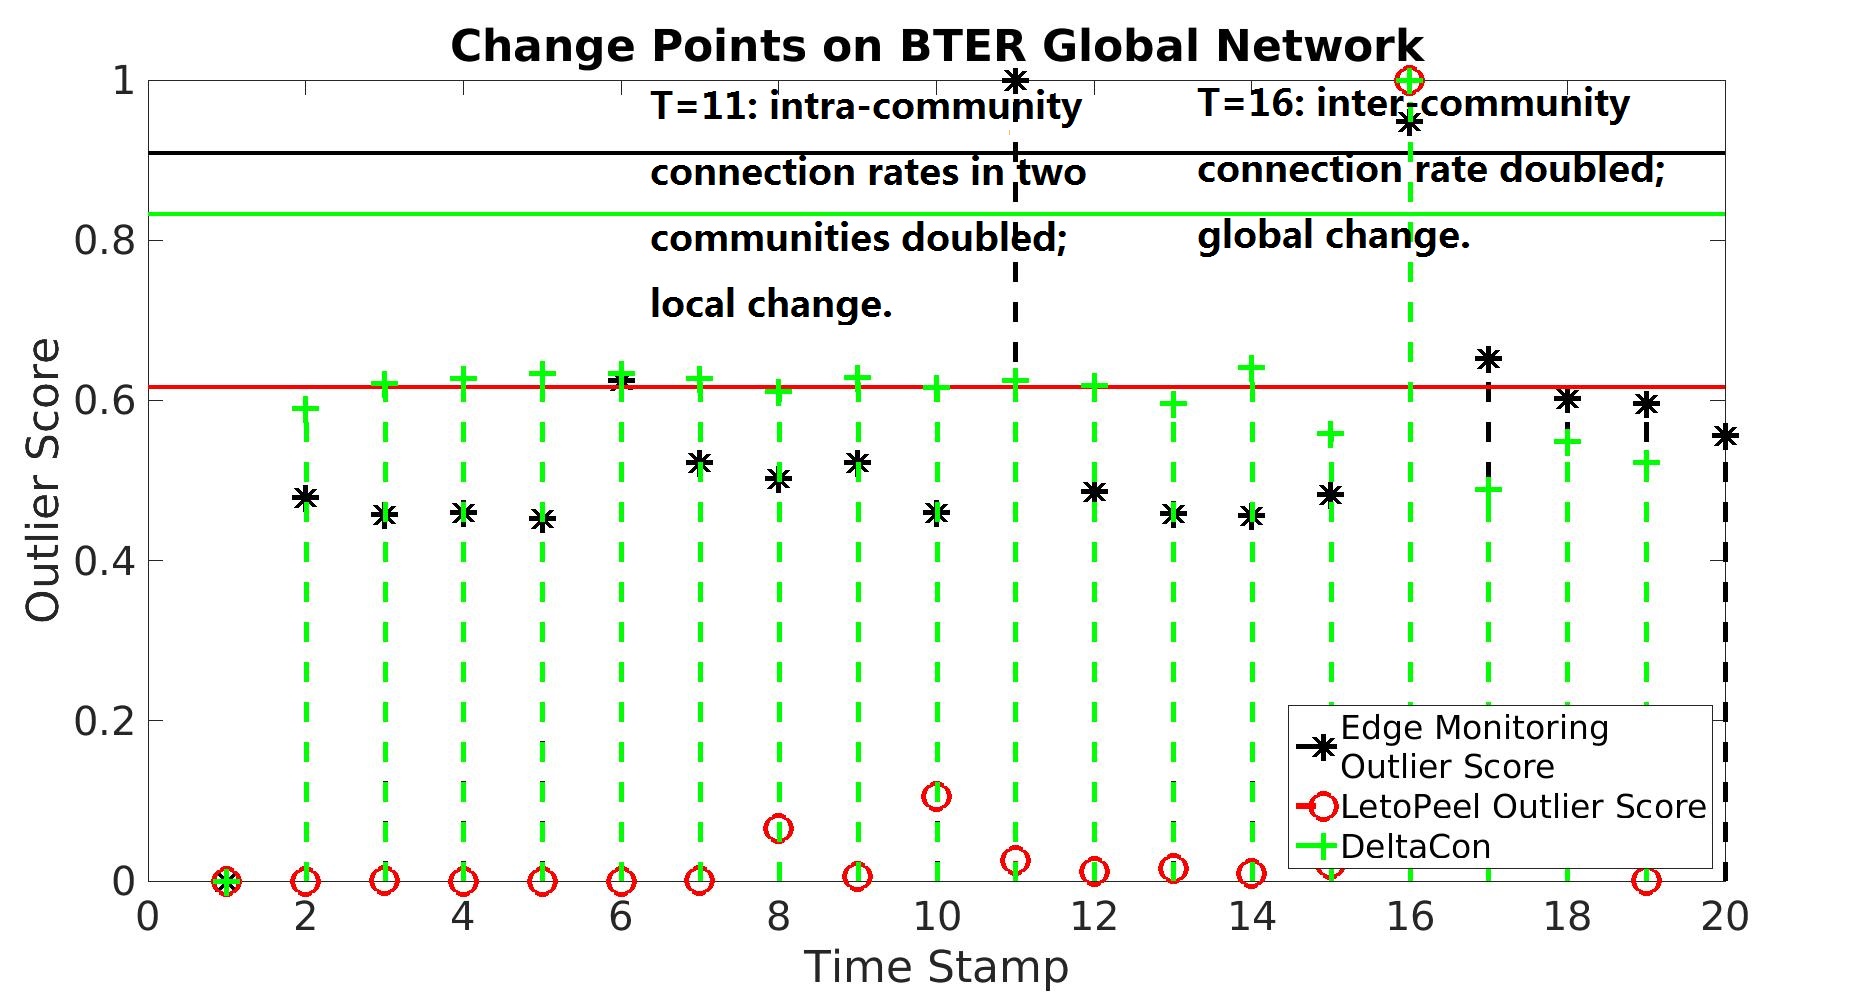 Figure 19
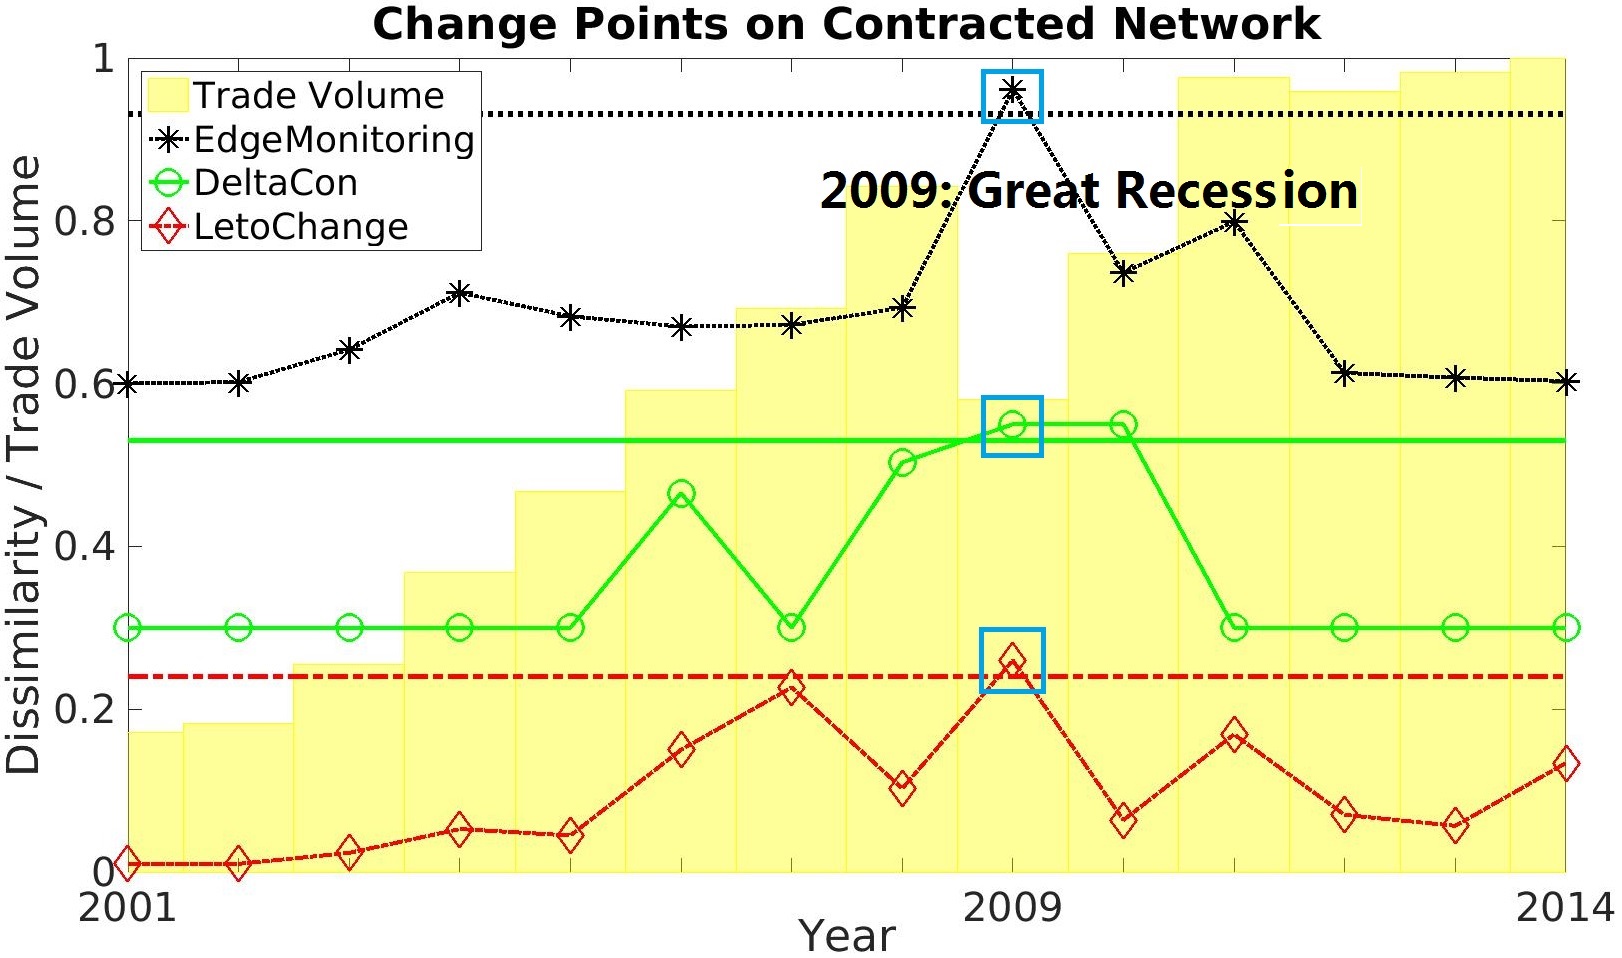 Figure 20
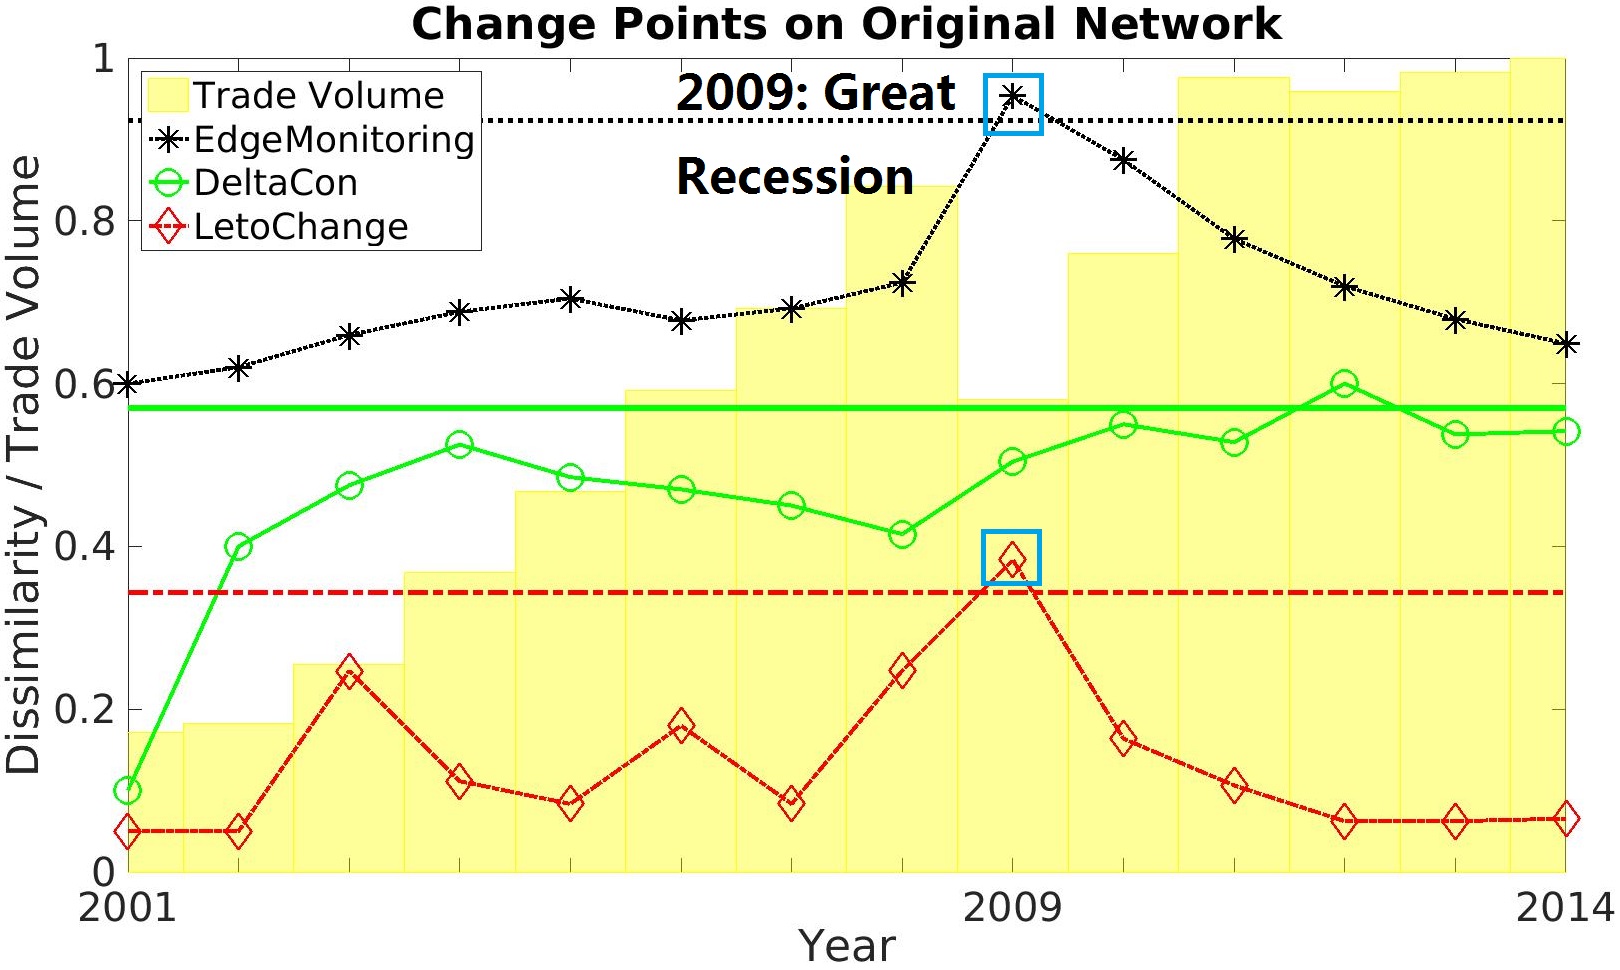 Figure 21
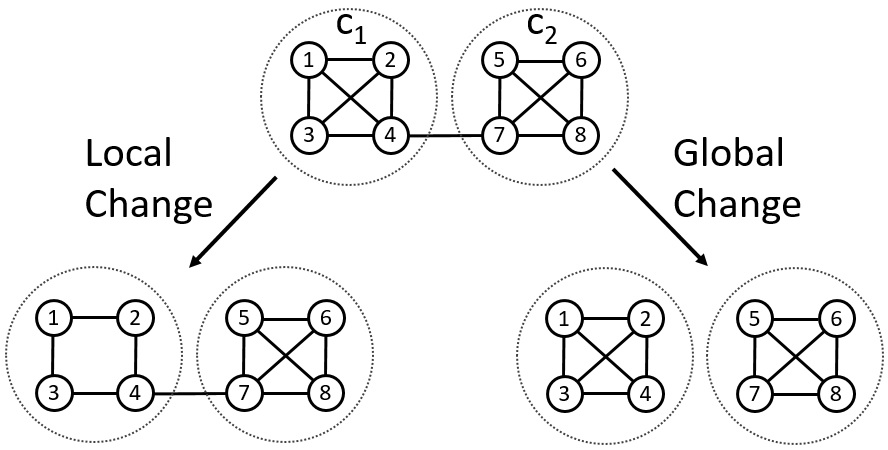 Figure 22
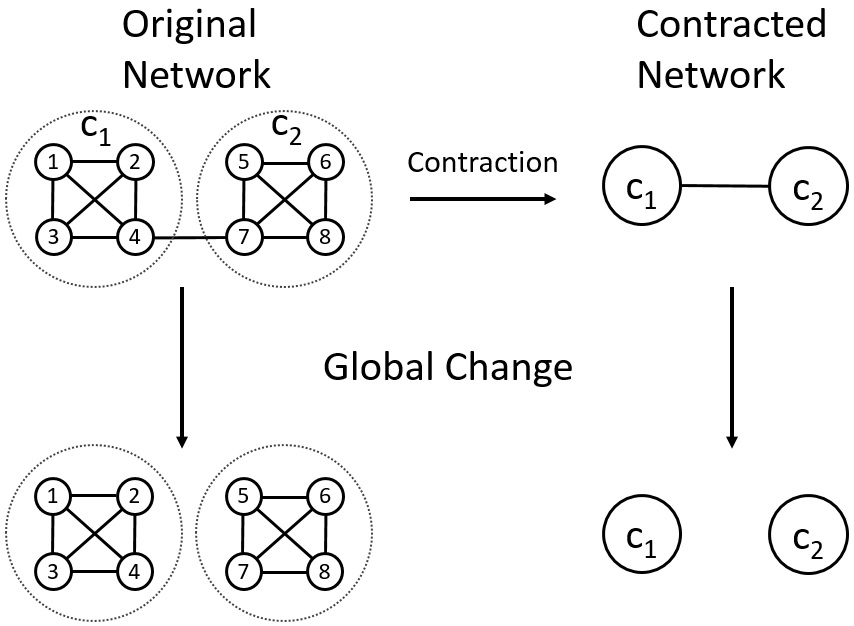 Figure 23
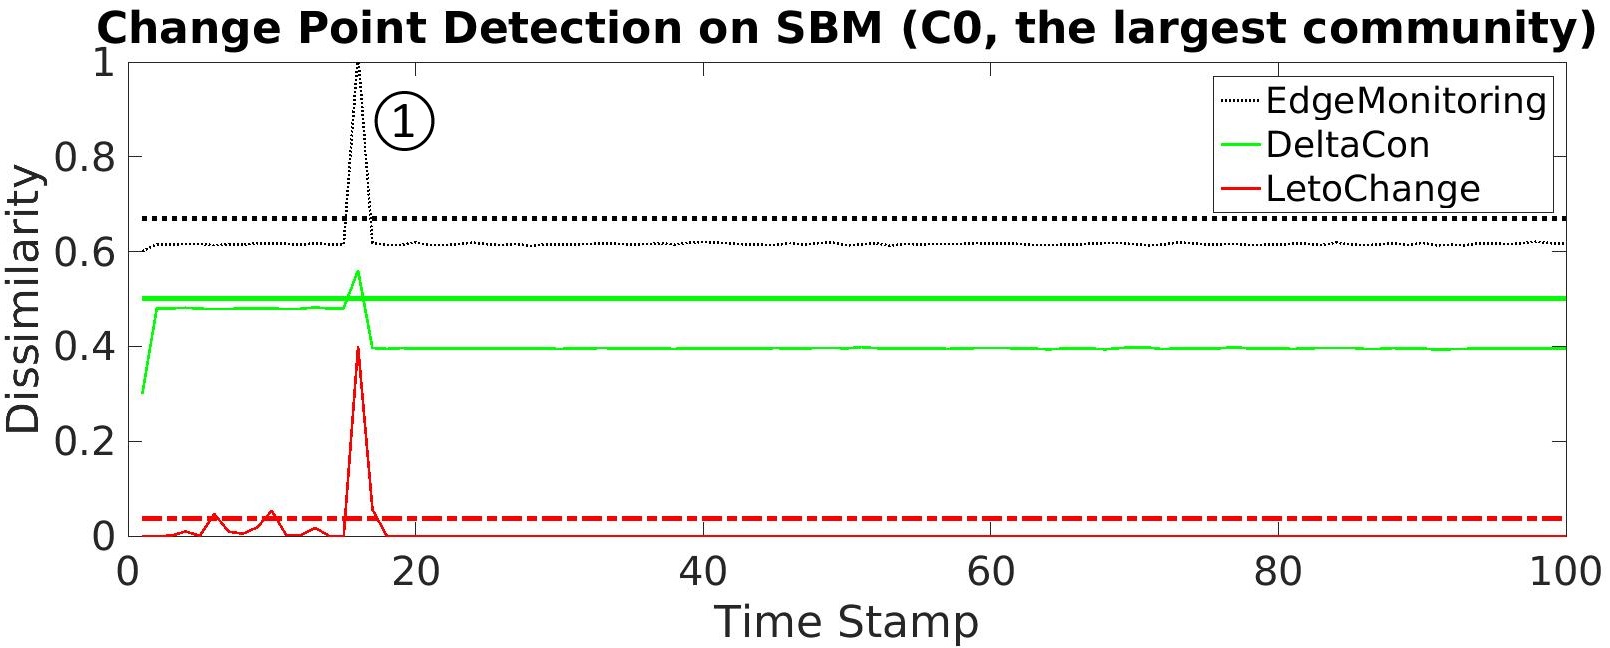 Figure 24
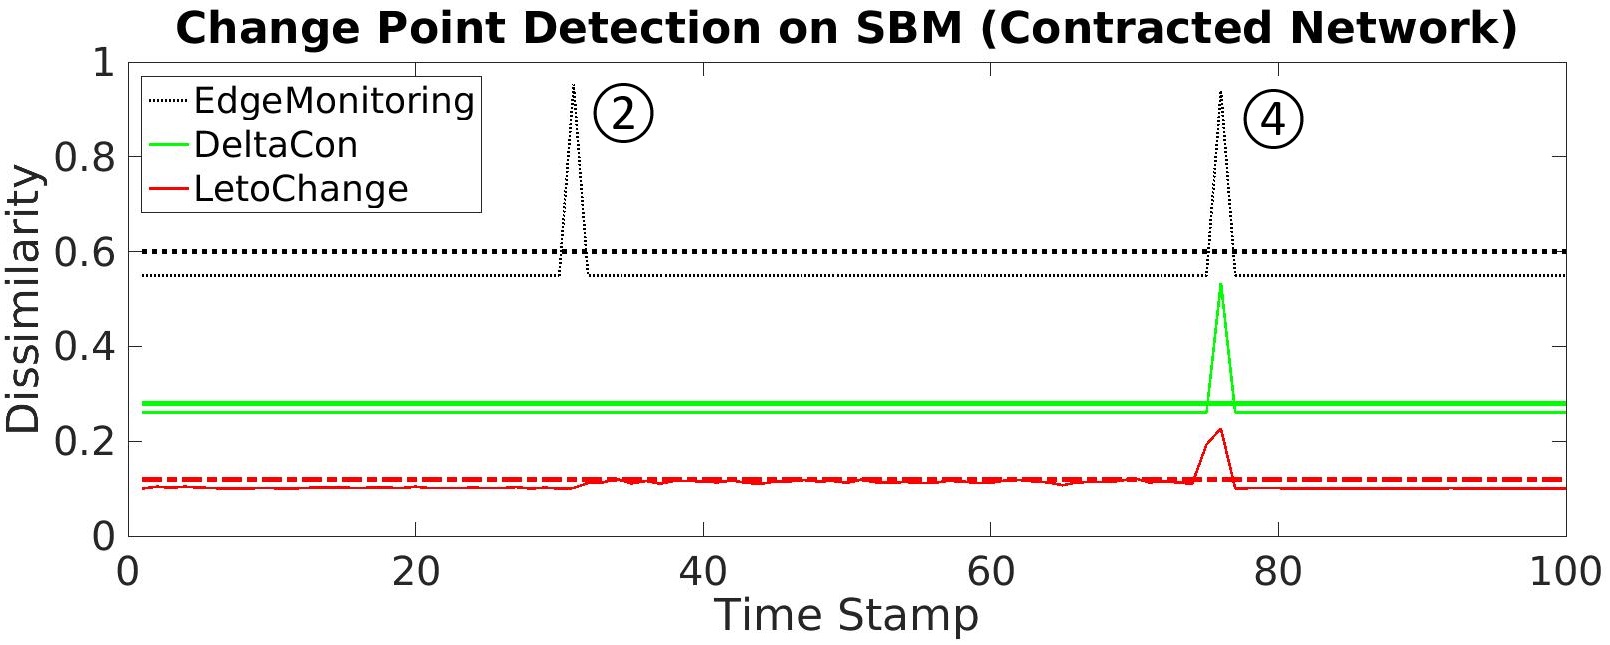 Figure 25
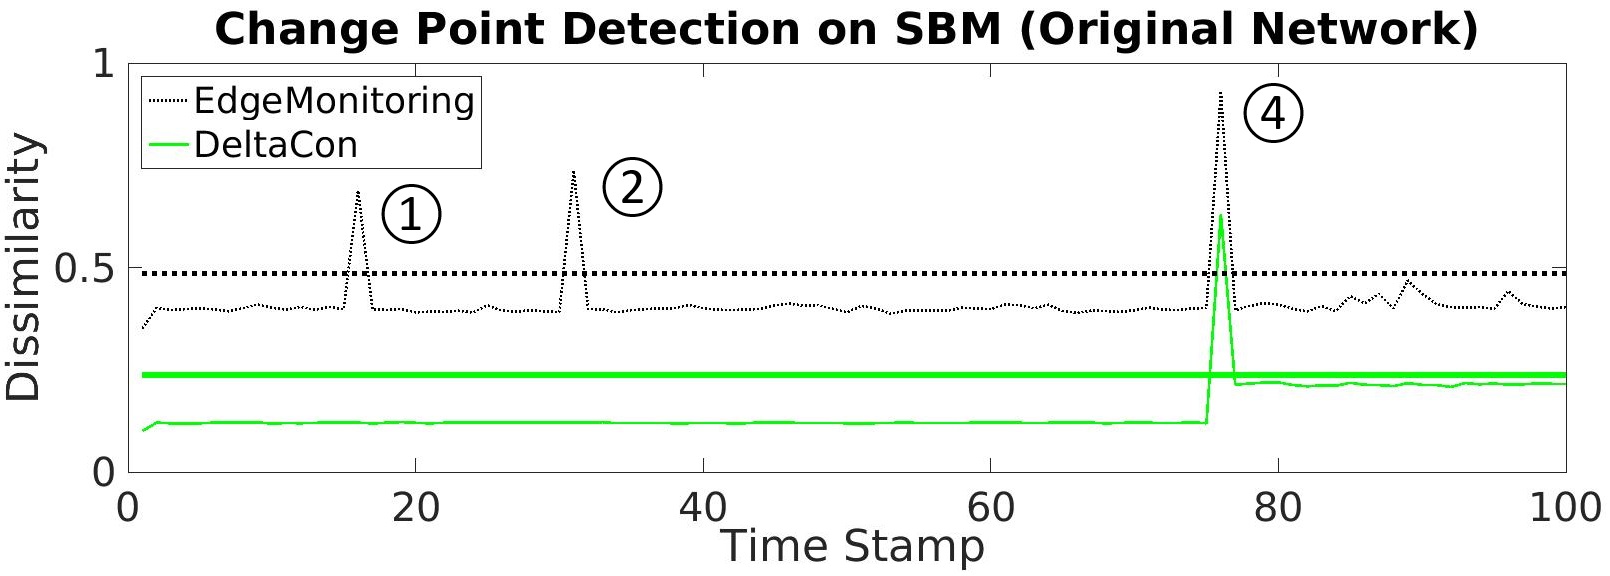 Figure 26
| Event Order | Time Stamp | SBM (1k nodes, 8 communities) | BTER (100 nodes, 5 communities) |
|---|---|---|---|
| 16 | connection rate in the largest community reduced by 1/3 (Local Change) | connection rate in the largest community reduced by 1/3 (Local Change) | |
| 31 | inter-community connection rates among reduced by 1/3 (Global) | Chung-Lu sequence in change (Global) | |
| 51 | connection rates in two smallest communities doubled (Local) | connection rates in two smallest communities doubled (Local) | |
| 76 | SBM matrix regenerated (Global) | Chung-Lu sequence of all the nodes regenerated (Global) |
| EdgeMonitoring1 | DeltaCon | LetoChange | ||||||||||
|---|---|---|---|---|---|---|---|---|---|---|---|---|
| Data | Orig. | Contr. (Speedup) | Comm. Avg | Total2 | Orig. | Contr. (Speedup) | Comm. Avg | Total | Orig. | Contr. (Speedup) | Comm. Avg | Total |
| SBM | 85s | 1.5s (60X) | 3.7s | 31s | 500s | 0.6s (830X) | 24s | 192s | DNF3 | 2h (60X) | N/A4 | N/A |
| BTER | 2.5s | 1.5s (2X) | 1.7s | 10s | 5s | 0.1s (50X) | 1.0s | 5.1s | 51h | 2h (25X) | 13h | 67h |
| Trade | 22s | 0.4s (50X) | 0.5s | 3.4s | 42s | 1.3s (30X) | 1.2s | 8.5s | 150m | 5m (30X) | 9m | 60m |
Peer Reviews
No public reviews on file for this paper yet. If you reviewed it on a platform where reviews are public (OpenReview, ICLR, NeurIPS, ICML), you can paste yours below so the community can read it here.
Videos
No videos yet. Explain this paper in a talk, walkthrough, or lecture? Add one.
Hierarchical Change Point Detection on Dynamic Networks
Yu Wang Aniket Chakrabarti David Sivakoff Srinivasan Parthasarathy∗
Department of Computer Science and Engineering, Department of Statistics
The Ohio State University, Columbus, Ohio, USA
[email protected],[email protected]
(2017)
Abstract.
This paper studies change point detection on networks with community structures. It proposes a framework that can detect both local and global changes in networks efficiently. Importantly, it can clearly distinguish the two types of changes. The framework design is generic and as such several state-of-the-art change point detection algorithms can fit in this design. Experiments on both synthetic and real-world networks show that this framework can accurately detect changes while achieving up to 800X speedup.
Anomaly Detection, Dynamic Social Networks, Community Detection
††copyright: rightsretained††isbn: 978-1-4503-4896-6/17/06††journalyear: 2017††copyright: acmlicensed††conference: WebSci’17; ; June 25-28, 2017, Troy, NY, USA.††price: 15.00††doi: http://dx.doi.org/10.1145/3091478.3091493††isbn: 978-1-4503-4896-6/17/06††ccs: Information systems Data mining††ccs: Information systems Social networks††ccs: Computing methodologies Modeling methodologies
1. Introduction
Anomaly detection on networks is a problem arising in various areas: from intrusion detection (Harshaw et al., 2016) to fraud detection (Eberle and Holder, 2016), from email network (Peel and Clauset, 2014) to fMRI image (Koutra et al., 2016). One problem of particular interest is change point detection on dynamic social networks (Akoglu et al., 2014; Ranshous et al., 2015). Social networks are known to have the hierarchical structure, where the most well-known one is the community structure (Fortunato, 2010; Ruan et al., 2015). Similar nodes are densely connected and form a community, while dissimilar nodes reside in different communities and are less likely to be connected. The interactions (or edges) among nodes can be classified as inter-community interactions and intra-community interactions. The intra-community interactions are more likely to be present (in unweighted networks) or have more weight (in weighted networks) than the inter-community interactions.
Most state-of-the-art change point detection approaches (Koutra et al., 2016; La Fond et al., 2014; Harshaw et al., 2016; Eberle and Holder, 2016; Wang et al., 2017) do not consider the hierarchical structure in a network, but treat the network structure as flat. Hence they can hardly distinguish changes in those two kinds of interactions (intra and inter). If there is an event associated with a particular community, the change happens within that community only, and may not affect the global network too much due to its locality and small scale. (Toy example in Figure 1)
For example, consider the email network of a very big computer science department. If a specific lab is approaching a paper submission deadline, the frequency of email exchange within this lab might outburst. Since the whole department is very big and the daily email throughput of the whole department is high, it is unlikely to detect the change associated with that lab at the global level using the aforementioned algorithms.
On the other hand, if a single community is significantly larger than the others, a significant change in that community will dominate over the other smaller communities. Therefore, regardless of whether there is any change to the rest of the network, the aforementioned algorithms will classify this as a change point. That is, the above algorithms do not answer where the change comes from, neither can they answer if the change comes from within a huge community or from the inter-community interaction.
Continuing with the previous email network example, if a lab consists of half the people in the department (either a big group or a small department), then the outburst of emails within this lab is highly likely to be detected as a global event. Meanwhile, if several groups are jointly working on a funding proposal, it will lead to the email burst between communities, and can also be detected as a global event. The above algorithms can not distinguish between these two global events. Here we see that the existing algorithms either miss minor and local changes, or fail to distinguish between strong local changes and global changes. A recent work ((La Fond et al., 2016)) can answer which pairs of nodes result in change, but it fails to account for the community structure.
Intuitively, the intra-community interaction captures local information while the inter-community interaction captures global information. Hence, we expect to see the former one evolves differently from the global evolution pattern while the latter one should be similar to the global evolution pattern (Asur et al., 2009).
In this paper, we show that the network evolution pattern can be decomposed into inter-community evolution and intra-community evolution. We show that running change point detection algorithms at the global level could miss changes associated with a community, and that change can be detected when we run the algorithms within that community. We also show that the inter-community interaction can be approximated by a hyper-network in which each hyper-node is a contracted community (Blondel et al., 2008). And this contraction also gives us computational benefits.
This paper is organized as follow: we first review the related work, then describe the proposed framework. After that, we introduce the experiments and provide the analysis. Finally, we conclude the paper and discuss future works.
2. Related Work
There are two recent surveys (Akoglu et al., 2014; Ranshous et al., 2015) on change point detection. Most state-of-the-art works (Koutra et al., 2016; Wang et al., 2017) do not consider the hierarchical structure in a network; Other works (Moreno and Neville, 2013; Peel and Clauset, 2014; Bridges et al., 2015) mention the hierarchy in their papers, and they all make specific assumption about the underlying generative model: Moreno’s work (Moreno and Neville, 2013) assumes a network is generated from a mixed Kronecker product graph model (mKPGM), which is generated recursively from a seed matrix. The block of the matrix at each level resembles the community. Peel’s work (Peel and Clauset, 2014) assumes a network is generated from a generalized hierarchical random graph model (GHRG), which organizes the network as a tree of which the leaves are nodes in the network and the internal nodes are communities. Bridges’s work (Bridges et al., 2015) assumes a network is generated from the generalized block two-level Erdős-Rényi (GBTER) model, which posits the inter-community and intra-community edges are formed in different ways. Although they mention the hierarchical structure, they fail to distinguish between the change associated to a community and the change associated to the whole network. We design a framework that provides a systematic way to detect and distinguish between local and global changes. Our framework is generic and supports several state-of-the-art change point detection algorithms. Another drawback of these network hypothesis test based approaches is their low efficiency due to bootstrapping: Peel’s work does not scale very well in our experiments, and its efficiency is improved up to 60 times when superimposed by our framework.
Community detection (Fortunato, 2010) is also a time-consuming task. The Louvain method (Blondel et al., 2008) alternatively contracts and detects communities on the networks, and has been one of the most efficient community detection algorithm for several years. Its efficiency comes from the network size reduction via contracting. We use the same idea for efficient change point detection.
Another recent work ((La Fond et al., 2016)) considers attributing the global change score to node pairs. It defines change scores at edge level, flags out the top ranked edges and their neighbors as changed regions. That work does not consider the community structure, and its focus is on visualization. Our work distinguishes between inter-community interaction and intra-community interaction, and shows the former one can approximate the global evolution. Moreover, our framework reduces the running time of the state-of-the-art algorithms (Peel and Clauset, 2014; Koutra et al., 2016; Wang et al., 2017).
3. Methodology
We follow the Type 4, “Event and Change Detection”, in (Ranshous et al., 2015), which is to find snapshots from a network snapshot sequence that are “significantly” different from their predecessors. Like (Wang et al., 2017), we also assume each snapshot is generated from a generative model. Snapshots from the same generative model resemble each other, although they are not identical due to randomness. The change of the generative model leads to “significant change” of the snapshots. This assumption can be illustrated as a Markov network (Figure 2).
Our work differs from (Wang et al., 2017) in that we study networks with the community structure, where each snapshot observation consists of multiple components, corresponding to communities and their interactions. In Figure 2, the generative models are latent and we can only observe the generated snapshots. Existing approaches have two directions: to estimate the generative model from multiple snapshots and then compare the estimated model (Peel and Clauset, 2014; Bridges et al., 2015; Wang et al., 2017); or to compute the difference of the snapshots directly (Koutra et al., 2016). Our framework supports both types of approaches. In both cases, the problem and the solution can be generalized as (Ranshous et al., 2015): given a network snapshot sequence and a dissimilarity function (outlier score) , a change is defined as a time point , such that f(G_{t},G_{t-1})$$>$$th_{0}, where is some pre-specified threshold. Change point detection is to find all time stamps s at which changes occur. All the aforementioned works run on the original network, and hence detect changes at the global level.
We define intra-community change and inter-community change in a similar fashion: let be the community at time , the intra-community change point is defined as a time point such that . By contracting the community in the network into a hyper node , one gets a contracted network . The inter-community change point is defined as a time point such that . Our goal is to find both the intra-community change (local change) as well as the inter-community change (global change).
Problem Definition Given a network sequence , its community assignment , and dissimilarity functions , find all the time points such that either
- , or 2) f_{c}(G_{t}^{c},G_{t-1}^{c})$$>$$th_{2} for some pre-specified threshold .
3.1. Framework Description
We propose the following framework (Algorithm 1) which reveals both the local change as well as the global change. In Line 1, we first partition communities on the first snapshot. We assume the community assignment does not change over time. If there really is a severe change in community assignment, the event will be detected as a global change. Between global changes, the community assignment will remain constant. Hence one can apply the local change detection part of the framework to the subsequences in which community assignment remains similar. One may argue that it is more robust to partition communities on the aggregated network from the first couple of snapshots. Our reasoning is that if no global change happens during the first couple of snapshots, the community assignment/structure should remain the same; otherwise we flag out that snapshot as abnormal (to be investigated), and redo the community partition on the new snapshot. The for-loop from Line 2 to Line 12 scans over all the snapshots. The original snapshot is contracted in Line 3 into a weighted (hyper-)network in which each hyper-node corresponds to a community in the original snapshot (Figure 3). If the original network is unweighted, the weight of the hyper-edge is the number of actual inter-community edges divided by the number of all possible inter-community edges. Otherwise the weight of the hyper-edge is the summation of the inter-community edge weights divided by the sizes of the two communities. The contraction operation is widely used in hierarchical community partition algorithms (Karypis and Kumar, 1998; Fortunato, 2010). The for-loop from Line 4 to Line 8 iterates over all the communities. The provided change point detection algorithm runs on the community level, and returns the dissimilarity score between two consecutive (sub-)networks. The branch in Line 9 detects the global change by running the detection algorithm on the contracted (hyper-) network.
Community partitioning gives us efficacy while network contraction gives us efficiency: each community is a fine-grained sub-network, and running detection algorithm on each community can avoid fluctuation and noises from neighboring communities, and hence the detected change points are solely associated with this particular community; contraction significantly reduces network size, and in turn, reduces the running time of the algorithms whose complexity is proportional to the network size. On the other hand, network size reduction also implies information loss, and therefore the quality of change points detected on the contracted network is inferior to that on the original network. Fortunately, our experiments show that the ranking of outlier scores on the contracted network is similar to that on the original network, which implies that the inter-community evolution can indeed capture global evolution pattern.
3.2. Algorithms
We superimpose the framework on three state-of-the-art algorithms (Koutra et al., 2016; Peel and Clauset, 2014; Wang et al., 2017),
3.2.1. DeltaCon
DeltaCon (Koutra et al., 2016) computes the outlier score from the snapshots directly. It extracts a feature vector from each snapshot using personalized PageRank, and computes the rooted Euclidean distance of two consecutive feature vectors.
3.2.2. LetoChange
LetoChange (Peel and Clauset, 2014) assumes the network is generated from GHRG model in which the network has a tree-like structure: leaves correspond to nodes while internal tree nodes correspond to communities. The network sequence is partitioned into equal sized sliding windows, and the model parameters are estimated within a window. The outlier is flagged out if the model parameters estimated change greater than a threshold. It bootstraps networks from the generative model to calculate a proper threshold. To sample multiple networks from a generative model is time-consuming. We bootstrap outlier scores for threshold determination, which gains much computational benefit (detailed at the end of this section).
3.2.3. EdgeMonitoring
EdgeMonitoring (Wang et al., 2017) follows LetoCh-ange’s fashion: first estimate the model parameters from a window (several snapshots), then detect change points based on model parameters comparison. EdgeMonitoring estimates the edge probability directly from each window (for the unweighted network) and calculates the Kullback-Leibler divergence of the sequences of two consecutive windows. We modify it to account for weighted networks: we normalize the weights at each snapshot, and average over snapshots within a window. This averaged weight is used as the probability estimate in the above KL divergence calculation.
Although DeltaCon and LetoChange have their own threshold determination strategies, the former one’s normality assumption does not hold while the latter one’s network bootstrap is too time-consuming. We use an efficient, permutation test based strategy. All the three algorithms use the same way to determine outlier scores: first, run the algorithm on the whole snapshot sequence and obtain an outlier score sequence; then, use bootstrap to compute the 0.95 confidence level of the outlier scores. The rationale of this threshold determination is essentially the same as that of the permutation test (Pitman, 1937). The modified framework is displayed in Algorithm 2, in which the IsChanged function again returns the dissimilar score.
4. Experiments and Evaluation
4.1. Data
We apply the framework to two synthetic networks and one real world network. For the synthetic networks, we test our framework on the Stochastic Block Model (SBM (Karrer and Newman, 2011)) and the Block Two-Level Erdős-Rényi (BTER (Seshadhri et al., 2012)) model. SBM assumes edge probability a function of the community membership of the two incident nodes; BTER model assumes the intra-community edges are sampled from Erdős-Rényi model (Erdős and Rényi, 1960), while the inter-community edges are sampled from Chung-Lu model (Chung and Lu, 2002). For both experiments, we do not change community membership (as discussed in Section 3.1), and inject either global or local changes at different time stamps (Table 1).
The SBM experiment has 1k nodes and 8 communities ranging from size 50 to size 300. The edge probability is determined by a symmetric stochastic block matrix whose entries are sampled from Uniform with the restriction that main diagonal entries greater than off-diagonal entries. The BTER experiment has 100 nodes and 5 communities whose sizes are sampled from power a law distribution (Yang and Leskovec, 2012), and range from 15 to 25. ER probability is sampled from a beta distribution (Bridges et al., 2015), while CL sequence is sampled from another power law distribution (Faloutsos et al., 1999). Each snapshot is a weighted network where the edge weight is a sample from a binomial distribution and normalized to the range [0,1]. Since LetoChange does not support weighted network, we unweight each network by retaining the edges with probability equal to the edge weight.
For the real world network, we use the international trade network111www.worldbank.org from the year 2001 to the year 2014. We select 90 countries/economies and represent them as nodes. The network is directed and weighted, where the direction specifies import/export and the weight is the trade volume. The network is near a clique since almost every two countries have bilateral trade between them.
There are six ground truth communities in the network, corresponding to free trade zone and/or geopolitics alike nations: Asia-Pacific Economic Cooperation (APEC), black sea economic cooperation (BSEC), fifteen developed western European countries (EU15), Latin American Integration Association (LAIA) and Southern African Development Community (SADC), Organization of Islamic Cooperation (OIC). The Louvain (Blondel et al., 2008) community partition algorithm is also applied to this network and returns consistent partitions.
4.2. Experiments and Results
4.2.1. Synthetic Network
We apply our framework with the three aforementioned detection algorithms on the synthetic networks. The generation process is described in the previous subsection. We present both quality and time efficiency of our framework. We report time efficiency in Table 2, and use both qualitative and quantitative methods to validate the quality.
Figure 4 shows the change points detected on the SBM network. Figure 4a is the result on the global (original) network, and Figure 4b is the result on the contracted network; the curves are outlier scores for various change point detection algorithms and the horizontal bars are corresponding thresholds. LetoChange can not finish within 48 hours (Table 2) on the original network, and hence is not displayed in Figure 4a. We can see that EdgeMonitoring correctly captures two global changes and a local change in the largest community of the original network (Figure 4a). After contraction (Figure 4b), EdgeMonitoring only captures the two global changes. This is what we can expect since inter-community interaction reflects the global pattern, and contraction only preserves this global pattern. Although DeltaCon does not capture both the global changes, the quality of DeltaCon on the contracted network is the same as on the original network while achieving 830 times efficiency improvement! Note that the quality of change point detection on the original network is totally determined by the detection algorithm itself. Applying our framework (i.e. to contract the network) does not deteriorate the quality. A similar observation holds for LetoChange.
We note that it is the outlier score ranking (say, top as in (Wang et al., 2017)), rather than the absolute values, that matters in change point determination. Hence we use the Normalized Discounted Cumulative Gain (NDCG (Wang et al., 2013)) scores to evaluate how good the contracted one approximates the original one. NDCG score quantifies the difference between two rankings, and perfect match results in .
[TABLE]
[TABLE]
DCG is calculated on the contracted network, while IDCG (reference) is calculated on the original network. The outlier scores from two networks are sorted in descending order respectively. is the number of matches between the target ranking and the reference ranking within first scores, and is the number of snapshots. The NDCG scores for EdgeMonitoring and DeltaCon are , respectively, indicating reasonably good approximation.
Figure 5 shows the change points detected on the largest community.
All three algorithms detect the local change (
1
in Table 1) that edge probability reduces at time stamp 16 in C0.
It’s interesting to note that EdgeMonitoring detects the local change
1
on the original network (Figure 4a).
This is because the change occurs in the largest community (consisting of 30% of all the nodes),
and the node pairs in that community are more likely to be tracked.
If we only run the algorithm on the original network, we would not be able to tell if the change corresponds to a global event or a local event.
DeltaCon is more conservative in terms of flagging out change points:
it not only misses the local event
1
in Figure 4a,
but also misses the global event
2
.
Yet it is still able to detect the local change in Figure 5.
Similarly, running algorithms within community , reveals local event
3
. This result is not included for brevity.
Figure 6 shows the change points detected on the BTER network.
We see that all three algorithms capture the global events
2
,
4
on the original network.EdgeMonitoring and LetoChange in addition capture the local event
3
,
which corresponds to edge probability increase in the two smallest communities (Table 1).
Although both
1
and
3
are local events,
the largest community consists of 23% of all the nodes while the two smallest communities together consist of 35% of all the nodes.
Intuitively, the latter should have more impact on the global network than the former.
And from the algorithmic perspective, the node pairs of the latter have higher chance to be tracked than the former.
Figure 6b shows that after contraction, all three algorithms only capture the global events.
Running the algorithms within each community detects the local change and we do not include the result for brevity.
The NDCG scores for EdgeMonitoring, DeltaCon and LetoChange are , and respectively.
The snapshots before and after the global event
4
are visualized in Figures 7 and 8.
We can see from Figure 7 that the inter-community interaction between the red community and the others is enhanced after the event,
which is also revealed in the contracted network in Figure 8.
The two synthetic experiments above show that superimposing our framework on top of the aforementioned change point detection algorithms can indeed distinguish global and local change, and hence gives us finer granularity knowledge of the evolution of a dynamic network.
4.2.2. Real World Network
Figure 9 shows the result of change point detection on the original network and the contracted network using the international trade network. It can be seen that the majority algorithms on both the networks reveal the year 2009 as the most significant outlier. The year 2009 is a year immediately after the global financial crisis, and the term “The Great Recession” is applied to the global recession which started in that year.222http://www.cbpp.org/research/economy/chart-book-the-legacy-of-the-great-recession It is pretty clear that the global trade volume drops significantly during that year. The NDCG scores for EdgeMonitoring, LetoChange and DeltaCon are , and respectively, which suggests great approximation for EdgeMonitoring and LetoChange, and good approximation for DeltaCon. The speedup of the framework is reported in Table 2.
Figure 10 compares global change point detection and local change point detection. Figure 10a is the result of running the detection algorithms on the original network. Figure 10b is the result of running the detection on the APEC community (Asia-Pacific region). We see that the two (sub-)networks have similar outliers: the 2009 recession is detected on both the networks. This is not surprising since this APEC community contributes of the world trade,333https://ustr.gov/trade-agreements/other-initiatives/asia-pacific-economic-cooperation-apec/us-apec-trade-facts which can also be observed from the similarity of the two background trade volume bar charts. Here we see the impact of a “big”, in terms of edge weight, community to the global network. Two detection algorithms also flag out the year 2010 as a local change point, which could be explained by the GDP growth rebound of the major economies in this region.444http://data.worldbank.org/indicator/NY.GDP.MKTP.KD.ZG Figure 11 visualizes the APEC trade network. We can see that the bilateral trade volume drops significantly post crisis, and several economics flip from trade surplus to trade deficit within the region. Comparing Figure 11c and Figure 11b, we see trade volume jumps among several economics, which is a sign of recovery.
Figure 10c shows the result of local change point detection on the Middle East-North Africa community. Its evolution pattern (the trade volume bar chart, as well as the outlier score ranking distribution) is clearly different from that of the global network. This can also be expected given its relatively small scale economy size and relatively homogeneous economic structures. The year 2005 is flagged as an outlier by EdgeMonitoring, which coincides with Iraq’s purple revolution. 555https://en.wikipedia.org/wiki/Colour_revolution The year 2012 is flagged as an outlier by both EdgeMonitoring and DeltaCon, which coincides with ISIS’s rise in Syria.666https://en.wikipedia.org/wiki/Islamic_State_of_Iraq_and_the_Levant LetoChange flags the years 2013 and 2014 as outliers, we conjecture that might be due to the escalation of the situation with increasing international involvement.
Both change points and outlier ranking distribution reflect network evolution pattern. From Figure 10 we see that while the evolution pattern of a major community might approximate that of the global network, the evolution patterns of other communities differ from that of the global network. We will miss the change points or events associated with a particular community if we only run the detection algorithm on the global network.
5. Conclusion
In this paper, we study hierarchical change point detection on dynamic social networks. We distinguish the intra-community evolution and the inter-community evolution. Our framework detects global change points on the inter-community network, and local change points on the intra-community networks. This framework is compatible with several state-of-the-art change point detection algorithms. Extensive empirical evaluation on several networks (both synthetic and real world) show this framework has not only quality advantages but also significant computational benefits.
Acknowledgements.
The authors would like to thank Leto Peel for providing his code base, and Wenlei Bao and and Congrong Guan for helping collect the international trade data. The authors would also like to thank the anonymous referees for their valuable comments. This work is supported in part by NSF grant DMS-1418265, IIS-1550302 and IIS-1629548. Any opinions, findings, and conclusions or recommendations expressed in this material are those of the authors and do not necessarily reflect the views of the National Science Foundation.
The reference list from the paper itself. Each links out to its DOI / PubMed record.
- 1(1)
- 2Akoglu et al . (2014) Leman Akoglu, Hanghang Tong, and Danai Koutra. 2014. Graph-based Anomaly Detection and Description: A Survey. Data Mining and Knowledge Discovery (DAMI) 28, 4 (2014).
- 3Asur et al . (2009) Sitaram Asur, Srinivasan Parthasarathy, and Duygu Ucar. 2009. An event-based framework for characterizing the evolutionary behavior of interaction graphs. ACM Transactions on Knowledge Discovery from Data (TKDD) 3, 4 (2009), 16.
- 4Blondel et al . (2008) Vincent D Blondel, Jean-Loup Guillaume, Renaud Lambiotte, and Etienne Lefebvre. 2008. Fast unfolding of communities in large networks. Journal of statistical mechanics: theory and experiment 2008, 10 (2008), P 10008.
- 5Bridges et al . (2015) Robert A Bridges, John P Collins, Erik M Ferragut, Jason A Laska, and Blair D Sullivan. 2015. Multi-Level Anomaly Detection on Time-Varying Graph Data. In Proceedings of the 2015 IEEE/ACM International Conference on Advances in Social Networks Analysis and Mining 2015 . ACM, 579–583.
- 6Chung and Lu (2002) Fan Chung and Linyuan Lu. 2002. The average distances in random graphs with given expected degrees. Proceedings of the National Academy of Sciences 99, 25 (2002), 15879–15882.
- 7Eberle and Holder (2016) William Eberle and Lawrence Holder. 2016. Identifying Anomalies in Graph Streams Using Change Detection. (2016).
- 8Erdős and Rényi (1960) Paul Erdős and A Rényi. 1960. On the evolution of random graphs. Publ. Math. Inst. Hungar. Acad. Sci 5 (1960), 17–61.