A survey for planetary-mass brown dwarfs in the Chamaeleon I star-forming region
T. L. Esplin, K. L. Luhman, J. K. Faherty, E. E. Mamajek, and J. J., Bochanski

TL;DR
This study searches for planetary-mass brown dwarfs in Chamaeleon I, confirming six new members with some potentially having disks, and highlights the need for deeper observations to determine the initial mass function's lower limit.
Contribution
It provides the first identification of planetary-mass brown dwarfs in Chamaeleon I using multi-wavelength data and spectroscopy, including the discovery of objects as low as 3 M_Jup.
Findings
Six new late-type members confirmed, including one with the lowest extinction-corrected M_K.
Detection of potential disks around some of the new brown dwarfs.
Extension of the mass function below 6-10 M_Jup, indicating the need for deeper surveys.
Abstract
We have performed a search for planetary-mass brown dwarfs in the Chamaeleon I star-forming region using proper motions and photometry measured from optical and infrared images from the Spitzer Space Telescope, the Hubble Space Telescope, and ground-based facilities. Through near-infrared spectroscopy at Gemini Observatory, we have confirmed six of the candidates as new late-type members of Chamaeleon I >M7.75. One of these objects, Cha J11110675-7636030, has the faintest extinction-corrected M_K among known members, which corresponds to a mass of 3-6 M_Jup according to evolutionary models. That object and two other new members have redder mid-IR colors than young photospheres at <M9.5, which may indicate the presence of disks. However, since those objects may be later than M9.5 and the mid-IR colors of young photospheres are ill-defined at those types, we cannot determine conclusively…
Click any figure to enlarge with its caption.
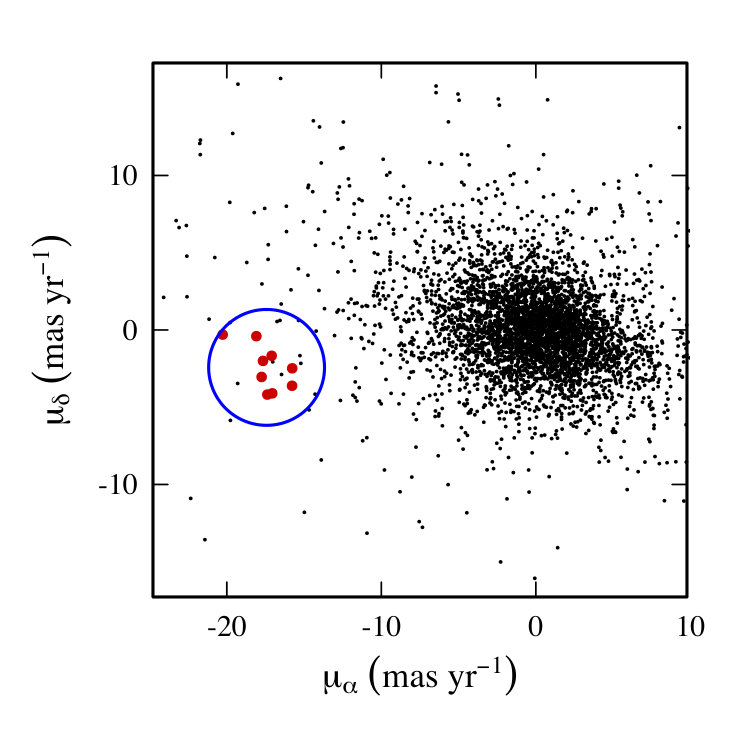 Figure 1
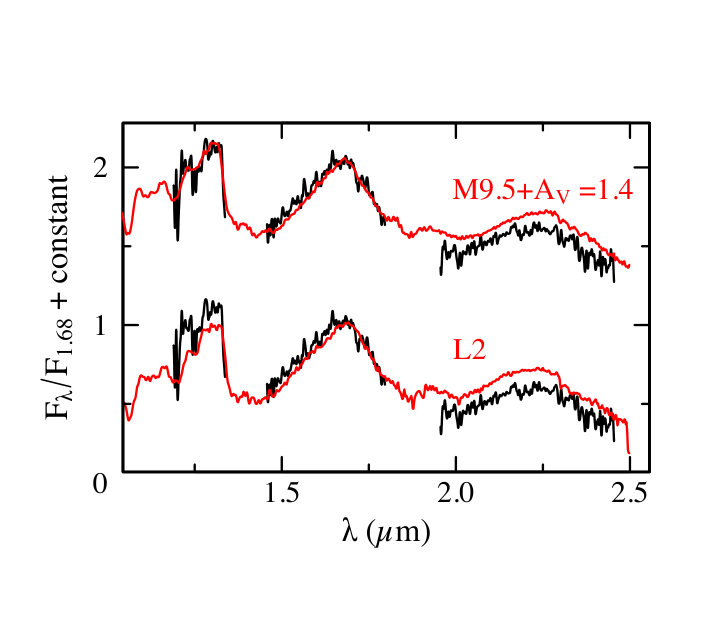 Figure 2
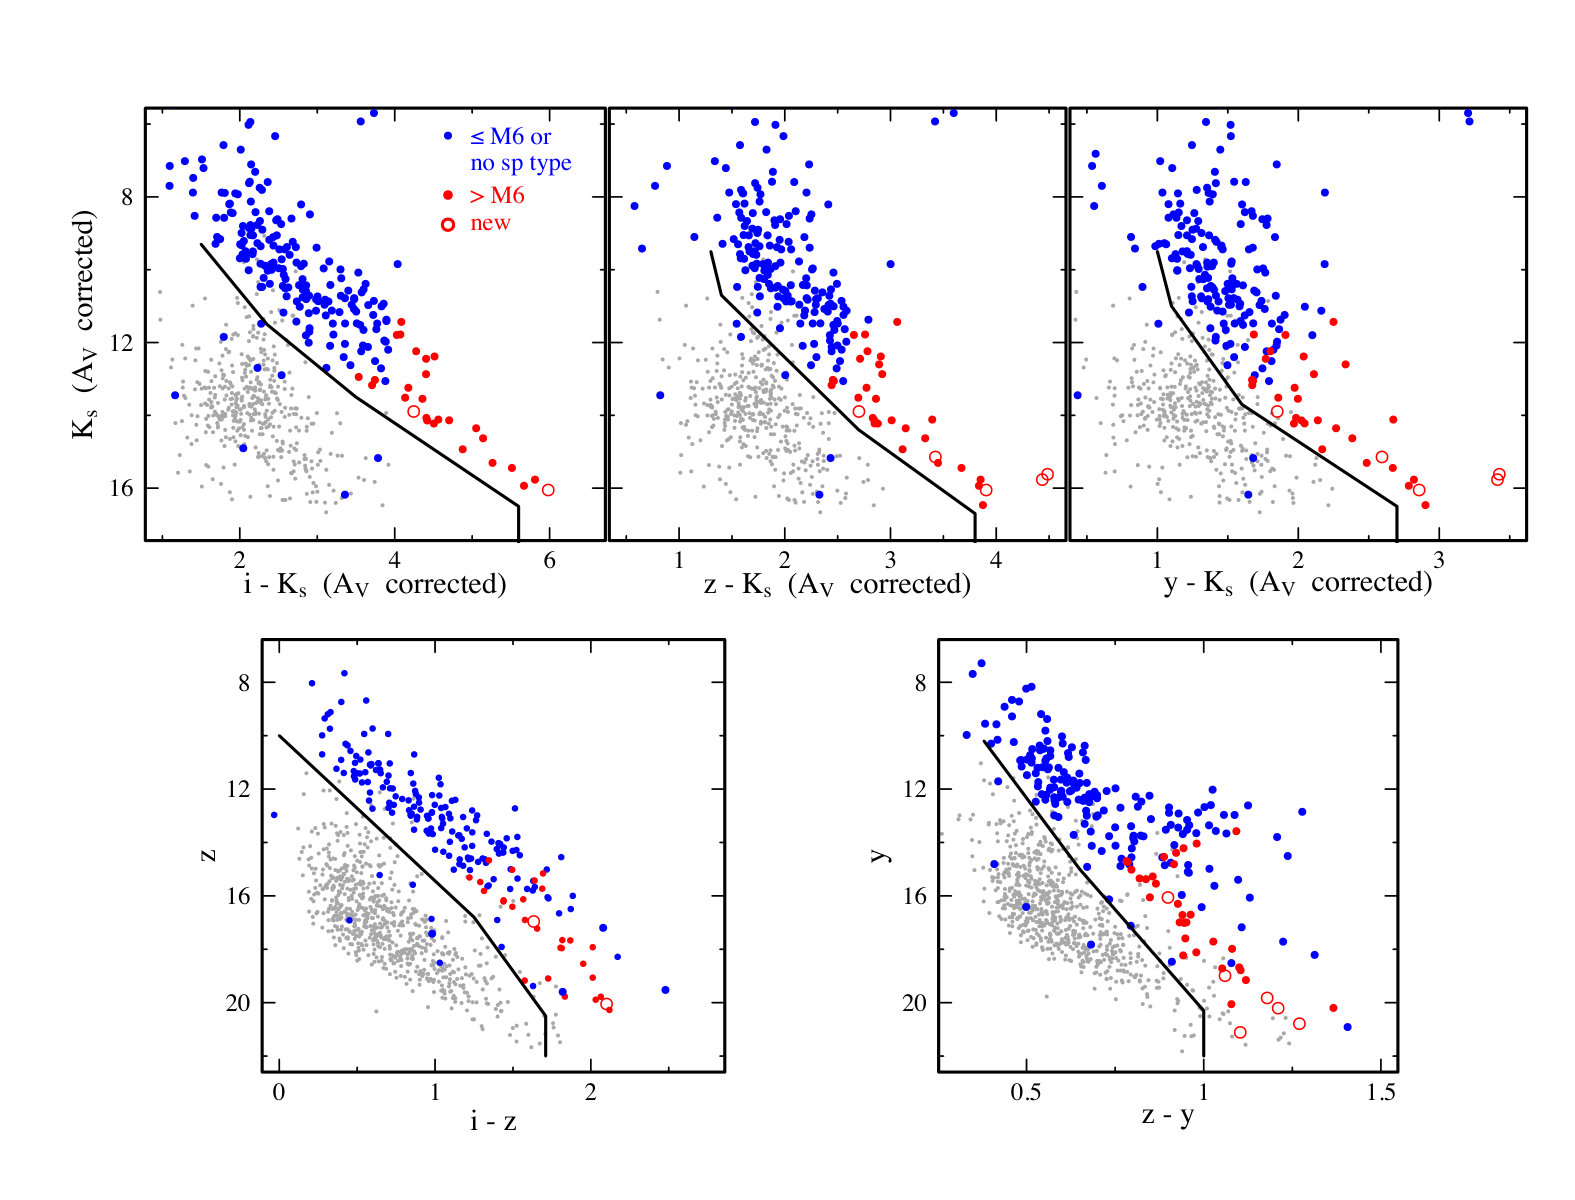 Figure 3
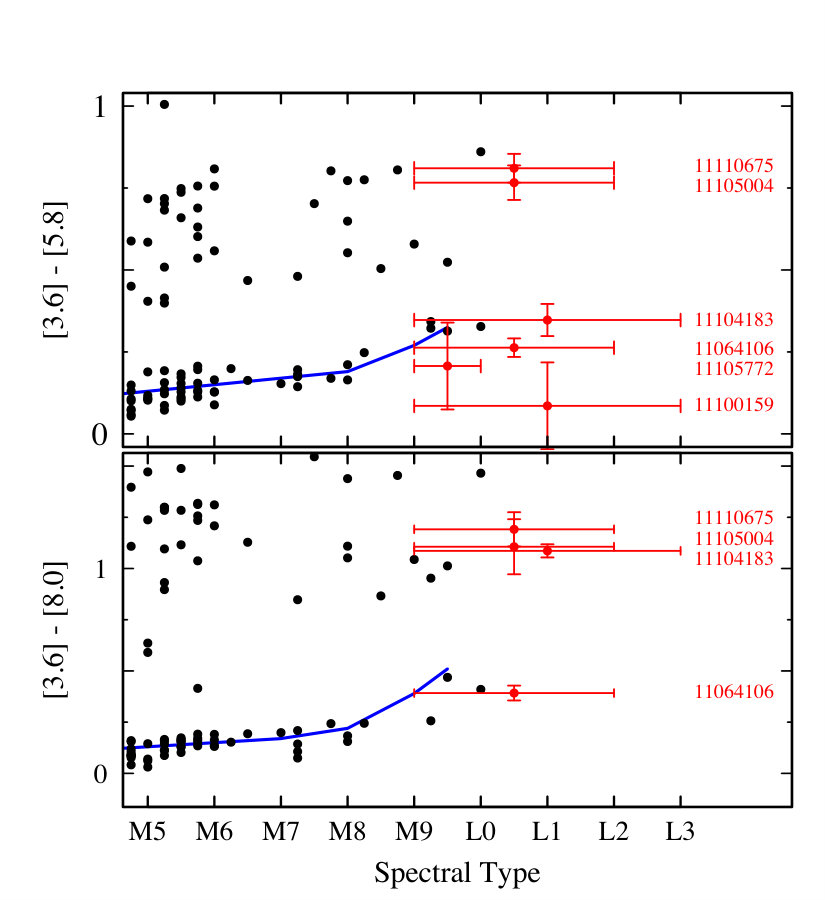 Figure 4
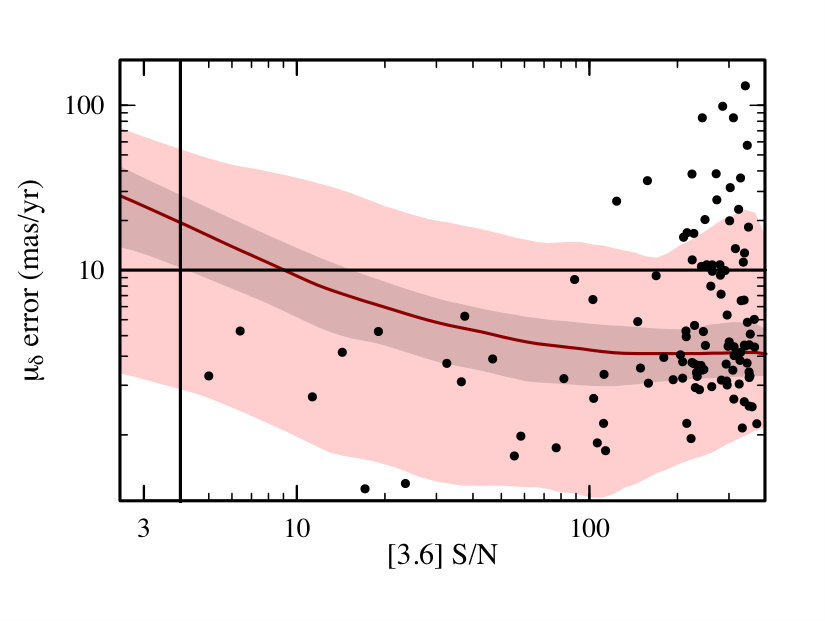 Figure 5
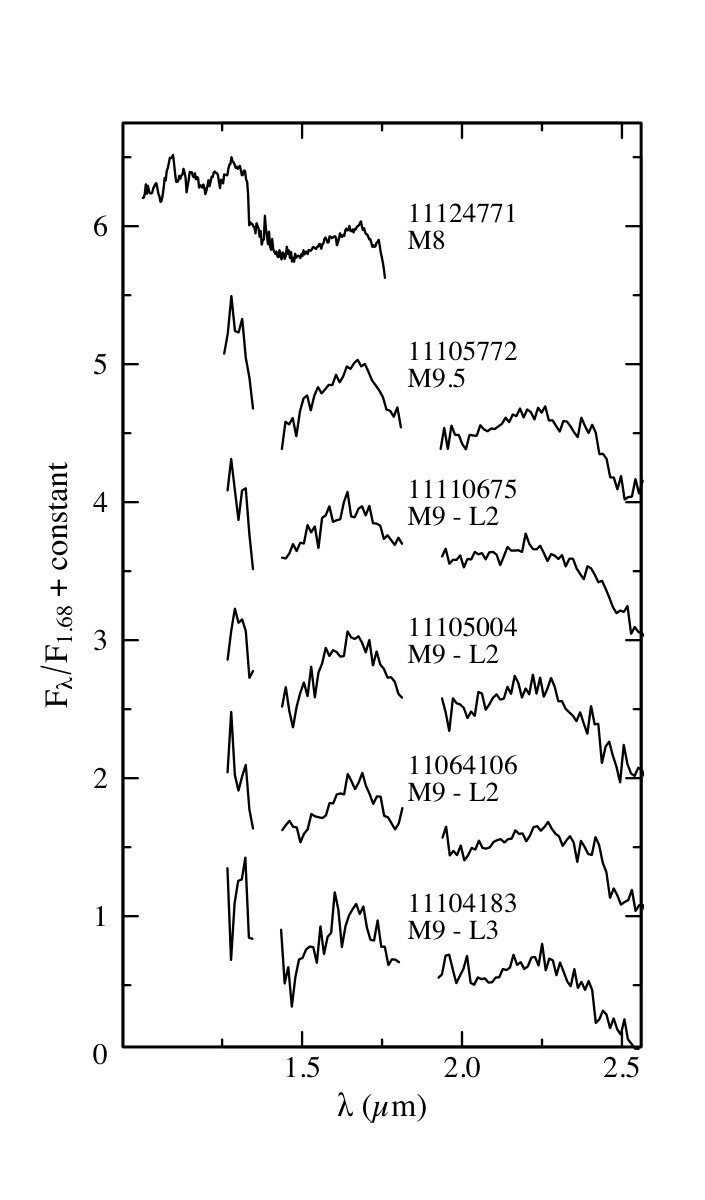 Figure 6
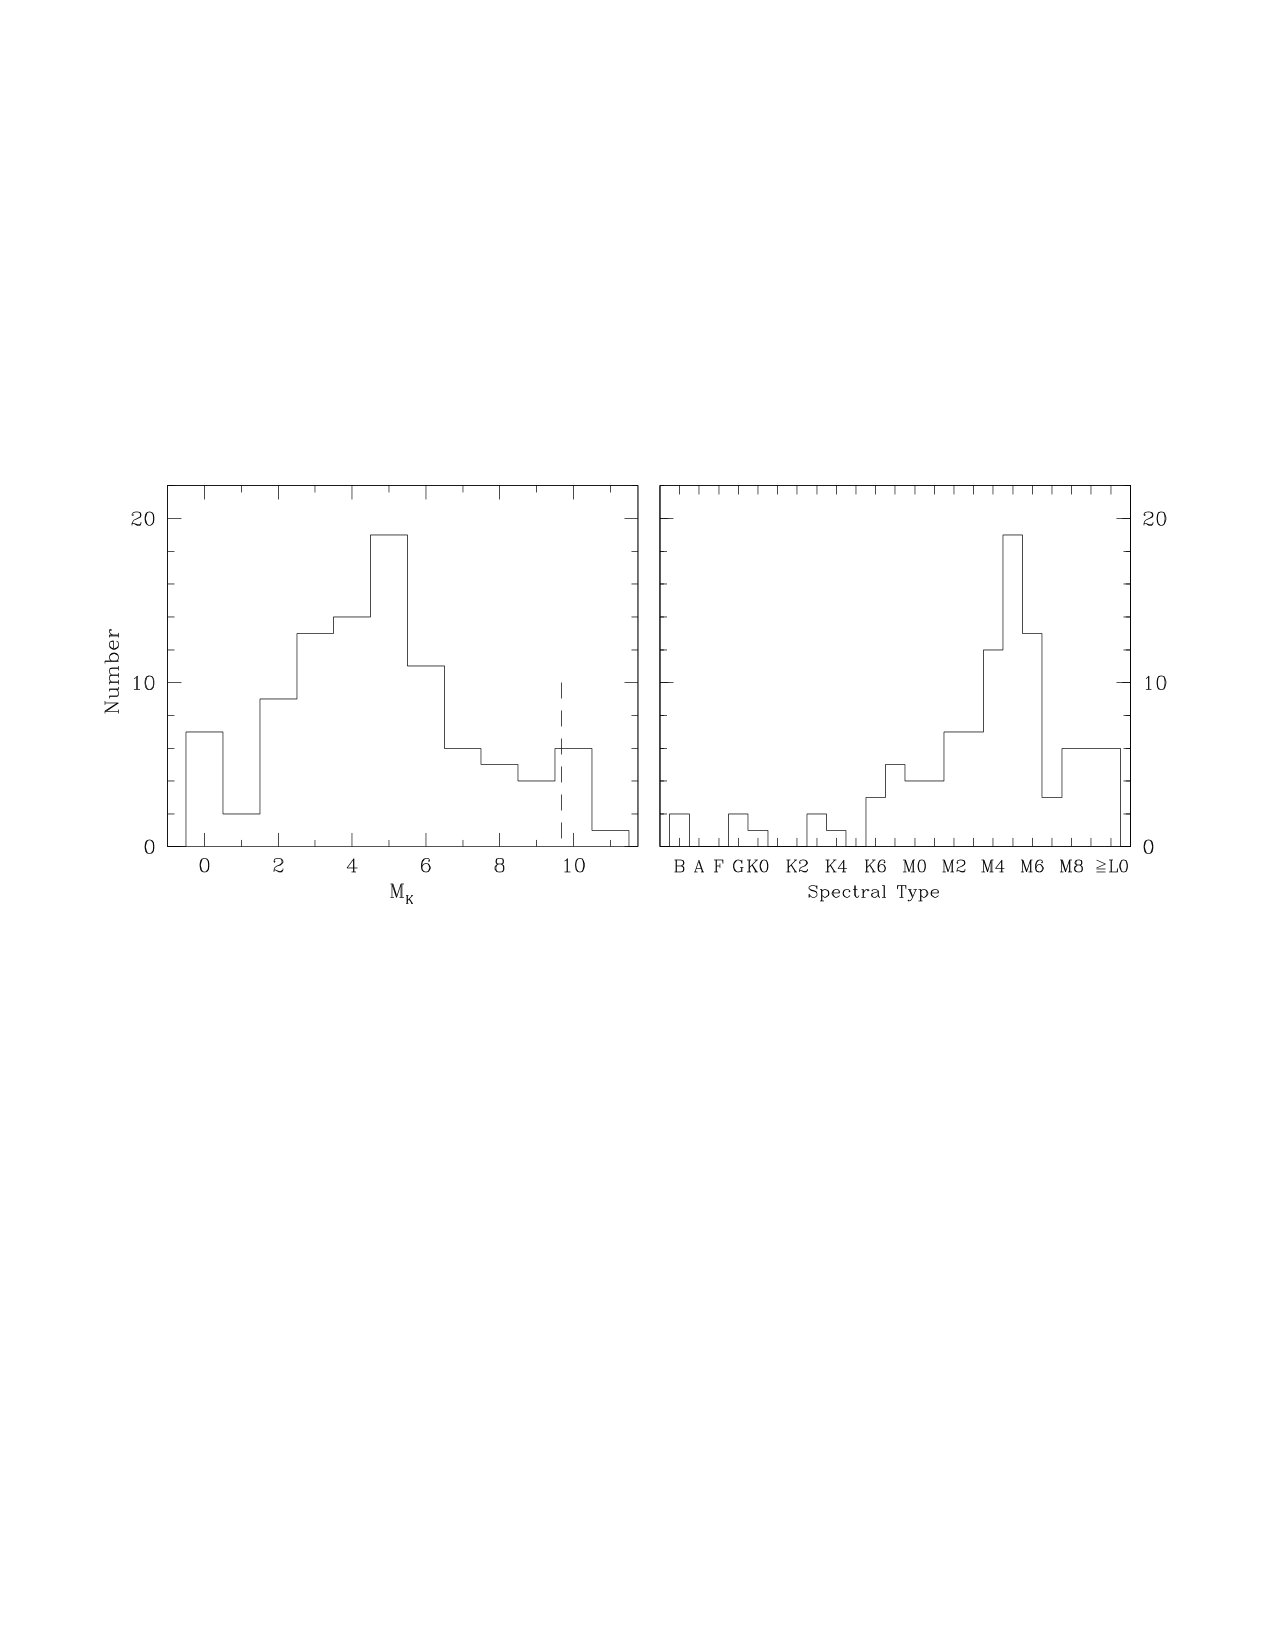 Figure 7
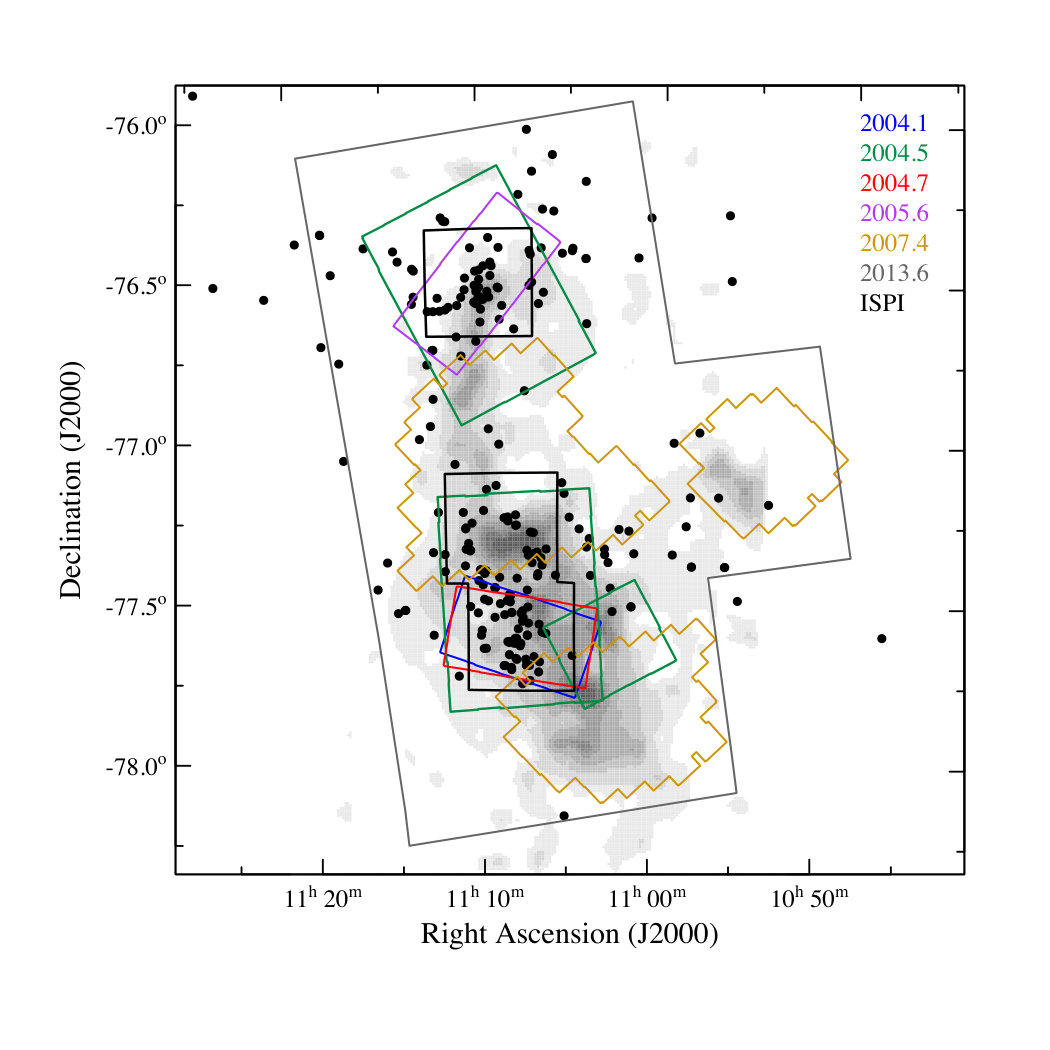 Figure 8
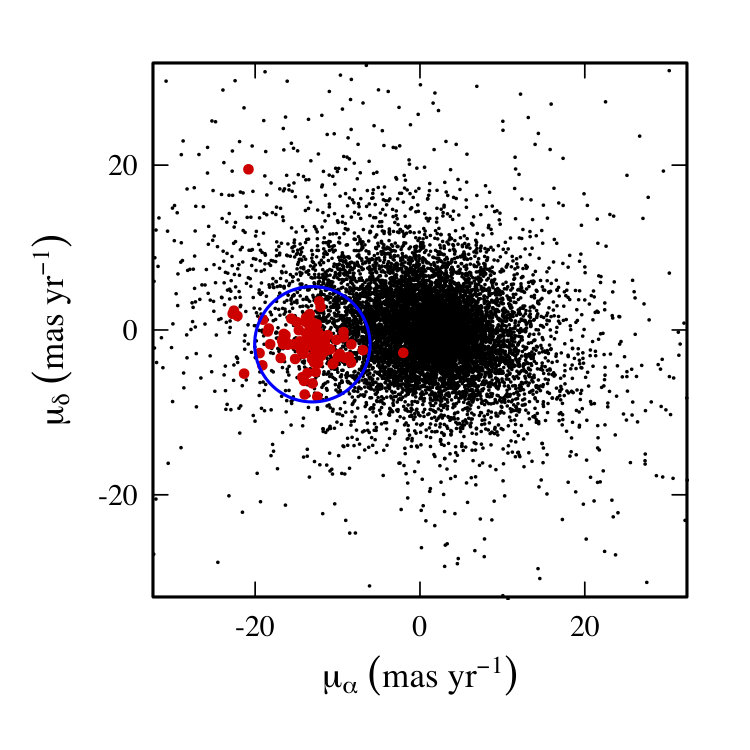 Figure 9
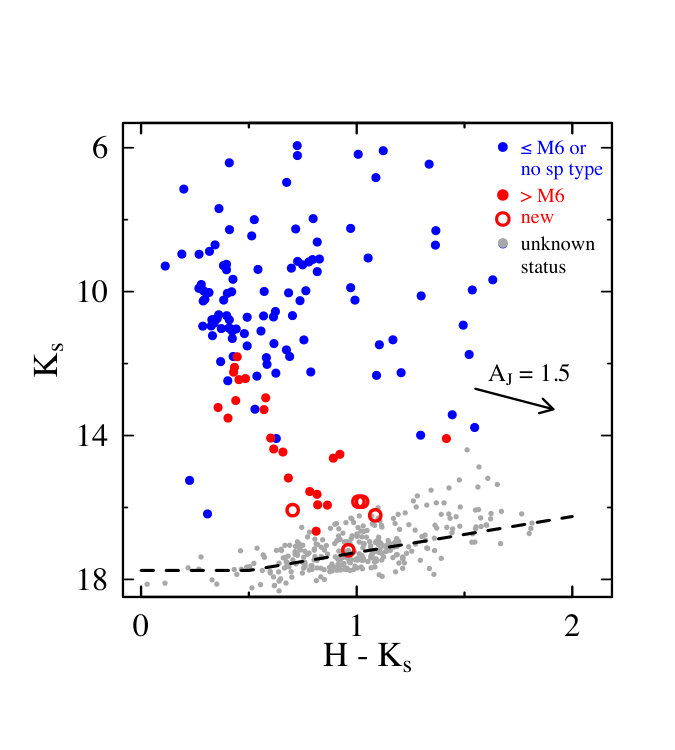 Figure 10
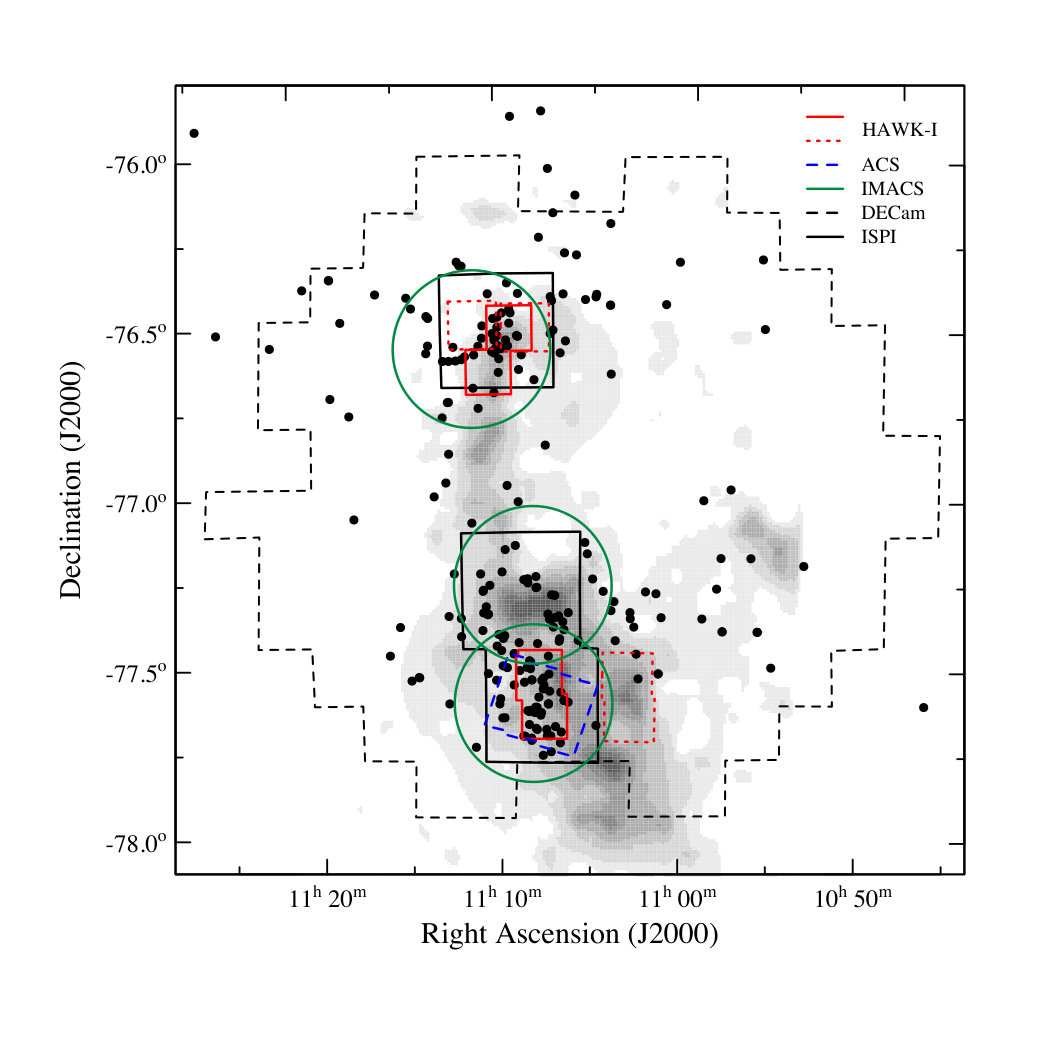 Figure 11
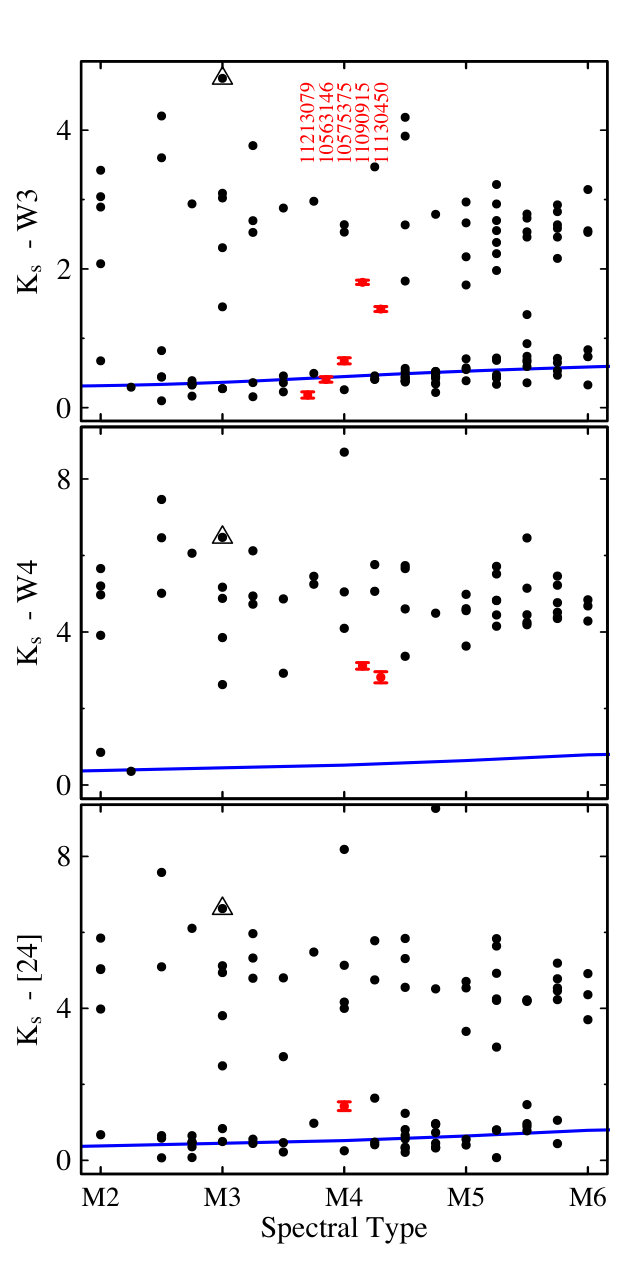 Figure 12
| Column Label | Description |
|---|---|
| Name | Source nameaaCoordinate-based identifications from the 2MASS Point Source Catalog when available. Otherwise, identifications are based on the coordinates measured in this work or Luhman (2008). |
| OtherNames | Other source name |
| SpType | Adopted spectral type |
| r_SpType | Spectral type referencebb1 = Luhman (2008), references therein; 2 = Frasca et al. (2015); 3 = this work; 4 = revised classification of spectrum from Luhman et al. (2006); 5 = revised classification of spectrum from Luhman (2007). |
| pmRA | IRAC relative proper motion in right ascension |
| e_pmRA | Error in pmRA |
| pmDec | IRAC relative proper motion in declination |
| e_pmDec | Error in pmDec |
| flag | Flag on IRAC relative proper motionscc nodet = non-detection; sat = saturated; out = outside of overlapping multi-epoch IRAC images; unres = too close to a brighter star to be detected; err = motion error above our adopted thresholds. |
| Aj | Extinction in |
| r_Aj | Extinction in referencedd 1 = Luhman (2007); 2 = Luhman & Muench (2008); 3 = Luhman et al. (2008); sp = derived from spectrum with spectral templates from Luhman et al. (2017); J-H = derived from the color assuming photospheric near-infrared colors (Luhman et al., 2010). |
| Jmag | magnitude |
| e_Jmag | Error in Jmag |
| Hmag | magnitude |
| e_Hmag | Error in Hmag |
| Ksmag | magnitude |
| e_Ksmag | Error in Ksmag |
| JHKref | JHK referenceee 2 = 2MASS Point Source Catalog; l = Luhman et al. (2005); i = ISPI data from this work; h = HAWK-I data from this work; c = Carpenter et al. (2002). |
| AOR | PID | P. I. | Epoch |
|---|---|---|---|
| 3651328 | 6 | G. Fazio | 2004.5 |
| 3955968 | 36 | G. Fazio | 2004.7 |
| 3960320 | 37 | G. Fazio | 2004.5 |
| 5105920 | 139 | N. Evans | 2004.5 |
| 5662720 | 173 | N. Evans | 2004.3 |
| 5662976 | 173 | N. Evans | 2004.5 |
| 6526208 | 36 | G. Fazio | 2004.1 |
| 12620032 | 36 | G. Fazio | 2005.6 |
| 12620544 | 36 | G. Fazio | 2005.6 |
| 18366720 | 30540 | J. Houck | 2006.5 |
| 18366976 | 30540 | J. Houck | 2006.5 |
| 18367232 | 30540 | J. Houck | 2006.5 |
| 18367744 | 30540 | J. Houck | 2006.5 |
| 18368000 | 30540 | J. Houck | 2006.5 |
| 18368256 | 30540 | J. Houck | 2006.5 |
| 18368512 | 30540 | J. Houck | 2006.5 |
| 18368768 | 30540 | J. Houck | 2006.5 |
| 18369024 | 30540 | J. Houck | 2006.5 |
| 18369280 | 30540 | J. Houck | 2006.5 |
| 18369536 | 30540 | J. Houck | 2006.5 |
| 18369792 | 30540 | J. Houck | 2006.5 |
| 18370048 | 30540 | J. Houck | 2006.5 |
| 18370304 | 30540 | J. Houck | 2006.5 |
| 18374400 | 30540 | J. Houck | 2006.5 |
| 19986432 | 30574 | L. Allen | 2007.4 |
| 19992832 | 30574 | L. Allen | 2007.4 |
| 20006400 | 30574 | L. Allen | 2007.4 |
| 20012800 | 30574 | L. Allen | 2007.4 |
| 20014592 | 30574 | L. Allen | 2007.4 |
| 20015104 | 30574 | L. Allen | 2007.4 |
| 47089152 | 90071 | A. Kraus | 2013.6 |
| 47089664 | 90071 | A. Kraus | 2013.6 |
| 47090176 | 90071 | A. Kraus | 2013.6 |
| 47090688 | 90071 | A. Kraus | 2013.6 |
| 47091200 | 90071 | A. Kraus | 2013.6 |
| 47091712 | 90071 | A. Kraus | 2013.6 |
| 47092224 | 90071 | A. Kraus | 2013.6 |
| 47092736 | 90071 | A. Kraus | 2013.6 |
| 47093248 | 90071 | A. Kraus | 2013.6 |
| Source NameaaCoordinate-based identifications from the 2MASS Point Source Catalog when available. Otherwise, identifications are based on the coordinates measured in this work. | Spectral | Spectrograph |
|---|---|---|
| Type | ||
| Cha J110641067745040 | M9–L2 | FLAMINGOS-2 |
| Cha J111041837633064 | M9–L3 | FLAMINGOS-2 |
| Cha J111050047721535 | M9–L2 | FLAMINGOS-2 |
| Cha J111057727714570 | M9.5 | FLAMINGOS-2 |
| Cha J111106757636030 | M9–L2 | FLAMINGOS-2 |
| 2MASS J111247717737547 | M8 | FLAMINGOS-2 |
| Source Name | [3.6] | [4.5] | [5.8] | [8.0] | [24] | Excess? | ||||
|---|---|---|---|---|---|---|---|---|---|---|
| (mag) | (mag) | (mag) | (mag) | (mag) | (mag) | (mag) | (mag) | (mag) | ||
| 2MASS J105631467618334 | aaDetection is false or unreliable based on visual inspection. | out | out | out | out | out | N | |||
| 2MASS J105753757724495 | aaDetection is false or unreliable based on visual inspection. | out | out | N | ||||||
| Cha J110641067745040 | 12.4 | 9.4 | N | |||||||
| 2MASS J110909157553477 | out | out | out | out | out | Y | ||||
| Cha J111001597738052bbPhotometry for Cha J111001597738052 is not reported in the AllWISE Source Catalog, so we list the data from the WISE All-Sky Source catalog. | 13.2 | aaDetection is false or unreliable based on visual inspection. | N | |||||||
| Cha J111041837633064 | 12.7 | 8.9 | Y? | |||||||
| Cha J111050047721535 | 12.8 | 9.4 | Y? | |||||||
| Cha J111057727714570 | ccBlended with another star. | ccBlended with another star. | 12.5 | 9.3 | N | |||||
| Cha J111106757636030 | Y? | |||||||||
| 2MASS J111247717737547 | ddThe AllWISE Source Catalog reports a detection but it appears to be offset from the detections in and . | 9.5 | out | out | out | out | N | |||
| 2MASS J111304507534369 | out | out | out | out | out | Y | ||||
| 2MASS J112130797633351 | 9.1 | out | out | out | out | out | N |
Peer Reviews
No public reviews on file for this paper yet. If you reviewed it on a platform where reviews are public (OpenReview, ICLR, NeurIPS, ICML), you can paste yours below so the community can read it here.
Videos
No videos yet. Explain this paper in a talk, walkthrough, or lecture? Add one.
A survey for planetary-mass brown dwarfs in the Chamaeleon I star-forming region11affiliation:
Based on observations made with the Spitzer Space Telescope, the NASA/ESA Hubble Space Telescope, Gemini Observatory, the ESO Telescopes at Paranal Observatory, Magellan Observatory, the Cerro Tololo Inter-American Observatory, and the ESA Gaia mission.
T. L. Esplin22affiliation: Department of Astronomy and Astrophysics, The Pennsylvania State University, University Park, PA 16802, USA; [email protected] , K. L. Luhman22affiliation: Department of Astronomy and Astrophysics, The Pennsylvania State University, University Park, PA 16802, USA; [email protected] 33affiliation: Center for Exoplanets and Habitable Worlds, The Pennsylvania State University, University Park, PA 16802, USA , J. K. Faherty44affiliation: American Museum of Natural History, New York, NY 10024, USA , E. E. Mamajek55affiliation: Jet Propulsion Laboratory, California Institute of Technology, M/S 321-100, 4800 Oak Grove Drive, Pasadena, CA 91109, USA 66affiliation: Department of Physics and Astronomy, University of Rochester, Rochester, NY 14627-0171, USA , and J. J. Bochanski77affiliation: Rider University, 2083 Lawrenceville Rd., Lawrenceville, NJ 08648, USA
Abstract
We have performed a search for planetary-mass brown dwarfs in the Chamaeleon I star-forming region using proper motions and photometry measured from optical and infrared images from the Spitzer Space Telescope, the Hubble Space Telescope, and ground-based facilities. Through near-infrared spectroscopy at Gemini Observatory, we have confirmed six of the candidates as new late-type members of Chamaeleon I (M8). One of these objects, Cha J111106757636030, has the faintest extinction-corrected among known members, which corresponds to a mass of 3–6 MJup according to evolutionary models. That object and two other new members have redder mid-IR colors than young photospheres at M9.5, which may indicate the presence of disks. However, since those objects may be later than M9.5 and the mid-IR colors of young photospheres are ill-defined at those types, we cannot determine conclusively whether color excesses from disks are present. If Cha J111106757636030 does have a disk, it would be a contender for the least-massive known brown dwarf with a disk. Since the new brown dwarfs that we have found extend below our completeness limit of 6–10 MJup, deeper observations are needed to measure the minimum mass of the initial mass function in Chamaeleon I.
Subject headings:
planetary systems: protoplanetary disks — stars: formation — stars: low-mass, brown dwarfs — stars: luminosity function, mass function – stars: pre-main sequence
1. Introduction
The distribution of mass in a population of young stars and brown dwarfs (i.e., the initial mass function; IMF) is determined by the process of star formation. As a result, measurements of the IMF can be used to test star formation theories. For example, these theories predict minimum masses of the IMF that span a wide range of values (1–100 , Low & Lynden-Bell, 1976; Larson, 1992; Whitworth et al., 2007, references therein). Constraints on the IMF’s minimum mass have been provided by surveys for brown dwarfs in the solar neighborhood (Kirkpatrick et al., 2012), young moving groups (Gagné et al., 2015), open clusters (Moraux et al., 2004), and star-forming regions (Luhman et al., 2009; Peña Ramírez et al., 2012; Lodieu, 2013; Alves de Oliveira et al., 2013). The most thorough and sensitive surveys have had completeness limits of 10–20 and have detected objects with masses as low as 5 , which indicates that the minimum mass of the IMF has not been detected.
To significantly improve constraints on the IMF’s minimum mass, we need to be able to detect brown dwarfs well below 10 in relatively large stellar populations. This is most easily done in the nearest and richest star-forming regions. For instance, according to theoretical evolutionary models (Burrows et al., 1997, 2003), a 2 brown dwarf at an age of 1 Gyr can be detected within only 3 pc with the most sensitive wide-field survey for older (colder) brown dwarfs (Wright et al., 2010), whereas the same object at 1 Myr can be detected with ground based telescopes out to the distances of nearby star-forming regions (150–300 pc). The Chamaeleon I (Cha I) star-forming region is one of the most promising sites for measuring the minimum mass of the IMF because it is rich (N members), moderately compact (D ), and nearby (160–170 pc, Luhman, 2008). The current census of the cluster contains 42 members with spectral types later than M6 (0.1 M⊙, Neuhäuser & Comerón, 1999; Comerón et al., 1999, 2000, 2004; Luhman, 2004, 2007; Luhman et al., 2004, 2006, 2008; Luhman & Muench, 2008; Schmidt et al., 2008), where the faintest of which should have a mass of 4–10 (Luhman et al., 2008). Muz̆ić et al. (2011, 2015) also obtained spectra of a large number of candidate brown dwarfs, but none of them were found to be new members.
To continue searching for the minimum mass of the IMF in Cha I, we have conducted a deep survey for brown dwarfs in a wider region than considered in previous studies. In our presentation of this survey, we begin by compiling all known members of Cha I (Section 2). Next, we measure proper motions of stars projected against Cha I using multiple epochs of images from the Hubble Space Telescope (HST) and the Spitzer Space Telescope (Werner et al., 2004, Section 3) and we construct color-magnitude diagrams from optical and near-infrared (IR) images of the cluster (Section 4). We identify candidate members based on those proper motions and color-magnitude diagrams (Section 5) and we describe near-IR spectroscopy of the best candidates, which is used to confirm their youth and cool nature (Section 6). We conclude by deriving an updated IMF for the cluster (Section 7) and determining if the new members harbor circumstellar disks based on mid-IR photometry from Spitzer (Section 8).
2. Known Members of Chamaeleon I
We have compiled a catalog of the previously known members of Cha I. We began with the census from Luhman (2008), which contained 237 members. Objects appeared as individual entries if they were either resolved in *Spitzer *images or classified spectroscopically, which is the approach that we adopt here. Because its proper motion from both the HST and *Spitzer * datasets is consistent with membership (see Section 3.1 & 3.2), we adopt Cha J111001597738052 as a previously known member, which was presented in Luhman (2007) as a possible field M9 – L1 dwarf. We also include in our census the M9 companion to CT Cha (Schmidt et al., 2008) and five new M4 members from Frasca et al. (2015) and Sacco et al. (2017), which consists of 2MASS J1057537577244951112MASS J105753757724495 was independently confirmed in this study, but is treated as a previously known member., 2MASS J105631467618334, 2MASS J112130797633351, 2MASS J111304507534369, and 2MASS J110909157553477. Sacco et al. (2017) suggested that 2MASS J105631467618334 is a probable member of the Cha association based on its proper motion in the USNO CCD Astrograph Catalog 4 (UCAC4; Zacharias et al., 2013). However, we find that its proper motion based on the first data release of the ESA Gaia mission (Gaia Collaboration et al., 2016a, b) and the Two Micron Point Source Catalog (2MASS; Skrutskie et al., 2006) is consistent with membership. We list the 244 previously known members and the six new members from this study in Table 1.
3. Proper Motions
3.1. Hubble/ACS
Luhman et al. (2005) obtained images of a area of the southern sub-cluster in Cha I (see Figure 1) with the Wide Field Camera (WFC) aperture of the Advanced Camera for Surveys (ACS) on board HST. The observations were performed on 2004 August 21 and 2005 February 16 with the F775W and F850LP filters. To measure proper motions for sources detected in those data, we repeated those observations in the F850LP filter on 2009 August 20 and 2011 February 13 through program 11695.
The ACS images were processed and calibrated by the pipeline at the Space Telescope Science Institute. We identified all sources that are not saturated and measured their pixel coordinates using the IRAF routine starfind. We aligned the world coordinate systems of the images at the two epochs using sources detected in both sets of data. We then computed proper motions for sources appearing in both epochs, which are shown in Figure 2. Nine previously known members are detected by ACS and are not saturated. Their motions are well-clustered around a mean value of mas/yr. The known members are well-separated from the vast majority of field stars and galaxies, which appear near the origin of Figure 2. We classify sources within a radius of 3.75 mas/yr of the mean motion of the known members as candidate members.
3.2. Spitzer/IRAC
Portions of Cha I have been imaged at several epochs with the Infrared Array Camera (IRAC; Fazio et al., 2004) on Spitzer. Those observations occurred during both the cryogenic and post-cryogenic phases of the mission. The cryogenic phase began at launch in August 2003 and continued until May 2009 when the liquid helium was depleted. During that time, IRAC operated with four 256 256 arrays that collected images in broad-band filters at 3.6, 4.5, 5.8, and 8.0 m, which are denoted as [3.6], [4.5], [5.8], and [8.0]. For each array, the plate scale was pixel*-1* and the field of view was . Point sources within the images have a FWHM of – for [3.6]–[8.0]. After the depletion of the cryogen, IRAC continued to operate with the [3.6] and [4.5] bands in the post-cryogenic phase. Esplin & Luhman (2016) demonstrated that astrometric precisions of \sim$$0\farcs 02 and are possible for sources in [3.6] and [4.5] images with high and low signal-to-noise ratios (S/N), respectively (see also Dupuy & Kraus, 2013; Lowrance et al., 2014), by measuring source positions with the point-response-function fitting routine in the Astronomical Point source EXtractor (APEX; Makovoz & Marleau, 2005) and applying a new distortion correction. We have applied these procedures to the multi-epoch IRAC observations of Cha I.
We retrieved from the Spitzer archive all [3.6] and [4.5] images for areas in which at least two epochs of data were available that spanned several years. Due to their lower sensitivity and resolution, we excluded the [5.8] and [8.0] data. Astronomical Observing Request IDs (AORs), Program IDs (PIDs), and principle investigators for the data are listed in Table 2. In Figure 3, we show the spatial coverage of the six epochs with large mosaics. Epochs 2004.3 and 2005.6 are not plotted because they cover only small fields.
Luhman et al. (2008) and Luhman & Muench (2008) described the observations of the epochs from the start of the mission through 2007.4. The observations from epoch 2013.6 covered a 2 deg2 field constructed from nine mosaics. Each individual mosaic consists of a grid of 18 18 frames with a step size of between frames.
For each IRAC frame, we measured positions, fluxes (), and S/N’s for all detected sources with APEX using the default parameters except for a 55 pixel fitting region, as done in Esplin & Luhman (2016). We then corrected those positions for distortion with the corrections from the R package “IRACpm” (R Core Team, 2013; Esplin & Luhman, 2016). To compensate for the time-dependence of the [3.6] and [4.5] plate scale, we interpolated between the measured values presented in Esplin & Luhman (2016). Because their astrometry was unreliable, sources with and 0.8216 Jy/s were rejected as saturated for [3.6] and [4.5], respectively.
Because each source appeared at several different positions in an array in the data from 2013.6, we used self-calibration to estimate relative offsets and orientations between frames for that epoch. We derived the initial coordinates and orientations for each frame using astrometry from the 2MASS Point Source Catalog. We then refined these values by iterating the following four steps: (1) For each source with a median S/N from among the various frames, we calculated the mean position using the current measured values for the frame coordinates and orientations. (We refer to the sources’s mean position as the “true” position, and the individual detections as the source’s “measured” positions.) (2) With that new astrometric catalog, we solved for new frame coordinates and orientations using a least-squares algorithm. (3) We calculated the root mean square (RMS) of the residual distances between all measured and true positions. (4) Detections with residual distances 6 RMS were removed as outliers. We found that three iterations of these steps were sufficient for the measured frame coordinates and orientations to converge on a stable solution. Those methods were not applied to the data earlier than than 2013.6 because the detections of a given source were confined to a small area of an array, making the data less suited for self-calibration. For these epochs, we derived the frame coordinates and orientations by matching sources with median S/N to a subset of the final astrometric catalog from epoch 2013.6. This subset consisted of sources with errors in position 01 and flux measurements 200 Jy in either band. We then iterated the second through fourth steps of the self-calibration method four times with a stricter outlier rejection (S/N RMS).
For each epoch, we measured astrometry for all sources with median S/N 3 by calculating the mean and median position for sources with 3 and 3 total detections, respectively. We adopted the median absolute deviation (MAD) of the measured positions as an estimate for positional error. For sources with 3 total detections, we also calculated median positions and errors for the [3.6] and [4.5] bands individually. If MAD MADtotal in either right ascension or declination, then we adopted that band’s position and error in the final catalog. Sources with 3 total detections were omitted.
To measure relative proper motions () with the catalogs of all of the epochs, we fit each source’s astrometry as a function of time with a line. In Figure 4, we plot the errors for as a function of [3.6] S/N for all sources. We estimated 25%, 50%, and 75% quantiles for these data by applying local linear quantile regression with the function lprq in the R package quantreg (Koenker, 2016). Below 100 S/N, the median error increases smoothly with decreasing S/N and above this limit it is flat at 3 mas/yr. However, there is a significant increase in the number of sources with high error for the highest S/N. These star are below the saturation limit and do not have anomalous point spread functions (PSFs). It appears that APEX, for an unknown reason, produces erroneous positions for some bright stars. To minimize the number of contaminants while maximizing the number of known Cha I members in our proper motion catalog, we only use proper motions with errors in 10 mas/yr. We also omit proper motions for sources with S/N for [3.6] so that at least 25% of sources above a given S/N have motion errors below 10 mas/yr. For these same reasons, we also omitted proper motion data with errors in 8 mas/yr and S/N for [4.5].
We inspected the IRAC images of the known members of Cha I that exhibited discrepant motions compared to the bulk of the population, which included 2MASS J110646587722325, CHXR 15, CHXR 78C, ISO 282, ISO 86, ISO 143, and 2MASS J110945257740332. We found that the PSF of 2MASS J110646587722325 was extended so we do not report a proper motion for it. No anomalies were found in the PSFs of the other six members. For all of those objects except ISO 86, proper motions are available from the PPMXL catalog (Roeser et al., 2010), all of which are consistent with membership. In addition, each of the six stars shows clear evidence of youth. Therefore, we retain them as members. Given that these objects are among the brighter members, their discrepant motions may be due to same anomaly mentioned earlier that produces large errors for some stars at high S/N.
Among the 244 previously known members, 100 have motions below our adopted limits on proper motion error and S/N, 55 are outside of the region of overlapping IRAC epochs, 38 have errors above our limits, 43 are saturated, seven are unresolved from bright companions, and one (Cha–MMS1) was not detected in IRAC. We include the proper motions for those 100 members with good measurements in Table 1. Those data have a median value of mas/yr. The motions for these members and other sources that satisfy our motion error and S/N criteria are plotted in Figure 5. The majority of the known members are clustered within a radius of 7 mas/yr of the median value. Therefore, among the stars whose membership has not been previously determined, we classify those within that radius as candidate members.
4. Photometry
4.1. Previous Data
Because the field star contamination is high among the sources with IRAC proper motions consistent with membership (see Figure 5), we used color-magnitude diagrams constructed from previous and new photometry to identify the most promising candidates. These data are also used to identify candidates among sources that lack proper motion measurements with IRAC. We began by compiling photometry from previous surveys for low-mass members of Cha I and publicly available catalogs, which consist of F775W and F850LP from ACS/HST (see Section 3.1; Luhman et al., 2005); F791W and F850LP from the Wide Field Planetary Camera 2 (WFPC2) on HST (Todorov et al., 2014); from the Inamori Magellan Areal Camera and Spectrograph (IMACS) on the Magellan I telescope at Las Campanas Observatory (Luhman, 2007); , , , and from the Infrared Side Port Imager (ISPI) at the Cerro Tololo Inter-American Observatory (CTIO; Luhman et al., 2005); , , and from the 2MASS point source catalog; and from the Third Release of the Deep Near-Infrared Survey of the Southern Sky (DENIS; Epchtein et al. 1999). In Figure 1, we plot the spatial coverage of the ACS, IMACS, and ISPI images.
4.2. ISPI
We obtained images of additional fields of Cha I with ISPI on the nights of 2008 January 20-23. This instrument provided a plate scale of 0.3 pixel*-1* and a field of view (FOV) of 1025 1025. These observations consisted of 16 60 s exposures in each of three filters (, , ) and in each of four adjacent fields. The total area observed corresponds to the middle ISPI field in Figure 1. The data were reduced in the same manner as the previous ISPI observations (Luhman et al., 2005; Luhman, 2007). The typical FWHM for point sources in these images was 095. These new observations have similar completeness limits as the previous ISPI data, which were , , and .
4.3. DECam
We performed optical imaging of Cha I with the Dark Energy Camera (DECam) at the 4 m Blanco telescope at CTIO. The instrument contains 62 CCDs with dimensions of 2048 4096 pixels and plate scales of 027 pixel*-1*. The FOV of the entire mosaic has a diameter of 2°. In an initial set of shallow observations on 2013 May 30, we obtained three dithered images in each , , and with individual exposures times of 200, 30, and 30 s, respectively. We collected deeper data on 2015 March 5 in which the numbers of images and exposure times were 49 150 s (), 79 100 s (), and 46 200 s (). To extend the dynamic range to brighter magnitudes, we also obtained 7 0.7 s images for each filter during that night. The spatial coverage the DECam images is shown in Figure 1.
The images were reduced by the DECam pipeline. The typical FWHM for point sources in these images was 08. We identified all sources in the reduced images and measured their pixel coordinates with starfind. We measured aperture photometry for those sources with the task phot in IRAF using a radius of 3.5 pixels and inner and outer radii of 3.5 and 6.5, respectively, for the background annulus. The photometry was calibrated with our previous and data in Cha I from IMACS and ISPI, respectively. We calibrated the -band data such that a linear fit to the sequence of the bluest sources (i.e., ) in the color-color diagram vs. intersects the origin. We estimated the completeness limits of these data based on the magnitudes at which the logarithm of the number of sources as a function of magnitudes departs from a linear slope and begins to turn over, which were 22.0, 20.8, and 19.3 for , , and , respectively.
4.4. HAWK-I
Two publicly available -band imaging programs of Cha I have been performed by the High Acuity Wide-field -band Imager (HAWK-I) on the Unit Telescope 4 of the Very Large Telescope (VLT). This camera contains four 2048 2048 HAWAII-2RG arrays which have a plate scale of 0106 pixel*-1* and a FOV of 75 75 (Kissler-Patig et al., 2008). On the nights of 2008 January 24, 27–29, and 31, four fields were imaged through program 60.A-9284(L), which are indicated as solid red lines in Figure 1. In each field, 25 dithered images were taken each consisting of 15 co-added 2.0 s exposures. Four additional fields were imaged on the nights of 2010 May 12 and 2010 July 5–6 through program 385.C-0384(A). Those fields are marked by red dashed lines in Figure 1. For each field, 200 images were taken with exposure times of 3 s.
We reduced the individual exposures from HAWK-I by subtracting a dark frame and dividing by a flat field image using tasks within IRAF. The resulting images were then registered and combined into mosaics. For most of these images, the typical FWHM for point sources was 08 except for the nights of 2010 July 5–6, when it was 15. For the latter data, we measured aperture photometry with a radius of 12 pixels and inner and outer radii of 12 and 16, respectively, for the background annulus. We used values of 6, 6, and 10 for those parameters for the remaining data. We measured the WCS for each mosaic using astrometry from 2MASS and our previous images. The data were flux calibrated with photometry from 2MASS. The completeness limits of these data range from = 17.5 to 19.3, the former corresponding to the data with poor seeing.
5. Candidate Selection
To identify candidate members of Cha I with the proper motions and photometry described in the previous two sections, we began by merging the catalogs of sources from IRAC, ISPI, ACS, 2MASS, DENIS, DECam, HAWK-I, and WFCP2. For each star, when data were available from multiple camera for a given filter, we adopted the measurement with the smallest error. We treated the / filters from DENIS, IMACS, and DECam as a single filter since those data agreed well with each other. Only data with errors mag were used in our analysis.
We have used color-magnitude diagrams (CMDs) constructed from our merged catalog to select stars that have photometry consistent with membership in Cha I. In these diagrams, we use as the magnitude because extinction is low in this band and our data offer good coverage and depth. We employ , , and because they are sensitive to spectral type. We can minimize the contamination from reddened background stars by estimating and correcting for the extinctions of individual stars in these diagrams (Luhman et al., 2003). We have estimated the extinction for each star by dereddening its positions in versus to the typical locus of young stars at the distance of Cha I, which can be approximated by for and for . When doing this, we adopt the extinction law from Cardelli et al. (1989). The resulting extinction-corrected CMDs are shown in Figure 6. To include stars that lack or , we also plot two CMDs that were constructed from optical data alone, versus and versus . In each diagram we marked a boundary that follows the lower envelope of the sequence of members. A given source is classified as a photometric candidate if it is above a boundary in at least one diagram and is not below a boundary in any diagram. We also applied the CMDs from Luhman (2007) and Todorov et al. (2014) to our catalog in the same way.
We selected for spectroscopy objects that were candidates based on either proper motions (Section 3) or CMDs and were not rejected by either method. We gave higher priority to candidates with faint photometry that was indicative of lower masses and that satisfied both our proper motion criteria and multiple CMDs. We also focused on candidates in the ISPI images because we wished to measure an IMF with a well-defined completeness in those fields (see Section 7.2). In addition, we observed one brighter candidate, 2MASS J105753757724495, that exhibits X-ray emission indicative of membership (Ingleby et al., 2011). The resulting sample contained 11 candidates members of Cha I.
6. Spectroscopy of Candidate members
6.1. Observations
We performed optical spectroscopy on two targets, 2MASS J105753757724495 and 2MASS J110932777638376, with the Goodman High Throughput Spectrograph at the Southern Astrophysical Research Telescope on 2014 May 7 and 2014 June 16, respectively. The instrument was operated with the 400 l mm*-1* grating in second order, the GG445 filter, and the 084 slit, which produced a wavelength coverage of 5400–9400 Å with resolution of R=1100. Spectra of six candidates were obtained with FLAMINGOS-2 on the Gemini South Telescope (Eikenberry et al., 2004) on January 23 and February 2, 3 and 5 in 2015. For the brightest target, 2MASS J111247717737547, the instrument was configured with the grism and filter and the 108 slit (0.70–2.04 m, R = 300). For the other five FLAMINGOS-2 targets, Cha J111106757636030, Cha J110641067745040, Cha J111050047721535, Cha J111057727714570, and Cha J111041837633064, were observed with the grism and filter and the 072 slit (1.10–2.65 m, R = 450). We observed 2MASS J105431417710130, 2MASS J105328157710268, and 2MASS J110656777725478 with ARCoIRIS on the 4 m Blanco telescope at CTIO on the nights of 2016 June 17 and 18 (0.8–2.47 m, R=3500).
For the Goodman and FLAMINGOS-2 spectra, we used routines in IRAF to apply the flat field correction, extraction of spectra, and wavelength calibration. The FLAMINGOS-2 spectra were corrected for telluric absorption using a spectrum of an A-type star that was observed at a similar airmass. Because the resulting FLAMINGOS-2 spectra had low S/N, we binned the spectra by a factor of 5 and 15 for data obtained with the and grisms, respectively. The ARCoIRIS data was reduced with a version of the Spextool package (Cushing et al., 2004) that was modified for use with ARCoIRIS. The data were corrected for telluric absorption in the manner described by Vacca et al. (2003). In Figure 7, we show the dereddened spectra of the candidates that we classify as new members in the next section.
6.2. Spectral Classification
We have used our spectra to measure the spectral types of our candidates and to determine whether they show evidence of youth that would indicate membership in Cha I. Based on the magnitude of the candidates, they should have spectral types M0 if they are members. At those types, we distinguished between young objects and field dwarfs with gravity-sensitive features such as Na I, K I, and the shape of the -band continuum (Martìn et al., 1996; Luhman et al., 1997; Lucas et al., 2001). Among the candidates observed with Goodman and ARCoIRIS, only 2MASS J105753757724495 showed evidence of youth. The other four candidates were background early-type stars or giants. All six objects observed with FLAMINGOS-2 were found to be young, late-type members of Cha I. The optical spectrum of 2MASS J105753757724495 was classified via comparison to averages of dwarf and giant standards (Luhman et al., 1997, 1998; Luhman, 1999). Most optical spectral types of late-type members of nearby star-forming regions have been measured with that method. We arrived at a spectral type of M4 for 2MASS J105753757724495, which agrees with the previous classification from Frasca et al. (2015). For the new members with near-IR spectra, we measured spectral types using the standard spectra for young M and L dwarfs from Luhman et al. (2017). The M-type standards were constructed from near-IR data for members of star-forming regions and young associations (10 Myr) that have been classified at optical wavelengths. Thus, the near-IR standards from Luhman et al. (2017) produce spectral types that are on the same system that has been applied to most known late-type members of star-forming regions. The classifications for our new members are presented in Table 3. The uncertainties are 0.5 subclass unless indicated otherwise. Because of degeneracies between spectral type and reddening at late M and L types for young objects (Luhman et al., 2017), some of the spectral types have large uncertainties.
In the compilation of the known members of Cha I in Table 1, we list adopted spectral types based on previous classifications. For the previously known members earlier than M9, we have adopted the same spectral types as Luhman (2008). We have adopted our classifications of the new members, using L0 for the ones with large errors (e.g., M9–L2). We have reclassified the spectra of members with types later than M9 (Luhman et al., 2006; Luhman, 2007) using the standards from Luhman et al. (2017), arriving at the following revised classifications: 2MASS J110806097739406 (M9.50.5), Cha J110726477742408 (M9–L2), Cha J110830407731387 (M9.50.5), Cha J111001597738052 (M9–L3), and CHXR 73B (M9.5–L4). As with the new members, we adopt L0 for those classifications that have large errors. One of those sources, Cha J110830407731387, was classified by Muz̆ić et al. (2015) as L3 based on a low S/N 1.5–2.5 m spectrum. However, the near-IR spectrum from Luhman (2007) is bluer than expected for a young early L dwarf, as shown in Figure 8.
7. Initial Mass Function
7.1. Completeness
The previous census of members of Cha I from Luhman (2007) had well-defined completeness limits within two fields, which consisted of a strip along the center of the molecular cloud and the area imaged by ACS field. The limits were for and for in those fields, respectively, which correspond to masses of 30 and 10 according to evolutionary models. Luhman (2007) constructed IMFs from the known members within those fields and extinction limits, which contained 85 and 34 members. To improve the constraints on the minimum mass of the IMF in Cha I, we need to obtain a census of members that is complete to faint magnitudes for a field that encompasses a large number of members. Given these constraints, we have searched for new members primarily in the ISPI fields (0.3 deg2; see Figure 1), as mentioned in Section 5.
We can characterize the completeness of our new census of members in Cha I for the ISPI fields using a color-magnitude diagram. In Figure 9, we show vs. for the known members in the ISPI images. We also include additional sources that are not rejected as field stars based on color-magnitude diagrams or proper motions (Section 5). For extinctions of , there are no remaining sources with undetermined membership in these fields down to an extinction-corrected magnitude of =15.7. Using a -band bolometric correction for young late-M/early-L dwarfs (Filippazzo et al., 2015), this limit corresponds to a mass of 6–10 MJup for ages of 1–3 Myr according to evolutionary models (Burrows et al., 1997; Chabrier et al., 2000; Baraffe et al., 2015).
The new member Cha J110641067745040 is within the boundaries of the ACS field from Luhman (2007) and is within the completeness limits in and that were reported for that field. However, it fell in the gap between the ACS detectors, which is why it was not found in that survey. Muz̆ić et al. (2015) concluded that their survey for members Cha I was complete down to a spectral type of L3. However, we have found two new members within their survey field, both of which are earlier than that limit.
7.2. Distributions of Spectral Type and for an Extinction-limited Sample
We have attempted to construct a large sample of members of Cha I that extends to low masses and is representative and unbiased in terms of mass by considering the known members within the ISPI fields that have . For most of the members, we have adopted the extinction estimates from Luhman (2007), Luhman et al. (2008), and Luhman & Muench (2008). Extinctions for members identified since those studies are measured from our near-IR spectra or near-IR colors assuming the intrinsic photospheric values for pre-main sequence stars (Luhman et al., 2010). Our adopted extinctions are included in Table 1. The ISPI fields contain 102 members with , which corresponds to 42% of the known members. That sample includes five of the six new members that we have found. The remaining new member is outside of the area imaged by ISPI.
To avoid the uncertainties of mass estimates of young stars that arise from the adopted bolometric corrections, temperature scales, and evolutionary models, we characterize the IMF for the extinction-limited sample in the ISPI fields using observational proxies for stellar mass, namely and spectral type. In Figure 10, we show the distributions of spectral types and extinction-corrected for that sample. Four stars in the sample, 2MASS J110720227738111, T33B, T39B, and ESO H 281, are absent from the distribution because their photometry is contaminated by an unresolved visual companion. 2MASS J110954937635101 and Cha J110819387731522 are also excluded from the distribution because they are probably seen in scattered light (Luhman, 2007; Luhman et al., 2008).
The distributions of spectral types and in our extinction-limited sample in the ISPI fields are similar to those in the Cha I fields considered by Luhman (2007) and in other star-forming clusters (Luhman et al., 2016), exhibiting peaks near M5 and , respectively. Below the peak in , the distribution in our new sample is roughly flat down to the completeness limit of and extends to (Cha J111106757636030), which correspond to masses of 6–10 and 3–6 MJup, respectively, based on evolutionary models for ages of 1–3 Myr (Burrows et al., 1997; Chabrier et al., 2000; Baraffe et al., 2015). Thus, the minimum mass of the IMF has not been detected in these data, and the constraint on that mass is 3–6 MJup.
8. New Members with Circumstellar Disks
Luhman & Muench (2008) and Luhman et al. (2008) measured photometry from mid-IR images from Spitzer for the compilation of known members from Luhman (2008) and used those data to identify the presence of circumstellar disks. We have performed the same exercise for the members found since Luhman (2008) using data from both Spitzer and the Wide-field Infrared Survey Explorer (WISE; Wright et al., 2010). Those measurements are compiled in Table 4. Because CT Cha B is not resolved by Spitzer or WISE, we do not include it in the table. We measured the Spitzer data from IRAC images in its four bands from 3.6–8.0 m and from 24 m images (denoted as [24]) with the Multiband Imaging Photometer for Spitzer (Rieke et al., 2004) in the same manner as Luhman et al. (2008) and Luhman & Muench (2008). The WISE photometry was taken from the AllWISE Source Catalog. Those data were measured in bands at 3.5, 4.5, 12, and 22 m, which are denoted as , , , and , respectively.
According to the parameter cc_flag from the AllWISE Source Catalog, several of the WISE detections in Table 4 may be contaminated by diffraction spikes or scattered light halos from nearby bright sources. However, none of those detections (which are in and ) show any such contamination based on visual inspection of the images. All of the WISE sources are consistent with a point source based on the ext_flg parameter with the exception of Cha J111057727714570, which is blended with another object. Resolved IRAC photometry is available for it. Although the and bands are roughly similar to [3.6] and [4.5] from IRAC, respectively, photometry in those bands can differ noticeably for cool dwarfs (Filippazzo et al., 2015), as illustrated by the fact that the magnitudes for the late-M/early-L objects in Table 4 are systematically larger than the [3.6] data.
To determine whether the members of Cha I in Table 4 have color excesses from disks in the Spitzer and WISE photometry, we begin by plotting diagrams of , , and versus spectral type in Figure 11 for a range of spectral types centered on M4, which is the type of all stars in Table 4 with such data. In the diagram with , we have included a line that represents the typical colors of young stellar photospheres from Luhman et al. (2010). Because the and [24] bands are similar, we show that same line with the data in . For , we mark the photospheric sequence with a fit to the colors of diskless members of Taurus (Luhman et al., 2010; Esplin et al., 2014). Each of the diagrams with and contains a well-defined blue sequence that closely follows the lines representing typical photospheric colors. Most M-type members that lack disks were not detected in , so a photospheric sequence among Cha I members is absent from the diagram of . 2MASS J111304507534369 and 2MASS J110909157553477 exhibit significant color excesses in and relative to photospheric values. The remaining three M4 members from Table 4 do not have excesses.
To identify excess emission among the coolest new members of Cha I, we plot and as a function of spectral type in Figure 12. We have included lines that represent the typical colors of young photospheres for spectral types of M9.5 (Luhman et al., 2010), which coincide with the sequence of bluest sources in Cha I. Among the six members from Table 4 that have IRAC data, Cha J111106757636030 (M9–L2), Cha J111050047721535 (M9–L2), and Cha J111041837633064 (M9–L3) have values of that are significantly redder than the photospheric sequence at M9.5. The same is true for the first two objects in . Those red colors may indicate the presence of disks. However, those three objects could be as late as L2 or L3 given the uncertainties in our classifications, and the photospheric values of the IRAC colors are poorly defined at those types, so we cannot determine definitively whether they have color excesses from disks. In other words, it is possible that and for young photospheres become much redder at types later than M9.5, in which case the observed colors for Cha J111106757636030, Cha J111050047721535, and Cha J111041837633064 could be entirely photospheric. We note that these three objects are not detected in the WISE and Spitzer bands longward of 10 µm. For instance, the detection limit of the MIPS data is roughly , which corresponds to limits of –7 for those objects. Thus, the non-detections at longer wavelengths do not place useful constraints on the presence of disks.
For all of the objects that exhibit excess emission in Figures 11 and 12, the sizes of the excesses are similar to those of members of Cha I (Luhman et al., 2008; Luhman, 2008) and Taurus (Esplin et al., 2014) that have class II spectral energy distributions (star+disk, Lada & Wilking, 1984; Lada, 1987).
Through our analysis of the mid-IR photometry in Table 4, we have found that three of our new members may have excess emission that indicates the presence of disks. If excesses are present, they would provide additional evidence of the youth and membership of those objects. Two of these members, Cha J111050047721535 and Cha J111106757636030, would be the faintest known members in extinction-corrected that show evidence of disks (Luhman et al., 2008; Luhman & Muench, 2008). In addition, the latter could be the faintest known brown dwarf in nearby star-forming regions with a detection of a disk (Luhman & Mamajek, 2012; Esplin et al., 2014; Luhman et al., 2016). Thus, it may be the least-massive known brown dwarf with a circumstellar disk (3–6 MJup). However, additional data (e.g., photometry at longer wavelengths) are needed to determine conclusively whether these objects harbor disks.
9. Conclusion
We have conducted a survey for planetary-mass brown dwarfs in the Cha I star-forming region using proper motions and photometry measured from optical and near-IR imaging with HST, Spitzer, and ground-based telescopes. Through spectroscopy of the resulting candidate members, we have discovered six new late-type members, which include three of the five faintest known members in extinction-corrected . One of these objects, Cha J111106757636030, is the faintest known member, which has a mass of 3–6 MJup according to evolutionary models. Three of the new members have red mid-IR colors that may indicate the presence of disks, but these detections of disks are not definitive given the uncertainties in the spectral types of the objects and the uncertainties in the photospheric colors of young brown dwarfs later than L0. If its red color is due to a disk, Cha J111106757636030 would be a contender for the least-massive known brown dwarf with a disk. Given that we have found objects below the completeness limit for our survey (6–10 MJup), deeper imaging is required to measure the minimum mass of the IMF in Cha I.
We thank K. Allers for providing the modified version of Spextool for use with ARCoIRIS data. We acknowledge support from grants AST-1208239 and AST-1313029 from the National Science Foundation (NSF) and grant GO-11695 from the Space Telescope Science Institute. EEM acknowledges support from the NASA NExSS program. The Spitzer Space Telescope and the IPAC Infrared Science Archive (IRSA) are operated by JPL and Caltech under contract with NASA. The NASA/ESA Hubble Space Telescope is operated by the Space Telescope Science Institute and the Association of Universities for Research in Astronomy (AURA), Inc., under NASA contract NAS 5-26555. 2MASS is a joint project of the University of Massachusetts and the Infrared Processing and Analysis Center (IPAC) at Caltech, funded by NASA and the NSF. The Center for Exoplanets and Habitable Worlds is supported by the Pennsylvania State University, the Eberly College of Science, and the Pennsylvania Space Grant Consortium. We thank the CTIO staff for help with the DECam observing run, especially Claudio Aguilera, Alberto Alvarez, Kadur Flores, David James, Leonor Opazo, Javier Rojas, and Hernan Tirado. The data at CTIO were obtained through program 2015A-0175 for National Optical Astronomy Observatory (NOAO). CTIO and NOAO are operated by the AURA under a cooperative agreement with the NSF. The data at Gemini were obtained through program GS-2015A-Q-64. The Gemini Observatory is operated by AURA, under a cooperative agreement with the NSF on behalf of the Gemini partnership: the National Science Foundation (United States), the National Research Council (Canada), CONICYT (Chile), Ministerio de Ciencia, Tecnología e Innovación Productiva (Argentina), and Ministério da Ciência, Tecnologia e Inovação (Brazil). This project used data obtained with the Dark Energy Camera (DECam), which was constructed by the Dark Energy Survey (DES) collaboration. Funding for the DES Projects has been provided by the U.S. Department of Energy, the U.S. National Science Foundation, the Ministry of Science and Education of Spain, the Science and Technology Facilities Council of the United Kingdom, the Higher Education Funding Council for England, the National Center for Supercomputing Applications at the University of Illinois at Urbana-Champaign, the Kavli Institute of Cosmological Physics at the University of Chicago, the Center for Cosmology and Astro-Particle Physics at the Ohio State University, the Mitchell Institute for Fundamental Physics and Astronomy at Texas A&M University, Financiadora de Estudos e Projetos, Fundação Carlos Chagas Filho de Amparo à Pesquisa do Estado do Rio de Janeiro, Conselho Nacional de Desenvolvimento Científico e Tecnológico and the Ministério da Ciência, Tecnologia e Inovacão, the Deutsche Forschungsgemeinschaft, and the Collaborating Institutions in the Dark Energy Survey. The Collaborating Institutions are Argonne National Laboratory, the University of California at Santa Cruz, the University of Cambridge, Centro de Investigaciones Enérgeticas, Medioambientales y Tecnológicas-Madrid, the University of Chicago, University College London, the DES-Brazil Consortium, the University of Edinburgh, the Eidgenössische Technische Hochschule (ETH) Zürich, Fermi National Accelerator Laboratory, the University of Illinois at Urbana-Champaign, the Institut de Ciències de l’Espai (IEEC/CSIC), the Institut de Física d’Altes Energies, Lawrence Berkeley National Laboratory, the Ludwig-Maximilians Universität München and the associated Excellence Cluster Universe, the University of Michigan, the National Optical Astronomy Observatory, the University of Nottingham, the Ohio State University, the University of Pennsylvania, the University of Portsmouth, SLAC National Accelerator Laboratory, Stanford University, the University of Sussex, and Texas A&M University. This paper has been approved for Unlimited External Release (URS266045). *Facilities: * Blanco (DECam, ARCoIRIS), SOAR (Goodman), Gemini:South (Flamingos-2), HST (ACS, WFP2), Spitzer (IRAC), VLT (HAWK-I)
The reference list from the paper itself. Each links out to its DOI / PubMed record.
- 1Alves de Oliveira et al. (2013) Alves de Oliveira, C., Moraux, E., Bouvier, J., et al. 2013, A&A, 549, 123
- 2Baraffe et al. (2015) Baraffe, I., Hormeier, D., Allard, F., & Chabrier, G. 2015, A&A, 577, 42
- 3Burrows et al. (1997) Burrows, A., Marley, M., Hubbard, W. B., et al. 1997, Ap J, 491, 856
- 4Burrows et al. (2003) Burrows, A., Sudarsky, D., & Lunine, J. I. 2003, Ap J, 596, 587
- 5Cambrésy et al (1997) Cambrésy, L., Epchtein, N., Copet E., et al. 1997, A&A, 324, L 5
- 6Cardelli et al. (1989) Cardelli, J. A., Clayton, G. C., & Mathis, J. S. 1989, Ap J, 345, 245
- 7Carpenter et al. (2002) Carpenter, J. M., Hillenbrand, L. A., Skrutskie, M. F., & Meyer, M. R. 2002, AJ, 124, 1001
- 8Chabrier et al. (2000) Chabrier, G., Baraffe, I., Allard, F., & Hauschildt, P. 2000, Ap J, 542, 464